Article (PDF, 2.81 MB)
9
150 Advances in Science and Technology Research Journal Volume 10, No. 30, June 2016, pages 150–158 DOI: 10.12913/22998624/62515 Research Article SURFACE ROUGHNESS OF THIN-WALLED COMPONENTS MADE OF ALUMINIUM ALLOY EN AW-2024 FOLLOWING DIFFERENT MILLING STRATEGIES Józef Kuczmaszewski 1 , Paweł Pieśko 1 , Magdalena Zawada-Michałowska 1 1 Lublin University of Technology, Faculty of Mechanical Engineering, Nadbystrzycka Str. 36, 20-618 Lublin, Poland,, e-mail: [email protected]; [email protected]; [email protected] ABSTRACT The paper presents an analysis of surface roughness following milling of thin-walled components made of aluminium alloy EN AW-2024, taking into account the three dif- ferent machining strategies and rolling direction of semi-finished product in the form of a plate combined with the milling feed. The aims of the study were to compare the results of machining using various technologies and show the best of them, providing the smallest roughness of the component following milling, as well as to determine the impact of rolling direction of the plate on the quality of the end surface. Measurement results of surface roughness parameters were provided information about the progress of the machining process. Keywords: machining of aluminium alloys, surface roughness, High Speed Cutting, High Performance Cutting, thin-walled components. INTRODUCTION The thin-walled elements can be defined as the components having thin walls with a thick- ness of less than 3 mm. Nowadays, they are often referred to as integral elements, characterized by low weight, solid design and high rigidity, among others. Parts are produced from monolithic blocks, particularly aluminium alloys on the new generation of machining centres using modern technologies, i.e. High Speed Cutting and High Performance Cutting. Large quantity of generated chips is the characteristic for machining of these elements (even 95% of the semi-finished product weight) [1, 3, 4]. In the industrial practice milling process op- timization of thin-walled elements is obtained by [10]: • selection of an appropriate strategy of ma- chining, • increased cutting speed v c , • „improvement” of technological parameters (in particular feed per tooth f z and width of cut a e ), reducing the thrust force which is the com- ponent of cutting force acting perpendicular to the work surface. In each of the above-mentioned techniques it is advised to leave a machining allowance (0.1 ÷ 0.2 mm) to a further finishing method. Essential- ly, the number of passes is conditioned by the di- mensions of thin-walled element and depth of cut a p . In addition, it is recommended to use a small ratio a p /a e , to shorten the contact time of the tool with the workpiece [10, 13]. One of the indicators of the material machin- ability defined as “the material susceptibility in the specified conditions to change the volume, shapes and dimensions during the machining” is the surface quality [5, 6]. Surface quality of elements made of alumini- um alloy mainly results from: material properties, process kinematics, machining parameters and external factors related to the stability of the ma- chining process. It has been noted that wrought Received: 2016.04.15 Accepted: 2016.05.10 Published: 2016.06.01
Transcript of Article (PDF, 2.81 MB)

150
Advances in Science and Technology Research JournalVolume 10, No. 30, June 2016, pages 150–158DOI: 10.12913/22998624/62515
Research Article
SURFACE ROUGHNESS OF THIN-WALLED COMPONENTS MADE OF ALUMINIUM ALLOY EN AW-2024 FOLLOWING DIFFERENT MILLING STRATEGIES
Józef Kuczmaszewski1, Paweł Pieśko1, Magdalena Zawada-Michałowska1
1 Lublin University of Technology, Faculty of Mechanical Engineering, Nadbystrzycka Str. 36, 20-618 Lublin, Poland,, e-mail: [email protected]; [email protected]; [email protected]
ABSTRACTThe paper presents an analysis of surface roughness following milling of thin-walled components made of aluminium alloy EN AW-2024, taking into account the three dif-ferent machining strategies and rolling direction of semi-finished product in the form of a plate combined with the milling feed. The aims of the study were to compare the results of machining using various technologies and show the best of them, providing the smallest roughness of the component following milling, as well as to determine the impact of rolling direction of the plate on the quality of the end surface. Measurement results of surface roughness parameters were provided information about the progress of the machining process.
Keywords: machining of aluminium alloys, surface roughness, High Speed Cutting, High Performance Cutting, thin-walled components.
INTRODUCTION
The thin-walled elements can be defined as the components having thin walls with a thick-ness of less than 3 mm. Nowadays, they are often referred to as integral elements, characterized by low weight, solid design and high rigidity, among others. Parts are produced from monolithic blocks, particularly aluminium alloys on the new generation of machining centres using modern technologies, i.e. High Speed Cutting and High Performance Cutting. Large quantity of generated chips is the characteristic for machining of these elements (even 95% of the semi-finished product weight) [1, 3, 4].
In the industrial practice milling process op-timization of thin-walled elements is obtained by [10]: • selection of an appropriate strategy of ma-
chining, • increased cutting speed vc, • „improvement” of technological parameters
(in particular feed per tooth fz and width of cut ae), reducing the thrust force which is the com-ponent of cutting force acting perpendicular to the work surface.
In each of the above-mentioned techniques it is advised to leave a machining allowance (0.1 ÷ 0.2 mm) to a further finishing method. Essential-ly, the number of passes is conditioned by the di-mensions of thin-walled element and depth of cut ap. In addition, it is recommended to use a small ratio ap/ae, to shorten the contact time of the tool with the workpiece [10, 13].
One of the indicators of the material machin-ability defined as “the material susceptibility in the specified conditions to change the volume, shapes and dimensions during the machining” is the surface quality [5, 6].
Surface quality of elements made of alumini-um alloy mainly results from: material properties, process kinematics, machining parameters and external factors related to the stability of the ma-chining process. It has been noted that wrought
Received: 2016.04.15Accepted: 2016.05.10Published: 2016.06.01

151
Advances in Science and Technology Research Journal Vol. 10 (30), 2016
alloys exhibit higher strength and hardness and the emerging surface is smoother. In contrast, cast alloys are characterized by a visible impact of the hard particles, which are located in a soft ma-trix, on the increasing surface roughness. Surface roughness is also related to technological param-eters. Feed per tooth fz and cutting speed vc have a major impact on the quality surface. The cutting tool characteristics such as: blade wear state, geo-metric parameters and protective coating proper-ties substantially affect the surface smoothness and the cutting force. Cooling method is also an important factor, especially for alloys, for which composition is similar to „pure” aluminium. The worst surface quality is obtained during machin-ing without cutting fluid [5, 6].
Among modern milling technologies there should be mentioned: HSC (High Speed Cutting) and HPC (High Performance Cutting) [2, 6, 9].
On the basis of the literature review compar-ing High Performance Cutting and High Speed Cutting, one may conclude that [6, 8]: • cutting speed vc during HPC is lower than in
the case of HSC, • depth of cut ap, width of cut ae, feed per tooth
fz are higher during HPC, • obtained surface quality following HPC is
worse, in comparison to HSC.
These differences result mainly from different purpose of both machining technologies. High Speed Cutting is used for finishing method, while High Performance Cutting is used during rough-ing operations [6, 7].
METHODOLOGY
The study was conducted for the following aims: • to compare the results of surface roughness
measurements following the different milling strategies of thin-walled elements,
• to verify the hypothesis that the technological history of semi-finished product has an impact
on surface roughness following milling (in the present case, rolling direction).
As a part of experimental study, aluminium alloy EN AW-2024 (chemical symbol: EN AW-AlCu4Mg1) was machined in the T351 state (heat-treated solution, stress relieved by stretch-ing and aged naturally), characterized by high strength, which is used for a wide range of appli-cations, primarily in the aerospace industry. How-ever, among its disadvantages are: low corrosion resistance and limited weldability.
Chemical composition and selected proper-ties of aluminium alloy EN AW-2024 is given in Table 1.
Samples, which are parallel and perpendicu-lar to the rolling direction, were cut from semi-finished product in the form of a plate (thickness 19.05 mm). Their overall dimensions are present-ed in Figure 1.
Fig. 1. Overall dimensions of the analyzed samples
Two end mills were used in the experiment: • indexable end mill of Kennametal
(25A03R044B25SED14) with properly select-ed milling inserts (EDCT140416PDFRLDJ),
• solid end mill of SGS Solid Carbide Tools (243CB16mm0,1R) with polished chip flutes.
Figure 2 shows end mill produced by Kenna-metal (symbol: 25A03R044B25SED14), which was used for high-performance technology HPC and Table 2 presents its specifications.
Milling insert (EDCT140416PDFRLDJ) was selected for tool body produced by Kennametal and is presented in Figure 3, while Table 3 shows its technical data.
Table 1. Chemical composition and selected properties of alloy EN AW-2024 [11, 12]
Chemical composition
Si Fe Cu Mn Mg Cr Zn Ti
0.5 0.5 3.8 – 4.9 0.3 – 0.9 1.2 – 1.8 0.1 0.25 0.15
PropertiesDensity, ρ Young's modulus, E Tensile strength, Rm Yield strength, Rp0,2
Brinell hardness
2.78 g/cm3 73 GPa 430 MPa 290 MPa 122 HB
Advances in Science and Technology Research Journal Vol. 10 (30), 2016
152
Fig. 2. End mill of Kennametal 25A03R044B-25SED14 [14]
Table 2. Technical data of Kennametal end mill 25A03R044B25SED14 [14]
Symbol 25A03R044B25SED14
Number of milling inserts z: 3
Cutting diameter D1 [mm]: 25
Working length L2 [mm]: 44
Overall length L [mm]: 101
Max. depth of cut ap1 max [mm]: 14.6
Shrank diameter D [mm]: 25
Fig. 3. Milling insert of Kennametal EDCT140416P-DFRLDJ [14]
Table 3. Technical data of Kennametal milling insert EDCT140416PDFRLDJ [14]
Symbol EDCT140416PDFRLDJ
Material: KC410M
Thickness S [mm]: 4.5
Height W [mm]: 8.45
Length of wiper edge BS [mm]: 1.77
Length of cutting edges L1 [mm]: 17
Corner radius Rε [mm]: 1.59
Number of cutting edges: 2
Figure 4 shows solid end mill produced by SGS Solid Carbide Tools (243CB16mm0,1R) with polished chip flutes that was used for con-ventional finishing method and HSC. Table 4 presents its technical data. Tests were conducted on a vertical machining centre AVIA VMC 800 HS with Heidenhain iTNC 530 CNC system. Special clamping fixture was mounted on the ma-chine table (Fig. 5) to ensures the correct mount-ing and fixing of analyzed samples.
Fig. 4. Solid end mill of SGS Solid Carbide Tools 243CB16mm0,1R [15]
Table 4. Technical data of SGS Solid Carbide Tools end mill 243CB16mm0,1R [15]
Symbol 243CB16mm0,1R
Number of flutes z: 3
Cutting diameter D1 [mm]: 16
Length of cut L2 (ap) [mm]: 32
Overall length L1 [mm]: 92
Shrank diameter D2 [mm]: 16
Corner radius R [mm]: 1
Fig. 5. Special clamping fixture: a) design, b) mount-ed on the machine table
It consists of: • main base (1) with milled pocket, four holes
for mounting samples using screws (2) and two holes for fixing fixture on the machine table by means of T-slide bolts and nuts (3),
• plate ensuring machining stability (4).
Surface roughness analysis of samples fol-lowing milling was carried out based on mea-surements obtained using a contact profilom-eter – Hommel Tester T1000. The research was conducted after removal of samples from clamping fixture on three levels: two extreme edges (the edge 1: l = 8 mm, the edge 2: l = 152 mm) and in the middle (l = 80 mm). Gauge head of profilometer was always placed in the middle of tool pass and each measurement was repeated ten times (Fig. 6).
Basic parameters of surface roughness mea-surements of analyzed elements using Hommel Tester T1000 are presented in Table 5.
Arithmetic average of profile ordinates Ra was adopted for the results analysis of rough-ness measurements. Conducted study allowed to

153
Advances in Science and Technology Research Journal Vol. 10 (30), 2016
Table 5. Parameters of surface roughness measure-ments
Measuring conditions Unit Value
Measuring range: µm 80
Measuring length Lt: mm 4.80
Sampling length Lc: mm 0,8
Speed vt: mm/s 0.50
Filter: ISO 11562
evaluate surface quality of thin-walled components following milling, including the analyzed strate-gies and rolling direction of semi-finished product.
Additionally, roughness maps (3D topogra-phy) were prepared using 3D Hommel-ETAMIC T8000 RC device in accordance with ISO 25178 (Geometric Product Specifications GPS).
In the framework of experimental study three milling strategies were checked: • High Performance Cutting, • High Performance Cutting combined with
conventional finishing operation, • Performance Cutting and High Speed Cutting.
The statement of technological parameters for the above-mentioned technologies is shown in Table 6. Rolling direction of tested samples was the next variable: • longitudinal – longer edge of samples parallel
to plate rolling direction (milling perpendicu-lar to rolling direction),
• transversal – longer edge of samples perpen-dicular to plate rolling direction (milling par-allel to rolling direction).
Fig. 6. Schematic layout of the measuring levels
Table 6. Values of technological parameters for individual machining strategies
Technological parametersStrategies
HPC HPC + conventional machining HPC + HSC
Depth of cut ap [mm] 3.81);4.75
3.751);4.7 0.2 3.751);
4.7 0.2
Width of cut ae [mm] 18.75 18.75 12 18.75 12
Cutting speed vc [m/min] 1000 1000 200 1000 1200
Feed per tooth fz [mm/ostrze] 0.1 0.1 0.02 0.1 0.02
Rotation speed n [obr/min] 12732 12732 3979 12732 23873
Feed speed vf [mm/min] 3820 3820 239 3820 1432
Number of passes i [-] 4 4 1 4 11) Value for first pass resulting from plate thickness.

Advances in Science and Technology Research Journal Vol. 10 (30), 2016
154
Figure 7 presents a schematic diagram of the examined variables.
In the study, the longitudinal samples were milled with feed that was perpendicular to rolling direction and the transversal – parallel.
RESULTS
Each series of surface roughness measure-ments was averaged and the standard deviation was calculated. The results were presented in a graphical form on the bar charts with the designa-tion of all examined variables.
Figure 8 shows values of arithmetic average of profile ordinates Ra for samples with transversal and longitudinal rolling direction relating to HPC strategy and the three measuring levels. Based on these charts, it was observed that the highest values of Ra parameter were obtained in both cases for the central samples zone: Ra = 0.41 µm (transversal direction) and Ra = 0.43 µm (longitudinal direc-tion). Moreover, for all levels, slightly higher val-ues of Ra were received for samples, which were milled perpendicular to rolling direction.
The values of Ra parameter for samples with transversal and longitudinal rolling direction, which were milled based on HPC strategy com-bined with conventional machining (CM) as well as measuring levels are presented in Figure 9. On their basis, it was noticed as in Figure 8 that the highest values of Ra were obtained for the middle samples: Ra = 0.16 µm (transversal direction) and Ra = 0.23 µm (longitudinal direction). Addition-ally, for all levels, the higher values of Ra were received for milled sample with perpendicular feed to rolling direction of plate.
Figure 10 presents the values of arithme-tic average of profile ordinates Ra for samples with transversal and longitudinal rolling direc-tion and the combination of two technologies: HSC and HPC as well as examined measuring levels. The highest values of Ra parameter were observed for the middle samples: Ra = 0.31 µm (transversal direction) and Ra = 0.32 µm (longitudinal direction). Also in this case, the higher values of Ra parameter were received for sample which was milled perpendicular to the rolling direction.
The values of Ra parameter for individual machining strategies, comparing rolling direction and taking into account center measuring level are shown in Figure 11.
In accordance with the data presented in Fig. 11 it can be noticed that rolling direction has an impact on surface quality. In each case higher values of Ra parameter were obtained for milled samples with feed, which was perpendicular to rolling direction (longitudinal direction).
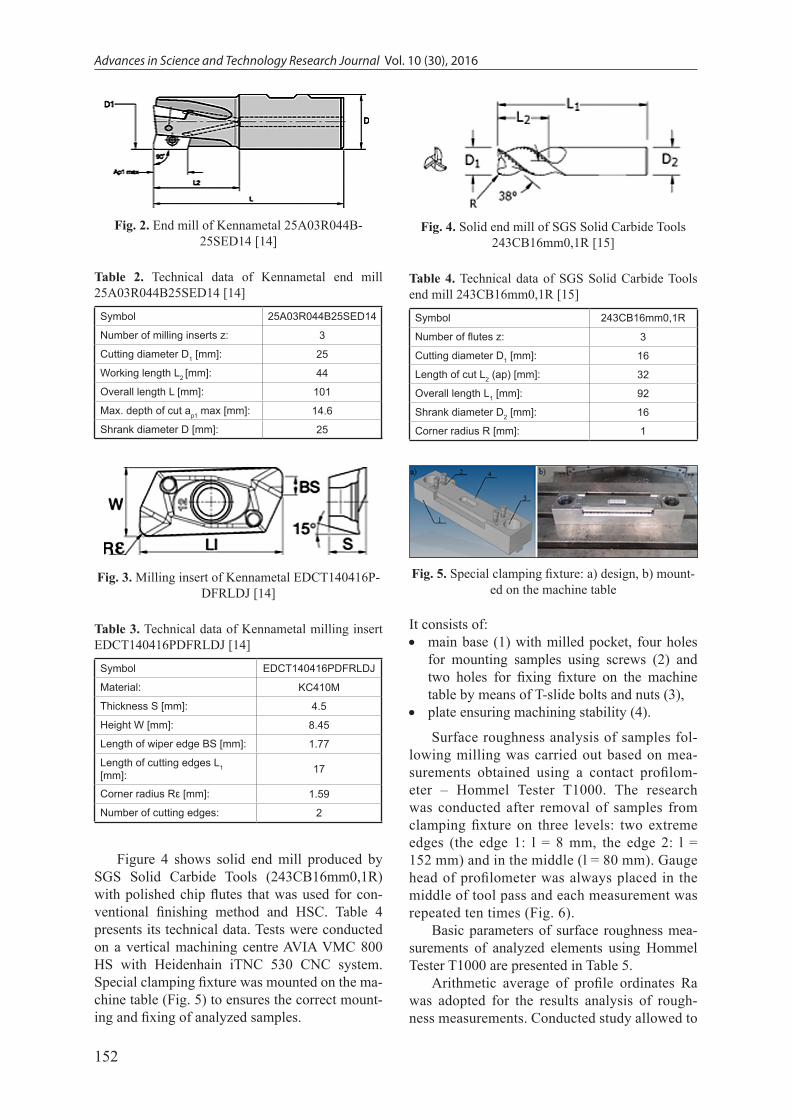
Arithmetic average of profile ordinates Ra for samples with transversal and longitudinal roll-ing direction as well as three different machining strategies and center measuring level are shown in Figure 12.
Fig. 8. Arithmetic average of profile ordinates Ra for milled samples: (a) parallel and (b) perpendicular to rolling direction as well as strategy: HPC
Fig. 7. Schematic diagram of the examined variables

155
Advances in Science and Technology Research Journal Vol. 10 (30), 2016
Fig. 9. Arithmetic average of profile ordinates Ra for milled samples: (a) parallel and (b) perpendicular to rolling direction as well as strategy: HPC combined with conventional machining
Fig. 10. Arithmetic average of profile ordinates Ra for milled samples: (a) parallel and (b) perpendicular to roll-ing direction as well as strategy: HPC and HSC
Fig. 11. Arithmetic average of profile ordinates Ra for milled samples: parallel and perpendicular to rolling direc-tion as well as strategies: (a) HPC, (b) HPC combined with conventional machining, (c) HPC and HSC
Advances in Science and Technology Research Journal Vol. 10 (30), 2016
156
Fig. 12. Arithmetic average of profile ordinates Ra for milled samples: (a) parallel and (b) perpendicular to roll-ing direction as well as different milling strategies
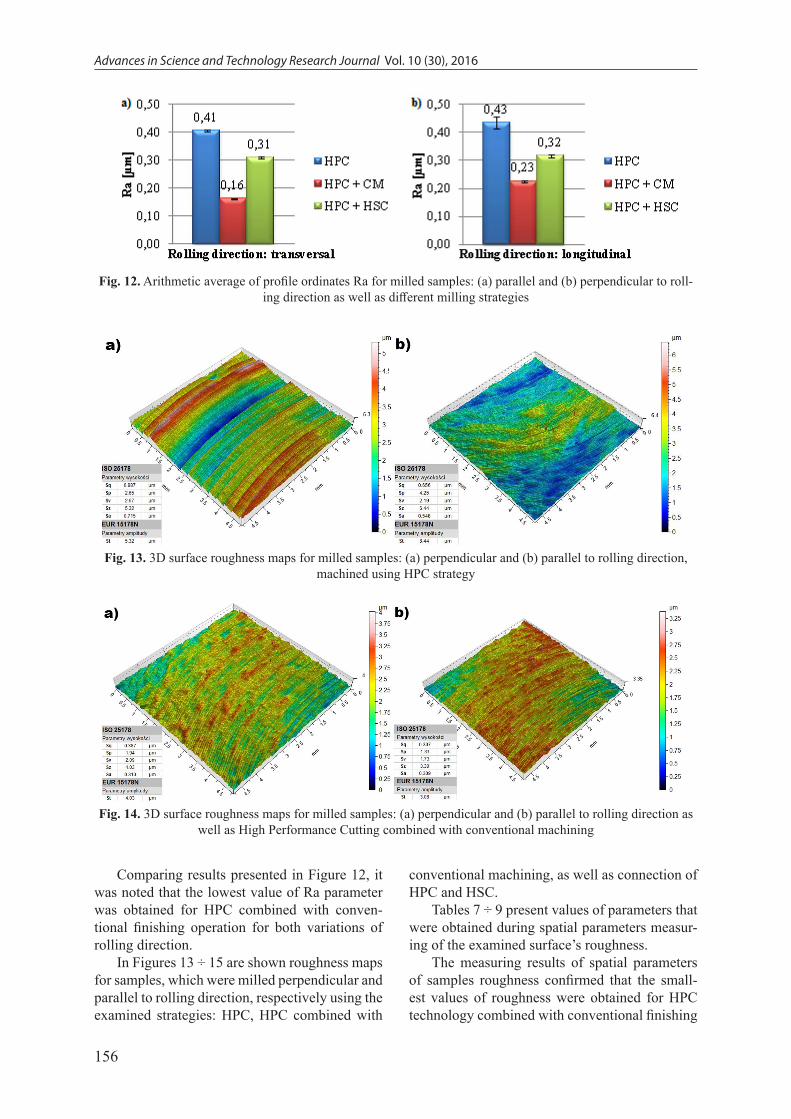
Fig. 13. 3D surface roughness maps for milled samples: (a) perpendicular and (b) parallel to rolling direction, machined using HPC strategy
Fig. 14. 3D surface roughness maps for milled samples: (a) perpendicular and (b) parallel to rolling direction as well as High Performance Cutting combined with conventional machining
Comparing results presented in Figure 12, it was noted that the lowest value of Ra parameter was obtained for HPC combined with conven-tional finishing operation for both variations of rolling direction.
In Figures 13 ÷ 15 are shown roughness maps for samples, which were milled perpendicular and parallel to rolling direction, respectively using the examined strategies: HPC, HPC combined with
conventional machining, as well as connection of HPC and HSC.
Tables 7 ÷ 9 present values of parameters that were obtained during spatial parameters measur-ing of the examined surface’s roughness.
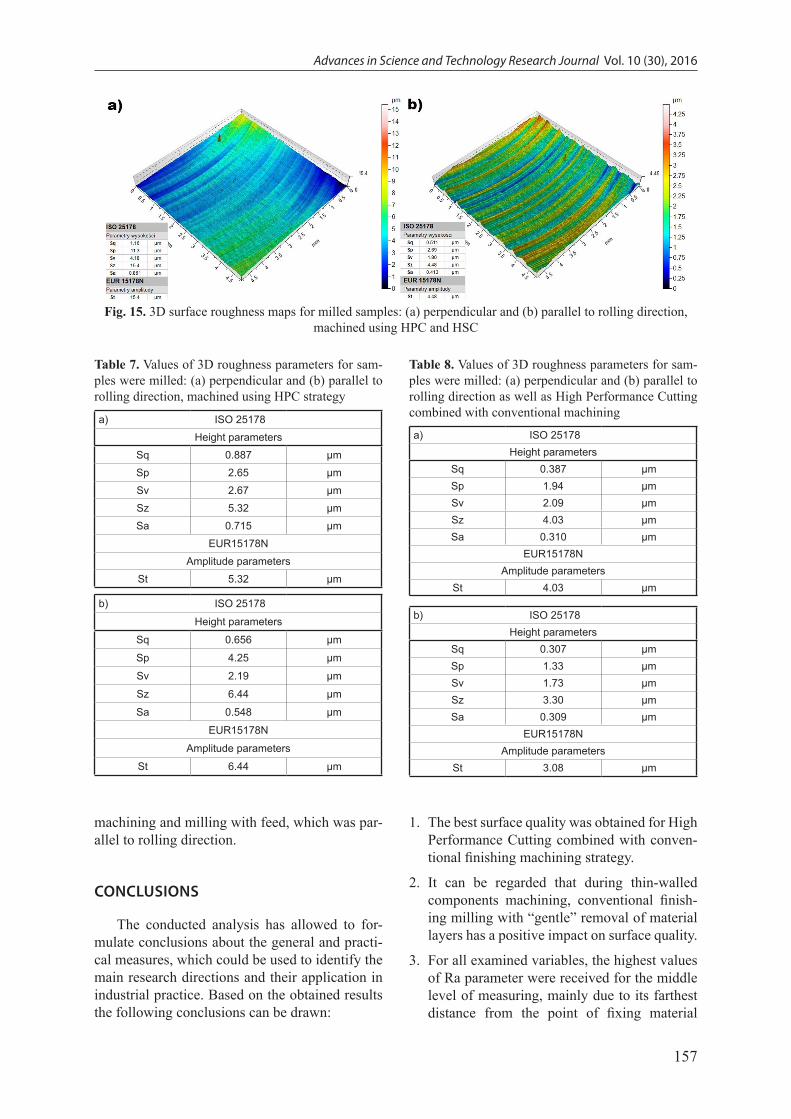
The measuring results of spatial parameters of samples roughness confirmed that the small-est values of roughness were obtained for HPC technology combined with conventional finishing
157
Advances in Science and Technology Research Journal Vol. 10 (30), 2016
machining and milling with feed, which was par-allel to rolling direction.
CONCLUSIONS
The conducted analysis has allowed to for-mulate conclusions about the general and practi-cal measures, which could be used to identify the main research directions and their application in industrial practice. Based on the obtained results the following conclusions can be drawn:
Table 7. Values of 3D roughness parameters for sam-ples were milled: (a) perpendicular and (b) parallel to rolling direction, machined using HPC strategy
a) ISO 25178Height parameters
Sq 0.887 μmSp 2.65 μmSv 2.67 μmSz 5.32 μmSa 0.715 μm
EUR15178NAmplitude parameters
St 5.32 μm
b) ISO 25178Height parameters
Sq 0.656 μmSp 4.25 μmSv 2.19 μmSz 6.44 μmSa 0.548 μm
EUR15178NAmplitude parameters
St 6.44 μm
Table 8. Values of 3D roughness parameters for sam-ples were milled: (a) perpendicular and (b) parallel to rolling direction as well as High Performance Cutting combined with conventional machining
a) ISO 25178Height parameters
Sq 0.387 μmSp 1.94 μmSv 2.09 μmSz 4.03 μmSa 0.310 μm
EUR15178NAmplitude parameters
St 4.03 μm
b) ISO 25178Height parameters
Sq 0.307 μmSp 1.33 μmSv 1.73 μmSz 3.30 μmSa 0.309 μm
EUR15178NAmplitude parameters
St 3.08 μm
Fig. 15. 3D surface roughness maps for milled samples: (a) perpendicular and (b) parallel to rolling direction, machined using HPC and HSC
1. The best surface quality was obtained for High Performance Cutting combined with conven-tional finishing machining strategy.
2. It can be regarded that during thin-walled components machining, conventional finish-ing milling with “gentle” removal of material layers has a positive impact on surface quality.
3. For all examined variables, the highest values of Ra parameter were received for the middle level of measuring, mainly due to its farthest distance from the point of fixing material

Advances in Science and Technology Research Journal Vol. 10 (30), 2016
158
during machining. It was pointed to require-ment for precise analysis of the conditions for mounting and fixing thin-walled components in clamping fixture.
4. The differences between the values of rough-ness that were obtained with the tested strat-egies are important, because of the practical significance, resulting from the indication of a strategy to ensure the best surface quality (High Performance Cutting combined with conventional finishing machining).
5. The higher values of surface roughness were obtained for milling with feed perpendicular to rolling direction, that indicates the existing relation between rolling direction and feed.
6. Fixing stability plays the key role in thin-walled components machining, as it has a major impact on machined surface quality. During machining of elements with thin walls placement of the supports should be reason-ably planned, so as to ensure adequate rigidity of a component in the clamping fixture.
7. The conducted study indicate that both ma-chining direction in relation to rolling direc-tion and milled strategy have a major impact on roughness parameters of tested aluminium alloy EN AW-2024 following milling.
REFERENCES
1. Ab-Kadir A.R., Osman M.H., Shamsuddin K.A.: A comparison of milling cutting path strategies for thin-walled aluminium alloys fabrication. The In-ternal Journal of Engineering and Science, 2 (3), 2013, 1–8.
2. Adamski W.: Wybrane kierunki zwiększenia wydajności procesów skrawania. Mechanik, 5-6 (82), 2009, 540–546.
3. Adamski W.: Wykorzystanie techniki High Speed Machining przy produkcji części samolotu DREAMLINER Boeing 787. VII Forum „Pro-Cax”, Podlesice, 2008.
4. Kuczmaszewski J.: Efektywność wytwarzania el-ementów lotniczych ze stopów aluminium i mag-nezu. Komputerowo Zintegrowane Zarządzanie: pod red. Knosala R., Tom II, Oficyna Wydawnicza Polskiego Towarzystwa Zarządzania Produkcją, Opole, 2011, 7–18.
5. Kuczmaszewski J., Zaleski K. (red.): Obróbka sk-rawaniem stopów aluminium i magnezu. Politech-nika Lubelska, Lublin, 2015.
6. Oczoś K.E., Kawalec A.: Kształtowanie metali le-kkich. Wydawnictwo Naukowe PWN, Warszawa, 2012.
7. Oczoś K.E.: Obróbka wysokowydajna HPC. Mechanik, 11 (77), 2004, 701–709.
8. Pieśko P., Zagórski I.: Analiza porównawcza metod frezowania HSM, HPC oraz frezowania konwenc-jonalnego wysokokrzemowych stopów alumini-um. Postępy Nauki i Techniki, 7, 2011, 219–226.
9. Zalewski A.: Efektywne wytwarzanie dzięki op-tymalnej strategii obróbki HSM. Projektowanie i Konstrukcje Inżynierskie, 3 (3), 2007, 23–26.
10. Zębala W.: Minimalizacja błędów obróbki przed-miotów cienkościennych. Inżynieria Maszyn, 3 (15), 2010, 45–54.
11. PN-EN 485-2:2014-02: Aluminium i stopy alu-minium. Blachy, taśmy i płyty. Część 2: Własności mechaniczne. Tolerancje kształtu i wymiarów wyrobów walcowanych na zimno.
12. PN-EN 573-3:2010: Aluminium i stopy alumin-ium. Skład chemiczny i rodzaje wyrobów prze-robionych plastycznie. Część 3: Skład chemicz-ny i rodzaje wyrobów.
13. Machining Guide Sandvik Coromant, 2012.14. An online catalog of tools produced by Kennam-
etal, http://www.kennametal.com/ (27.11.2015).15. An online catalog of tools produced by SGS Solid
Cabride Tools, http://sgstool.com/ (27.11.2015).
Table 9. Values of 3D roughness parameters for sam-ples were milled: (a) perpendicular and (b) parallel to rolling direction, machined using HPC with HSC
a) ISO 25178Height parameters
Sq 1.16 μmSp 11.3 μmSv 4.18 μmSz 15.4 μmSa 0.861 μm
EUR15178NAmplitude parameters
St 15.4 μm
b) ISO 25178Height parameters
Sq 0.511 μmSp 2.69 μmSv 1.80 μmSz 4.48 μmSa 0.413 μm
EUR15178NAmplitude parameters
St 4.48 μm