Article New Energy Architecture India Accenture
36
New Energy Architecture India World Economic Forum In partnership with Accenture
description
Smart grid
Transcript of Article New Energy Architecture India Accenture
New Energy Architecture India
World Economic Forum In partnership with Accenture

1New Energy Architecture India
Contents
A note on the creation of this study
This World Economic Forum report was developed by the Forum’s Energy Industry Partnership in collaboration with Accenture.
A series of interviews with stakeholders from across the energy value chain conducted in New Delhi during October 2011, and a private session conducted at the India Economic Summit in Mumbai in November 2011, form the basis of the sections on India’s objectives for a New Energy Architecture and the enabling environments required to achieve them.
The views expressed in this publication do not necessarily reflect those of the World Economic Forum or Accenture.
Contributors
World Economic Forum
• Roberto Bocca, Senior Director, Head of Energy Industry
• Espen Mehlum, Associate Director, Head of Knowledge Management and Integration Energy Industries
Project Adviser: Accenture
• Arthur Hanna, Managing Director, Energy Industry
• James Collins, Senior Manager, Energy Strategy
• Mike Moore, Project Manager, New Energy Architecture, Accenture Secondee
• With further support from Timothy Hendrikz, Bryan Hori, Piush Kothari and Samuel Madden
2 Executive Summary
4 A Methodology for Managing Transition Effectiveness
6 Step 1: Assessing Current Energy Architecture Performance
7 1.1 Introduction to India’s Energy Architecture
8 1.2 India’s Current Energy Architecture Performance
13 1.3 Comparing India’s Current Energy Architecture Performance with the Grow Archetype
16 Step 2: Creating New Energy Architecture Objectives
17 2.1 Defining India’s Objectives for a New Energy Architecture
20 Step 3: Defining the Enabling Environment
21 3.1 Achieving India’s New Energy Architecture Objectives: Creating the Right Enabling Environment
22 3.2 Defining Enabling Environments for India’s New Energy Architecture
28 Step 4: Defining Areas of Leadership
29 4.1 A Multistakeholder Action Plan
30 Appendices: The Creation of the Energy Architecture Performance Index
31 Appendix A: Computation and Structure of the Energy Architecture Performance Index
32 Appendix B: Technical Notes and Sources for the Energy Architecture Performance Index
2 New Energy Architecture India
Making the Transition
The focus for the coming years will be on supporting economic growth by providing a secure supply of energy. To provide a secure supply of energy – and address further issues of distorted energy pricing, poor air quality, growing water scarcity and import dependence, the unreliability of the grid and continuing energy poverty – require India to bring new forms of supply online, deliver it more effectively to consumers (both urban and rural), and do so at market-based prices (based upon the gradual phase-out of subsidies). To do so, India should consider pursuing the following set of objectives:
• Objective 1 – Augment resources for energy security: India must look to encourage and expand the presence of international coal and oil & gas companies to provide the investment and technical expertise to develop domestic hydrocarbon resources, invest in continuing development of the renewable industry and look to increase efficiency in end use consumption.
• Objective 2 – Provide access to modern forms of energy for all: India must promote the role of the private sector in developing and deploying decentralized distribution and generation and modern cookstove and lighting technologies to rural areas where lack of awareness and state-level bureaucracy is impeding progress.
• Objective 3 –Strengthening energy carriers: The financial health of transmission and distribution companies must be improved to enable investment in strengthening, expanding and developing the power grid while gas infrastructure must continue to expand its small but growing coverage.
• Objective 4 –Rationalize energy prices: To transition to a more efficient economy, India needs a well-instituted market mechanism for energy pricing and must gradually withdraw wide-scale energy subsidies while ensuring that transparent and effective distribution of kerosene and LPG to those below the poverty line is implemented.
Executive Summary
The last decade has been a period of tremendous growth for India. This growth has driven a large increase in energy demand, with India now being the fourth largest consumer of energy globally. Between 1990 and 2008, total demand grew by 95%2 and has put India’s energy architecture under severe strain. India has provisionally set a 9% GDP growth target as part of the 12th Five Year Plan, which will require energy supply to grow 6.5% per year.3 This represents a much more significant growth target for the sector than in previous years. The focus for the coming years will therefore be on supporting economic growth by providing a secure supply of energy. Indeed, “inability to meet energy demand could be the single biggest constraining factor to India’s growth story.”4 This will require India to bring new forms of supply online, deliver it more effectively to consumers (both urban and rural), and do so at a market-based price (based upon the eventual eradication of subsidies) that sends appropriate signals to both the demand and supply sides.
India does have a responsibility to achieve its growth trajectory in an environmentally sustainable manner, and has set a voluntary target to cut the emissions intensity of GDP by 20-25% by 2020 compared with 2005 levels.5 Therefore, the way forward should be to identify common ground between climate change policy and economic growth and pursue measures that achieve both.
Considering that there needs to be a significant expansion in energy infrastructure, India has an opportunity to pursue development while managing emissions growth, enhancing its energy security and creating world-scale clean-technology industries. This would require that India leapfrog inefficient technologies, assets and practices and deploy ones that are more efficient and less emission-intensive. India should therefore not look to copy the Western model of energy infrastructure development, and instead pursue a development path that is particular to its local conditions. This would require that India leapfrog inefficient technologies, assets and practices and deploy ones that are more efficient and less emission intensive, with a key opportunity being the expansion of decentralized distribution and generation.
Inability to meet energy demand could be the single biggest constraining factor
to India’s growth story.1
1 Interviewee, New Delhi, October 20112 World Bank, World Development Indicators3 An Approach to the 12th Five Year Plan, Indian Planning Commission, 20114 Interview participant, New Delhi, October 20115 Natural Resources Defense Council, From Copenhagen Accord to Climate Action: Tracking National Commitments to Curb Global Warming, http://www.nrdc.org/international/copenhagenaccords/
3New Energy Architecture India
The Required Enabling Environment
To enable India to address its objectives, an enabling environment will be needed. The creation of an enabling environment will require support from across all four pillars:
India has a strong policy framework at the national level – but implementation at the state level is often lacking. The public policy regime for the promotion of renewable energy at the national level is viewed as being among the most effective in the world – “a benchmark for all emerging markets”.6 However, success in implementing national targets varies significantly on a state by state basis. Poor performing states should be targeted to promote capacity building and encourage wider economic development.
Development of the power grid is urgently needed. The transmission and distribution network is in urgent need of investment and development and India has the opportunity to leapfrog western countries through the deployment of more efficient, less intensive and smarter technology. India has seen rapid development in its renewables sector, especially in wind energy and this expertise and momentum must be leveraged and applied to other technologies, particularly solar.
Costly and inefficient subsidies are damaging the economy. The energy market must be made more transparent and efficient to attract foreign and private investment. This will require the removal of subsidies and increased separation between the government and state-owned companies. Market structures for the transmission of electricity between states must be rationalized to foster the development of renewable generation and better load balancing.
India can become a centre of excellence for renewable energy R&D. India has a large and growing educated population and this must be leveraged to provide the technical skills that will be required to make the transition to a New Energy Architecture. Society must be more aware of the consequences of energy consumption and the role of decentralized distribution and generation in providing modern forms of energy and bringing opportunities for economic development.
The provision of information is essential for the deployment of new technologies. The effective, transparent and sympathetic dissemination of information will be central in developing India’s energy architecture, from communicating the removal of subsidies to the need to consume energy more efficiently. Honest and upfront communication will also be essential to gaining the involvement of international and private energy companies in the development of India’s hydrocarbon resources.
The government’s role in creating a strong, stable and transparent policy framework is essential. This will require strong political leadership to manage the effective removal of subsidies and enable the benefits from increased private sector participation to be fully passed onto the public. India’s population is growing in size and wealth and private companies must look to exploit this opportunity, this will involve investing in collaborative partnerships to gain access to technology and skills and deploying new technologies to market. The true cost of energy use and waste must be communicated by civil society so that changes in subsidy levels and energy architecture are accepted. Cultural changes such as the acceptability of electricity theft must be altered. The role of modern forms of energy in developing the welfare and economy of rural areas must be imparted.
The New Energy Architecture Project
New Energy Architecture: India builds on the methodology and findings of the World Economic Forum’s wider work, New Energy Architecture: Enabling an effective transition. This project aims to better understand how countries can make the transition to a New Energy Architecture that more effectively underpins economic growth and development, environmental sustainability and energy access and security.
The study provides a basis for discussion and a valuable tool for policy-makers, industry and other stakeholders to use in identifying the current energy architecture challenges for India and the enabling environments that should be created to drive the transition to a New Energy Architecture. We hope it will provide support for any discussion on India’s energy architecture aimed at generating concrete insight and priorities for action.
6 Tulsi R. Tanti, Wind matters: Making the case for wind in India, Suzlon, 2011
Executive Summary
4 New Energy Architecture India
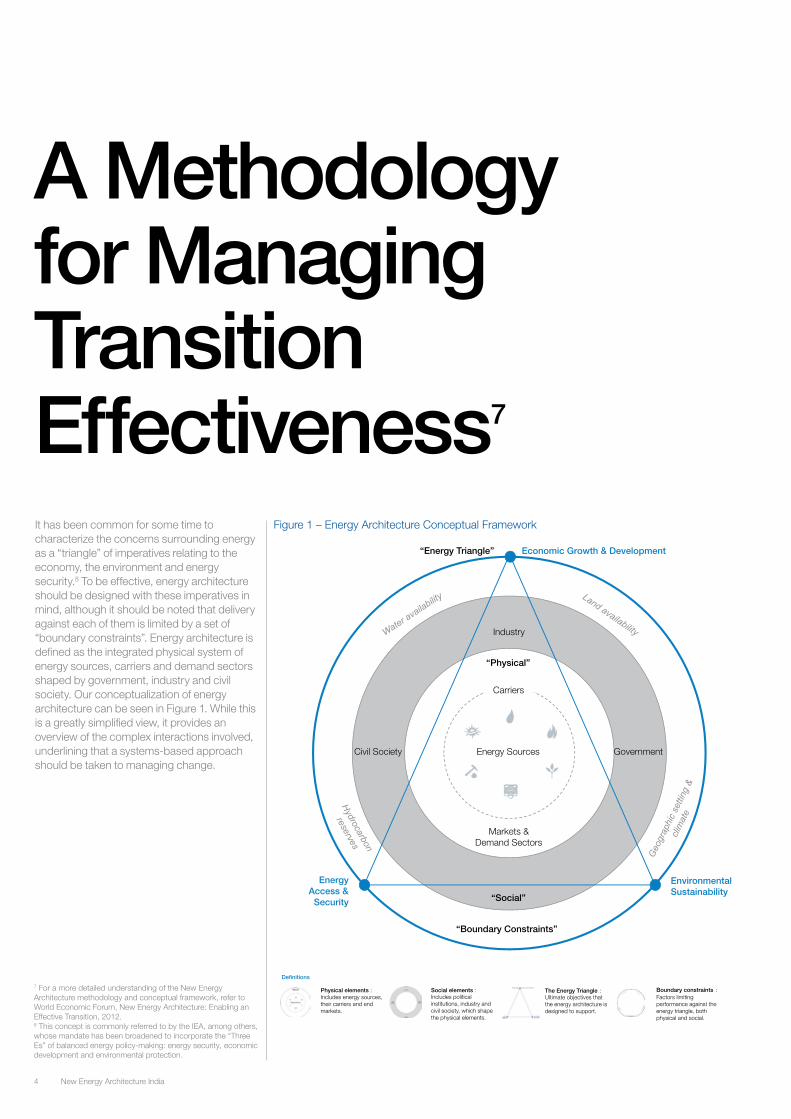
It has been common for some time to characterize the concerns surrounding energy as a “triangle” of imperatives relating to the economy, the environment and energy security.8 To be effective, energy architecture should be designed with these imperatives in mind, although it should be noted that delivery against each of them is limited by a set of “boundary constraints”. Energy architecture is defined as the integrated physical system of energy sources, carriers and demand sectors shaped by government, industry and civil society. Our conceptualization of energy architecture can be seen in Figure 1. While this is a greatly simplified view, it provides an overview of the complex interactions involved, underlining that a systems-based approach should be taken to managing change.
Energy Access &
Security
Economic Growth & Development
Environmental Sustainability
Carriers
Energy Sources
Markets & Demand Sectors
“Social”
“Physical”
Industry
Government Civil Society
“Boundary Constraints”
“Energy Triangle”
Physical elements : Includes energy sources, their carriers and end markets.
Social elements : Includes political institutions, industry and civil society, which shape the physical elements.
The Energy Triangle : Ultimate objectives that the energy architecture is designed to support.
Boundary constraints : Factors limiting performance against the energy triangle, both physical and social.
Definitions
Figure 1 – Energy Architecture Conceptual Framework
A Methodology for Managing Transition Effectiveness7
7 For a more detailed understanding of the New Energy Architecture methodology and conceptual framework, refer to World Economic Forum, New Energy Architecture: Enabling an Effective Transition, 2012.8 This concept is commonly referred to by the IEA, among others, whose mandate has been broadened to incorporate the “Three Es” of balanced energy policy-making: energy security, economic development and environmental protection.

5New Energy Architecture India
This project was initiated to help decision-makers enable a more effective transition to a New Energy Architecture. To do so, a methodology has been created to help them look to the long term and to provide a stable policy environment, based on a holistic and in-depth understanding of the consequences of decisions across the energy value chain. The end result will be a New Energy Architecture that is more responsive to balancing the imperatives of the energy triangle. This process comes in four steps (see Figure 2):
Step 1 – Assessing Current Energy Architecture Performance: This process begins with an assessment of current energy architecture performance using the Energy Architecture Performance Index (EAPI); a composite indicator that considers economic development, energy access and environmental sustainability. This is intended to help countries to monitor the progress of their transition, and guide policy and investment decisions with regard to energy accordingly.
Step 2 – Creating New Energy Architecture Objectives: Based on strengths and weaknesses identified, a set of objectives for a New Energy Architecture that more effectively meets the imperatives of the energy triangle is created. These objectives are tested through in-country interviews with representatives from across the energy value chain.
Step 3 – Defining the Enabling Environment: An enabling environment that supports New Energy Architecture objectives is designed. Interviews are used to identify the enabling environments that should be put in place, with the suggestions further tested through a multistakeholder workshop.
Step 4 – Introducing Areas of Leadership: The ultimate output is the creation of an action plan that details the relative roles of government, industry and civil society in creating an enabling environment for the transition.
In the following sections, the methodology is applied to India. This begins with an overview of India’s current energy architecture and the results of the Energy Architecture Performance Index. India’s objectives for a New Energy Architecture are then identified, based on where its current strengths and weaknesses lie. This is followed by an exploration of the enabling environments that need to be created to achieve objectives. The final section discusses the roles of government, industry and civil society in working collaboratively to create an enabling environment.
Figure 2 – New Energy Architecture Methodology
a) Understand current energy architecture
b) Select KPIs to assess current and historic performance
1. Assessing current energy architecture performance
2. Creating New Energy Architecture objectives
4. Defining areas of leadership
a) Highlight energy architecture challenges
b) Identify New Energy Architecture objectives
a) Develop high-level action plan for steps to be taken by government, industry, the finance community and civil society to shape the transition
• What are the objectives for a New Energy Architecture?
• Who is responsible for implementing enabling environments?
• How is energy architecture currently performing?
Key
que
stio
n A
ctiv
ity
3. Defining the enabling environment
a) Create an enabler “toolkit” that highlights the potential actions that can be taken to accelerate the transition
b) Map enablers to transition objectives
• What enabling environment will achieve transition objectives?
The Energy Architecture Performance Index An archetype approach
The four pillars of an enabling environment
Key considerations for stakeholders
A Methodology for Managing Transition Effectiveness2

6 New Energy Architecture India
Step 1: Assessing Current Energy Architecture Performance
9 The Economic Times, India eyeing 63,000 MW nuclear power capacity by 2032: NPCIL, 11 October 201010 References to India’s energy balance are sourced from the IEA.11 Prayas, Energy Group, An Overview of Indian Energy Trends: Low Carbon Growth and Development Challenges, September 200912 CEA Annual Report 2009-2010; Ministry of Power, Power Sector at a Glance “ALL INDIA”13 ibid14 Ministry of Coal, Annual Report 2009-201015 Ministry of Coal, Provisional Coal Statistics 2009-2010
7New Energy Architecture India
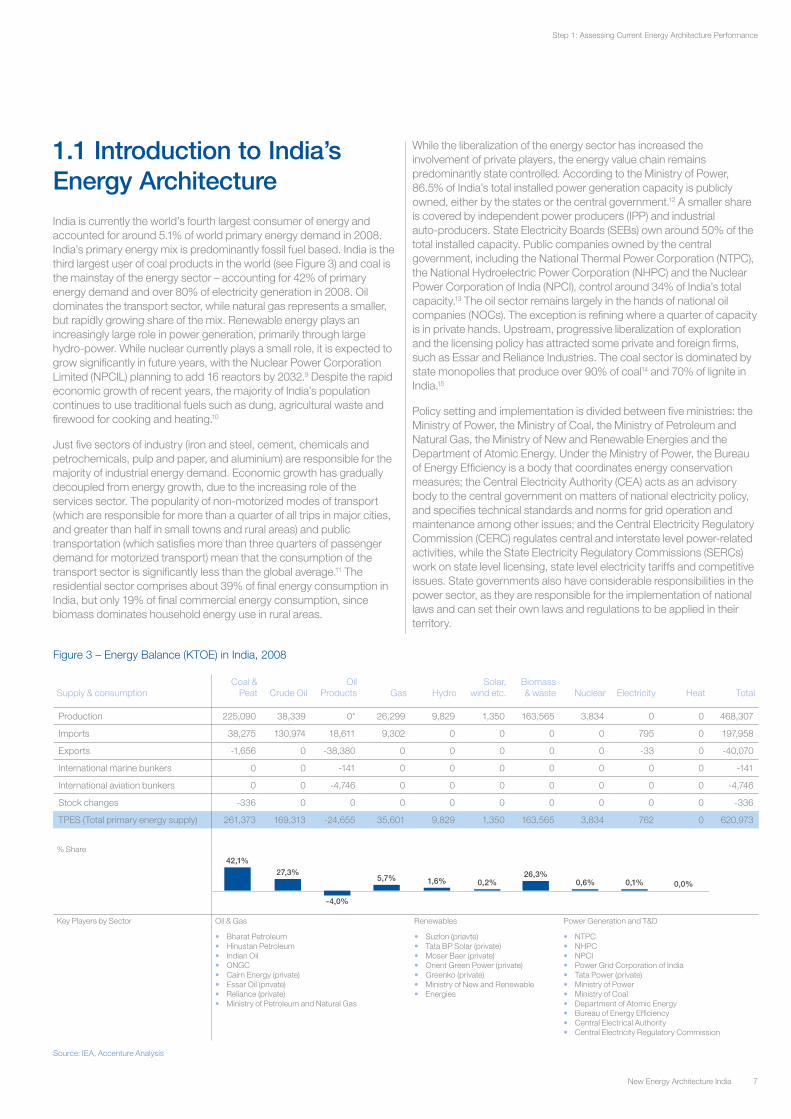
India is currently the world’s fourth largest consumer of energy and accounted for around 5.1% of world primary energy demand in 2008. India’s primary energy mix is predominantly fossil fuel based. India is the third largest user of coal products in the world (see Figure 3) and coal is the mainstay of the energy sector – accounting for 42% of primary energy demand and over 80% of electricity generation in 2008. Oil dominates the transport sector, while natural gas represents a smaller, but rapidly growing share of the mix. Renewable energy plays an increasingly large role in power generation, primarily through large hydro-power. While nuclear currently plays a small role, it is expected to grow significantly in future years, with the Nuclear Power Corporation Limited (NPCIL) planning to add 16 reactors by 2032.9 Despite the rapid economic growth of recent years, the majority of India’s population continues to use traditional fuels such as dung, agricultural waste and firewood for cooking and heating.10
Just five sectors of industry (iron and steel, cement, chemicals and petrochemicals, pulp and paper, and aluminium) are responsible for the majority of industrial energy demand. Economic growth has gradually decoupled from energy growth, due to the increasing role of the services sector. The popularity of non-motorized modes of transport (which are responsible for more than a quarter of all trips in major cities, and greater than half in small towns and rural areas) and public transportation (which satisfies more than three quarters of passenger demand for motorized transport) mean that the consumption of the transport sector is significantly less than the global average.11 The residential sector comprises about 39% of final energy consumption in India, but only 19% of final commercial energy consumption, since biomass dominates household energy use in rural areas.
While the liberalization of the energy sector has increased the involvement of private players, the energy value chain remains predominantly state controlled. According to the Ministry of Power, 86.5% of India’s total installed power generation capacity is publicly owned, either by the states or the central government.12 A smaller share is covered by independent power producers (IPP) and industrial auto-producers. State Electricity Boards (SEBs) own around 50% of the total installed capacity. Public companies owned by the central government, including the National Thermal Power Corporation (NTPC), the National Hydroelectric Power Corporation (NHPC) and the Nuclear Power Corporation of India (NPCI), control around 34% of India’s total capacity.13 The oil sector remains largely in the hands of national oil companies (NOCs). The exception is refining where a quarter of capacity is in private hands. Upstream, progressive liberalization of exploration and the licensing policy has attracted some private and foreign firms, such as Essar and Reliance Industries. The coal sector is dominated by state monopolies that produce over 90% of coal14 and 70% of lignite in India.15
Policy setting and implementation is divided between five ministries: the Ministry of Power, the Ministry of Coal, the Ministry of Petroleum and Natural Gas, the Ministry of New and Renewable Energies and the Department of Atomic Energy. Under the Ministry of Power, the Bureau of Energy Efficiency is a body that coordinates energy conservation measures; the Central Electricity Authority (CEA) acts as an advisory body to the central government on matters of national electricity policy, and specifies technical standards and norms for grid operation and maintenance among other issues; and the Central Electricity Regulatory Commission (CERC) regulates central and interstate level power-related activities, while the State Electricity Regulatory Commissions (SERCs) work on state level licensing, state level electricity tariffs and competitive issues. State governments also have considerable responsibilities in the power sector, as they are responsible for the implementation of national laws and can set their own laws and regulations to be applied in their territory.
1.1 Introduction to India’s Energy Architecture
Step 1: Assessing Current Energy Architecture Performance
Source: IEA, Accenture Analysis
Figure 3 – Energy Balance (KTOE) in India, 2008
Supply & consumptionCoal &
Peat Crude OilOil
Products Gas HydroSolar,
wind etc.Biomass & waste Nuclear Electricity Heat Total
Production 225,090 38,339 0* 26,299 9,829 1,350 163,565 3,834 0 0 468,307
Imports 38,275 130,974 18,611 9,302 0 0 0 0 795 0 197,958
Exports -1,656 0 -38,380 0 0 0 0 0 -33 0 -40,070
International marine bunkers 0 0 -141 0 0 0 0 0 0 0 -141
International aviation bunkers 0 0 -4,746 0 0 0 0 0 0 0 -4,746
Stock changes -336 0 0 0 0 0 0 0 0 0 -336
TPES (Total primary energy supply) 261,373 169,313 -24,655 35,601 9,829 1,350 163,565 3,834 762 0 620,973
% Share
Key Players by Sector Oil & Gas Renewables Power Generation and T&D
• Bharat Petroleum• Hinustan Petroleum• Indian Oil• ONGC• Cairn Energy (private)• Essar Oil (private)• Reliance (private)• Ministry of Petroleum and Natural Gas
• Suzlon (priavte)• Tata BP Solar (private)• Moser Baer (private)• Orient Green Power (private)• Greenko (private)• Ministry of New and Renewable• Energies
• NTPC• NHPC• NPCI• Power Grid Corporation of India• Tata Power (private)• Ministry of Power• Ministry of Coal• Department of Atomic Energy • Bureau of Energy Efficiency• Central Electrical Authority• Central Electricity Regulatory Commission
42,1%27,3%
-4,0%
5,7% 1,6% 0,2%26,3%
0,6% 0,1% 0,0%
8 New Energy Architecture India
KPI 2008 2000 1990 Cumulative index change 1990-2008Index Actual Index Actual Index* Actual
EAPI 1.02 0.84 0.69
Economic Growth and Development 0.42 0.37 0.28
GDP (PPP) per capita (current USD)/capita 0.05 2,064 0.03 1,270 0.01 776
HDI 0.21 0.51 0.09 0.44 0.00 0.39
Cost of energy imports as a share of GDP (%) 0.49 10.23% 0.82 3.88% 0.89 2.40%
Energy intensity GDP (PPP) per toe 0.59 0.19 0.29 0.29 0.00 0.42
Share of mineral products in export (%) 0.65 30.92% 0.67 28.61% 0.67 28.61%
Environmental Sustainability 0.19 0.05 0.05
Carbon intensity of energy use (tCO2/2000 USD) 0.26 1.38 0.10 1.67 0.09 1.69
Share of non-carbon energy sources(%) 0.12 2.42% 0.12 2.39% 0.12 2.44%
Outdoor air pollution (PM10 [mg/m3] p.a.) 0.38 59,23 0.00 92.88 0.00 110.55
Water scarcity (withdrawals/internal resources) 0.00 47.84% 0.00 47.84% 0.00 39.18%
Energy Access & Security 0.41 0.41 0.36
Import dependence/TPES (%) 0.32 24.58% 0.34 20.25% 0.38 8.49%
Quality of electricity supply (0-7) 0.24 3.15 0.29 3.20 0.29 3.20
Access to modern forms of energy(%) 0.23 59.69% 0.03 74.00% 0.03 74.00%
Diversity of supply (0-1) 0.83 0.69 0.83 0.69 0.79 0.67
Step 1: Assessing Current Energy Architecture Performance
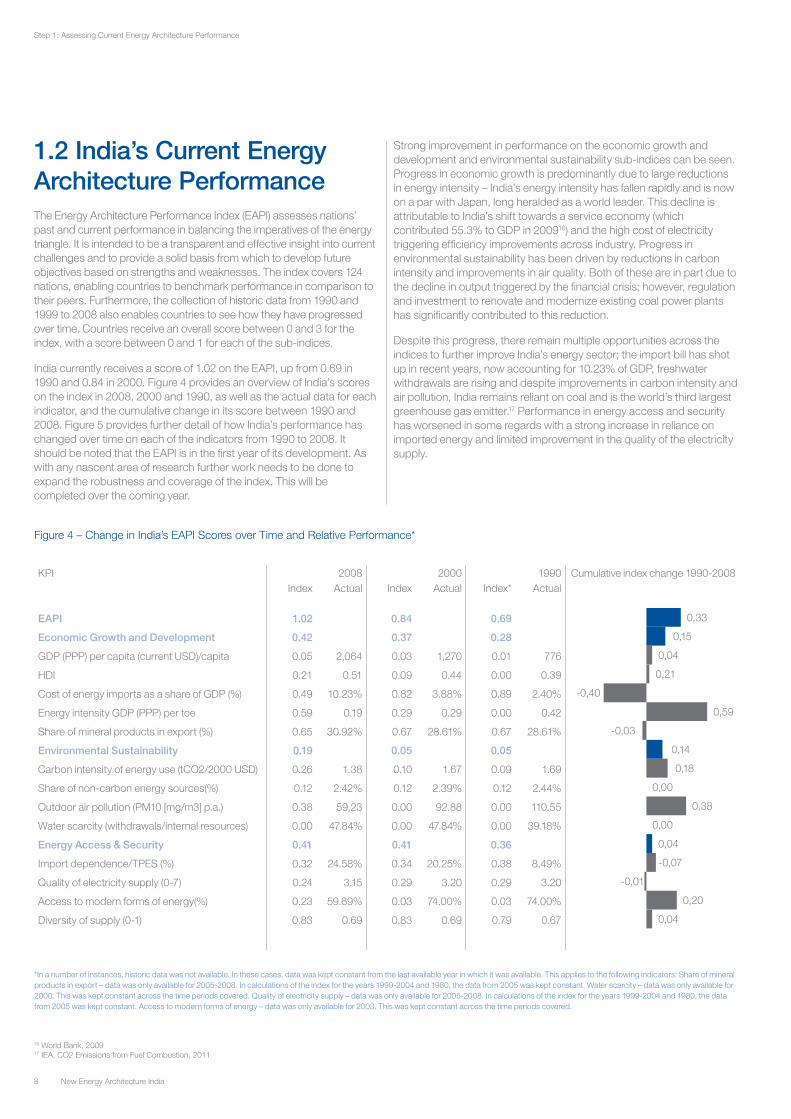
The Energy Architecture Performance Index (EAPI) assesses nations’ past and current performance in balancing the imperatives of the energy triangle. It is intended to be a transparent and effective insight into current challenges and to provide a solid basis from which to develop future objectives based on strengths and weaknesses. The index covers 124 nations, enabling countries to benchmark performance in comparison to their peers. Furthermore, the collection of historic data from 1990 and 1999 to 2008 also enables countries to see how they have progressed over time. Countries receive an overall score between 0 and 3 for the index, with a score between 0 and 1 for each of the sub-indices.
India currently receives a score of 1.02 on the EAPI, up from 0.69 in 1990 and 0.84 in 2000. Figure 4 provides an overview of India’s scores on the index in 2008, 2000 and 1990, as well as the actual data for each indicator, and the cumulative change in its score between 1990 and 2008. Figure 5 provides further detail of how India’s performance has changed over time on each of the indicators from 1990 to 2008. It should be noted that the EAPI is in the first year of its development. As with any nascent area of research further work needs to be done to expand the robustness and coverage of the index. This will be completed over the coming year.
Strong improvement in performance on the economic growth and development and environmental sustainability sub-indices can be seen. Progress in economic growth is predominantly due to large reductions in energy intensity – India’s energy intensity has fallen rapidly and is now on a par with Japan, long heralded as a world leader. This decline is attributable to India’s shift towards a service economy (which contributed 55.3% to GDP in 200916) and the high cost of electricity triggering efficiency improvements across industry. Progress in environmental sustainability has been driven by reductions in carbon intensity and improvements in air quality. Both of these are in part due to the decline in output triggered by the financial crisis; however, regulation and investment to renovate and modernize existing coal power plants has significantly contributed to this reduction.
Despite this progress, there remain multiple opportunities across the indices to further improve India’s energy sector; the import bill has shot up in recent years, now accounting for 10.23% of GDP, freshwater withdrawals are rising and despite improvements in carbon intensity and air pollution, India remains reliant on coal and is the world’s third largest greenhouse gas emitter.17 Performance in energy access and security has worsened in some regards with a strong increase in reliance on imported energy and limited improvement in the quality of the electricity supply.
1.2 India’s Current Energy Architecture Performance
Figure 4 – Change in India’s EAPI Scores over Time and Relative Performance*
*In a number of instances, historic data was not available. In these cases, data was kept constant from the last available year in which it was available. This applies to the following indicators: Share of mineral products in export – data was only available for 2005-2008. In calculations of the index for the years 1999-2004 and 1980, the data from 2005 was kept constant. Water scarcity – data was only available for 2000. This was kept constant across the time periods covered. Quality of electricity supply – data was only available for 2005-2008. In calculations of the index for the years 1999-2004 and 1980, the data from 2005 was kept constant. Access to modern forms of energy – data was only available for 2003. This was kept constant across the time periods covered.
0,33
0,15
0,04
0,21
0,59
0,38
0,14
0,00
0,04
0,18
0,00
-0,07
0,20
0,04
-0,01
-0,40
-0,03
16 World Bank, 200917 IEA, CO2 Emissions from Fuel Combustion, 2011
9New Energy Architecture India
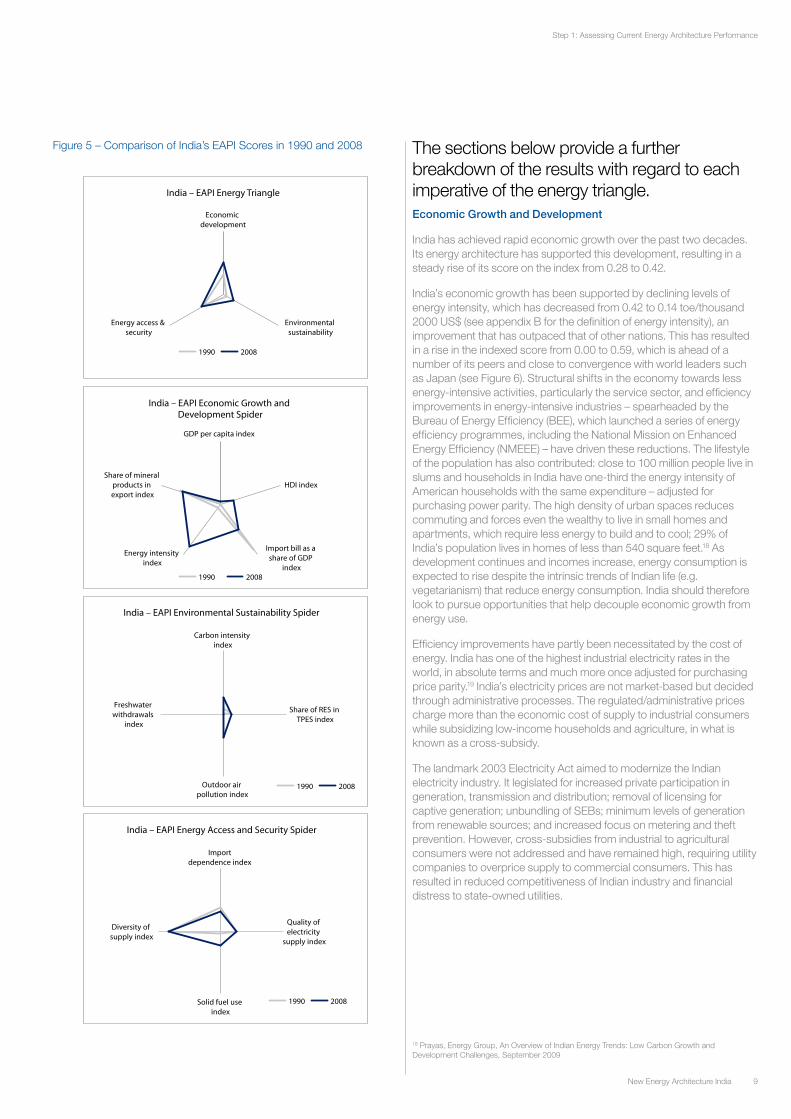
The sections below provide a further breakdown of the results with regard to each imperative of the energy triangle.Economic Growth and Development
India has achieved rapid economic growth over the past two decades. Its energy architecture has supported this development, resulting in a steady rise of its score on the index from 0.28 to 0.42.
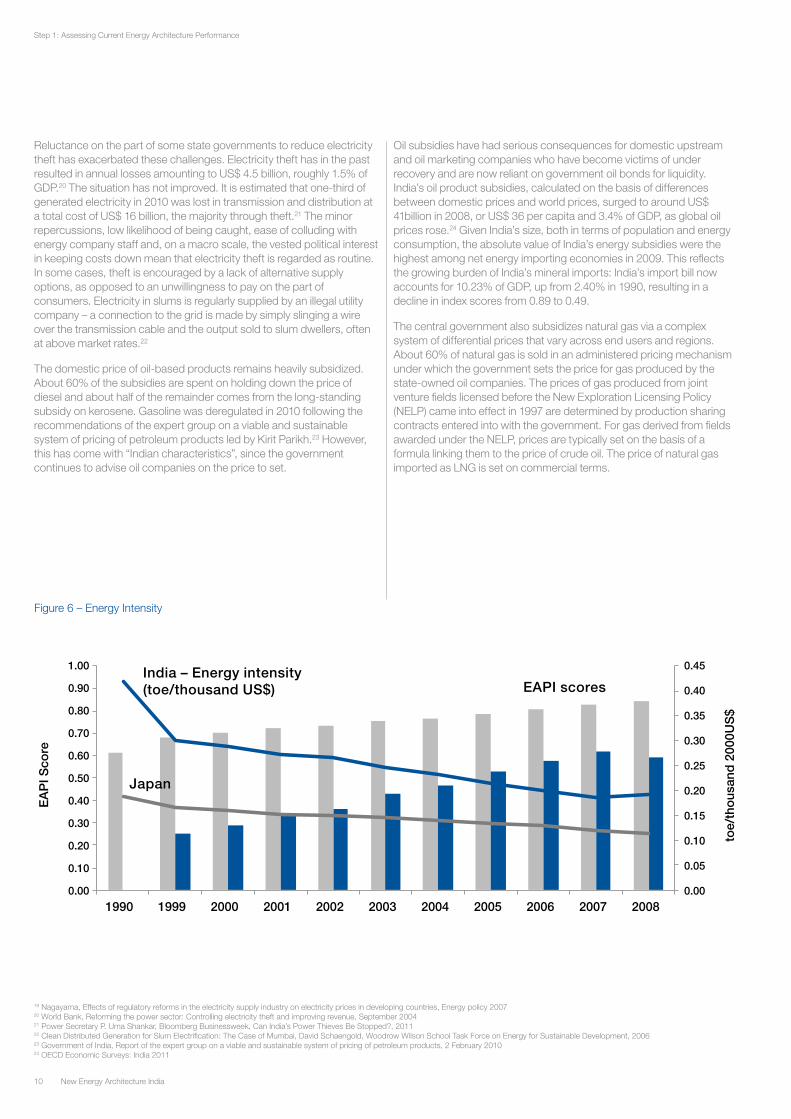
India’s economic growth has been supported by declining levels of energy intensity, which has decreased from 0.42 to 0.14 toe/thousand 2000 US$ (see appendix B for the definition of energy intensity), an improvement that has outpaced that of other nations. This has resulted in a rise in the indexed score from 0.00 to 0.59, which is ahead of a number of its peers and close to convergence with world leaders such as Japan (see Figure 6). Structural shifts in the economy towards less energy-intensive activities, particularly the service sector, and efficiency improvements in energy-intensive industries – spearheaded by the Bureau of Energy Efficiency (BEE), which launched a series of energy efficiency programmes, including the National Mission on Enhanced Energy Efficiency (NMEEE) – have driven these reductions. The lifestyle of the population has also contributed: close to 100 million people live in slums and households in India have one-third the energy intensity of American households with the same expenditure – adjusted for purchasing power parity. The high density of urban spaces reduces commuting and forces even the wealthy to live in small homes and apartments, which require less energy to build and to cool; 29% of India’s population lives in homes of less than 540 square feet.18 As development continues and incomes increase, energy consumption is expected to rise despite the intrinsic trends of Indian life (e.g. vegetarianism) that reduce energy consumption. India should therefore look to pursue opportunities that help decouple economic growth from energy use.
Efficiency improvements have partly been necessitated by the cost of energy. India has one of the highest industrial electricity rates in the world, in absolute terms and much more once adjusted for purchasing price parity.19 India’s electricity prices are not market-based but decided through administrative processes. The regulated/administrative prices charge more than the economic cost of supply to industrial consumers while subsidizing low-income households and agriculture, in what is known as a cross-subsidy.
The landmark 2003 Electricity Act aimed to modernize the Indian electricity industry. It legislated for increased private participation in generation, transmission and distribution; removal of licensing for captive generation; unbundling of SEBs; minimum levels of generation from renewable sources; and increased focus on metering and theft prevention. However, cross-subsidies from industrial to agricultural consumers were not addressed and have remained high, requiring utility companies to overprice supply to commercial consumers. This has resulted in reduced competitiveness of Indian industry and financial distress to state-owned utilities.
Figure 5 – Comparison of India’s EAPI Scores in 1990 and 2008
18 Prayas, Energy Group, An Overview of Indian Energy Trends: Low Carbon Growth and Development Challenges, September 2009
Step 1: Assessing Current Energy Architecture Performance
Economic development
Environmental sustainability
Energy access & security
India – EAPI Energy Triangle
1990 2008
GDP per capita index
HDI index
Import bill as a share of GDP
index
Energy intensity index
Share of mineral products in export index
India – EAPI Economic Growth and Development Spider
1990 2008
Carbon intensity index
Share of RES in TPES index
Outdoor air pollution index
Freshwater withdrawals
index
India – EAPI Environmental Sustainability Spider
1990 2008
Import dependence index
Quality of electricity
supply index
Solid fuel use index
Diversity of supply index
India – EAPI Energy Access and Security Spider
1990 2008
10 New Energy Architecture India
Reluctance on the part of some state governments to reduce electricity theft has exacerbated these challenges. Electricity theft has in the past resulted in annual losses amounting to US$ 4.5 billion, roughly 1.5% of GDP.20 The situation has not improved. It is estimated that one-third of generated electricity in 2010 was lost in transmission and distribution at a total cost of US$ 16 billion, the majority through theft.21 The minor repercussions, low likelihood of being caught, ease of colluding with energy company staff and, on a macro scale, the vested political interest in keeping costs down mean that electricity theft is regarded as routine. In some cases, theft is encouraged by a lack of alternative supply options, as opposed to an unwillingness to pay on the part of consumers. Electricity in slums is regularly supplied by an illegal utility company – a connection to the grid is made by simply slinging a wire over the transmission cable and the output sold to slum dwellers, often at above market rates.22
The domestic price of oil-based products remains heavily subsidized. About 60% of the subsidies are spent on holding down the price of diesel and about half of the remainder comes from the long-standing subsidy on kerosene. Gasoline was deregulated in 2010 following the recommendations of the expert group on a viable and sustainable system of pricing of petroleum products led by Kirit Parikh.23 However, this has come with “Indian characteristics”, since the government continues to advise oil companies on the price to set.
Oil subsidies have had serious consequences for domestic upstream and oil marketing companies who have become victims of under recovery and are now reliant on government oil bonds for liquidity. India’s oil product subsidies, calculated on the basis of differences between domestic prices and world prices, surged to around US$ 41billion in 2008, or US$ 36 per capita and 3.4% of GDP, as global oil prices rose.24 Given India’s size, both in terms of population and energy consumption, the absolute value of India’s energy subsidies were the highest among net energy importing economies in 2009. This reflects the growing burden of India’s mineral imports: India’s import bill now accounts for 10.23% of GDP, up from 2.40% in 1990, resulting in a decline in index scores from 0.89 to 0.49.
The central government also subsidizes natural gas via a complex system of differential prices that vary across end users and regions. About 60% of natural gas is sold in an administered pricing mechanism under which the government sets the price for gas produced by the state-owned oil companies. The prices of gas produced from joint venture fields licensed before the New Exploration Licensing Policy (NELP) came into effect in 1997 are determined by production sharing contracts entered into with the government. For gas derived from fields awarded under the NELP, prices are typically set on the basis of a formula linking them to the price of crude oil. The price of natural gas imported as LNG is set on commercial terms.
0.00
0.05
0.10
0.15
0.20
0.25
0.30
0.35
0.40
0.45
0.00
0.10
0.20
0.30
0.40
0.50
0.60
0.70
0.80
0.90
1.00
1990 1999 2000 2001 2002 2003 2004 2005 2006 2007 2008
toe/
tho
usan
d 2
000U
S$
EA
PI S
core
India – Energy intensity(toe/thousand US$)
India – PM10 level
India – Share of imports in TPES
EAPI China
China
EAPI Scores
EAPI scores
Japan
0.00
20.00
40.00
60.00
80.00
100.00
120.00
140.00
0.00
0.10
0.20
0.30
0.40
0.50
0.60
0.70
0.80
0.90
1.00
1990 1999 2000 2001 2002 2003 2004 2005 2006 2007 2008
PM
10 [m
g/m
3] p
.a.
EA
PI S
core
-5.00
0.00
5.00
10.00
15.00
20.00
25.00
30.00
0.00
0.10
0.20
0.30
0.40
0.50
0.60
0.70
0.80
0.90
1.00
1990 1999 2000 2001 2002 2003 2004 2005 2006 2007 2008
Net
imp
ort
s/T
PE
S (%
)
EA
PI S
core
Figure 6 – Energy Intensity
19 Nagayama, Effects of regulatory reforms in the electricity supply industry on electricity prices in developing countries, Energy policy 200720 World Bank, Reforming the power sector: Controlling electricity theft and improving revenue, September 200421 Power Secretary P. Uma Shankar, Bloomberg Businessweek, Can India’s Power Thieves Be Stopped?, 201122 Clean Distributed Generation for Slum Electrification: The Case of Mumbai, David Schaengold, Woodrow Wilson School Task Force on Energy for Sustainable Development, 200623 Government of India, Report of the expert group on a viable and sustainable system of pricing of petroleum products, 2 February 201024 OECD Economic Surveys: India 2011
Step 1: Assessing Current Energy Architecture Performance

11New Energy Architecture India
Environmental Sustainability
Despite continuing reliance on coal, India has improved the environmental sustainability of its energy architecture. India’s score on the environmental sustainability index has risen from 0.05 in 1990 to 0.19 in 2008. Key drivers include the growth of renewable energy in power generation and reductions in air pollution. India’s per capita emissions (1.25 tons) are also well below the global average.
Progress should not be overstated. India is the fourth largest emitter of global greenhouse gas emissions after China, the US and Russia. Furthermore, recent improvements in carbon intensity can be partially attributed to the affect of the economic downturn. Between 2007 and 2009, the annual growth rate for electricity demand fell from 7.1% to 0.9%, which can be largely attributed to a downturn in industrial output during the global economic crisis.25 Much more can be done to combat carbon emissions: a government report suggests that with a reasonable package of measures, India’s carbon intensity can be reduced by 23 to 25% from its 2005 level.26
Spearheaded by a dedicated Ministry for New and Renewable Energy, renewables have become an integral part of the government’s energy strategy. Since 2000, capacity additions from renewables (excluding large hydro) have comprised nearly one-quarter of total additions in the Indian power sector, and almost half with large hydro.27 However, the share of non-carbon sources in total primary energy supplies as a whole has remained marginal, with gains in the share of renewables in the electricity sector offset by a growing demand for petroleum products in the transportation sector. This has meant that India’s score on this indicator has remained stagnant.
Renovation, modernization and life extension programmes have led to the reduction of air pollution from thermal coal-fired plants. This has resulted in a decrease in air pollution from 110.55 to 59.20 PM10 (mg/m3 per annum), and a concurrent uptick in index performance from 0 to 0.38. Despite this, the overall pollution level remains relatively high due to a rapid increase in the vehicle population and continued use of coal for industrial and energy purposes. According to the Central Pollution Control Board, in 2007 47% of the ambient air pollution monitoring stations reported the level of solid particulate matters exceeding the National Ambient Air Quality Standards by a factor of 1.5.28
Growing water scarcity is being recognized as an important problem facing India. Freshwater withdrawals have increased from 39.18% to 47.84%, giving it a score of 0 on this index, indicating that urgent action is needed. Water use is directly linked to energy supply, availability and price. Water pumping for agriculture accounts for 25-30% of electrical energy consumption in India.29 Low power-tariffs and unmetered supply of power, especially at unregulated times and frequency, lead to wastage of water. The use of water by thermal power plants has shown to be eight times higher per kWh in India than in the world’s most efficient plants.30
0.00
0.05
0.10
0.15
0.20
0.25
0.30
0.35
0.40
0.45
0.00
0.10
0.20
0.30
0.40
0.50
0.60
0.70
0.80
0.90
1.00
1990 1999 2000 2001 2002 2003 2004 2005 2006 2007 2008
toe/
tho
usan
d 2
000U
S$
EA
PI S
core
India – Energy intensity(toe/thousand US$)
India – PM10 level
India – Share of imports in TPES
EAPI China
China
EAPI Scores
EAPI scores
Japan
0.00
20.00
40.00
60.00
80.00
100.00
120.00
140.00
0.00
0.10
0.20
0.30
0.40
0.50
0.60
0.70
0.80
0.90
1.00
1990 1999 2000 2001 2002 2003 2004 2005 2006 2007 2008
PM
10 [m
g/m
3] p
.a.
EA
PI S
core
-5.00
0.00
5.00
10.00
15.00
20.00
25.00
30.00
0.00
0.10
0.20
0.30
0.40
0.50
0.60
0.70
0.80
0.90
1.00
1990 1999 2000 2001 2002 2003 2004 2005 2006 2007 2008
Net
imp
ort
s/T
PE
S (%
)
EA
PI S
core
Figure 7 – Outdoor Air Pollution
25 The Impact of the Financial and Economic Crisis on Global Energy Investment, IEA Background paper for the G8 Energy Ministers’ Meeting 24-25 May 200926 Planning Commission, Government of India, Low Carbon Strategies for Inclusive Growth: An Interim Report, May 201127 Prayas, Energy Group, An Overview of Indian Energy Trends: Low Carbon Growth and Development Challenges, September 200928 Central Pollution Control Board, 2007; Annual Report for 2006-2007, New Delhi29 Confederation of Indian Industry, Building a Low-Carbon Economy, 200830 CSE India, Water Use in India, Chandra Bhushan
Step 1: Assessing Current Energy Architecture Performance
12 New Energy Architecture India
Energy Access and Security
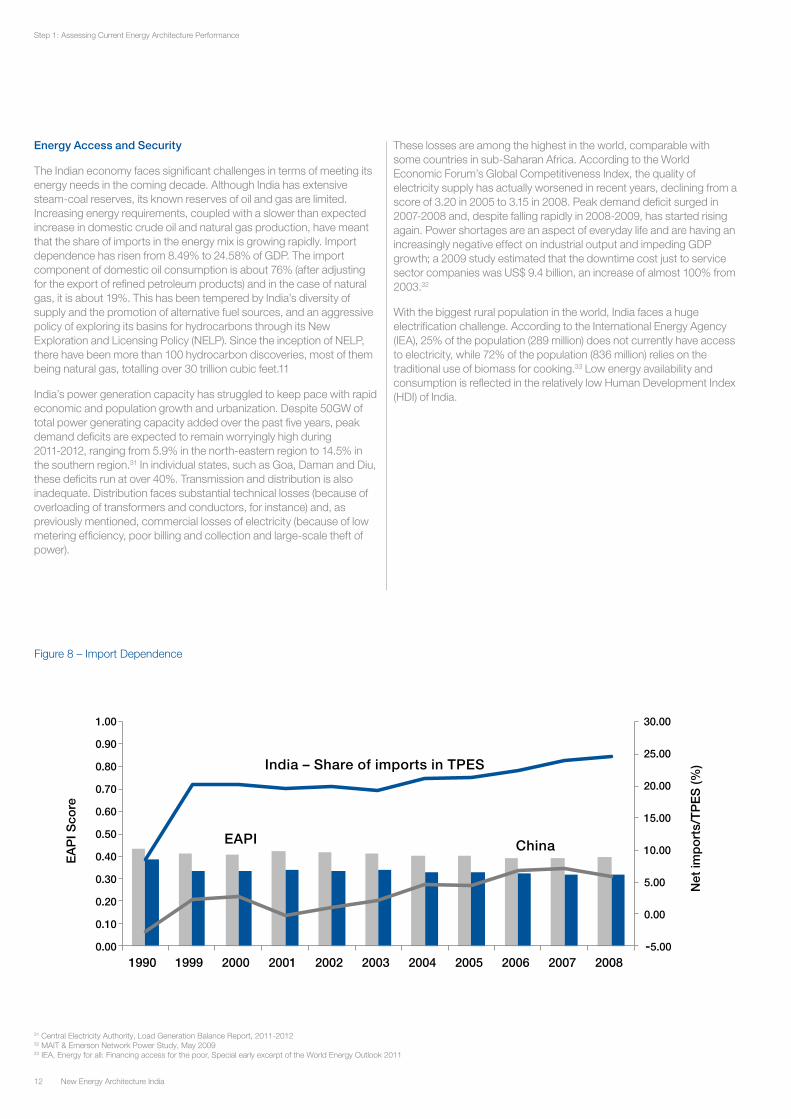
The Indian economy faces significant challenges in terms of meeting its energy needs in the coming decade. Although India has extensive steam-coal reserves, its known reserves of oil and gas are limited. Increasing energy requirements, coupled with a slower than expected increase in domestic crude oil and natural gas production, have meant that the share of imports in the energy mix is growing rapidly. Import dependence has risen from 8.49% to 24.58% of GDP. The import component of domestic oil consumption is about 76% (after adjusting for the export of refined petroleum products) and in the case of natural gas, it is about 19%. This has been tempered by India’s diversity of supply and the promotion of alternative fuel sources, and an aggressive policy of exploring its basins for hydrocarbons through its New Exploration and Licensing Policy (NELP). Since the inception of NELP, there have been more than 100 hydrocarbon discoveries, most of them being natural gas, totalling over 30 trillion cubic feet.11
India’s power generation capacity has struggled to keep pace with rapid economic and population growth and urbanization. Despite 50GW of total power generating capacity added over the past five years, peak demand deficits are expected to remain worryingly high during 2011-2012, ranging from 5.9% in the north-eastern region to 14.5% in the southern region.31 In individual states, such as Goa, Daman and Diu, these deficits run at over 40%. Transmission and distribution is also inadequate. Distribution faces substantial technical losses (because of overloading of transformers and conductors, for instance) and, as previously mentioned, commercial losses of electricity (because of low metering efficiency, poor billing and collection and large-scale theft of power).
These losses are among the highest in the world, comparable with some countries in sub-Saharan Africa. According to the World Economic Forum’s Global Competitiveness Index, the quality of electricity supply has actually worsened in recent years, declining from a score of 3.20 in 2005 to 3.15 in 2008. Peak demand deficit surged in 2007-2008 and, despite falling rapidly in 2008-2009, has started rising again. Power shortages are an aspect of everyday life and are having an increasingly negative effect on industrial output and impeding GDP growth; a 2009 study estimated that the downtime cost just to service sector companies was US$ 9.4 billion, an increase of almost 100% from 2003.32
With the biggest rural population in the world, India faces a huge electrification challenge. According to the International Energy Agency (IEA), 25% of the population (289 million) does not currently have access to electricity, while 72% of the population (836 million) relies on the traditional use of biomass for cooking.33 Low energy availability and consumption is reflected in the relatively low Human Development Index (HDI) of India.
0.00
0.05
0.10
0.15
0.20
0.25
0.30
0.35
0.40
0.45
0.00
0.10
0.20
0.30
0.40
0.50
0.60
0.70
0.80
0.90
1.00
1990 1999 2000 2001 2002 2003 2004 2005 2006 2007 2008
toe/
tho
usan
d 2
000U
S$
EA
PI S
core
India – Energy intensity(toe/thousand US$)
India – PM10 level
India – Share of imports in TPES
EAPI China
China
EAPI Scores
EAPI scores
Japan
0.00
20.00
40.00
60.00
80.00
100.00
120.00
140.00
0.00
0.10
0.20
0.30
0.40
0.50
0.60
0.70
0.80
0.90
1.00
1990 1999 2000 2001 2002 2003 2004 2005 2006 2007 2008
PM
10 [m
g/m
3] p
.a.
EA
PI S
core
-5.00
0.00
5.00
10.00
15.00
20.00
25.00
30.00
0.00
0.10
0.20
0.30
0.40
0.50
0.60
0.70
0.80
0.90
1.00
1990 1999 2000 2001 2002 2003 2004 2005 2006 2007 2008
Net
imp
ort
s/T
PE
S (%
)
EA
PI S
core
Figure 8 – Import Dependence
31 Central Electricity Authority, Load Generation Balance Report, 2011-201232 MAIT & Emerson Network Power Study, May 200933 IEA, Energy for all: Financing access for the poor, Special early excerpt of the World Energy Outlook 2011
Step 1: Assessing Current Energy Architecture Performance

13New Energy Architecture India
1.3 Comparing India’s Current Energy Architecture Performance with the Grow Archetype
The results of the Energy Architecture Performance Index (EAPI) must be read in context, paying particular heed to the structure of India’s economy. Contextual differences mean that energy architectures will look very different in different countries, affecting performance on the index. For example, India’s large rural population makes issues around the distribution of energy a particular challenge.
To account for such differences, studies on energy transitions often take a regional perspective. However, there is considerable heterogeneity among countries within single regions. In recognition of this, the EAPI has been used to create a series of archetypes, grouping countries that face similar challenges in their current energy architecture, and who therefore have a similar objective for the transition to a New Energy Architecture. This process has resulted in the identification of four archetypes: Rationalize, Capitalize, Grow and Access.
India falls within the Grow archetype. Countries within this archetype have energy architectures that are focused on securing continued and rapid economic growth. Their focus is on alleviating supply bottlenecks, to reduce supply-demand deficits. Key opportunities for these countries lie in bringing new forms of supply online and delivering it more effectively to consumers and doing so at a market-based price. It consists principally of countries that are going through a rapid growth phase, such as those in East Asia and Central and Eastern Europe. They feature growing urban populations, but many also have large rural hinterlands. Due to the growing strain of economic growth, physical infrastructure often falls short of national needs, despite increasing investment. Many of these countries experience peak supply deficits and regular black-outs. The challenge for these countries is to increase reliability, ensure that power supplies keep up with economic growth, and avoid shortfalls that constrain growth.
Figure 9 reports the scores and actual data for India and a select group of Grow nations. Figure 10 is a heat map that complements the raw scores, allowing for a reading of India’s performance in the EAPI in relative terms. It provides a sense of the distance in scores that separates India from other members of the Grow archetype. Blue-shaded cells and grey-shaded cells indicate that India scores or ranks respectively higher or lower than the comparator, while no shading means that there is no significant divergence. The darker the shading, the greater the difference in performance.
The heat map mirrors India’s atypical performance pattern described above. Relative weak points include human development, water scarcity and the proportion of the population using solid fuels, underlining that India faces significant challenges in relation to energy access in comparison to its peers. Relative strengths include energy intensity and diversity of supply. The figure shows that India is outperformed by its peers across the three imperatives of the energy triangle – China is stronger on 10 out of the 17 indicators. This underlines the significant opportunities for improving India’s energy system.
Figure 9 – EAPI Results for India and Selected Comparators from the Grow Archetype
Economic Growth and Development GDP per capita HDI index Import bill as a
share of GDP Energy intensity Share of mineral products in export
Country KPI Raw KPI Raw KPI Raw KPI Raw KPI Raw
Chile 0.30 11277 0.71 0.78 0.57 0.09 0.78 0.14 0.74 23.24
Hungary 0.44 16217 0.76 0.80 0.29 0.14 0.77 0.14 0.96 3.81
India 0.05 2036.9 0.21 0.51 0.49 0.10 0.59 0.19 0.65 30.92
Indonesia 0.08 2983 0.36 0.59 0.62 0.08 0.46 0.24 0.62 33.46
Korea, Rep. 0.59 21630 0.39 0.12 0.64 0.18 0.90 9.45
Mexico 0.31 11646 0.65 0.75 0.90 0.02 0.84 0.12 0.79 18.46
China 0.09 3598.6 0.47 0.65 0.78 0.05 0.29 0.29 0.97 2.66
South Africa 0.21 7992.8 0.36 0.59 0.64 0.07 0.32 0.28 0.72 24.83
Thailand 0.17 6309.3 0.46 0.65 0.30 0.14 0.56 0.21 0.91 7.91
Turkey 0.26 9802 0.52 0.67 0.63 0.08 0.89 0.10 0.92 7.44
Vietnam 0.05 1937.2 0.38 0.13 0.36 0.27 0.77 20.72
Step 1: Assessing Current Energy Architecture Performance

14 New Energy Architecture India
*This heat map allows for a reading of India’s performance in the EAPI in relative terms. It provides a sense of the distance in scores that separates India from other members of the Grow archetype. Blue-shaded cells and grey-shaded cells indicate that India scores or ranks respectively higher or lower than the comparator, while no shading means that there is no significant divergence. The darker the shading, the greater the difference in performance.
Figure 10 – Heat Map Indicating Differences between India and Selected Archetype Comparators*
Environmental Sustainability Carbon intensity Share of non-carbon energy Outdoor air pollution Freshwater
withdrawals
Country KPI Raw KPI Raw KPI Raw KPI Raw
Chile 0.78 0.49 0.34 6.63 0.35 61.55 0.97 1.28
Hungary 0.79 0.48 0.77 15.16 0.90 15.60
India 0.26 1.38 0.12 2.42 0.38 59.23 0.00 47.84
Indonesia 0.37 1.19 0.39 7.68 0.22 72.35 0.87 5.61
Korea, Rep. 0.75 0.55 0.89 17.49 0.72 30.76
Mexico 0.78 0.48 0.34 6.73 0.70 32.69
China 0.00 2.14 0.18 3.53 0.30 65.61
South Africa 0.08 1.70 0.13 2.64 0.82 22.13 0.34 27.86
Thailand 0.32 1.28 0.03 0.57 0.42 55.31
Turkey 0.77 0.50 0.23 4.57 0.64 37.06 0.56 18.50
Vietnam 0.16 1.57 0.19 3.76 0.46 52.71
Energy Access and Security Import dependence Quality of electricity supply Solid fuel use Diversity of supply
Country KPI Raw KPI Raw KPI Raw KPI Raw
Chile 0.12 71.34 0.68 5.33 1.00 5.00 0.70 0.61
Hungary 0.17 60.33 0.68 5.29 1.00 5.00 0.88 0.73
India 0.32 24.58 0.24 3.15 0.23 59.69 0.83 0.69
Indonesia 0.73 -74.65 0.39 3.86 0.25 58.36 0.95 0.77
Korea, Rep. 0.08 80.29 0.85 6.15 1.00 5.00 0.87 0.72
Mexico 0.54 -29.34 0.42 4.03 0.86 15.00 0.66 0.59
China 0.40 5.82 0.56 4.72 0.40 48.00 0.54 0.52
South Africa 0.51 -21.16 0.29 3.36 0.83 17.27 0.46 0.47
Thailand 0.25 40.41 0.71 5.48 0.72 25.00 0.87 0.72
Turkey 0.12 70.58 0.45 4.15 0.88 0.72
Vietnam 0.50 -20.14 0.26 3.22 0.22 61.00 0.86 0.71
Country
India 0.42 0.05 0.20 0.49 0.59 0.65 0.19 0.26 0.12 0.38 0.00 0.41 0.32 0.24 0.23 0.83
Chile -0.22 -0.25 -0.50 -0.08 -0.18 -0.09 -0.42 -0.52 -0.21 0.03 -0.97 -0.22 0.20 -0.44 -0.77 0.13
Hungary -0.24 -0.39 -0.55 0.21 -0.18 -0.31 -0.63 -0.52 -0.64 -0.52 -0.28 0.15 -0.43 -0.77 -0.05
Indonesia -0.01 -0.03 -0.15 -0.13 0.14 0.03 -0.27 -0.11 -0.27 0.16 -0.87 -0.17 -0.42 -0.14 -0.02 -0.12
Korea, Rep. -0.21 -0.54 0.10 -0.05 -0.25 -0.59 -0.48 -0.76 -0.34 -0.29 0.23 -0.61 -0.77 -0.04
Mexico -0.29 -0.26 -0.44 -0.41 -0.25 -0.14 -0.42 -0.52 -0.22 -0.32 -0.22 -0.23 -0.18 -0.63 0.17
China -0.07 -0.04 -0.26 -0.29 0.31 -0.33 0.03 0.26 -0.06 0.08 -0.07 -0.08 -0.32 -0.16 0.29
South Africa -0.01 -0.16 -0.16 -0.15 0.28 -0.07 -0.15 0.18 -0.01 -0.44 -0.34 -0.11 -0.19 -0.04 -0.59 0.38
Thailand -0.07 -0.12 -0.26 0.19 0.04 -0.27 -0.07 -0.06 0.09 -0.05 -0.23 0.07 -0.47 -0.49 -0.04
Turkey -0.25 -0.21 -0.31 -0.14 -0.30 -0.27 -0.36 -0.51 -0.11 -0.27 -0.56 -0.08 0.19 -0.20 -0.05
Vietnam 0.04 0.00 0.12 0.24 -0.12 -0.08 0.11 -0.07 -0.08 -0.05 -0.19 -0.01 0.02 -0.03
Eco
nom
ic g
row
th
& d
evel
op
men
t
Impo
rt b
ill as
a
shar
e of
GD
P
Ene
rgy
inte
nsity
Sha
re o
f min
eral
pr
oduc
ts in
exp
ort
Env
ironm
enta
l su
stai
nab
ility
Car
bon
inte
nsity
Sha
re o
f non
-ca
rbon
ene
rgy
Out
door
air
pollu
tion
Ene
rgy
acce
ss &
se
curi
ty
Impo
rt d
epen
denc
e
Sol
id fu
el u
se
Qua
lity
of e
lect
ricity
su
pply
Fres
hwat
er
with
draw
als
GD
P p
er c
apita
HD
I
Score Difference -0.7 -0.4 -0.1 0.1 0.4 0.7
Div
ersi
ty o
f sup
ply
Step 1: Assessing Current Energy Architecture Performance
15New Energy Architecture India
Summary: Key Challenges for India’s Current Energy Architecture• Distorted energy prices: While some progress has been made in
liberalizing India’s energy sector, industrial energy costs are among the highest in the world, leading to a lack of competitiveness within certain sectors. Meanwhile, residential and agricultural electricity, diesel, kerosene and LPG prices are heavily subsidized, placing a burden on public finances and leading to inefficiencies in use and little motivation for private companies to invest in the industry.
• Air quality: Despite significant improvements, the overall pollution levels remain high due to rapid and sustained increases in vehicle ownership and continued inefficient combustion of low-quality coal.
• Water scarcity: Freshwater withdrawals have increased from 39.18% to 47.84% as energy, agricultural and industrial output rises, a trend that is forecast to continue. Urgent action is required to ensure the continued availability of fresh water to consumers.
• Growing import dependence: Stagnant efficiencies, increasing energy requirements, and a slower than expected increases in domestic fuel production have meant that import dependence has risen from 8.49% to 24.58%.
• Unreliable grid: India has some of the highest transmission and distribution losses in the world. The quality of electricity supply has worsened over recent years with power shortages being routine, continued voltage fluctuations and inability to meet peak demand.
• Energy poverty: 72% of the population continues to rely on biomass-based fuels for cooking, and 289 million people lack access to electricity, giving India a sub-par performance with regard to energy access in comparison to its peers.
Step 1: Assessing Current Energy Architecture Performance

16 New Energy Architecture India
Step 2: Creating New Energy Architecture Objectives
17New Energy Architecture India
Step 2: Creating New Energy Architecture Objectives
A consideration of India’s performance on the EAPI helps highlight the challenges that its energy architecture faces. It helps provide a foundation for identifying a set of objectives for the creation of a New Energy Architecture in India that is more responsive to the imperatives of the energy triangle.35 These objectives were further shaped and tested during a series of interviews with a range of representatives from across the energy value chain, as well as through a multistakeholder workshop conducted during the India Economic Summit. The objectives below therefore represent the participants’ suggestions of the issues that India should focus on.
In shaping these objectives, the existing government targets have been taken into account. India has a core objective of achieving sustainable and inclusive growth and has provisionally set a 9% GDP growth target as part of the 12th Five Year Plan (2012-2017), which will require energy supply to grow at 6.5% per annum.36 This represents a significantly increased growth target for the sector than in the past. The focus for the coming years will therefore be on supporting economic growth by providing a secure supply of energy. Indeed, “inability to meet energy demand could be the single biggest constraining factor to India’s growth story.”37 This will require India to bring new forms of supply online, deliver it more effectively to consumers (both urban and rural), and do so at a market-based price (based upon the eventual eradication of subsidies) that sends appropriate signals to both the demand and supply sides.
India has a responsibility to achieve its growth trajectory in an environmentally sustainable manner, and has set a voluntary target to cut the emissions intensity of GDP by 20-25% by 2020 compared with 2005 levels.38 Therefore, the way forward should be to identify common ground between climate change policy and economic growth and pursue measures that achieve both. Considering that there needs to be a significant expansion in energy infrastructure, India has an opportunity to pursue development while managing emissions growth, enhancing its energy security and creating world-scale clean technology industries. India should therefore not look to copy the Western model of energy infrastructure development, and instead pursue a development path that is particular to its local conditions. This would require that India leapfrog inefficient technologies, assets and practices and deploy ones that are more efficient and less emission intensive, with a key opportunity being the expansion of decentralized distribution and generation.
The following set of objectives are therefore focused on supporting improvement with regard to economic growth and development and energy access and security, but have been tailored to provide co-benefits with regard to environmental sustainability. They are intended to indicate what India’s focus should be in the near to medium term.
2.1 Defining India’s Objectives for a New Energy Architecture
34 Tulsi R. Tanti, Wind matters: Making the case for wind in India, Suzlon, 201135 These transition objectives are intended to indicate the focus that India will have over the course of the next 15-20 years, and are not intended to be exhaustive.36 Government of India, Planning Commission, Faster, Sustainable and More Inclusive Growth: An approach to the 12th Five Year Plan, August 201137 Interview participant, New Delhi, October 201138 Natural Resources Defense Council, From Copenhagen Accord to Climate Action: Tracking National Commitments to Curb Global Warming, http://www.nrdc.org/international/copenhagenaccords/
18 New Energy Architecture India
While [India’s] economic growth has touched millions, without energy security it
cannot be truly sustainable.
Tulsi R. TantiCEO, Suzlon34
Step 2: Creating New Energy Architecture Objectives
New Energy Architecture India18
19New Energy Architecture India
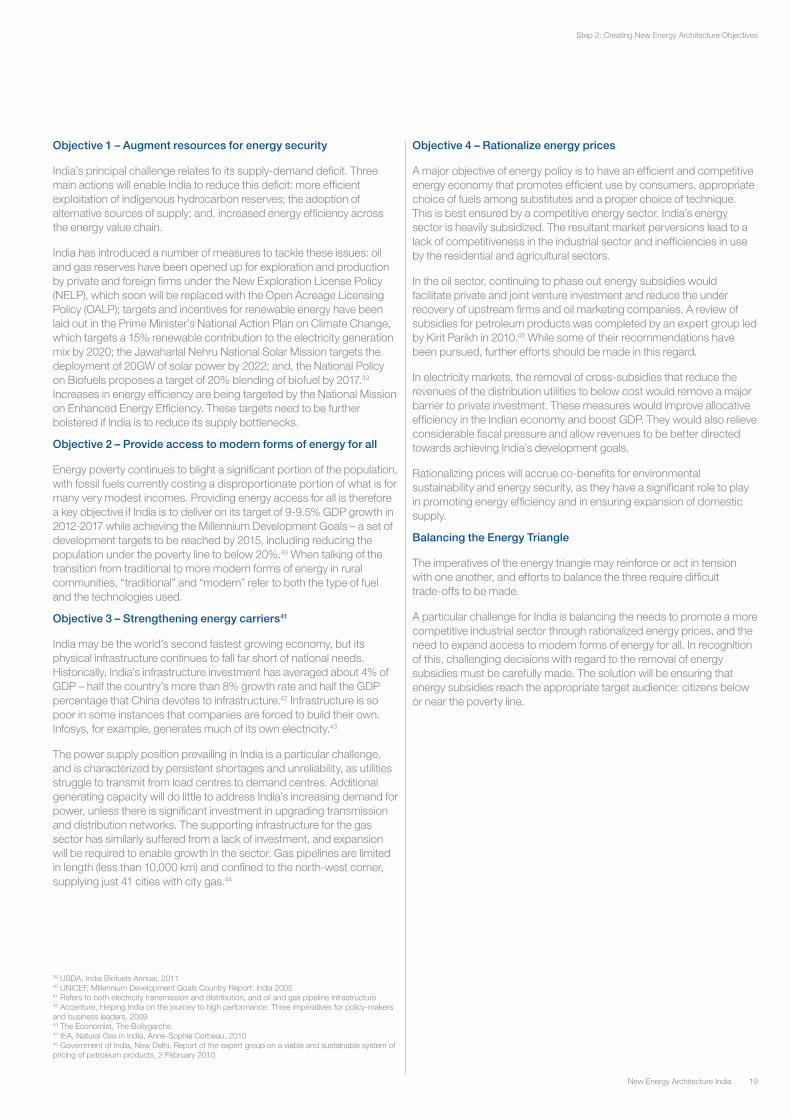
Objective 1 – Augment resources for energy security
India’s principal challenge relates to its supply-demand deficit. Three main actions will enable India to reduce this deficit: more efficient exploitation of indigenous hydrocarbon reserves; the adoption of alternative sources of supply; and, increased energy efficiency across the energy value chain.
India has introduced a number of measures to tackle these issues: oil and gas reserves have been opened up for exploration and production by private and foreign firms under the New Exploration License Policy (NELP), which soon will be replaced with the Open Acreage Licensing Policy (OALP); targets and incentives for renewable energy have been laid out in the Prime Minister’s National Action Plan on Climate Change, which targets a 15% renewable contribution to the electricity generation mix by 2020; the Jawaharlal Nehru National Solar Mission targets the deployment of 20GW of solar power by 2022; and, the National Policy on Biofuels proposes a target of 20% blending of biofuel by 2017.39 Increases in energy efficiency are being targeted by the National Mission on Enhanced Energy Efficiency. These targets need to be further bolstered if India is to reduce its supply bottlenecks.
Objective 2 – Provide access to modern forms of energy for all
Energy poverty continues to blight a significant portion of the population, with fossil fuels currently costing a disproportionate portion of what is for many very modest incomes. Providing energy access for all is therefore a key objective if India is to deliver on its target of 9-9.5% GDP growth in 2012-2017 while achieving the Millennium Development Goals – a set of development targets to be reached by 2015, including reducing the population under the poverty line to below 20%.40 When talking of the transition from traditional to more modern forms of energy in rural communities, “traditional” and “modern” refer to both the type of fuel and the technologies used.
Objective 3 – Strengthening energy carriers41
India may be the world’s second fastest growing economy, but its physical infrastructure continues to fall far short of national needs. Historically, India’s infrastructure investment has averaged about 4% of GDP – half the country’s more than 8% growth rate and half the GDP percentage that China devotes to infrastructure.42 Infrastructure is so poor in some instances that companies are forced to build their own. Infosys, for example, generates much of its own electricity.43
The power supply position prevailing in India is a particular challenge, and is characterized by persistent shortages and unreliability, as utilities struggle to transmit from load centres to demand centres. Additional generating capacity will do little to address India’s increasing demand for power, unless there is significant investment in upgrading transmission and distribution networks. The supporting infrastructure for the gas sector has similarly suffered from a lack of investment, and expansion will be required to enable growth in the sector. Gas pipelines are limited in length (less than 10,000 km) and confined to the north-west corner, supplying just 41 cities with city gas.44
Objective 4 – Rationalize energy prices
A major objective of energy policy is to have an efficient and competitive energy economy that promotes efficient use by consumers, appropriate choice of fuels among substitutes and a proper choice of technique. This is best ensured by a competitive energy sector. India’s energy sector is heavily subsidized. The resultant market perversions lead to a lack of competitiveness in the industrial sector and inefficiencies in use by the residential and agricultural sectors.
In the oil sector, continuing to phase out energy subsidies would facilitate private and joint venture investment and reduce the under recovery of upstream firms and oil marketing companies. A review of subsidies for petroleum products was completed by an expert group led by Kirit Parikh in 2010.45 While some of their recommendations have been pursued, further efforts should be made in this regard.
In electricity markets, the removal of cross-subsidies that reduce the revenues of the distribution utilities to below cost would remove a major barrier to private investment. These measures would improve allocative efficiency in the Indian economy and boost GDP. They would also relieve considerable fiscal pressure and allow revenues to be better directed towards achieving India’s development goals.
Rationalizing prices will accrue co-benefits for environmental sustainability and energy security, as they have a significant role to play in promoting energy efficiency and in ensuring expansion of domestic supply.
Balancing the Energy Triangle
The imperatives of the energy triangle may reinforce or act in tension with one another, and efforts to balance the three require difficult trade-offs to be made.
A particular challenge for India is balancing the needs to promote a more competitive industrial sector through rationalized energy prices, and the need to expand access to modern forms of energy for all. In recognition of this, challenging decisions with regard to the removal of energy subsidies must be carefully made. The solution will be ensuring that energy subsidies reach the appropriate target audience: citizens below or near the poverty line.
39 USDA, India Biofuels Annual, 201140 UNICEF, Millennium Development Goals Country Report: India 200541 Refers to both electricity transmission and distribution, and oil and gas pipeline infrastructure42 Accenture, Helping India on the journey to high performance: Three imperatives for policy-makers and business leaders, 200943 The Economist, The Bollygarchs44 IEA, Natural Gas in India, Anne-Sophie Corbeau, 201045 Government of India, New Delhi, Report of the expert group on a viable and sustainable system of pricing of petroleum products, 2 February 2010
Step 2: Creating New Energy Architecture Objectives

20 New Energy Architecture India
Step 3: Defining the Enabling Environment
21New Energy Architecture India
Step 3: Defining the Enabling Environment
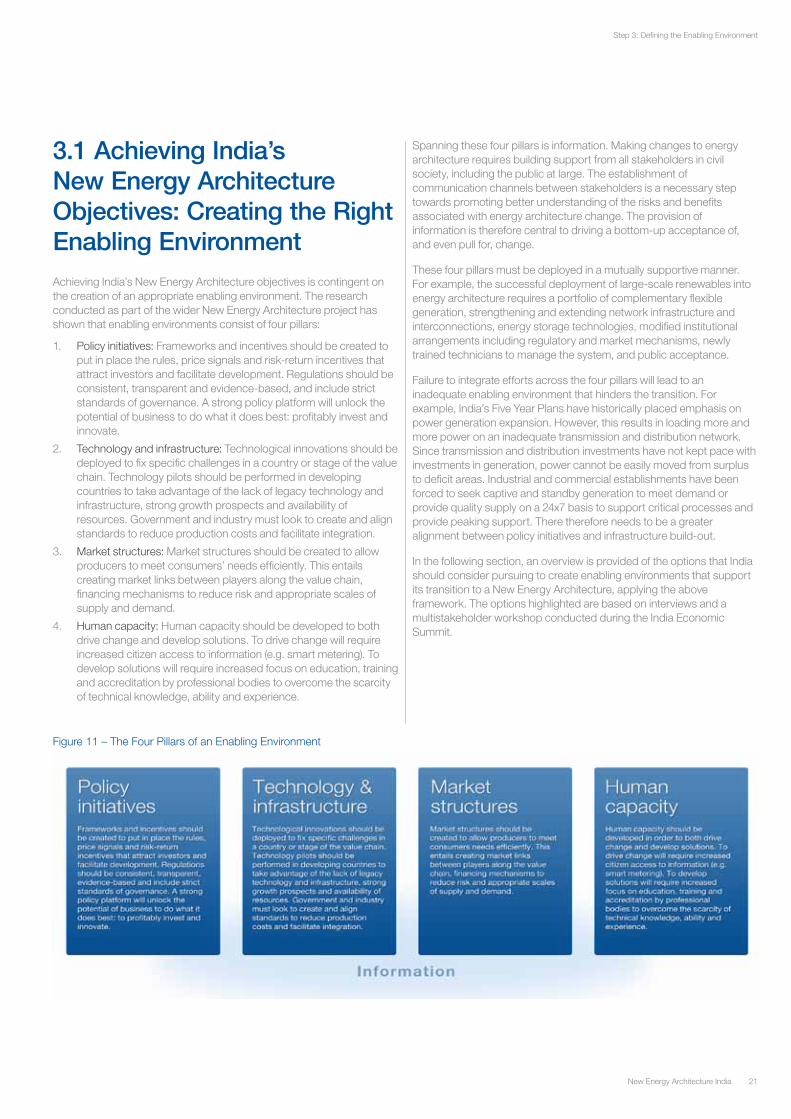
Achieving India’s New Energy Architecture objectives is contingent on the creation of an appropriate enabling environment. The research conducted as part of the wider New Energy Architecture project has shown that enabling environments consist of four pillars:
1. Policy initiatives: Frameworks and incentives should be created to put in place the rules, price signals and risk-return incentives that attract investors and facilitate development. Regulations should be consistent, transparent and evidence-based, and include strict standards of governance. A strong policy platform will unlock the potential of business to do what it does best: profitably invest and innovate.
2. Technology and infrastructure: Technological innovations should be deployed to fix specific challenges in a country or stage of the value chain. Technology pilots should be performed in developing countries to take advantage of the lack of legacy technology and infrastructure, strong growth prospects and availability of resources. Government and industry must look to create and align standards to reduce production costs and facilitate integration.
3. Market structures: Market structures should be created to allow producers to meet consumers’ needs efficiently. This entails creating market links between players along the value chain, financing mechanisms to reduce risk and appropriate scales of supply and demand.
4. Human capacity: Human capacity should be developed to both drive change and develop solutions. To drive change will require increased citizen access to information (e.g. smart metering). To develop solutions will require increased focus on education, training and accreditation by professional bodies to overcome the scarcity of technical knowledge, ability and experience.
Spanning these four pillars is information. Making changes to energy architecture requires building support from all stakeholders in civil society, including the public at large. The establishment of communication channels between stakeholders is a necessary step towards promoting better understanding of the risks and benefits associated with energy architecture change. The provision of information is therefore central to driving a bottom-up acceptance of, and even pull for, change.
These four pillars must be deployed in a mutually supportive manner. For example, the successful deployment of large-scale renewables into energy architecture requires a portfolio of complementary flexible generation, strengthening and extending network infrastructure and interconnections, energy storage technologies, modified institutional arrangements including regulatory and market mechanisms, newly trained technicians to manage the system, and public acceptance.
Failure to integrate efforts across the four pillars will lead to an inadequate enabling environment that hinders the transition. For example, India’s Five Year Plans have historically placed emphasis on power generation expansion. However, this results in loading more and more power on an inadequate transmission and distribution network. Since transmission and distribution investments have not kept pace with investments in generation, power cannot be easily moved from surplus to deficit areas. Industrial and commercial establishments have been forced to seek captive and standby generation to meet demand or provide quality supply on a 24x7 basis to support critical processes and provide peaking support. There therefore needs to be a greater alignment between policy initiatives and infrastructure build-out.
In the following section, an overview is provided of the options that India should consider pursuing to create enabling environments that support its transition to a New Energy Architecture, applying the above framework. The options highlighted are based on interviews and a multistakeholder workshop conducted during the India Economic Summit.
3.1 Achieving India’s New Energy Architecture Objectives: Creating the Right Enabling Environment
Figure 11 – The Four Pillars of an Enabling Environment

22 New Energy Architecture India
3.2 Defining Enabling Environments for India’s New Energy Architecture
Objective 1 – Augment resources for energy security
1.1 Create a policy framework that more effectively supports the involvement of international partners in upstream projects
The New Exploration Licensing Policy (NELP) was formulated in 1997-1998 to boost hydrocarbon exploration in India, providing a level playing field where exploration licenses would be granted on a competitive basis, thereby encouraging the participation of foreign and private oil companies. NELP was first implemented in January 1999, with the Ninth Round launched in October 2010.
The international response to NELP has been mixed, and in recent rounds there has been limited participation by international oil companies. Unstable fiscal policies, particularly the exemption of natural gas from tax breaks46, lack of reliable and comprehensive geologic data, and the opaque structure of the tendering process have driven the poor response – in NELP IX (2011), only eight foreign companies out of a total of 37 participated in NELP IX and out of these only two foreign companies were new entrants to the sector.47
The Open Acreage Licensing Policy (OALP) is designed to replace and overcome some of the issues with NELP but is not expected before 2013. The poor availability and quality of geologic data will be addressed with the creation of a National Resource Database (NDR) to create a definitive view of India’s resources, and four major oilfield service companies have already submitted bids for the work. Companies will bid for blocks that they delineate based on data from the NDR48 and the role of Oil and Natural Gas Corporation (ONGC) in the process will be reduced.
Attracting international partners to the sector is of fundamental importance if India’s oil companies are to build the capacities to exploit indigenous assets, particularly as conventional resources are exhausted and interest turns to more challenging resources (e.g. shale gas). Although Reliance Industries has been able to pursue such a strategy through BP’s acquisition of a stake in 23 exploration blocks, others have been unable to mimic this. Policy must continue to be developed to entice foreign companies to enter India and to govern exploration of non-conventional resources.
1.2 Expand and modernize the coal mining industry to enable foreign participation and full exploitation of indigenous resources
Over the next 20 years, coal will continue to play an important role in India’s energy architecture. Under its New Policies Scenario, the International Energy Agency estimates that India will double its coal use by 2035, displacing the US as the world’s second-largest coal consumer.49 Given the continuing role of coal in the energy mix, it is important that India take steps to ensure that domestic resources are able to meet growing demand, and do so in an environmentally sustainable way.
Coal production has increased dramatically since nationalization and has grown at 4% CAGR over the past decade. However, it has been outstripped by growth in the power industry (which accounts for 80% of consumption) leaving India increasingly reliant on imported coal.50 Coal resources are known to be extensive with a potential resource base of 248GT and proven reserves of 93GT. However, systematic exploration has been based on the coal industry’s perceptions of extraction, leaving extractable proven reserves of only 52GT.50 With increasing numbers of modern coal-fired power plants being built, it is conceivable that they may outlast domestic coal reserves. Without a clear picture of it coal position, India may commit to building power plants now that will affect its long-term dependence on imported coal. It must embark on renewed coal exploration to obtain a conclusive estimate of reserves, which can then be used to inform generation policy and capacity planning.
Shortcomings in exploration can be attributed in some part to the propensity for open cast mining, which has been favoured due to its low cost, quick access and high recovery rate. It accounts for over 80% of production, with 62% of explored areas showing coal at a depth of less than 300 m.50 The focus on open cast mining has led to chronic underinvestment in underground mining, which now lacks modern technology and mechanization.51 This lack of investment means that India is not capable of exploiting its considerable reserves of underground coal. As shallow coal becomes scarcer, this lack of capability may well impede continued growth in coal production.
Some Indian companies have ventured abroad to extract coal reserves in joint ventures and will acquire knowledge and technology to enable them to reach underground coal back home. However, Indian coal production must develop rapidly and significant technology and financial investments are required. These would most easily be acquired by opening up the industry to allow for foreign and private participation. Although some steps have been taken to change the regulation of the coal mining industry – allowing private firms to mine for captive generation – more steps are needed to encourage the involvement of international mining companies with the knowledge and technology needed to empower growth in Indian coal production.
Although abundant, Indian coal is mostly of low quality with high ash content and low calorific value. This has been exacerbated by open cast mining that increases the quantity of overburden mixed with the coal. Underground mining would go some way towards mitigating this, but the use of new technologies must also be encouraged; coal bed methane (CBM) and underground coal gasification (UCG) should also be encouraged. India’s coal bed methane (CBM) resource has been estimated at 50 trillion cubic feet52. Foreign and private participation has been encouraged. Essar Oil has recently started producing CBM from fields in West Bengal and has stated its intention to acquire more fields. The first underground coal gasification (UCG) project was put out to tender by Coal India earlier this year and has attracted bids from private Indian companies partnering with international mining firms (to provide the expertise). UCG is a cost-effective environmental solution for resource recovery in areas beyond the technical and economic confines of conventional mining. Both technologies are relatively recent and offer strong potential in India. Efforts should be continued to expand their application to India’s deep coal reserves.
46 Interview conducted with representative from private oil and gas company in New Delhi, October 201147 IHS Global Insight, India’s NELP IX licensing round supported by state oil companies but fails to attract IOC interest, 29 March 201148 Review of E&P Licensing Policy, Petroleum Federation of India, 200549 International Energy Agency, World Energy Outlook, 201150 Pew Centre, Coal Initiative Reports, A Resource and Technology Assessment of Coal Utilization in India, A Chikkatur, 200851 Forms of Mining in India, Indian Infrastructure, Sanjay Sah, 201052 Essar Oil, Developments in India – CMM/CBM, Prem Sawhney, March 2010
Step 3: Defining the Enabling Environment

23New Energy Architecture India
1.3 Further growth in the renewables industry will require capacity building at the state level, and may be further supported by the creation of a unified energy regulator
Following sustained 31% annual growth in installed renewable capacity between 2005 and 2009, India is now the fifth largest renewable energy generator in the world with 5% of global installed capacity. This growth has been driven by onshore wind energy.53 The public policy regime for the promotion of renewable energy at the national level is viewed as being among the most effective in the world – “a benchmark for all emerging markets”.54 The Ministry of New and Renewable Energy, among others, has nurtured the sector with a portfolio of policies – Renewable Portfolio Obligations, feed-in tariffs, generation and tax-based incentives and renewable energy certificates – to develop the market. The government has now set a target of 40GW of renewable power by 2022, requiring wind and solar capacity to double (see Box 1 for details of the current and prospective status of renewable energy in India).
While a national policy framework has been put in place to support these targets, success differs markedly on a state by state basis. States with large growth rates tend to have burgeoning renewable sectors – e.g. Gujarat and Maharashtra – while those with low growth rates, particularly those in the north-east, do not have an established renewables sector. State governments are responsible for the implementation of national laws and can set their own laws and regulations to be applied in their territory. This results in a patchwork of policies and targets, as seen in stark differences within Renewable Portfolio Obligations. Administrative hurdles are also significant in some states, particularly in relation to land title rights, responsibility for sanctioning projects and levels of financial support.
Poor performing states with high potential for renewables (e.g. Jharkhand) should be targeted to promote capacity building and encourage wider economic development. India must create a nationwide light touch regulatory environment, provide adequate and transparent funding for projects, and look to rapidly improve its evacuation infrastructure and resource database to facilitate industry participation. India should also consider creating a unified energy regulator to help align incentives between the states and the central government.
Box 1 – Renewable Energy in India55
India has the potential to generate 150GW of power from renewable energy as can be seen below:
Note: Average cost of coal-fired generation is US$ 0.06/kWh. The remaining 22GW is from cogeneration and waste to energy
Source: MNRE, 2010
Biomass offers strong potential in an agrarian economy and provides additional agricultural income as well as increased provision of electricity; however, its development level is highly state-dependent and growth has been hindered by an underdeveloped supply chain and lack of reliable resource assessment. Strongest performers are Uttar Pradesh and Tamil Nadu, while Rajasthan and Punjab have the greatest potential.
Small Hydro Power (SHP) offers significant opportunity for expansion (especially in the north). Development of SHP has been slow due to long delays caused by an inefficient policy framework for land ownership and private sector participation. SHP is well supported by established Indian industry and maximum power production is in summer. Karnataka and Himachal Pradesh have the highest installed capacity; Himachal Pradesh and Uttaranchal have the largest potential resource.
Wind energy has benefited from a strong and lengthy subsidization scheme as well as government-driven capacity building in the form of the Wind Resource Assessment Program and the Centre for Wind Energy Technology (a focus point for research and development). Interest in exploiting offshore wind energy is now growing. Wind energy is most developed in Andhra Pradesh, Gujarat, Karnataka and Tamil Nadu. Of investments in wind energy, 99% have come from the private sector, and many private integrated technology and project development firms have emerged as investors have sought to reap the rewards of accelerated depreciation and the feed-in tariff.
Solar power offers strong potential and India has been categorized as a top-five country for investment in solar power; but, at present, it is expensive due to the high capital cost of equipment and low plant load factor, with solar thermal costing marginally less than photovoltaic. Highest insolation is in the western states of Gujarat and Rajasthan and the southern state of Tamil Nadu, while large installations have been completed in Gujarat, Karnataka and Maharashtra. With interest in the sector rising (JP Morgan and Goldman Sachs have recently invested), there is a nascent opportunity to leverage the lessons learned from wind energy and apply it to solar; the development of local production of the high precision engineered components required could significantly reduce costs and an accurate resource assessment would drive further investment in the industry. A recent article in The Economic Times predicted that the Indian solar industry will need to augment manpower by 100,000 before 2022.
Resource Estimated Potential
2010 Capacity
Percentage Exploited
Average Cost (US$/kWh)
Biomass 18,000MW 2673MW 14.85% 0.09
Small Hydro Power 15,000MW 2953MW 19.69% 0.07
Wind 45,000MW 13,184 W 29.30% 0.09
Solar 50,000MW 45.5MWp 0.25 – 0.35
53 World Bank, Unleashing the Potential of Renewable Energy in India, 201054 Suzlon55 Source: The World Bank, Unleashing the Potential of Renewable Energy in India, 2010
Step 3: Defining the Enabling Environment
24 New Energy Architecture India
1.4 Adopt new technologies to improve the energy efficiency of power generation
India can save 183.5 billion kWh annually through energy efficiency initiatives.56 This can begin upstream, targeting improvements in power generation to increase output, reduce dependence on energy imports and lower costs of production. The thermal efficiency of coal power plants in India is about 29-30%, while in developed countries a much higher level is achieved (e.g. 42% in Japan).57 Most of the new plants to be added in the near term would also be of the sub-critical type,58 which would set a long-term trend of environmentally unsound technology. India should look to move to a quicker switchover to new technologies, such as super-critical technology. Current super-critical coal-fired power plants have efficiencies above 45%. Ultra super-critical boilers promise even higher efficiency and lower emissions.
1.5 Accelerate energy efficiency among consumers (commercial, residential and agricultural) by introducing clear standards
The National Mission on Enhanced Energy Efficiency was launched in 2008, and measures include labelling of consumer durables for energy efficiency, imposing targets for reducing energy use in energy intensive industries and introducing energy efficiency directives in buildings. This is supported by further initiatives such as the Energy Conservation Building Code (ECBC).
The ECBC went some way to driving energy efficiency in the construction of new commercial buildings, but adherence must become mandatory and extended to cover domestic developments. Likewise, the Bureau of Energy Efficiency’s appliance labelling scheme should be extended to become mandatory for appliances in addition to refrigerators and air conditioners, especially those with high power consumption. With sales of consumer appliances expected to mushroom in the next few years, there is strong motivation to implement a minimum efficiency standard and even subsidize the supply of energy efficient products now – price is still seen as the key differentiator in consumer behaviour.
By following Leadership in Energy Efficiency and Design (LEED) guidelines, consumption of electricity in commercial buildings can be reduced by 30%.59 A study in 2010 concluded that by 2030, energy efficiency increases of lighting, refrigeration, air conditioning, fans, water heating, washing machines and TVs could result in 41% energy efficiency increase in 2030 over base case scenarios, reducing 2030 consumption by 97TWh.60
Replacing magnetic ballast lighting tubes with electronic ballast tubes in a government building resulted in savings of US$ 40,000 per annum61 and LED lighting presents further improvement opportunities. Air conditioning improvements also offer strong potential for reducing energy consumption; installing new air conditioning systems in a mid-sized hospital resulted in energy cost savings of US$ 17,000 per annum for a cost of US$ 12,000; wider adoption of efficient air conditioning is expected to result in energy savings of 23Mtoe between 2010 and 2020.62
The introduction of minimum efficiency standards for pump systems will also help to improve efficiency within agricultural use. New products – such as solar water pumps – could further help in this regard. To encourage the adoption of such technologies, pilot programmes should be funded to establish proof points.
Objective 2 – Providing energy access for all
2.1 India has created a strong national policy platform for expanding access to modern fuels – but implementation needs to be improved at the state level
Government support is essential to the development of a successful rural electrification plan: without firm implementation policies and goals that can be enforced through legislation, the electrification process will fail. Since the launch of the “Power for all by 2012” initiatives in 2001, India has created a solid policy platform. In February 2005, a large-scale electrification effort, the Rajiv Gandhi Grameen Vidutikaran Yojana (RGGVY) scheme, was launched by the Ministry of Power to speed up rural electrification. Since 2005, the Rural Village Electrification (RVE) Program of the Ministry of New and Renewable Energies has been supplementing the efforts of the RGGVY with complementary measures for the provision of basic lighting/electricity facilities through renewable energy sources.63 These initiatives are further supported by the Rural Electrification Corporation, which has proven to be an effective means of furthering electrification efforts independently of political pressures. As of 30 June 2011, work in 97,940 villages had been completed for RGGVY, with 166 million free connections to households below the poverty line.64
In the cookstove market, India previously ran the National Program for Improved Chulas (NBI) (1985 to 2002), and has recently launched the National Biomass Cookstoves Initiative (NBCI) to develop and deploy next generation cleaner biomass cookstoves to households. The government is piloting the demonstration of 100,000 cookstoves during 2011 and 2012, providing financial assistance for up to 50% of the cost. Under the NBCI initiative, a series of pilot-scale projects are envisaged using several existing and commercially available cookstoves and different grades of process biomass fuel.
While the policy framework has provided a solid platform for reform, specific challenges have occurred in implementation at the state level, including delays in finalizing contract awards, delays in land acquisition, and authenticating lists of households below the poverty line.65 Expanding access requires dealing with the large backlog in the States of Uttar Pradesh, Bihar, Orissa and Assam and some of the other north-eastern states.
56 Anjali Jaiswal, India’s green path to growth: Addressing climate change and building a low-carbon economy, NRDC57 Graus et al. 2007; Chikkatur 200858 A Resource and Technology Assessment of Coal Utilization in India, Ananth Chikkatur, 200859 NRDC, Taking Energy Efficiency to New Heights, 2011, S. Chary Vedala, R. V. Bilolikar, S. Nalam, D. Foster60 Coping with residential Electricity Demand in India’s Future – How much Can Efficiency Achieve? V. Letschert, M. McNeil, Berkeley National Laboratory Environmental Energy Technologies Division, 200761 World Resources Institute, Powering UP: The Investment Potential of Energy Services Companies in India, E. Delio, S. Lall, C. Singh, 200962 Options for Energy Efficiency in India and Barriers to Their Adoption, Resources for the Future, S. Bhattacharya, M. Cooper, 201063 This applies to populations of less than 100 inhabitants; the electrification of villages comprising more than 100 inhabitants will usually be taken on by the RGGVY scheme through its decentralized distribution and generation. To avoid overlap of efforts, close coordination between the RGGVY and the MNRE is ensured mainly through the Rural Electrification Corporation.64 Bharat Nirman – Electrification: A Business Plan; http://www.powermin.nic.in/bharatnirman/bharatnirman.asp65 Demand for grants 2007-2008, Standing Committee on Energy, 14th Lok Sabha, 20th Report, Lok Sabha Secretariat, New Delhi
Step 3: Defining the Enabling Environment
25New Energy Architecture India
2.3 Private entrepreneurs should be encouraged to play a greater role in the expansion of energy initiatives to poor households
A successful rural electrification programme needs long-term strategic planning and financial resources for its implementation and for long-term maintenance and repairs. Under the RGGVY, the Ministry of Power grants 90% of the cost of rural electrification projects. States are supposed to cover the remaining 10% of the cost, either from their own funds or through loans from the Rural Electrification Corporation (REC), the Power Finance Corporation (PFC) or the Indian Renewable Energy Development Agency (IREDA). Electricity connections are free for customers below the poverty line. To facilitate recovery of customer payments from those above the poverty line, the RGGVY has ordered the creation and deployment of franchisees. Because these structures reduce commercial losses through more efficient billing and revenue collection, they are designed to ensure stable delivery of electricity.
Despite the creation of these support systems, the progress of the RGGVY initiative has been delayed by a lack of sufficient funds. India’s rural distribution system is essentially low density with high technical and commercial losses leading to a high delivery cost. Utilities that supplied power to rural areas therefore considered such supply as commercially unviable. For this reason, during the initial stages of the RGGVY, utilities were generally not inclined to take up rural electrification projects through funds arranged on a commercial loan basis.67 Some states have also failed to institutionalize the system of franchises; others have opted for a basic model of franchisee (revenue-based collection franchisee responsible for billing and collection on behalf of utility).68
The promotion of decentralized generation and the involvement of private entrepreneurs would help reduce the burden on state power utilities. In these efforts, fee-for-service is a useful concept: an investor installs a micro-grid in a village and asks customers to pay fees for energy. In effect, the electricity provided is off-grid, the generation is small-scale, and the providers are individuals or communities. The costs are high but still lower than under the old regime as the grid does not need to be extended. A similar model has been proven in Tanzania, where the Urambo Electric Consumer’s Cooperative outperforms the national utility in several respects: lower operation and maintenance costs, affordable tariffs and improved customer service.69
To support such initiatives, financing mechanisms would need to be put in place. The National Bank of Agriculture for Rural Development, which was created in 1982, has proven to be a successful mechanism to increase credit flows for agriculture. Similar options should be explored for the expansion of energy access.
2.2 Decentralized distribution and generation, and, in particular, the development of village-scale mini-grids with hybrid generation systems will accelerate the expansion of access
The focus of the RGGVY scheme has been to provide village electrification through grid extension. But connectivity by itself is only part of the problem. In many states, there is also a real shortage of power, with rural areas the first to face power outs in a shortage situation. To tackle this problem, greater emphasis could be placed on the roll-out of decentralized distribution and generation.
In current decentralized generation projects of the RGGVY, the renewable energy technologies used are diesel-generating sets powered by biofuels (non-edible vegetable oils), diesel-generating sets powered by producer gas generated through biomass gasification, solar PV and small hydropower plants. The development of village-scale mini-grids with hybrid systems (i.e. a combination of micro-hydro, gasifiers, direct combustion, large biodigesters and other renewables backed up by a battery bank and diesel generators) should be a focus for the future. The roll-out of decentralized generation will enable rural electrification to be carried out faster due to the lower cost and easier implementation of decentralized generation compared to grid extension. An IEA study found that the grid was technically within reach for 90% of the population but that only 43% are connected due to the connection cost.66
The RGGVY programme should also be used to catalyse changes in lighting appliances, in particular to promote a shift from incandescent lamps to a more efficient model.
66 IEA, World Energy Outlook, 200267 Ministry of Power, 2005-200668 Saurabh, RGGVY: A review is in order, The Financial Express, 5 September 201169 Felix S. Creutzig and Daniel M. Kammen, The Post-Copenhagen Roadmap Towards Sustainability: Differentiated Geographic Approaches, Integrated Over Goals, 2009
Step 3: Defining the Enabling Environment
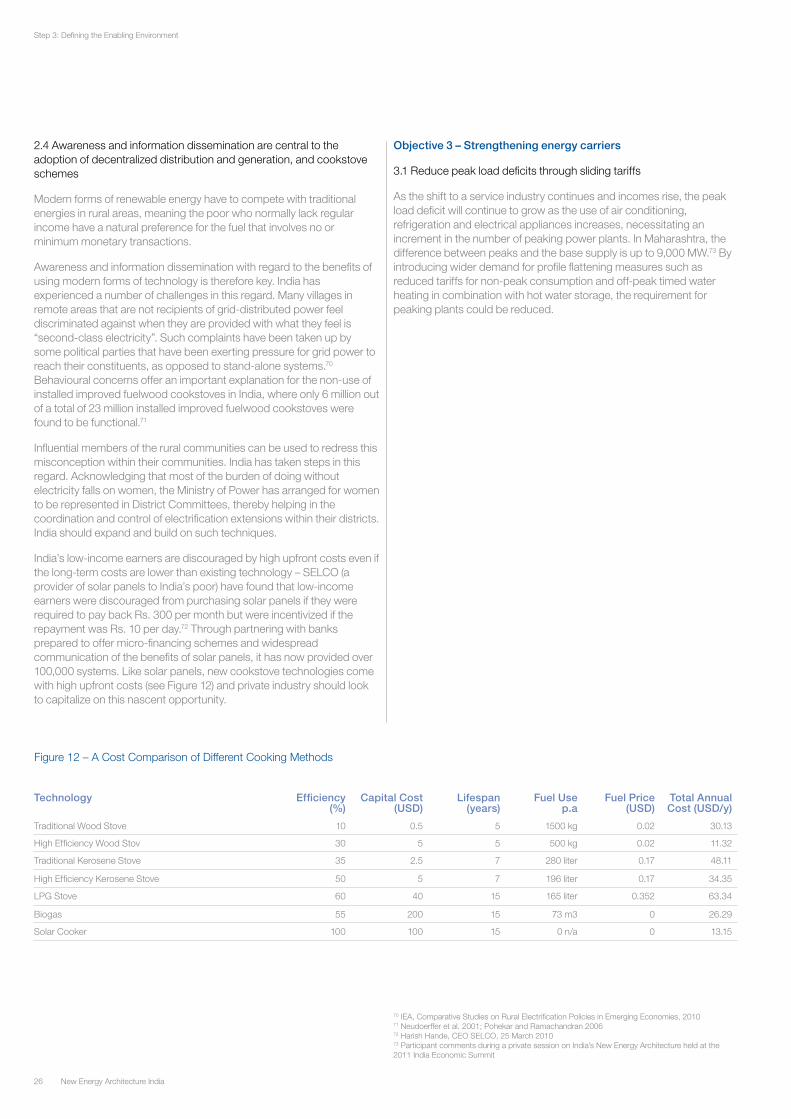
26 New Energy Architecture India
2.4 Awareness and information dissemination are central to the adoption of decentralized distribution and generation, and cookstove schemes
Modern forms of renewable energy have to compete with traditional energies in rural areas, meaning the poor who normally lack regular income have a natural preference for the fuel that involves no or minimum monetary transactions.
Awareness and information dissemination with regard to the benefits of using modern forms of technology is therefore key. India has experienced a number of challenges in this regard. Many villages in remote areas that are not recipients of grid-distributed power feel discriminated against when they are provided with what they feel is “second-class electricity”. Such complaints have been taken up by some political parties that have been exerting pressure for grid power to reach their constituents, as opposed to stand-alone systems.70 Behavioural concerns offer an important explanation for the non-use of installed improved fuelwood cookstoves in India, where only 6 million out of a total of 23 million installed improved fuelwood cookstoves were found to be functional.71
Influential members of the rural communities can be used to redress this misconception within their communities. India has taken steps in this regard. Acknowledging that most of the burden of doing without electricity falls on women, the Ministry of Power has arranged for women to be represented in District Committees, thereby helping in the coordination and control of electrification extensions within their districts. India should expand and build on such techniques.
India’s low-income earners are discouraged by high upfront costs even if the long-term costs are lower than existing technology – SELCO (a provider of solar panels to India’s poor) have found that low-income earners were discouraged from purchasing solar panels if they were required to pay back Rs. 300 per month but were incentivized if the repayment was Rs. 10 per day.72 Through partnering with banks prepared to offer micro-financing schemes and widespread communication of the benefits of solar panels, it has now provided over 100,000 systems. Like solar panels, new cookstove technologies come with high upfront costs (see Figure 12) and private industry should look to capitalize on this nascent opportunity.
Objective 3 – Strengthening energy carriers
3.1 Reduce peak load deficits through sliding tariffs
As the shift to a service industry continues and incomes rise, the peak load deficit will continue to grow as the use of air conditioning, refrigeration and electrical appliances increases, necessitating an increment in the number of peaking power plants. In Maharashtra, the difference between peaks and the base supply is up to 9,000 MW.73 By introducing wider demand for profile flattening measures such as reduced tariffs for non-peak consumption and off-peak timed water heating in combination with hot water storage, the requirement for peaking plants could be reduced.
Figure 12 – A Cost Comparison of Different Cooking Methods
Technology Efficiency(%)
Capital Cost(USD)
Lifespan(years)
Fuel Usep.a
Fuel Price(USD)
Total Annual Cost (USD/y)
Traditional Wood Stove 10 0.5 5 1500 kg 0.02 30.13
High Efficiency Wood Stov 30 5 5 500 kg 0.02 11.32
Traditional Kerosene Stove 35 2.5 7 280 liter 0.17 48.11
High Efficiency Kerosene Stove 50 5 7 196 liter 0.17 34.35
LPG Stove 60 40 15 165 liter 0.352 63.34
Biogas 55 200 15 73 m3 0 26.29
Solar Cooker 100 100 15 0 n/a 0 13.15
70 IEA, Comparative Studies on Rural Electrification Policies in Emerging Economies, 201071 Neudoerffer et al. 2001; Pohekar and Ramachandran 200672 Harish Hande, CEO SELCO, 25 March 201073 Participant comments during a private session on India’s New Energy Architecture held at the 2011 India Economic Summit
Step 3: Defining the Enabling Environment
27New Energy Architecture India
Objective 4 –Rationalize energy prices
4.1 India needs a well-instituted market mechanism in which energy prices are based on the interaction of demand and supply
Fossil fuel subsidies in India are usually poorly and ineffectually implemented and have led to a heavy burden on public finances and reduced profits of state-owned companies. In addition, they lead to reduced impetus to reduce consumption and to increased greenhouse gas emissions, and are preventing the development and take-up of new, more efficient technologies.
Energy subsidies aim to alleviate energy poverty and promote economic development, but often attract political support once implemented and are difficult to remove or reform. Despite this, India has been actively reviewing its subsidies (especially those that benefit wealthier consumers disproportionately) and has introduced some changes; gasoline has been deregulated and the price of gas sold under the Administered Pricing Mechanism has been increased. There is still vast improvement to be made. Gradual removal of subsidies would increase real income and reduce greenhouse gas emissions. This is not easy to achieve, but must be done with a high degree of transparency and cogent of the impact that removal of the subsidies will have on low-income households.
Discussions that have fed into this report have focused on the removal of diesel subsidies. The most widely touted solution has been the implementation of equilibrium pricing that takes into account externalities, with a temporary cut to taxes introduced to alleviate the burden to consumers.
4.2 A transparent and effective cash distribution system for Public Distribution Scheme (PDS) kerosene and domestic LPG should be established for those below the poverty line
For now, subsidies should not be completely removed from the marketplace, since they play an important role in maintaining “inclusive growth”. Kerosene, for example, is subsidized on the grounds that it is an important fuel predominantly used for lighting poor Indian households, while LPG is subsidized with the intention of improving the access of lower-income Indian households to modern cooking fuels.
The maintenance of these subsidies does require improved targeting. In 2007-2008, the richest 30% of households consumed 72% of all LPG.24 The 2011 budget proposes that a committee should design a new system for distributing subsidies for fossil fuels, replacing subsidies for LPG and kerosene by direct contribution to targeted groups that have a high probability of having incomes below the poverty line. Depending on the results of the study group, this reform would be implemented in 2012. While direct contributions will help ensure that subsidies reach those citizens in need, shielding low-income households from increases in energy prices, they will be difficult to implement effectively. A transparent and effective distribution system for PDS kerosene and domestic LPG can be ensured through a unique identifier/smartcard framework (a smartcard is a credit card-sized device used to store and communicate data, in this case related to use; a unique identifier is a number unique to each smartcard much like a vehicle registration plate).
3.2 Address the financial health of transmission and distribution companies to successfully implement grid strengthening programme
Sliding tariffs and improved peak load management would require improvements in the reliability of the grid. The Ministry of Power has set out a transformation roadmap for the power sector over the next 15 years that provides a clear direction for future investment and development for industry stakeholders. The Restructured Accelerated Power Development and Reforms Program (R-APDRP) incorporates three phases. Phase one addresses concerns such as transmission and distribution losses, and lack of transparency and accountability. Phase two, from years three to five, is expected to address issues on operational efficiency, customer service excellence and automated control. Phase three – the final phase of the roadmap running from years five to 15 – focuses on the development of a number of initiatives to support smart grid development, including the formation of a Smart Grid Task Force and smart grid piloting (including 50-75% funding grants from R-APDRP, with the balance being met by the respective state distribution company or technology provider).74
The state-owned transmission and distribution companies are in poor financial health and have limited capacity to fund the R-APDRP programme without the aid of the government. A number of interim solutions have been adopted to meet these challenges with some success. Delhi has privatized the distribution segment with good results in terms of reduction in aggregate technical and commercial losses. Other states have resorted to franchising, in which a private company takes over the management of the distribution system and collection of revenues on the basis of a predetermined revenue-sharing model. Individual companies have taken on these challenges themselves, integrating up and down the value chain. The Adani group will soon mine coal in Australia to be delivered to its own port in Gujarat and used partly to fire its own power stations.75 Suzlon has taken on building and operating transmission lines to connect new wind capacity to the grid before transferring control to state electricity boards. Even those outside of the energy sector have gotten involved to ensure security of supply. Infosys, for example, generates much of its own electricity.
Despite the success of these interim measures, long-term solutions must be adopted to fix the financial health of transmission and distribution companies. As covered under Objective 4, rationalizing energy prices will go some way to achieve this. Theft must also be tackled. Metering solutions will be central to this. Prepaid meters for smaller consumers and for remotely located consumers are options worth consideration given the strong IT base and the recent improvements in telecoms facilities in the country.
3.3 Increasing demand for natural gas will require the expansion of existing infrastructure
Twenty-five cities are currently planning to build city gas networks and expansion to additional cities is forecast. This will require the construction of citywide gas distribution networks in addition to intra-city gas pipelines beyond the north-west corner of the country. Legislation has recently been amended to break up Gas Authority of India’s monopoly and with a handful of privately held firms entering the market, it is expected that large-scale expansion of the network into the north and east will be forthcoming.
Increasing gas demand will not be met with domestic production and the need for imports will rise; with the long-planned pipelines linking India to Iran and Turkmenistan indefinitely suspended due to continuing tensions between India and Pakistan, this requirement will need to be met with LNG. LNG capacity is being increased with two additional LNG terminals in the south and east currently under construction with a further four proposed.76 A network of pipelines will need to be built to connect these terminals to the consumer markets.
74 Distribution Overview, Ministry of Power, Government of India, www.powermin.nic.in/distribution_overview.htm; “Union Power Minister Launches India Smart Grid Forum; Sam Pitroda to Chair Smart Grid Task Force”, Press Information Bureau press release, Government of India, 26 May 201075 The Economist, The Bollygarchs76 BMI, India Oil & Gas Report, Q4 2011
Step 3: Defining the Enabling Environment

28 New Energy Architecture India
Step 4: Defining Areas of Leadership
29New Energy Architecture India
Step 4: Defining Areas of Leadership
4.1 A Multistakeholder Action Plan
The creation of an enabling environment that is resilient to risk and responsive to the imperatives of the energy triangle goes beyond an individual corporation or government’s scope. Three key groups of stakeholders have a role to play: policy-makers, industry and civil society. Each stakeholder group should tailor future energy policy to achieving India’s New Energy Architecture objectives, considering the following options.
Considerations for policy-makers
• Augment resources for energy security by encouraging the involvement of international companies in the hydrocarbons sector, and building state capacity to support large-scale renewables development: Oil, gas and coal exploration must be extended to quantify the nation’s hydrocarbon resources and results must be publicized to encourage foreign investment. Introduce the Open Acreage Licensing Policy and benchmark the policy framework and licensing regime against leading international examples (e.g. United Kingdom) to encourage international oil company investment and joint ventures. Build on the success of wind energy and expand its success into solar power initiatives. Look to create streamlined, effective policy to encourage investment and development of renewables, especially in states where there is currently low capacity. Provide legislation and incentives to encourage energy efficiency across industry and consumers.
• Provide access to modern forms of energy for all by expanding the RGGVY to promote decentralized distribution and generation projects: Expand RGGVY to promote generation-based projects, placing greater emphasis on decentralized distribution and generation, while seeking private industry involvement. Continue to encourage replacing traditional biomass, with a combination of more efficient stoves, and fuels. Expand supply and financing of efficient cook-stoves and ensure that benefits are fully communicated. Expand use of small-scale solar photovoltaic panels and solar lighting.
• Strengthen energy carriers by addressing the health of transmission and distribution companies: Remove the cross-subsidy in the electricity sector to improve the financial health of state-owned utilities. Increase state adherence to the 2003 Electricity Act to enforce unbundling of utilities and development of the transmission and distribution network. Create serious and solid disincentives to electricity theft.
• Rationalize energy prices by phasing out subsidies: Adopt the recommendations of the expert group on a viable and sustainable system of pricing of petroleum products and create a roadmap to their eventual removal. Create a viable roadmap to move away from cross-subsidies in the electricity industry.
Considerations for industry
• Augment resources for energy security by expanding partnerships with international firms: Expand partnerships with international companies to provide technical expertise and experience to fully exploit more technically challenging upstream assets. Increase efficiencies in generation through adoption of modern technologies. Develop a strong domestic research and development and manufacturing base. Continue to invest in non-conventional sources, e.g. coal bed methane.
• Provide access to modern forms of energy for all by adopting fee-for-service business models to commercialize decentralized generation projects: Invest in hybrid decentralized generation technologies. Adopt fee-for-service business models to commercialize rural decentralized distribution and generation projects. Look to benefit from government incentives to deploy new renewable generating capacity.
• Strengthen energy carriers by adopting pre-paid metering technologies: Adopt pre-paid metering technologies to reduce theft. Invest in modern equipment (e.g. transformers) to increase transmission efficiency. Continue to expand gas pipelines and citywide gas distribution networks. Invest in evacuation infrastructure for renewable generation sites.
• Rationalize energy prices by growing scale of renewables sector to reduce costs: Use India’s abundance of engineering, scientific and manufacturing expertise to develop and produce technology (e.g. solar) in-country and at low cost.
Considerations for civil society
• Provide access to modern forms of energy for all by building awareness of the benefits of new forms of energy access: Increase education and communication of benefits to redress negative perceptions of decentralized distribution and generation systems to grow adoption rates.
• Rationalize energy prices by informing the public of the true costs of energy use: Create public awareness of the true cost of energy use and the benefits of efficient consumption.

30 New Energy Architecture India
Appendices: The Creation of the Energy Architecture Performance Index

31New Energy Architecture India
Appendices: The Creation of the Energy Architecture Performance Index
Score =
⎩⎪⎨
⎪⎧
0, 𝑥𝑥 > BASE
𝑥𝑥 − BASETOP − BASE
, TOP > 𝑥𝑥 > BASE
1, 𝑥𝑥 < TOP
�
Appendix A: Computation and Structure of the Energy Architecture Performance Index
This appendix presents the structure of the Energy Architecture Performance Index (EAPI). The index is designed to understand how countries are performing in relation to each of the imperatives of the energy triangle: economic growth and development; environmental sustainability; and energy access and security. A sub-index was created for each of these imperatives. For each sub-index a set of key performance indicators (KPIs) were chosen based on an understanding of the objectives of the imperative:
• Economic growth and development: This sub-index aims to measure the extent to which energy architecture supports, rather than detracts from, economic growth and development. The following KPIs were chosen:
− Energy intensity
− Cost of energy imports as a share of GDP
− Share of mineral products in export
− GDP per capita
− HDI
• Environmental sustainability: This sub-index aims to measure the extent to which energy architecture has been constructed in a manner that reduces negative environmental externalities. The following KPIs were chosen:
− Carbon intensity of energy use
− Share of non-carbon energy sources
− Outdoor air pollution
− Water scarcity
• Energy access and security: This sub-index aims to measure the extent to which energy architecture is at risk to an energy security impact, and whether adequate access to energy is provided to all parts of the population. The following KPIs were chosen:
− Import dependence
− Diversity of supply
− Quality of electricity supply
− Access to modern forms of energy
To create comparative data that could be aggregated into an overarching index, the data has been normalized. An individual index was created for each KPI. Performance for each KPI is expressed as a value between 0 and 1, calculated as per the below expression:
Instead of using the maximum and minimum values of each data set, anomalies were first removed by establishing TOP and BASE levels. TOP is the point of the raw data that is mapped to 1 and is calculated based from the mean +/- two standard deviations (dependent on whether a high or low value for the original metric is “good” or “bad”). BASE is the point of the raw data that is mapped to 0 and is calculated from the mean +/- two standard deviations (dependent on whether a high or low value for the original metrics is “good” or “bad”). All other values then follow a linear distribution from the BASE to the TOP.
In the case of diversity of supply, the raw data was first converted into a Simpson’s Diversity Index to measure the distribution of energy supply across seven supply sources: coal and peat; crude oil and oil products; gas; nuclear; hydro; other renewables such as geothermal and solar; and combustible renewable and waste. The Simpson’s Diversity Index is expressed using the below function, where n is the relative abundance of each energy source:
To create the sub-indices for environmental sustainability, as well as energy access and security, the individual indices for each KPI were aggregated by expressing each as a share of 1, with all KPIs evenly weighted (i.e. each indicator could contribute up to 0.25 to the sub-index). In the case of economic growth and development, energy intensity was given a higher weighting. This was in response to feedback received from the project steering board, which emphasized the importance of demand side management measures. Energy intensity therefore accounts for 30% of the index, with the remaining four indicators accounting for 70% of the index. The scores for GDP per capita and HDI were combined to provide a base level indication for economic growth and development, and together account for 17.5% of the index.
To create the overall score for each country the scores on each sub-index were added together, with the maximum score on the EAPI therefore being 3.
32 New Energy Architecture India
Historic data
To understand how countries have progressed over time, historic data was collected for the years 1999 to 2008, and also for 1990. To complete the normalization process for historic data the TOP and BASE values used were those from today’s index. The historic indicators thus show how countries are performing in comparison to today.
In a number of instances historic data was not available. In these instances, data was kept constant from the last available year in which it was available. This applies to the following indicators:
• Economic growth and development
− Share of mineral products in export: Data was only available for 2005-2008. In calculations of the index for the years 1999-2004 and 1980, the data from 2005 was kept constant.
• Environmental sustainability
− - Water scarcity: Data was only available for 2000. This was kept constant across the time periods covered.
• Energy access and security
− Quality of electricity supply: Data was only available for 2005-2008. In calculations of the index for the years 1999-2004 and 1980, the data from 2005 was kept constant.
− Access to modern forms of energy: Data was only available for 2003. This was kept constant across the time periods covered.
Creating archetypes
Archetypes were created by grouping those nations that displayed common features during the KPI analysis, and are defined as follows:
• Rationalize: Those nations that scored in the top quartile for economic growth and development
• Capitalize: Those nations that scored outside the top quartile for economic growth and development, and in the top quartile for energy access and security
• Grow: Those nations that scored below the top quartile for economic growth and development, and energy access and security, but above the bottom quartile for energy access and security
• Access: Those nations that scored in the bottom quartile for energy access and security
A review of countries that fell towards the boundaries of the above criteria was completed. This was in recognition of the fact that many countries display features of more than one archetype. In these instances, countries have been allocated to the archetype that represents their most pressing need.
Appendix B: Technical Notes and Sources for the Energy Architecture Performance Index
This appendix presents the technical descriptions and sources for the 13 KPIs of the Energy Architecture Performance Index. The most complete data set available for the indicators was from 2008. Data from this year was therefore used, unless otherwise unavailable.
Economic Growth and Development
Energy intensity
GDP per unit of energy use (PPP $ per kg of oil equivalent) | 2008
Provides an indication of the efficiency of energy use, and whether there is an opportunity to improve energy availability by reducing energy intensity. Total primary energy supply is calculated as indigenous production plus imports, removing exports, international marine bunkers, international aviation bunkers, and then adding or taking away stock changes. (Source: The World Bank)
Cost of energy imports as a share of GDP
Value of import of fuels/GDP | 2008
Provides an indication of the extent to which the energy sector has a negative impact on growth. Import bill is calculated based on the import of fuels (mineral fuels, lubricants and related materials) as classified under the Standard International Trade Classification, Revision 3, Eurostat. (Source: WTO Statistical Database)
Share of mineral products in export
Mineral products in export/national exports | 2008
Provides an indication of the efficiency of energy use, and whether there is an opportunity to improve energy availability by reducing energy intensity. The share of mineral products includes minerals fuels as classified under the Harmonized System Codes of Chapter 27, which covers mineral fuels, mineral oils and products of their distillation; bituminous substances and mineral waxes. (Source: ITC)
GDP per capita
GDP (PPP) (current $) per capita | 2008
GDP per capita is gross domestic product divided by mid-year population. GDP is the sum of gross value added by all resident producers in the economy plus any product taxes and minus any subsidies not included in the value of the products, using purchasing power parity rates. (Source: The World Bank)
Appendices: The Creation of the Energy Architecture Performance Index
33New Energy Architecture India
HDI
Human Development Index | 2008
The Human Development Index is used to assess comparative levels of development in countries and includes PPP adjusted income, literacy and life expectancy as its three main matrices. The HDI is only one of many possible measures of the well-being of a society, but it can serve as a proxy indicator of development. HDI has been shown to correlate well with per capita energy use. A certain minimum amount of energy is required to guarantee an acceptable standard of living (e.g. 42 GJ per capita), after which raising energy consumption yields only marginal improvements in the quality of life. (Source: The World Bank)
Environmental Sustainability
Carbon intensity of energy use
Carbon intensity (total carbon dioxide emissions from the consumption of energy per dollar of GDP using market exchange rates (metric tons of carbon dioxide per thousand year 2005 US dollars) | 2008
Estimate carbon dioxide emissions from the consumption and flaring of fossil fuels, per thousand dollars of GDP, using market exchange rates. When there are several fuels, as in this case, carbon intensity is based on their combined emissions coefficients weighted by their energy consumption levels. (Source: EIA)
Share of non-carbon energy sources
Alternative and nuclear energy/TPES | 2008
Clean energy is non-carbon energy that does not produce carbon dioxide when generated. It includes hydropower, nuclear, geothermal and solar power among others. This is taken as a share of total primary energy use. (Source: The World Bank)
Outdoor air pollution
PM10 [mg/m3] per annum | 2008
Particulate matter concentrations refer to fine suspended particulates less than 10 microns in diameter (PM10) that are capable of penetrating deep into the respiratory tract and causing significant health damage. Data for countries and aggregates for regions and income groups are urban-population weighted PM10 levels in residential areas of cities with more than 100,000 residents. The estimates represent the average annual exposure level of the average urban resident to outdoor particulate matter. (Source: The World Bank)
Water scarcity
Freshwater withdrawals as a share of internal resources | 2000
Annual freshwater withdrawals refer to total water withdrawals, not counting evaporation losses from storage basins, and are a proxy measure for water scarcity. Withdrawals also include water from desalination plants in countries where they are a significant source. Withdrawals can exceed 100% of total renewable resources where extraction from non-renewable aquifers or desalination plants is considerable or where there is significant water reuse. Withdrawals for agriculture and industry include withdrawals for irrigation and livestock production and for direct industrial use (including withdrawals for cooling thermoelectric plants). Withdrawals for domestic uses include drinking water, municipal use or supply, and use for public services, commercial establishments, and homes. Data are for the most recent year available for 1987-2002. (Source: AQUASTAT)
Energy Access and Security
Import dependence
Net imports/TPES | 2008
Provides an indication of the extent to which a nation is dependent on sourcing imports to meet energy demand. Net imports are calculated across all energy sources, as well as carriers including electricity and heat. This is taken as a share of total primary energy supply. Dependence on energy imports exposes affected economies to potential price risk fluctuations. (Source: World Bank)
Diversity of supply
Simpson’s Diversity Index | 2008
Greater diversity in sources of supply will reduce dependence on any one fuel, and therefore increase energy security. Given the interdependence of economic growth and energy consumption, access to a stable energy supply is a major political concern and a technical and economic challenge. All else being equal, the more reliant an energy system is on a single energy source, the more susceptible the energy system is to serious disruptions. Examples include disruptions to oil supply, unexpectedly large and widespread periods of low wind or solar insulation (e.g. due to weather), or the emergence of unintended consequences of any supply source. (Source: IEA; Author’s calculations)
Quality of electricity supply
Rating from 0 to 7 | 2008
Assesses the quality of the electricity supply within a country based on lack of interruptions and lack of voltage fluctuations. This has been used in favour of measures of the percentage of the population supplied with electricity, as we believe that it is a nuanced measure more suited to the purposes of a global comparison. This is taken from the World Economic Forum’s Executive Opinion Survey, in which respondents were asked: How would you assess the quality of the electricity supply (lack of interruptions and lack of voltage fluctuations) of your country? [1 = insufficient and suffers frequent interruptions; 7 = sufficient and reliable]. (Source: World Economic Forum, Global Competitiveness Index)
Access to modern forms of energy
Percentage of the population using solid fuels | 2008
Provides an indication of whether the population has access to modern sources of energy. Solid fuels include biomass, such as wood, charcoal, crops or other agricultural waste, as well as dung, shrubs and straw, and coal.
Although solid fuels are used for heating purposes, the World Health Statistics database is a compilation of information on the main fuel used for cooking purposes only. (Source: World Health Organization)
Appendices: The Creation of the Energy Architecture Performance Index
World Economic Forum91-93 route de la CapiteCH-1223 Cologny/GenevaSwitzerland
Tel +41 (0) 22 869 1212Fax +41 (0) 22 786 2744
The World Economic Forum is an independent international organization committed to improving the state of the world by engaging business, political, academic and other leaders of society to shape global, regional and industry agendas.
Incorporated as a not-for-profit foundation in 1971 and headquartered in Geneva, Switzerland, the Forum is tied to no political, partisan or national interests