Article A systematic study on the degradation products ...
29
Article A systematic study on the degradation products generated from artificially aged microplastics Greta Biale 1 , Jacopo La Nasa 1,2* , Marco Mattonai 1 , Andrea Corti 1 , Virginia Vinciguerra 1 , Valter Castelvetro 1,3 , Fran- cesca Modugno 1,3 1 Department of Chemistry and Industrial Chemistry, University of Pisa, Pisa, Italy 2 National Interuniversity Consortium of Materials Science and Technology, Florence, Italy 3 CISUP—Center for the Integration of Scientific Instruments of the University of Pisa, University of Pisa, Pisa, Italy * Correspondence: [email protected] ; Tel.: +39 050 050 2219258 Abstract: Up to 13 million tons of plastic waste are estimated to enter the oceans every year. A gen- erally accepted picture based on an increasing number of environmental studies suggests that the largest fraction of it consists or is rapidly degraded into microplastics (MPs). Most of the analytical studies focused on MPs are based on the detection and identification of the polymers. On the other hand, plastic debris in the environment undergo chemical (mainly photoxidative) and physical deg- radation processes leading not only to fragmentation but also to the formation of leachable, soluble and/or volatile degradation products that are released in the environment. The formation of such low molecular weight species is generally neglected in the studies on MPs even if these compounds, released in the environment from the plastics debris, may pose even higher risks for the environ- ment and for the biota than the MPs particles themselves, risks that are far from being understood and assessed. In this study we performed the analysis of reference MPs - polymer micropowders obtained by grinding a set of five polymer types down to final size in the 857-509 μm range, namely high- and low-density polyethylene (HDPE and LDPE, respectively), polystyrene (PS), polypropyl- ene (PP), and polyethylene terephthalate (PET). The reference MPs were artificially aged in a Solar- Box and their degradation products were analyzed to investigate their degradation processes. In particular, a systematic and thorough characterization of the aged (photo-oxidized) MPs and of their low molecular weight and/or highly oxidized fraction extractable in polar organic solvents was per- formed. For this purpose, the artificially aged MPs were subjected to selective extraction with or- ganic solvent that are non-solvents for the virgin polymers, targeting selective recovery of the low molecular weight fractions generated during the artificial aging. Analysis of both the extractable fractions and the residues was carried out by a multi-technique approach combining evolved gas analysis-mass spectrometry (EGA-MS) and pyrolysis-gas chromatography-mass spectrometry (Py- GC-MS). Up to 18 wt% of newly extractable, low molecular weight fraction was recovered from the photo-aged MPs, depending on the polymer type. The results highlight the need for more extensive studies about the potential harmfulness of the oxidation products (molecular and oxidized oligo- meric species) that may leach out from plastic debris during their permanence in the environment. Keywords: microplastics; artificial ageing; polymer degradation; artificial ageing; polyethylene; pol- ypropylene; polystyrene; polyethylene terephthalate 1. Introduction Due to the steadily increasing production of plastic materials since the second half of the 20th century, the mismanagement of a significant fraction of plastic waste resulted in massive plastic pollution becoming an environmental threat worldwide with potential risks for the biota and also for human health [1,2]. Therefore, the assessment of the amount, distribution and nature of the plastic debris in the ecosystems, and especially in Preprints (www.preprints.org) | NOT PEER-REVIEWED | Posted: 30 April 2021 doi:10.20944/preprints202104.0792.v1 © 2021 by the author(s). Distributed under a Creative Commons CC BY license.
Transcript of Article A systematic study on the degradation products ...

Article
A systematic study on the degradation products generated from
artificially aged microplastics
Greta Biale1, Jacopo La Nasa1,2*, Marco Mattonai1, Andrea Corti1, Virginia Vinciguerra1, Valter Castelvetro1,3, Fran-
cesca Modugno1,3
1 Department of Chemistry and Industrial Chemistry, University of Pisa, Pisa, Italy 2 National Interuniversity Consortium of Materials Science and Technology, Florence, Italy 3 CISUP—Center for the Integration of Scientific Instruments of the University of Pisa, University of Pisa,
Pisa, Italy
* Correspondence: [email protected] ; Tel.: +39 050 050 2219258
Abstract: Up to 13 million tons of plastic waste are estimated to enter the oceans every year. A gen-
erally accepted picture based on an increasing number of environmental studies suggests that the
largest fraction of it consists or is rapidly degraded into microplastics (MPs). Most of the analytical
studies focused on MPs are based on the detection and identification of the polymers. On the other
hand, plastic debris in the environment undergo chemical (mainly photoxidative) and physical deg-
radation processes leading not only to fragmentation but also to the formation of leachable, soluble
and/or volatile degradation products that are released in the environment. The formation of such
low molecular weight species is generally neglected in the studies on MPs even if these compounds,
released in the environment from the plastics debris, may pose even higher risks for the environ-
ment and for the biota than the MPs particles themselves, risks that are far from being understood
and assessed. In this study we performed the analysis of reference MPs - polymer micropowders
obtained by grinding a set of five polymer types down to final size in the 857-509 μm range, namely
high- and low-density polyethylene (HDPE and LDPE, respectively), polystyrene (PS), polypropyl-
ene (PP), and polyethylene terephthalate (PET). The reference MPs were artificially aged in a Solar-
Box and their degradation products were analyzed to investigate their degradation processes. In
particular, a systematic and thorough characterization of the aged (photo-oxidized) MPs and of their
low molecular weight and/or highly oxidized fraction extractable in polar organic solvents was per-
formed. For this purpose, the artificially aged MPs were subjected to selective extraction with or-
ganic solvent that are non-solvents for the virgin polymers, targeting selective recovery of the low
molecular weight fractions generated during the artificial aging. Analysis of both the extractable
fractions and the residues was carried out by a multi-technique approach combining evolved gas
analysis-mass spectrometry (EGA-MS) and pyrolysis-gas chromatography-mass spectrometry (Py-
GC-MS). Up to 18 wt% of newly extractable, low molecular weight fraction was recovered from the
photo-aged MPs, depending on the polymer type. The results highlight the need for more extensive
studies about the potential harmfulness of the oxidation products (molecular and oxidized oligo-
meric species) that may leach out from plastic debris during their permanence in the environment.
Keywords: microplastics; artificial ageing; polymer degradation; artificial ageing; polyethylene; pol-
ypropylene; polystyrene; polyethylene terephthalate
1. Introduction
Due to the steadily increasing production of plastic materials since the second half of
the 20th century, the mismanagement of a significant fraction of plastic waste resulted in
massive plastic pollution becoming an environmental threat worldwide with potential
risks for the biota and also for human health [1,2]. Therefore, the assessment of the
amount, distribution and nature of the plastic debris in the ecosystems, and especially in
Preprints (www.preprints.org) | NOT PEER-REVIEWED | Posted: 30 April 2021 doi:10.20944/preprints202104.0792.v1
© 2021 by the author(s). Distributed under a Creative Commons CC BY license.

2 of 29
the marine environment, is the focus of intense multidisciplinary research [3,4]. Currently,
about 5-13 million tons of plastic waste are estimated to enter the ocean every year [5]. A
generally accepted picture based on an increasing number of environmental studies sug-
gests that the largest fraction of it consists of microplastics (MPs)[6]. While there is cur-
rently no scientific or regulatory agreement on the definition of a MPs size range, the com-
monly adopted 5 mm as the upper limit [7,8] is being questioned as it relates to the inges-
tion by fish rather than to the physical and chemical properties. In fact, the latter are
mainly related to the specific surface area and its rapid increase (roughly by a half of the
third power) with the reduction of particle size; on the other hand, the specific surface
area is likely to be more strictly related to the rate and extent of polymer degradation
under environmental conditions, and thus with the interaction of MPs with the environ-
ment. A scientifically more appropriate size range of 1-1000 μm for MPs has recently been
proposed [3,9]. The relevance of the size range of the MPs is exemplified by the observa-
tion that the higher the specific surface area, the faster the chemical degradation, mainly
due to photo-oxidation processes, leading to the formation of leachable, soluble and/or
volatile degradation products that need to be considered as an emerging source of envi-
ronmental pollution deriving from MPs[10-13]. The most common analytical techniques
used for the analysis of MPs are micro FTIR (μ-FTIR), and micro Raman spectros-
copy[14,15], both providing information that does not allow to clearly highlight the dif-
ferences between the surface and bulk composition and to pinpoint the presence and rel-
ative amount of highly degraded fractions and of degradation products that are likely to
affect the most the chemical behavior of MPs. On the other hand, in the last years thermo-
analytical approaches have emerged as powerful tools for studying MPs [16-18], also in
routine analysis of contaminated environmental samples [19]. Among them, analytical
pyrolysis [20-22] allows the sensitive and accurate characterization of polymers and pol-
ymer mixtures through their pyrolytic profiles. The systematic study presented here is
based on a combination of analytical pyrolysis approaches and mass spectrometry detec-
tion to evaluate the effects of simulated environmental photo-oxidative degradation pro-
cesses in five different reference MPs. We describe the parallel characterization of the bulk
chemical modifications, and of the low-molecular-weight, leachable or soluble organic
fraction resulting from the polymer degradation. Investigating the relation between the
modifications of the different polymers under simulated environmental aging, and the
nature and amount of low molecular weight species resulting from the polymer degrada-
tion - as evaluated by their enhanced solubility in polar organic solvents - is fundamental
to assess their possible role as emerging environmental pollutants as they may leach out
of the MPs, being thus potentially harmful for living organisms.The reference polymers
were selected among those most commonly found in the form of MPs in the environment
as a result of plastic waste dispersion, namely: polypropylene (PP), polystyrene (PS), pol-
yethylene terephthalate (PET), low-density polyethylene (LDPE) and high-density poly-
ethylene (HDPE). The virgin polymers in the form of micropowders (average particle size
in the 857-509 μm range) were aged in a Solar-Box for four weeks. Samples were periodi-
cally collected and analyzed by means of evolved gas analysis-mass spectrometry (EGA-
MS) and the results were compared with those obtained for the unaged polymers in order
to study the thermal degradation behavior specific for each polymer during photo-aging.
The unaged and the 4 weeks aged polymer samples were also characterized by means of
pyrolysis-gas chromatography-mass spectrometry (Py-GC-MS) to detect and identify the
produced alteration and degradation products. Finally, all samples were subjected to sol-
vent extraction in either methanol (for PS) or refluxing dichloromethane (for PP, PET,
LDPE and HDPE), that are non-solvents for the virgin polymers, to selectively extract the
low molecular weight fractions generated by chain scissions as a result of extensive deg-
radation. The solvent extracts were then analyzed by size exclusion chromatography
(SEC) and Py-GC-MS using hexamethyldisilazane (HMDS) as derivatizing agent to detect
the compounds characterized by high polarity and low-volatility like the ones resulting
from photo-oxidative processes entailing radical oxygen inclusion reactions. The
Preprints (www.preprints.org) | NOT PEER-REVIEWED | Posted: 30 April 2021 doi:10.20944/preprints202104.0792.v1

3 of 29
insoluble polymer fractions were also analyzed by means of Py-GC-MS to evaluate their
chemical modifications and compare them with those of the most highly degraded, sol-
vent extractable fractions.
2. Materials and Methods
2.1. Chemicals
Dichloromethane (DCM, HPLC grade, Sigma-Aldrich) and methanol (MeOH, HPLC
grade, Sigma-Aldrich) were used as solvents in the extractions. Hexamethyldisilazane
(HMDS ≥ 99%, Sigma-Aldrich) was used as derivatizing agent for the in situ thermally
assisted silylation of the pyrolysis products bearing carboxylic and hydroxyl groups in
the Py-GC-MS analysis of the polymer extracts.
2.2 Reference Polymers
Micronized polypropylene (PP), polystyrene (PS), polyethylene terephthalate (PET), low-
density polyethylene (LDPE) and high-density polyethylene (HDPE), with average parti-
cle size in the 857-509 μm range depending on the polymer as reported elsewhere [23,24],
were kind gifts from Poliplast S.p.A (Casnigo, Italy).
2.3 Artificial aging and extraction
PP, PS, PET, LDPE and HDPE micropowders were artificially aged for four weeks using
a Solar-Box system (CO.FO.ME.GRA. Srl, Milan, Italy) equipped with a Xenon-arc lamp
and outdoor filter. The conditions for the aging were: temperature 40 °C, irradiance 750
W/m2, relative humidity around 60%. Aliquots (ca. 200 mg) of each polymer were col-
lected before (0w) and after 1 (1w), 2 (2w), 3 (3w), and 4 (4w) weeks of artificial aging and
stored in sealed glass vials at −20 °C until analysis [23,24]. About 150 mg of each unaged
and aged polymer sample was extracted for 6 hours with 30 ml either MeOH (for PS) or
DCM (all other polymers) in a Soxhlet apparatus, collecting both the residues and the ex-
tractable fractions for the subsequent characterizations. MeOH and DCM, that act as non-
solvents for the virgin polymers, were chosen to selectively extract the degraded, low mo-
lecular weight fractions. The extracted fractions were dried in a rotary evaporator until
constant weight and then stored in glass vials before the Py-GC-MS and SEC analyses.
Procedural blanks (DCM and MeOH) were also prepared and analyzed along with the
polymer extracts.
2.4 Analytical methods and instrumentation
2.4.1 Evolved Gas Analysis-Mass Spectrometry (EGA-MS)
The EGA-MS analyses of unaged and artificially aged bulk polymers were performed
with an EGA/PY-3030D micro-furnace pyrolyzer (Frontier Laboratories Ltd., Japan) cou-
pled to a 6890 gas chromatograph and a 5973 mass spectrometric detector (Agilent Tech-
nologies, USA). The experimental conditions were the following: temperature ramp for
the furnace from 50 °C to 700 °C at 10 °C/min; interface between the pyrolysis furnace and
the GC-MS system set at a temperature 100 °C higher than that of the furnace, but limited
to a maximum of 300 °C; GC injector operated in split mode (20:1 ratio) at 280 °C [25,26].
The evolved pyrolysis products were directly sent to the mass spectrometer using a
UADTM-2.5N deactivated stainless-steel capillary tube (3 m x 0.15 mm, Frontier Labora-
tories Ltd., Japan) held at 300 °C, and using helium (1 mL/min) as the carrier gas. The
temperature of the transfer line to the mass spectrometer was 280 °C. The mass spectrom-
eter was operated in EI positive mode (70 eV, m/z range 15-700). The temperatures of the
ion source and quadrupole analyzer were 230 °C and 150 °C, respectively. Each 100-250
μg sample was directly weighed in the deactivated stainless-steel pyrolysis cup with an
XS3DU microanalytical scale (Mettler-Toledo, USA) with seven digits and a precision of
1 μg.
Preprints (www.preprints.org) | NOT PEER-REVIEWED | Posted: 30 April 2021 doi:10.20944/preprints202104.0792.v1

4 of 29
2.4.2 Pyrolysis-Gas Chromatography-Mass Spectrometry (Py-GC-MS)
Analyses of unaged and artificially aged bulk polymers, their extracts, and the corre-
sponding extraction residues (insoluble fractions) were performed using a multi-shot py-
rolyzer EGA/PY-3030D (Frontier Lab) coupled with a 6890N gas chromatography system
with a split/splitless injection port and combined with a 5973 mass selective single quad-
rupole mass spectrometer (Agilent Technologies). The samples (50-100 μg) were placed in
deactivated stainless-steel sample cups. Pyrolysis conditions were optimized as follows:
pyrolysis temperatures were selected based on the samples analyzed [25-27]; interface 280
°C; GC injector temperature 280 °C; GC injection operated in split mode with an optimized
10:1 split ratio. The chromatographic separation of the pyrolysis products was performed
on a fused silica capillary column HP-5MS (5% diphenyl-95% dimethyl-polysiloxane, 30
m x 0.25 mm i.d., 0.25 μm film thickness, J&W Scientific, Agilent Technologies) preceded
by a deactivated fused silica pre-column (2 m x 0.32 mm i.d.). The chromatographic con-
ditions were: 40 °C for 5 min, 10 °C/min to 310 °C for 20 min, carrier gas (He, 99.9995%)
flow 1.2 mL/min. MS parameters: electron impact ionization (EI, 70 eV) in positive mode;
ion source temperature 230 °C; scan range 35-700 m/z; interface temperature 280 °C. Per-
fluorotributylamine (PFTBA) was used for mass spectrometer tuning. MSD ChemStation
(Agilent Technologies) software was used for data analysis and peak assignment was
based on a mass spectra libraries (NIST 8, score higher than 80%) and literature data [20].
For the analysis of the polymer samples and the polymer residues (after extraction), the
pyrolysis furnace was set at 600 °C and samples ranging from 50 to 100 μg were directly
weighed in the deactivated stainless-steel pyrolysis cup with an XS3DU microanalytical
scale (Mettler-Toledo, USA) with seven digits and a precision of 1 μg. For the analysis of
the extracted fraction of the reference polymer samples, 1 mL of DCM was added to each
vial containing the polymer dried extracts; regarding PS dried extract, 1 mL of methanol
was used, since it is the solvent used for its extraction. Then, different volumes of the
extracts (20-340 μL) were directly dried in the pyrolysis cup and then weighed with an
XS3DU microanalytical scale in order to obtain about 100 μg of sample. 4 μL of HMDS
were added in the pyrolysis cup as derivatizing agent in order to detect polar and low-
volatility compounds. Pyrolysis temperature was set at 550 °C. HMDS was used in the
cleaning pre-treatment of the Py-GC-MS system.
2.4.3 Size-exclusion Chromatography (SEC)
Size exclusion chromatography (SEC) analysis of the extracts of unaged and aged poly-
mers was performed with a Jasco (Jasco Europe srl, Italy) instrument comprising a PU-
2080 Plus four-channel pump with degasser, two in series PL gel MIXED-E Mesopore
(Polymer Laboratories) columns placed in a Jasco CO-2063 column oven thermostated at
30 °C, a Jasco RI 2031 Plus refractive index detector, and a Jasco UV-2077 Plus multi-chan-
nel UV 120 spectrometer; the ChromNav Jasco software was used for data acquisition and
analysis. The eluent was trichloromethane (HPLC grade Sigma-Aldrich) at 1 mL/min flow
rate
3. Results and discussion
The micropowders of all reference polymers were artificially aged 4 weeks under
conditions roughly corresponding to a 6-month exposure at the latitude of Tuscany re-
gion, in central Italy. The pristine (unaged virgin polymers) and the irradiated samples
collected after each subsequent 1-week period of artificial aging were analyzed by means
of EGA-MS, and Py-GC-MS to gain information about the extent of the photo-oxidative
degradation and the type of chemical damage induced by the photo-aging. Pristine and
artificially aged polymers were also extracted with solvents suitable for separating the
low molecular weight photo-oxidized fragments from the insoluble bulk polymer. Finally,
the two fractions obtained upon solvent extraction of each sample (organic extract con-
taining the soluble degradation products, and residue containing the insoluble polymers)
Preprints (www.preprints.org) | NOT PEER-REVIEWED | Posted: 30 April 2021 doi:10.20944/preprints202104.0792.v1

5 of 29
were characterized by Py-GC-MS and, in the case of the extracts containing the soluble
fraction produced upon aging, also by SEC. The overall procedure is schematically sum-
marized in Figure 1. The extraction yields and their variation during artificial aging are
reported in Figure 2. A higher rate of degradation, as simply weighed by the increase of
the fraction of extractable material upon aging, was observed for the PP, LDPE, and PS,
all of which bearing a tertiary C-H bond that is more easily attacked by free radical species
directly or indirectly generated by photo-irradiation. However, while the extractable frac-
tion increases about linearly with the irradiation time for the three polyolefins (i.e., includ-
ing HDPE), a tendency resembling an exponential growth or indicating some initial inhi-
bition effect can be observed for PS, possibly as a result of some free radical scavenging
effect associated with either the presence of the monosubstituted phenyl ring, or the
higher glass transition temperature (Tg) of PS, or both.
Figure 1 Flowsheet of the overall procedure for the investigation of the polymer degradation prod-
ucts generated upon accelerated photo-oxidative aging.
Microparticles reference polymers HDPE, LDPE, PS, PET, PP
Solarbox artificial aging40 °C, 750 W/m2
r.h. 60%
EGA-MSPy-GC-MS
Sohxlet extraction, reflux 6 h:•DCM (for HDPE, LDPE, PP, PET)•MeOH (for PS)
0w (unaged virgin polymer) &1w, 2w, 3w, 4w aged polymers
Soluble extracts Insoluble polymer fractions
Py-GC-MSSECPy (HMDS)-GC-MS
Preprints (www.preprints.org) | NOT PEER-REVIEWED | Posted: 30 April 2021 doi:10.20944/preprints202104.0792.v1
6 of 29
Figure 2 Extractable fractions (w%) for each reference polymer sample upon artificial ag-
ing (10 % error bars).
3.1 EGA-MS and Py-GC-MS analysis of polymers during artificial aging
EGA analyses were performed on the 0w (unaged), 1w, 3w, and 4w polymer samples to
evaluate changes in the thermal degradation temperature profiles. The 0w and 4w sam-
ples, representing the initial and final situation, were also analyzed by Py-GC-MS. The
results are reported and discussed in the following paragraphs, separately for each poly-
mer type.
3.1.1 Polypropylene
The EGA profiles for virgin and aged PP are shown in Figure 3, each curve being the
average of five replicates.
Figure 3 EGA profiles of PP after different artificial aging times: PP-0w (red), PP-1w (green), PP-3w
(yellow), and PP-4w (blue) accelerated aging.
0
2
4
6
8
10
12
14
16
18
20
1 2 3 4 5
EXTR
AC
TAB
LES
(%)
WEEKS
PP
HDPE
LDPE
PS
5.00 10.00 15.00 20.00 25.00 30.00 35.00 40.00 45.00 50.00 55.000
Time (min.)
Re
lative
Ab
un
da
nce
100
60.00
100 150 200 250 300 350 400 450 500 550 600
Temperature (°C)650
Unaged1 week3 week4 week
Preprints (www.preprints.org) | NOT PEER-REVIEWED | Posted: 30 April 2021 doi:10.20944/preprints202104.0792.v1

7 of 29
Based on a statistical evaluation of the five replicated analyses (t-test, 95%), a difference
higher than 5,2 °C in the thermal degradation temperature, TD, taken as the temperature
corresponding to the maximum of the EGA peak, can be considered as significant. The
EGA profiles show a change in the thermal degradation profile of PP upon aging. In par-
ticular, photodegradation induces a progressive decrease of TD and a broadening of the
thermal degradation peak (Table 1), with a TD drop of 35 °C from TD=453 °C for the unaged
PP-0w down to 418 °C for PP-4w. An even more consistent drop is observed for the onset
temperature of the thermal degradation peak: from 421 °C for the unaged PP-0w down to
350 °C for PP-4w.
Table 1 Degradation temperature ranges and peak maxima (TD max) obtained from the EGA-MS
profiles of the PP samples; (a) Onset and offset temperatures determined at the intersection of the
baseline with the tangent at the inflection point of the upward and downward slope of the EGA
peak, respectively.
Polypropylene Degradation temperature range (°C) (a) TD max (°C)
PP-0w 421 - 480 453
PP-1w 350 - 484 437
PP-3w 350 - 463 424
PP-4w 350 - 458 418
PP is known to be very susceptible to chain scission reactions as a result of photo-induced
degradation processes, its reactivity being higher than that of both HDPE and LDPE, due
to the higher concentration of tertiary C-H bonds. The latter are more susceptible to free
radical attack typically resulting in hydrogen extraction, followed by a series of reactions
eventually leading to random chain scissions and consequent rapid reduction of the mo-
lecular weight [10,28,29]. This behavior is in full agreement with the evolution of the EGA
profiles during artificial aging as observed in our experiments, featuring the above dis-
cussed progressive TD lowering and peak broadening, as a result of the growing concen-
tration of chain scission products and of reactive oxidized and unsaturated groups, less
thermally stable than saturated hydrocarbon structures. As expected, such structural
changes did not induce any significant change in the EGA-MS mass spectra of the polymer
thermal degradation products (the average mass spectra is obtained averaging the EGA-
MS mass spectra in the temperature range corresponding to the peak, and is reported in
Figure S.1 in the Supplementary Materials). The most abundant ion fragments in the av-
erage EGA mass spectrum of PP-0w (spectra collected in the temperature range from 421
°C to 480 °C) are m/z 43, 69, 83, 97, 111, 125, 153, corresponding to PP oligomers with
different chain lengths (Table 2) [20]. The Py-GC-MS chromatogram of PP-0w is shown in
Figure 4, while its peak assignments are listed in Table 2. The most abundant pyrolysis
products are 2,4-dimethyl-1-heptene (n° 6), 2,4,6-trimethyl-1-nonene (n° 12, 13), 2,4,6,8-
tetramethyl-1-undecene (n° 16, 17, 18) along with other polypropylene oligomers of in-
creasing chain length (n° 19-44), in agreement with the well-known pyrolytic behavior of
PP involving random C-C scissions followed by intramolecular H transfer yielding al-
kanes and 1-alkenes [20,30]. The pyrolysis profiles of PP-0w and PP-4w are very similar.
In particular, no pyrolysis products indicative of the occurrence of photoaging-related
polymer degradation could be detected. In fact, the EGA profile did highlight the occur-
rence and progress of polymer degradation processes during the aging experiment; on the
other hand, the missed detection of molecular fragments that could be associated with the
increasing fraction of oxidized products resulting from the photo-oxidative degradation
may be explained by their low concentration in the bulk polymer, and by the poor effec-
tiveness of the GC-MS separation and detection section in a conventional Py-GC-MS ap-
paratus when oxidation products are involved, unless in situ thermally assisted
Preprints (www.preprints.org) | NOT PEER-REVIEWED | Posted: 30 April 2021 doi:10.20944/preprints202104.0792.v1

8 of 29
derivatization of the carboxylic/hydroxyl functions is applied prior to the analysis. In or-
der to detect the presence of degradation products generated by artificial aging and to
achieve an exhaustive characterization, solvent extraction was applied, and the extracta-
ble fractions of reference polymers before and after artificial aging were analyzed by
means of Py-GC-MS using a derivatization agent.
Figure 4 Chromatogram obtained in the Py-GC-MS analysis of the unaged PP (PP-0w). Peak iden-
tification is reported in Table 2.
Table 2 Identification of peaks in the chromatogram obtained in the Py-GC-MS analysis of PP-0w
(Figure 4) [20]. M+ refers to the molecular ion.
# tr (min) Peak identification Main ions (m/z)
1 1.9 propene 42 (M+), 41, 39
2 2.2 pentane 72 (M+), 57, 43
3 2.7 2,methyl-1-pentene 84 (M+), 69, 56, 41
4 5.6 4-methyl-2-heptene 112 (M+), 69, 55, 41
5 6.2 2-methyl-1,5-hexadiene 95, 81, 67, 55, 39
6 8.0 2,4-dimethyl-1-heptene 126 (M+), 83, 70, 55, 43
7 8.2 1,3,5-trimethylcyclohexane (isomer) 126, 111, 69, 55, 41
8 8.5 2,4-dimethyl-1,6-heptadiene 124 (M+), 109, 81, 67, 55, 41
9 8.9 2,4,6-trimethyl-1-heptene 140 (M+), 83, 69, 55, 43
10 9.2 2,4,6-trimethyl-1,6-heptadiene 138 (M+), 123, 109, 95, 82, 67, 55, 41
11 10.3 4,6-dimethyl-2-nonene 154 (M+), 111, 85, 69, 55, 41
12 11.1 2,4,6-trimethyl-1-nonene 168 (M+), 125, 111, 83, 69, 57, 43
13 11.2 2,4,6-trimethyl-1-nonene 168 (M+), 125, 111, 83, 69, 57, 43
14 11.6 2,4,6,8-tetramethyl-1-nonene 182 (M+), 125, 111, 83, 69, 57, 43
15 11.8 2,4,6,8-tetramethyl-1,8-nonadiene 180 (M+), 123, 109, 96, 83, 69, 55, 41
16 13.0 2,4,6,8-tetramethyl-1-undecene 210 (M+), 154, 111, 83, 69, 55, 43
17 13.1 2,4,6,8-tetramethyl-1-undecene 210 (M+), 154, 111, 85, 69, 55, 43
18 13.2 2,4,6,8-tetramethyl-1-undecene 210 (M+), 154, 111, 85, 69, 55, 44
19 13.3 2,4,6,8,10-pentamethyl-1-undecene 224 (M+), 125, 111, 97, 83, 69, 57, 43
20 13.6 2,4,6,8,10-pentamethyl-1,10-undecadiene 222 (M+), 123, 109, 95, 83, 69, 55, 41
21 13.9 unknown 153, 125, 111, 97, 85, 69, 57, 43
22 14.3 2,4,6,8,10-pentamethyl-1,12-tridecadiene 250 (M+), 123, 109, 95, 83, 69, 55, 41
2.00 4.00 6.00 8.00 10.00 12.00 14.00 16.00 18.00 20.00 22.00 24.00
0
Time (min.)
Re
lative
Ab
un
da
nce
100
26.00
pen
tan
e
2,4
-dim
eth
yl-1
-hep
ten
e
2,4
,6-t
rim
eth
yl-1
-hep
ten
e
2,4
,6-t
rim
eth
yl-1
-no
nen
e
2,4
,6,8
-tet
ram
eth
yl-1
-un
dec
ene
3538
41
4420231 26 28
30
3
10
1114
15
2
4 5
6
7 8
9
12
13
16
17
18
19
21
22
24
25
27 31
32
33
34
29
36
37 39
40
42
43
Preprints (www.preprints.org) | NOT PEER-REVIEWED | Posted: 30 April 2021 doi:10.20944/preprints202104.0792.v1

9 of 29
23 14.5 2,4,6,8,10-pentamethyl-1-tridecene 252 (M+), 125, 111, 97, 83, 69, 57, 43
24 14.6 unknown 196, 125, 111, 97, 83, 69, 57, 43
25 14.7 unknown 153, 125, 111, 97, 83, 69, 57, 43
26 14.9 2,4,6,8,10,12-hexamethyl-1,12-tridecadiene 264 (M+), 123, 109, 95, 83, 69, 55, 41
27 15.6 2,4,6,8,10,12-hexamethyl-1,14-pentadecadiene 292 (M+), 137, 109, 97, 83, 69, 55, 41
28 15.7 2,4,6,8,10,12-hexamethyl-1-pentadecene 294 (M+), 139, 111, 97, 83, 69, 57, 43
29 15.9 unknown 294, 139, 125, 111, 97, 83, 69, 57, 43
30 16.1 2,4,6,8,10,12,14-heptamethyl-1,14-pentadecadiene 306 (M+), 123, 109, 97, 83, 69, 55, 41
31 16.8 2,4,6,8,10,12,14-heptamethyl-1,16-heptadecadiene 334 (M+), 123, 109, 97, 83, 69, 55, 41
32 16.9 2,4,6,8,10,12,14-heptamethyl-1-heptadecene 336 (M+), 125, 111, 97, 83, 69, 57, 43
33 17.0 unknown 153, 125, 111, 97, 83, 69, 57, 43
34 17.1 unknown 153, 125, 111, 97, 83, 69, 57, 43
35 17.2 2,4,6,8,10,12,14,16-octamethyl-1,16-heptadecadiene 348 (M+), 123, 109, 97, 83, 69, 55, 41
36 17.8 2,4,6,8,10,12,14,16-octamethyl-1,18-nonadecadiene 376 (M+), 125, 109, 97, 83, 69, 55, 41
37 17.9 2,4,6,8,10,12,14,16-octamethyl-1-nonadecene 378 (M+), 125, 111, 97, 83, 69, 57, 43
38 18.2 2,4,6,8,10,12,14,16,18-nonamethyl-1,18-nonadecadiene 390 (M+) 125, 109, 97, 83, 69, 55, 41
39 18.7 2,4,6,8,10,12,14,16,18-nonamethyl-1,20-henicosadiene 418 (M+), 125, 111, 97, 83, 69, 55, 41
40 18.8 2,4,6,8,10,12,14,16,18-nonamethyl-1-henicosene 420 (M+), 125, 111, 97, 83, 69, 57, 43
41 19.1 2,4,6,8,10,12,14,16,18,20-decamethyl-1,20-henicosadiene 432 (M+), 125, 109, 97, 83, 69, 55, 43
42 19.6 2,4,6,8,10,12,14,16,18,20-decamethyl-1,22-tricosadiene 460 (M+), 125, 111, 97,83, 69, 55, 41
43 19.7 2,4,6,8,10,12,14,16,18,20-decamethyl-1-tricosene 153, 139, 125, 111, 97, 83, 69, 57, 43
44 20.0 2,4,6,8,10,12,14,16,18,20,22-undecamethyl-1,22-tricosadiene 474 (M+), 125, 111, 97, 83, 69, 55, 43
3.1.2 Polystyrene (PS)
All the EGA-MS curves feature a single peak in the temperature interval 350-450 °C (Fig-
ure S.2 in Supplementary Materials), with a maximum TD at about 406 °C. A slight de-
crease of the onset temperature (ΔT= 8 °C) observed in the EGA profile of the PS-3w and
PS-4w samples can be associated to the formation of photo-oxidized products, although
in a comparatively smaller amounts with respect to the case of PP as seen before. In the
average mass spectrum of PS (350-450 °C, Figure S.3 in Supplementary Materials), the
most abundant ions are fragments with m/z 51, 65, 78, 91, 104, 117, 207, corresponding to
the ions in the mass spectra of the well-known pyrolysis products of the polymer (toluene,
styrene, styrene dimer and styrene trimer, Table 3) [20]. By comparing the mass spectra of
the four samples, no significant differences in the relative abundance of the main ions are
detected. In the Py-GC-MS chromatogram of PS-0w (Figure 5 and Table 3) the most abun-
dant pyrolysis products are styrene (n° 2), α-methylstyrene (n° 5), 3-butene-1,3-diyldiben-
zene (styrene dimer, n° 13) and 5-hexene-1,3,5-triyltribenzene (styrene trimer, n° 17). This
is in agreement with the typical thermal degradation processes of PS, mainly character-
ized by depolymerization pathways.
The pyrolysis profile of PS-4w and PS-0w are very similar. This lack of differences be-
tween the two pyrolysis profiles can be explained by the tendency of PS to produce hy-
droquinonic structures as result of photo-oxidation, which are known for their antioxidant
and free radical scavenging properties and are thus likely to generate a chemically altered
surface layer protecting the bulk polymer from further photo-oxidative degrada-
tion[28,31].
The yellowing observed in the PS-4w sample is a direct consequence of such surface-lim-
ited formation of oxidized and possibly conjugated aromatic structures, which do not
Preprints (www.preprints.org) | NOT PEER-REVIEWED | Posted: 30 April 2021 doi:10.20944/preprints202104.0792.v1

10 of 29
significantly affect the EGA-MS curves and the pyrolysis profiles of the aged PS because
degradation only involves a small fraction of the overall polymer mass.
Figure 5 Chromatogram obtained in the Py-GC-MS analysis of the unaged PS (PS-0w). Peak identi-
fication is reported in Table 3.
Table 3 Identification of peaks in the chromatogram obtained in the Py-GC-MS analysis of PS-0w
(Figure 5) [20].
# tr (min) Peak identification Main ions (m/z)
1 6.0 toluene 92, 91, 65
2 8.9 styrene 104, 78, 63, 51
3 9.7 allylbenzene 117, 103, 91, 65
4 9.9 benzaldehyde 106, 105, 77, 51
5 10.2 α-methylstyrene 118, 103, 91, 78, 63, 51
6 10.8 3-butenylbenzene 132, 104, 91, 65
7 11.0 (1-methylenepropyl)-benzene 132, 117, 103, 91, 77, 63, 51
8 11.1 acetophenone 120, 105, 91, 77, 51
9 14.6 1,2-diphenylethane 182, 91, 65
10 14.8 propane-1,2-diyldibenzene 196, 105, 91, 77, 65
11 15.4 1,1'-(1,3-propanediyl)bis-benzene 196, 105, 92, 77, 65, 51
12 15.7 stilbene 180, 179, 165, 152, 102, 89, 76
13 15.8 3-butene-1,3-diyldibenzene (styrene dimer) 208, 193, 130, 115, 104, 91, 77, 65
14 15.9 1-pentene-2,4-diyldibenzen 222, 194, 179, 115, 105, 91, 77
15 16.3 (E)-1-butene-1,4-diyldibenzene 208, 117, 115, 91, 65
16 16.7 hexa-1,5-diene-2,5-diyldibenzene 234, 143, 130, 115, 104, 91, 77, 65
17 19.2 5-hexene-1,3,5-triyltribenzene (styrene trimer) 312, 207, 194, 117, 91, 77
3.1.3 Polyethylene terephthalate (PET)
The EGA profile of the unaged PET-0w sample (Figure S.4 in Supplementary Materials)
shows a peak from 381 °C to 463 °C with a maximum (TD) at 410 °C. The EGA profiles of
the artificially aged samples do not show any significant variation in the TD or in the rela-
tive abundance of the main ions in the average mass spectrum (381-463 °C, Figure S.5 in
Supplementary Materials). The latter are fragments with m/z 44, 77, 105, 122, 149, 297
2.00 4.00 6.00 8.00 10.00 12.00 14.00 16.00 18.00 20.00 22.00 24.000
100
Time (min.)
Re
lative
Ab
un
da
nce
26.00
tolu
en
e
styr
en
e
α-m
eth
ylst
yre
ne st
yre
ne
dim
er
styr
en
etr
imer
1
2
34
5
6
78
9
10
11
12
13
14
15
16
17
Preprints (www.preprints.org) | NOT PEER-REVIEWED | Posted: 30 April 2021 doi:10.20944/preprints202104.0792.v1

11 of 29
which correspond to the ions in the mass spectra of the thermal degradation of the poly-
mer: vinyl benzoate, benzoic acid, divinyl terephthalate, and 2-(benzoyloxy) ethyl vinyl
terephthalate. As in the case of PS, a slight decrease of the onset temperature (ΔT= 7 °C) is
only observed in the EGA profile of the PET-4w sample, that can be related to the for-
mation of photo-oxidation products; an extended artificial aging time would be necessary
to better investigate the degradation behavior. The chromatogram obtained in the Py-GC-
MS analysis of the unaged PET-0w is shown in Figure 6, while peak identification is listed
in Table 4. The main pyrolysis products of PET are vinyl benzoate (n° 9), benzoic acid (n°
10), biphenyl (n° 11), divinyl terephthalate (n° 12) and ethan-1,2-divinyldibenzoate (n° 18).
The Py-GC-MS profile of the PET-4w sample is also in this case very similar to that of the
unaged polymer, in agreement with its well-known higher photostability compared to
polyolefins [28,32]. In the Py-GC-MS profile of the artificially aged polymer only a slight
increase of the relative abundance of acetophenone, benzaldehyde, vinyl benzoate, diben-
zofuran, and fluorenone is observed.
Figure 6 Chromatogram obtained in the Py-GC-MS analysis of the unaged PET (PET-0w). Peak
identification is reported in Table 4.
Table 4 Identification of peaks in the chromatogram obtained in the Py-GC-MS analysis of PET-0w
(Figure 6) [20].
# tr (min) Peak identification Main ions (m/z)
1 2.0 carbon dioxide 44
2 3.5 benzene 78, 63, 51
3 8.3 ethylbenzene 106, 91, 77, 65, 51
4 8.9 styrene 104, 78, 63, 51
5 9.9 benzaldehyde 106, 105, 77, 51
6 10.1 phenol 94, 79, 66, 55, 39
7 10.9 benzeneacetaldehyde 120, 91, 65, 51
8 11.1 acetophenone 120, 105, 77, 51
9 11.8 vinyl benzoate 148, 105, 77, 51
10 12.4 benzoic acid 122, 105, 77, 51
11 13.7 biphenyl 154, 131, 115, 76
12 14.8 divinyl terephthalate 175, 147, 132, 104, 76
13 15.1 4-(vinyloxycarbonyl) benzoic acid 149, 121, 76, 65
2.00 4.00 6.00 8.00 10.00 12.00 14.00 16.00 18.00 20.00 22.00 24.00
0
100
Time (min.)
Re
lative
Ab
un
da
nce
26.00
ben
zen
e
styr
ene
vin
ylb
enzo
ate
ben
zoic
acid
div
inyl
tere
ph
thal
ate
eth
an-1
,2-d
iyld
iben
zoat
e
1
2
3
4
5 6 7
8
9
10
11
12
13
14
1516
17
18
1920
21
22
Preprints (www.preprints.org) | NOT PEER-REVIEWED | Posted: 30 April 2021 doi:10.20944/preprints202104.0792.v1
12 of 29
14 15.2 benzophenone 182, 152, 105, 77, 51
15 15.7 stilbene 180, 179, 165, 152, 102, 89, 76
16 15.9 9H-fluoren-9-one 180, 152, 126, 76
17 16.7 unknown 198, 181, 152, 76
18 17.9 ethan-1,2-divinyldibenzoate 227, 105, 77, 51
19 18.2 unknown 230, 198, 181, 152, 115
20 19.0 unknown 296, 149, 131, 105, 77, 51
21 19.8 2-(benzoyloxy) ethyl vinyl terephthalate 297, 149, 105, 77
22 22.0 ethan-1,2-diyl divinyl diterephthalate 367, 325, 296, 175, 162, 104
3.1.4 Polyethylene (PE)
Both HDPE and LDPE were investigated, both discussed in this section. The EGA profile
of the unaged (Figure S.6 in Supplementary Materials) LDPE-0w sample shows a peak
with TD at 454 °C; artificial aging induces a slight increase of the baseline and a shift (ΔT
= 7 °C) of the onset to lower temperatures, indicative of the formation of oxidation prod-
ucts. No significant changes are observed in the average mass spectra of the artificially
aged LDPE samples (Figure S.8 in Supplementary Materials). The main ions are the frag-
ments with m/z 43, 57, 69, 83, 97, 111, 125, 139, 154 which correspond to polyethylene
oligomers of different chain lengths (Table 5) [20]. The EGA curves of the unaged and
aged HDPE samples (Figure S.7 in Supplementary Materials) show a peak with TD at 474
°C, 20 degrees higher than that recorder for LDPE samples. Even in this case, artificial
aging induces a slight decrease of the onset temperature (ΔT = 6 °C) probably due to the
presence of oxidation products at low concentration as a result of photo-oxidative degra-
dation. The average mass spectra from the EGA profiles of the HDPE samples (Figure S.9
in Supplementary Materials) are equivalent to the LDPE ones. The results obtained in the
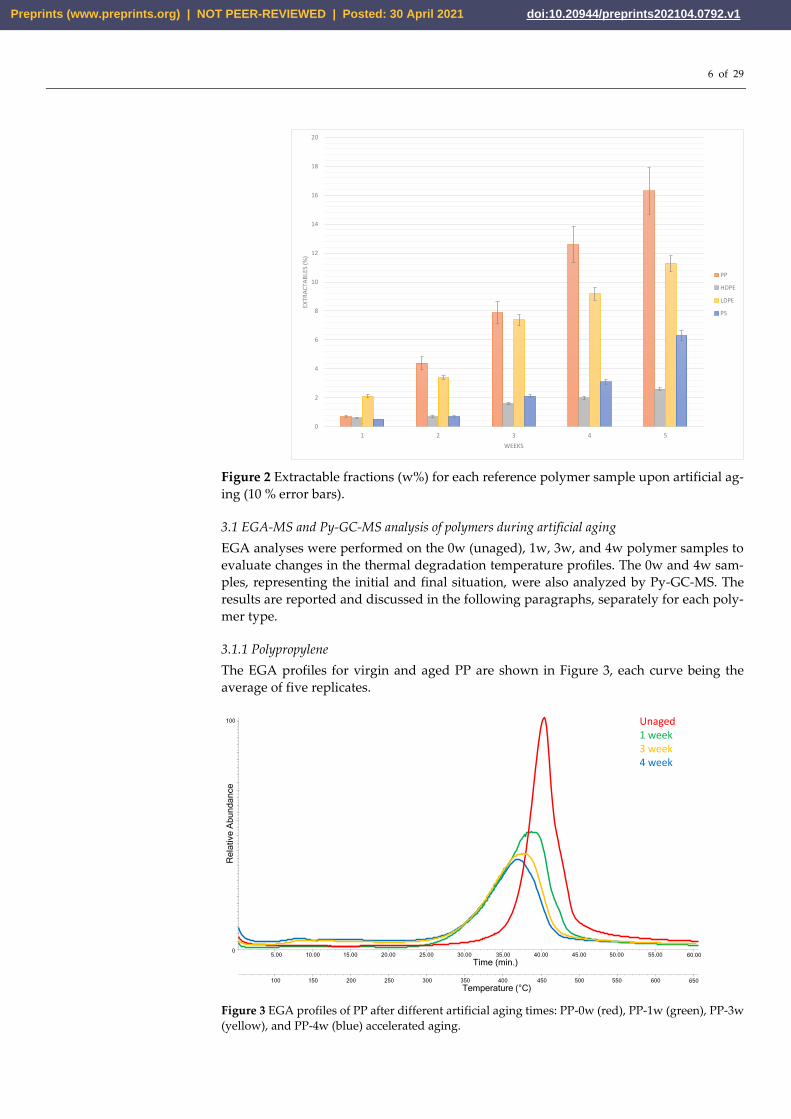
Py-GC-MS of the LDPE-0w are reported in Figure 7 and Table 5. The pyrogram features a
series of clusters comprising three main peaks each, assigned to the diene (most likely an
α,ω-diene, Cn:2), the monoalkene (most likely a 1-alkene, Cn:1), and the alkane, respectively,
for any given Cn hydrocarbon in the chain lengths range C6-C26. At the right of each clus-
ter, the peak corresponding to the Cn-2 linear aldehyde is observed, with low relative in-
tensity.
Figure 7 Chromatogram obtained in the Py-GC-MS analysis of the unaged LDPE (LDPE-0w). Cn:1
refers to 1-alkenes of a given Cn hydrocarbon. Peak identification is reported in Table 5.
Table 5 Identification of peaks in the chromatogram obtained in the Py-GC-MS analysis of LDPE-
0w (Figure 7) [20]. M+ refers to the molecular ion.
2.00 4.00 6.00 8.00 10.00 12.00 14.00 16.00 18.00 20.00 22.00
0
100
Time
Re
lative
Ab
un
da
nce
24.00
C9
:1
C8:
1
C10
:1
C11
:1
C12
:1
C13
:1
C14
:1 C15
:1
C16
:1
C17
:1
C18
:1C
19:1
C20
:1C
21:1
C22
:1C
23:1
C24
:1C
25:1
C26
:1
C6:
1
C7:
1
Preprints (www.preprints.org) | NOT PEER-REVIEWED | Posted: 30 April 2021 doi:10.20944/preprints202104.0792.v1

13 of 29
# tr (min) Peak identification Main ions (m/z)
1 2.7 1-hexene 84 (M+), 69, 56, 41
2 3.9 1-heptene 98 (M+), 83, 70, 56, 41
3 4.0 heptane 100 (M+), 71, 57, 43
4 6.7 1-octene 112 (M+), 97, 83, 70, 55, 41
5 6.9 octane 114 (M+), 85, 71, 57, 43
6 8.7 1,8-nonadiene 109, 96, 81, 67, 55, 41
7 8.8 1-nonene 126 (M+), 97, 83, 69, 56, 41
8 9.0 nonane 128 (M+), 99, 85, 71, 57, 43
9 10.1 1,9-decadiene 110, 95, 81, 67, 55, 41
10 10.2 1-decene 140 (M+), 111, 97, 83, 70, 55, 41
11 10.3 decane 142 (M+), 117, 99, 85, 71, 57, 43
12 11.2 1,10-undecadiene 124, 109, 95, 81, 67, 55, 41
13 11.3 1-undecene 154 (M+), 126, 111, 97, 83, 70, 55, 43
14 11.4 undecane 156 (M+), 98, 85, 71, 57, 43
15 12.1 1,11-dodecadiene 138, 124, 109, 95, 81, 67, 55, 41
16 12.13 1-dodecene 168 (M+), 140, 125, 111, 97, 83, 69, 55, 41
17 12.2 dodecane 170 (M+), 128, 85, 71, 57, 43
18 12.3 decanal 138, 128, 112, 95, 82, 68, 55, 41
19 12.8 1,12-tridecadiene 123, 109, 95, 81, 67, 55, 41
20 12.9 1-tridecene 125, 111, 97, 83, 69, 55, 41
21 13.0 tridecane 184 (M+), 99, 85, 71, 57, 43
22 13.05 undecanal 152, 126, 109, 96, 82, 68, 55, 41
23 13.5 1,13-tetradecadiene 123, 109, 96, 81, 67, 55, 41
24 13.6 1-tetradecene 125, 111, 97, 83, 69, 55, 41
25 13.64 tetradecane 198 (M+), 99, 85, 71, 57, 43
26 13.72 dodecanal 166, 140, 123, 110, 96, 82, 68, 57, 41
27 14.2 1,14-pentadecadiene 123, 109, 96, 81, 67, 55, 41
28 14.25 1-pentadecene 210 (M+), 125, 111, 97, 83, 69, 55, 41
29 14.3 pentadecane 212 (M+), 113, 99, 85, 71, 57, 43
30 14.4 tridecanal 180, 154, 124, 110, 96, 82, 68, 57, 43
31 14.8 1,15-hexadecadiene 123, 109, 96, 82, 67, 55, 41
32 14.86 1-hexadecene 224 (M+), 125, 111, 97, 83, 69, 55, 41
33 14.9 hexadecane 226 (M+), 99, 85, 71, 57, 43
34 15.0 tetradecanal 194, 168, 138, 110, 96, 82, 69, 57, 41
35 15.4 1,16-heptadecadiene 137, 123, 109, 96, 82, 69, 55, 41
36 15.44 1-heptadecene 238 (M+), 139, 125, 111, 97, 83, 69, 55, 41
37 15.5 heptadecane 240 (M+), 99, 85, 71, 57, 43
38 15.6 pentadecanal 208, 180, 111, 96, 82, 69, 57, 41
39 15.9 1,17-octadecadiene 123, 109, 96, 82, 69, 55, 41
40 16.0 1-octadecene 252 (M+), 125, 111, 97, 83, 69, 55, 41
41 16.02 octadecane 254 (M+), 99, 85, 71, 57, 43
Preprints (www.preprints.org) | NOT PEER-REVIEWED | Posted: 30 April 2021 doi:10.20944/preprints202104.0792.v1

14 of 29
42 16.1 hexadecanal 222, 124, 111, 96, 82, 69, 57, 43
43 16.5 1,18-nonadecadiene 137, 123, 109, 96, 82, 69, 55, 41
44 16.51 1-nonadecene 139, 125, 111, 97, 83, 69, 55, 43
45 16.54 nonadecane 268 (M+), 127, 113, 99, 85, 71, 57, 43
46 16.7 heptadecanal 236, 208, 137, 124, 109, 96, 82, 68, 57, 41
47 16.97 1,19-eicosadiene 137, 123, 109, 96, 82, 69, 55, 41
48 17.01 1-eicosene 139, 125, 111, 97, 83, 69, 55, 43
49 17.04 eicosane 127, 113, 99, 85, 71, 57, 43
50 17.1 octadecanal 250, 137, 124, 109, 96, 82, 68, 57, 43
51 17.4 1,20-heneicosadiene 137, 123, 109, 96, 82, 69, 55, 41
52 17.48 1-heneicosene 139, 125, 111, 97, 83, 69, 55, 43
53 17.50 heneicosane 113, 97, 85, 71, 57, 43
54 17.6 nonadecanal 264, 202, 137, 124, 110, 97, 82, 69, 57, 43
55 17.91 1,21-docosadiene 151, 137, 123, 109, 96, 82, 67, 55, 41
56 17.94 1-docosene 139, 125, 111, 97, 83, 69, 55, 43
57 17.96 docosane 310 (M+), 99, 85, 71, 57, 43
58 18.1 eicosanal 278, 250, 123, 111, 96, 82, 69, 57, 43
59 18.3 1,22-tricosadiene 137, 123, 109, 96, 82, 69, 55, 41
60 18.37 1-tricosene 322 (M+), 125, 111, 97, 83, 69, 55, 43
61 18.39 tricosane 324 (M+), 113, 97, 85, 71, 57, 43
62 18.5 heneicosanal 292, 138, 123, 111, 96, 82, 68, 57, 43
63 18.77 1,23-tetracosadiene 334 (M+), 137, 123, 109, 96, 82, 69, 55, 41
64 18.8 1-tetracosene 336 (M+), 139, 125, 111, 97, 83, 69, 57, 43
65 19.0 docosanal 306, 251, 138, 124, 111, 96, 82, 71, 57, 43
66 19.2 1-pentacosene 350 (M+), 139, 125, 111, 97, 83, 69, 57, 43
67 19.35 tricosanal 320, 139, 125, 111, 97, 83, 71, 57, 43
68 19.6 1-hexacosene 364 (M+), 139, 125, 111, 97, 83, 69, 57, 43
69 19.8 unknown 297, 149, 105, 77
After artificial aging, new peaks next to the triplets are observed in the pyrolytic profiles
of both HDPE and LDPE, that can be associated to oxidation products and in particular to
linear ketones, linear saturated alcohols, and monocarboxylic acids. Peaks corresponding
to saturated aldehydes, with lengths up to C24, increase in their relative intensity with
aging (Figure 8) [33]. The complete list of all the pyrolysis products detected in the chro-
matogram obtained in the Py-GC-MS analysis of LDPE-4w is reported in Table S.1 in the
Supplementary Materials. The oxidation products detected in the chromatogram can ei-
ther be the products of the thermolytic cleavage of oxidized high molecular weight poly-
mer chains, or smaller oxidized fragments produced by photolytic oxidation and chain
scission as a result of photo-oxidative artificial aging, or both. Even though the general
features of the pyrolysis profiles of the two aged polymers are very similar, in the case of
LDPE a slightly higher number of oxidized pyrolysis products were detected compared
to HDPE. Tables S.2 and S.3 report the complete list of the pyrolysis products identified
in the chromatogram obtained in the Py-GC-MS analysis of the HDPE-0w and HDPE-4w
samples, respectively.
Preprints (www.preprints.org) | NOT PEER-REVIEWED | Posted: 30 April 2021 doi:10.20944/preprints202104.0792.v1

15 of 29
Figure 8 Chromatograms (15.20 – 17.20 min) obtained in the Py-GC-MS analysis of LDPE-0w (red)
and LDPE-4w (blue). Cn:2 refers to α,ω-dienes, Cn:1 to 1-alkenes, and Cn to alkanes of a hydrocarbon
with n carbon atoms.
3.2 Analysis of extractable fraction of reference polymers before and after artificial aging
The presence of low amounts of low molecular weight degradation and oxidation prod-
ucts may not be detectable by Py-GC-MS analysis of the aged polymer, because the peaks
deriving from the unaltered fraction of the polymer could hinder the detection of low-
intensity peaks associated to the altered portion of the polymer. For this reason, the alter-
ation induced on the five reference plastics by the photoaging was investigated also by a
complementary approach: the aged samples were extracted with polar organic solvent
and the composition of the extracts was investigated by size-exclusion chromatography
(SEC) and Py-GC-MS, and compared with the extracts obtained from the unaged corre-
sponding polymer. PP, PET, HDPE, and LDPE were subjected to DCM extraction, while
MeOH was used for PS. Procedural blanks were also prepared for comparison. Py-GC-
MS analysis of the extractable fractions allowed us to achieve an enhanced sensitivity to-
wards the degradation products, focusing on the extractable and leachable components
to gain additional information on the degradation processes occurring during the aging
of MPs. Py-GC-MS was carried out with the addition of HMDS in order to detect and
characterize the low-volatile and polar compounds such as aldehydes, alcohols and car-
boxylic acids strictly related to photo-oxidative degradation; HMDS also achieves the
derivatization of PET pyrolysis products.
3.2.1 Polypropylene
The chromatogram obtained in the Py(HMDS)-GC-MS analysis of the DCM extract of the
PP-4w sample is reported in Figure 9, with peak identification in Table 6. The pyrolytic
profile shows oxidized products such as different chain length mono- and dicarboxylic
acid in the first part of the chromatogram (14-24 min). In particular, low-molecular weight
differently branched monocarboxylic acids are detected in the C2-C6 range, such as buta-
noic acid (n° 5), 2-butenoic acid (n° 6), 2-methyl-4-pentenoic acid (n° 8), 3-methyl-3-bu-
tenoic acid (n° 9), 2-hydroxypropanoic acid (n° 12), hydroxyacetic acid (n° 13) 2-hydroxy-
2-propenoic acid (n° 15), 2-hydroxybutanoic acid (n° 16), 4-oxopentanoic acid (n° 17), 3-
hydroxypropanoic acid (n° 18), 3-hydroxybutanoic acid (n° 19), and 3-hydroxy-3-butenoic
acid (n° 20). Low molecular weight dicarboxylic acids such as butanedioic acid (n° 22) and
methylbutanedioic acid (n° 23) are also observed in the first part of the profile. The second
C 18:1
15.20 15.40 15.60 15.80 16.00 16.20 16.40 16.60 16.80 17.00 17.20
Time (min.)
C 13ca
rbox
ylic
C 141-
alco
hol
C 17:2
C 17:1
C 17
C 15al
dehy
de
C 14ca
rbox
ylic
C 151-
alco
hol
C 18:2 C 18
C 162-
keto
ne C 16al
dehy
de
C 15ca
rbox
ylic
C 161-
alco
hol
C 19:2
C 19:1
C 19C 17
2-ke
tone
C 17al
dehy
de
C 16ca
rbox
ylic
C 20:2
C 20:1
C 20C 18
2-ke
tone
C 18al
dehy
de
LDPE unaged
LDPE 4 weeks
Preprints (www.preprints.org) | NOT PEER-REVIEWED | Posted: 30 April 2021 doi:10.20944/preprints202104.0792.v1

16 of 29
part of the chromatogram (24-35 min) is mainly characterized by different chain-length
PP oligomers that are soluble in DCM.
Figure 9 Chromatogram obtained in the Py(HMDS)-GC-MS analysis of the DCM extract of PP-4w.
Peak identification is reported in Table 6.
Table 6 Identification of peaks in the chromatogram obtained in the Py(HMDS)-GC-MS analysis of
the DCM extract of PP-4w (Figure 9). Bold: most abundant species in the chromatogram.
# tr (min) Peak identification Main ions (m/z)
1 14.3 2,4-dimethyl-1-heptene 126, 83, 70, 55
2 14.7 xylene 106, 91
3 14.9 ethoxytriethylsilane 131, 103, 73
4 15.05 octamethyltrisiloxane 221, 73
5 15.1 butanoic acid, trimethylsilyl ester 145, 117, 75
6 16.2 2-butenoic acid, tert-butyldimethylsilyl ester 143, 99, 75, 59
7 16.9 1,2,3-trimethylbenzene 120, 105
8 17.6 4-pentenoic acid, 2-methyl, trimethylsilyl ester 186, 171, 157, 117, 73
9 17.8 3-butenoic acid,3-methyl, trimethylsilyl ester 172, 157, 127, 113, 73, 54
10 18.5 methyltris(trimethylsiloxy)silane 295, 207, 191, 73
11 18.7 unknown 171, 146, 133, 117, 73
12 18.9 propanoic acid, 2-[(trimethylsilyl)oxy]-, trimethylsilyl ester 233, 129, 191, 147, 133, 117, 73
13 19.1 acetic acid, [(trimethylsilyl)oxy]-, trimethylsilyl ester 205, 190, 161, 147,133, 117, 103
14 19.2 unknown 171, 157, 145, 129, 117, 103, 75
15 19.3 2-propenoic acid, 2-[(trimethylsilyl)oxy]-, trimetylsilyl ester 217, 147, 131, 73
16 19.9 butanoic acid, 2-[(trimethylsilyl)oxy]-, trimethylsilyl ester 233, 205, 190, 147, 131, 73
17 20.1 pentanoic acid, 4-oxo-, trimethylsilyl ester 173, 155, 145, 131, 75
18 20.2 propanoic acid, 3-[(trimethylsilyl)oxy]-, trimethylsilyl ester 219, 177, 147, 133, 116, 73
19 20.5 butanoic acid, 3-[(trimethylsilyl)oxy]-, trimethylsilyl ester 223, 191, 147, 130, 117, 73
20 21.2 3-butenoic acid,3-(trimethylsilyloxy)-,trimethylsilyl ester 231, 157, 147, 73
21 22.1 malic acid, O-(trimethylsilyl)-, bis(trimethylsilyl) ester 245, 233, 147, 73
22 22.7 butanedioic acid, bis(trimethylsilyl) ester 247, 147, 129, 73
16.00 18.00 20.00 22.00 24.00 26.00 28.00 30.00 32.00 34.000
100
Time (min.)
Re
lative
Ab
un
da
nce
2,4-
dim
ethy
l-1-
hep
ten
e
Different chain lenght PP oligomers
1
2
3
4
5
6
7
98
10
11
12
13
15
16
17
18
19
2021
22
23
Preprints (www.preprints.org) | NOT PEER-REVIEWED | Posted: 30 April 2021 doi:10.20944/preprints202104.0792.v1

17 of 29
23 22.9 butanedioic acid, methyl-, bis(trimethylsilyl) ester 261, 217, 147, 129, 73
These oxidized products could not be detected in the pyrogram of the aged bulk sample
analyzed without in situ thermally assisted derivatization with HMDS of the carbox-
ylic/hydroxyl functions, due both to their low concentration in the bulk polymer, and to
their polarity - low volatility - that made them unsuitable as such for GC separation. The
carboxylic and dicarboxylic acids observed in the Py-GC-MS analysis of the extract of ar-
tificially aged PP-4w are not detected in the extract of unaged PP-0w (Figure S.10 in Sup-
plementary Materials), clearly indicating that they are the result of photo-oxidative deg-
radation rather than of pyrolytic fragmentation. Figure 10 reports the SEC chromatograms
(10-25 min) obtained for the DCM extracts of PP-0w (red), PP-1w (green), PP-3w (yellow),
and PP-4w (blue). The profiles show two peaks at high retention times (about 20.4 minutes
and 22.5 minutes) corresponding to low molecular weight fractions. This is expected since
high molecular weight polyolefins are insoluble in DCM. No significant differences are
highlighted when comparing the SEC profiles of the unaged and aged PP extracts.
Figure 10 SEC chromatograms (10-25 min) of the DCM extracts of PP-0w (red), PP-1w (green), PP-
3w (yellow), and PP-4w (blue); refractive index detector was used.
3.2.2 Polystyrene
The chromatogram obtained in the Py(HMDS)-GC-MS analysis of the MeOH extract of
PS-4w is reported in Figure 11. Peak identification is in Table 7. The main pyrolysis prod-
ucts are the same as those observed in the Py-GC-MS chromatogram of PS-4w analyzed
in “bulk” (non-subjected to extraction, Figure 5): styrene (n° 2), benzoic acid (n° 26), its
dimer (n° 39), and its trimer (n° 53). Different acids and alcohols deriving from benzoic
acid are detected, like 4-methylphenol (n° 20), 1-phenylethenol (n° 25), 3-methylphenol
(n° 27), phenylacetic acid (n° 28), phenylpropanoic acid (n° 32), and 4-hydroxybenzoic
acid (n° 36); dicarboxylic acids and other carboxylic acids are also found: 2-hydroxy-pro-
panoic acid (n° 14), hydroxyacetic acid (n° 16), 4-hydroxy pentanoic acid (n° 17), 3-hy-
droxypropanoic acid (n° 19), butanedioic acid (n° 29), methylbutanedioic acid (n° 30), 1,4-
benzenedicarboxylic acid (n° 42), pentadecanoic acid (n° 48), hexadecenoic acid (n° 51),
and octadecanoic acid (n° 52).
-1000
0
1000
2000
3000
4000
5000
6000
7000
10 15 20 25
Inte
nsity
(A.U
.)
Time (min.)
unaged
1 week
3 week
4 week
Preprints (www.preprints.org) | NOT PEER-REVIEWED | Posted: 30 April 2021 doi:10.20944/preprints202104.0792.v1

18 of 29
Figure 11 Chromatogram obtained in the Py(HMDS)-GC-MS analysis of the MeOH extract of PS-
4w. Peak identification is reported in Table 7.
Table 7 Identification of peaks in the chromatogram obtained in the Py(HMDS)-GC-MS analysis of
the MeOH extract of PS-4w (Figure 11). Bold: most abundant species in the chromatogram.
# tr (min) Peak identification Main ions (m/z)
1 14.9 ethylbenzene 106, 91, 77, 65, 51
2 15.5 styrene 104, 89, 78, 63, 51
3 16.1 benzene, (1-methylethyl)- 120, 105, 91, 77, 51
4 16.6 unknown 175, 146, 132, 115, 102
5 16.7 HMDS unknown 222, 206, 190, 132, 74
6 17.3 HMDS unknown 220, 207, 188, 132, 73
7 17.4 cyclotrisiloxane, hexamethyl- 207, 191, 133, 96
8 17.9 cyclotetrasiloxane, octamethyl- 281, 265, 207, 191, 133, 73
9 18.1 benzene, 1-propenyl- 117, 103, 91, 77, 63, 51
10 18.2 benzene, (1-methylene-2-propenyl)- 130, 115, 102, 91, 77, 63, 51
11 18.5 tetrasiloxane, decamethyl- 295, 207, 191, 73
12 18.6 silane, trimethylphenoxy- 166, 151, 135, 91, 77
13 18.7 benzene, (1-methylenepropyl)- 132, 117, 103, 91, 77, 63, 51
14 18.8 propanoic acid, 2-[(trimethylsilyl)oxy]-, trimethylsilyl ester 191, 147, 133, 117, 73
15 18.9 acetophenone 120, 105, 77, 51
16 19.1 acetic acid, [trimethylsilyl)oxy]-, trimethylsilyl ester 205, 177, 147, 133, 73
17 20.0 pentanoic acid, 4-oxo, trimethylsilyl ester 173, 145, 131, 75
18 20.1 4,6-dioxa-5-aza-2,3,7,8-tetrasilanonane-2,2,3,3,7,7,8,8-octamethyl- 294, 206, 190, 130, 73
19 20.2 propanoic acid, 3-[(trimethylsilyl)oxy]-, trimethylsilyl ester 219, 177, 147, 133, 116, 73
20 20.3 silane, trimethyl(4-methylphenoxy)- 180, 165, 149, 135, 91
21 20.9 cyclopentasiloxane, decamethyl 355, 267, 251, 187, 73
22 21.2 propanedioic acid, bis(trimethylsilyl) ester 233, 179, 147, 73
23 21.3 pentasiloxane, dodecamethyl- 369, 353, 281, 265, 207, 147, 43
24 21.6 unknown 281, 192, 117, 151, 135, 115, 73
25 21.7 1-phenyl-1-(trimethylsilyloxy)ethylene 191, 177, 135, 103, 91, 75
16.00 18.00 20.00 22.00 24.00 26.00 28.00 30.00 32.00 34.00
0
100
Time (min.)
Re
lative
Ab
un
da
nce
styr
ene
ben
zoic
acid
TM
S
styr
ene
dim
er
styr
ene
trim
er
1
2
3
4
5
6
78
910
1114
16
17
1819
21
22
26
25
27
28
29
30
3132
33
34
35
36
37 38
3953
5240
41
42
43
45
46
47
4849
50
51
Preprints (www.preprints.org) | NOT PEER-REVIEWED | Posted: 30 April 2021 doi:10.20944/preprints202104.0792.v1

19 of 29
26 21.9 benzoic acid trimethylsilyl ester 194, 179, 135, 105, 77, 51
27 22.2 1-dimethylvinylsilyloxy-3-methylbenzene 192, 117, 165, 151, 135, 91
28 22.5 phenylacetic acid, trimethylsilyl ester 193, 164, 91, 73
29 22.7 butanedioic acid, bis(trimethylsilyl) ester 147, 172, 147, 73
30 22.9 butanedioic acid, methyl-, bis(trimethylsilyl) ester 261, 217, 147, 73
31 23.4 hexasiloxane, tetradecamethyl- 443, 355, 281, 267, 221, 147, 73
32 24.1 phenylpropanoic acid, trimethylsilyl ester 222, 207, 104, 91, 75
33 25.5 bibenzyl 182, 91, 65
34 25.9 1-pentene-2,4-diyldibenzen 194, 115, 105, 91
35 26.4 benzene, 1,1'-(1,2-dimethyl-1,2-ethanediyl)bis- 210, 105, 91, 77
36 26.7 benzoic acid, 4-[(trimethylsilyl)oxy]-, trimethylsilyl ester 282, 267, 223, 193, 73
37 27.1 benzene, 1,1'-(1,3-propanediy)bis- 196, 117, 105, 92, 77, 65, 51
38 27.7 stilbene 179, 165, 152, 102, 89, 76, 51
39 27.8 3-butene-1,3-diyldibenzene (styrene dimer) 208, 130, 115, 104, 91, 77, 65
40 28.0 unknown 194, 165, 152, 115, 91, 77, 51
41 28.4 1H-indene, 2-phenyl- 192, 165, 115, 91
42 28.5 1,4-benzenedicarboxylic acid, bis(trimethylsilyl) ester 310, 295, 251, 221, 140, 103, 73
43 28.7 naphthalene, 1,2-dihydro-4-phenyl- 206, 191, 128, 115, 91
44 28.8 anthracene 178, 152, 89, 76
45 28.9 1,3-butadiene, 1,4-diphenyl- 206, 191, 178, 165, 128, 115, 91
46 29.4 naphthalene, 1-phenyl- 204, 101, 89
47 29.6 2,5-diphenyl-1,5-hexadiene 234, 143, 130, 115, 104, 91, 77
48 29.9 pentadecanoic acid, trimethylsilyl ester 297, 145, 129, 117, 73
49 30.4 fluoranthene, 1,2,3,10b-tetrahydro- 206, 190, 178, 165, 152, 89, 76
50 30.5 naphthalene, 2-phenyl 204, 101, 89
51 30.9 hexadecanoic acid, trimethylsilyl ester 328, 313, 145, 129, 117, 73
52 32.6 octadecanoic acid, trimethylsilyl ester 341, 145, 129, 117, 73
53 34.6 5-hexene-1,3,5-triyltribenzene (styrene trimer) 312, 207, 194, 117, 91, 77
By comparing the pyrolysis profiles of the MeOH extracts of PS-4w and PS-0w samples,
none of the oxidized compounds identified by analyzing the extract of PS-4w are detected
in the extract of the PS-0w (Figure S.11 in Supplementary Materials), indicating that these
compounds are the result of extensive photo-oxidative degradation occurred during arti-
ficial aging. Figures 12.a and 12.b report the SEC chromatograms (10-27 min.) of the
MeOH extracts of PS-0w (red), PS-1w (green), PS-2w (purple), PS-3w (yellow), PS-4w
(blue), acquired at 260 nm and 340 nm, respectively.
Preprints (www.preprints.org) | NOT PEER-REVIEWED | Posted: 30 April 2021 doi:10.20944/preprints202104.0792.v1

20 of 29
Figure 12 SEC chromatograms (10-27 min) of the MeOH extracts of PS-0w (red), PS-1w (green), PS-
2w, PS-3w (yellow), and PS-4w (blue) acquired at 260 nm (a) and 340 nm (b).
The extracts of the aged PS samples show a broad structured band in the 12-20 minutes
time range, which corresponds to fractions with molecular weight ranging from 10200 Da
to values below 500 Da; whereas the profile of the extract of the PS-0w (red) appears less-
intense in the 260 nm chromatogram, and it is almost non-detectable in the 340 nm chro-
matogram, showing a band in the 16-19 minutes time range. Aging induces the disappear-
ance of the peak at 16 minutes (black arrow) and the appearance of a new one at about 19
minutes (dotted black arrow) which corresponds to low-molecular weight fraction (below
500 Da). This suggests that with aging, cross-linking reactions occurs, along with chain
scission reactions that lead to the formation of low-molecular weight products (i.e. styrene
dimers and trimers).
3.2.3 Polyethylene terephthalate
The chromatogram obtained in the Py(HMDS)-GC-MS analysis of the DCM extract of the
PET-4w sample is reported in Figure 13, with peak identification in Table 8. The py-
rograms of the DCM extract of PET-0w and PET-4w samples are very similar, in agree-
ment with the results obtained by EGA-MS and Py-GC-MS for the bulk (non-extracted)
polymer, highlighting PET photo-oxidative stability. In particular, the typical pyrolysis
products of the polymer are observed: benzoic acid (n° 14), vinyl benzoate (n° 22), and
divinyl terephthalate (n° 24). The identified carboxylic acids and benzenedicarboxylic ac-
ids - hydroxybenzoic acid (n° 11), 3-phenyl-2-propenoic acid (n° 20) and 1,4-benezenedi-
carboxylic acid (n° 26) - were also present in the pyrogram of the DCM extract of the
unaged sample, suggesting that they are not the result of photo-oxidative degradation but
more likely they are the result of thermolytic cleavage and rearrangements occurring dur-
ing pyrolysis.
PET extracts were not analyzed by means of SEC since the amount of the extractable frac-
tion and the pyrolysis profiles of the extracts of PET-0w and PET-4w samples were nearly
identical. The content of the extract is thus the intrinsically DCM-soluble fraction of the
polymer, and it can be assumed that it does not derive from degradation phenomena of
the polymer.
0
10000
20000
30000
40000
50000
60000
70000
10 12 14 16 18 20 22 24 26
Inte
nsi
ty (
A.U
.)
Time (min.)
unaged
1 week
2 week
3 week
4 week
-1000
1000
3000
5000
7000
9000
11000
13000
15000
10 12 14 16 18 20 22 24 26
Inte
nsi
ty (
A.U
.)
Time (min.)
unaged
1 week
2 week
3 week
4 week
a) b)
Preprints (www.preprints.org) | NOT PEER-REVIEWED | Posted: 30 April 2021 doi:10.20944/preprints202104.0792.v1

21 of 29
Figure 13 Chromatogram obtained in the Py(HMDS)-GC-MS analysis of the DCM extract of PET-
4w. Peak identification is reported in Table 8.
Table 8 Identification of peaks in the chromatogram obtained in the Py(HMDS)-GC-MS analysis of
the DCM extract of PET-4w (Figure 13). Bold: most abundant species in the chromatogram.
# tr (min) Peak identification Main ions (m/z)
1 15.3 styrene 104, 89, 78, 63, 51
2 16.4 unknown 175, 146, 132, 115, 73
3 16.7 HMDS unknown 222, 206, 190, 132, 74
4 17.2 HMDS unknown 220, 204, 132, 73
5 17.3 HMDS unknown 220, 207, 188, 132, 73
6 17.4 unknown 223, 207, 191, 147, 73
7 17.9 cyclotetrasiloxane, octamethyl 281, 265, 249, 193, 73
8 18.5 tetrasiloxane, decamethyl 295, 207, 191, 73
9 18.6 silane, trimethylphenoxy- 166, 151, 135, 91, 77
10 18.9 acetophenone 120, 105, 77, 51
11 19.1 acetic acid, [trimethylsilyl)oxy]-, trimethylsilyl ester 205, 177, 147, 133, 73
12 20.1 2,2,3,3,7,7,8,8-octamethyl-4,6-dioxa-5-aza-2,3,7,8-tetrasilanonane 294, 206, 190, 73
13 21.5 unknown 293, 205, 146, 130, 73
14 21.8 benzoic acid trimethylsilyl ester 194, 179, 135, 105, 77, 51
15 22.7 butanedioic acid, bis(trimethylsilyl) ester 247, 172, 147, 73
16 23.4 benzoic acid, 2-methyl-, trimethylsilyl ester 208, 193, 149, 119, 91, 65
17 23.7 naphthalene, 2-ethenyl- 154, 128, 76
18 24.4 unknown 442, 354, 266, 206, 146, 130, 73
19 24.5 decanoic acid, trimethylsilyl ester 229, 145, 129, 117, 73
20 24.9 2-propenoic acid, 3-phenyl-,trimethylsilyl ester 220, 205, 161, 131, 103, 75
21 25.2 unknown 275, 147, 117, 73
22 25.6 vinyl benzoate 105, 77, 51
23 25.9 benzoic acid, 3-[(trimethylsilyl)oxy]-, trimethylisilyl ester 282, 267, 223, 193, 73
16.00 18.00 20.00 22.00 24.00 26.00 28.00 30.00 32.00 34.000
100
Time (min.)
Re
lative
Ab
un
da
nce
ben
zoic
acid
TM
S
vin
ylb
enzo
ate
13
4 5
7
8
9
10
11
12
13
14
1516
17 18
19
20
2122
24
23
25
26
27
2829
30
31
1,4
-ben
zen
edic
arb
oxy
lic a
cid
TM
S
32
33
34
35
Preprints (www.preprints.org) | NOT PEER-REVIEWED | Posted: 30 April 2021 doi:10.20944/preprints202104.0792.v1
22 of 29
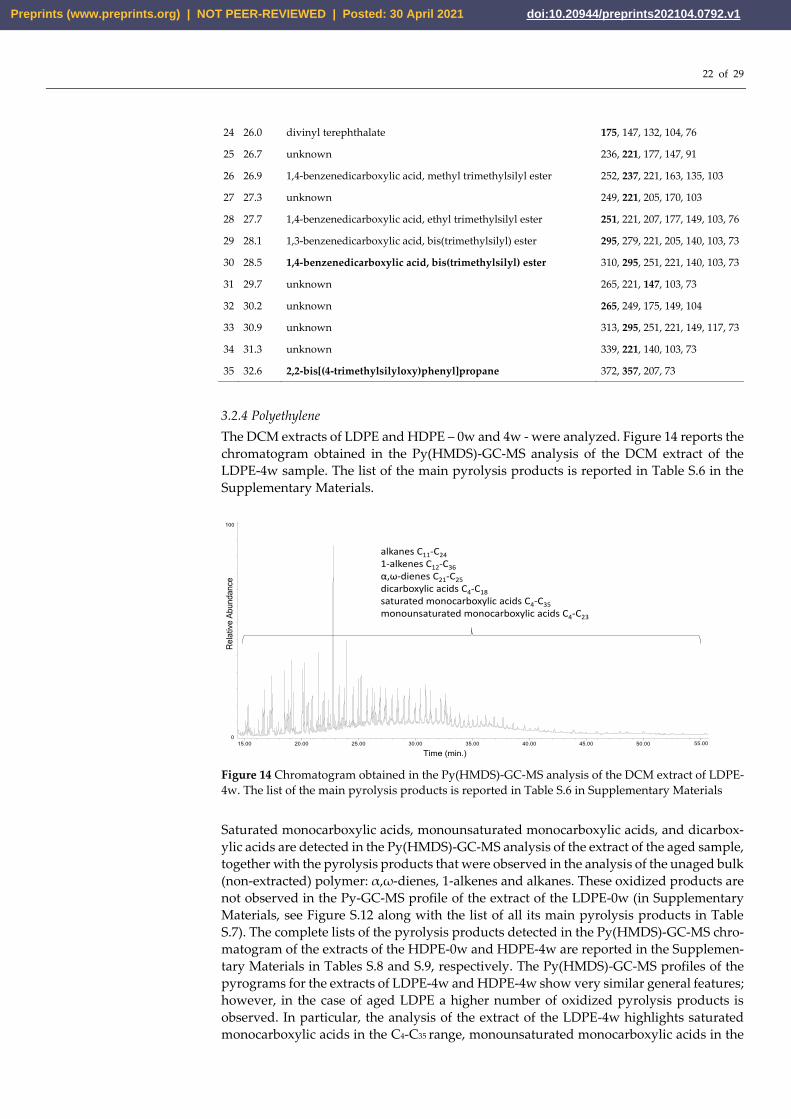
24 26.0 divinyl terephthalate 175, 147, 132, 104, 76
25 26.7 unknown 236, 221, 177, 147, 91
26 26.9 1,4-benzenedicarboxylic acid, methyl trimethylsilyl ester 252, 237, 221, 163, 135, 103
27 27.3 unknown 249, 221, 205, 170, 103
28 27.7 1,4-benzenedicarboxylic acid, ethyl trimethylsilyl ester 251, 221, 207, 177, 149, 103, 76
29 28.1 1,3-benzenedicarboxylic acid, bis(trimethylsilyl) ester 295, 279, 221, 205, 140, 103, 73
30 28.5 1,4-benzenedicarboxylic acid, bis(trimethylsilyl) ester 310, 295, 251, 221, 140, 103, 73
31 29.7 unknown 265, 221, 147, 103, 73
32 30.2 unknown 265, 249, 175, 149, 104
33 30.9 unknown 313, 295, 251, 221, 149, 117, 73
34 31.3 unknown 339, 221, 140, 103, 73
35 32.6 2,2-bis[(4-trimethylsilyloxy)phenyl]propane 372, 357, 207, 73
3.2.4 Polyethylene
The DCM extracts of LDPE and HDPE – 0w and 4w - were analyzed. Figure 14 reports the
chromatogram obtained in the Py(HMDS)-GC-MS analysis of the DCM extract of the
LDPE-4w sample. The list of the main pyrolysis products is reported in Table S.6 in the
Supplementary Materials.
Figure 14 Chromatogram obtained in the Py(HMDS)-GC-MS analysis of the DCM extract of LDPE-
4w. The list of the main pyrolysis products is reported in Table S.6 in Supplementary Materials
Saturated monocarboxylic acids, monounsaturated monocarboxylic acids, and dicarbox-
ylic acids are detected in the Py(HMDS)-GC-MS analysis of the extract of the aged sample,
together with the pyrolysis products that were observed in the analysis of the unaged bulk
(non-extracted) polymer: α,ω-dienes, 1-alkenes and alkanes. These oxidized products are
not observed in the Py-GC-MS profile of the extract of the LDPE-0w (in Supplementary
Materials, see Figure S.12 along with the list of all its main pyrolysis products in Table
S.7). The complete lists of the pyrolysis products detected in the Py(HMDS)-GC-MS chro-
matogram of the extracts of the HDPE-0w and HDPE-4w are reported in the Supplemen-
tary Materials in Tables S.8 and S.9, respectively. The Py(HMDS)-GC-MS profiles of the
pyrograms for the extracts of LDPE-4w and HDPE-4w show very similar general features;
however, in the case of aged LDPE a higher number of oxidized pyrolysis products is
observed. In particular, the analysis of the extract of the LDPE-4w highlights saturated
monocarboxylic acids in the C4-C35 range, monounsaturated monocarboxylic acids in the
15.00 20.00 25.00 30.00 35.00 40.00 45.00 50.00
0
100
Time (min.)
Re
lative
Ab
un
da
nce
55.00
alkanes C11-C24
1-alkenes C12-C36
α,ω-dienes C21-C25
dicarboxylic acids C4-C18
saturated monocarboxylic acids C4-C35
monounsaturated monocarboxylic acids C4-C23
Preprints (www.preprints.org) | NOT PEER-REVIEWED | Posted: 30 April 2021 doi:10.20944/preprints202104.0792.v1

23 of 29
C4-C23 range, and dicarboxylic acids in the C4-C18 range. For the extract of the HDPE-4w
sample, saturated monocarboxylic acids in the Py-GC-MS chromatograms are in the C5-
C20 range, monounsaturated monocarboxylic acids in the C4-C18 range, and dicarboxylic
acids in the C4-C12 range (Table S.9). Even in this case a recurrent pyrolysis pattern can be
highlighted (Figure 15): along with the formation of the α,ω-diene and 1-alkene, we ob-
serve the presence of the dicarboxylic acid (Cn-9), the monounsaturated monocarboxylic
acid (Cn-4) and the monocarboxylic acid (Cn-4) of a given hydrocarbon (Cn).
Figure 15 Chromatogram obtained (26.00-30.50 min) in the Py(HMDS)-GC-MS analysis of the DCM
extract of LDPE-4w. Cn:2 refers to α,ω-dienes, Cn:1 to 1-alkenes, and Cn to alkanes of a given Cn
hydrocarbon.
Figure 16 SEC chromatograms (10-24 min) of the DCM extracts of HDPE-0w (red), HDPE-1w
(green), HDPE-2w (purple), HDPE-3w (yellow), and HDPE-4w (blue) acquired with a RI detector
(a) and at 260 nm (b).
Figures 16.a and 16.b show the SEC chromatograms (10-24 min.) of the DCM extracts of
HDPE-0w (red), HDPE-1w (green), HDPE-2w (purple), HDPE-3w (yellow), and HDPE-
4w (blue) acquired with a RI detector and at 260 nm, respectively. The SEC chromato-
grams acquired with a RI detector of the HDPE samples show two peaks at around 20 and
22 minutes corresponding to the low molecular weight fractions that are expected, as for
PP, due to the fact that the high molecular weight polyolefins are insoluble in DCM. All
the extracts show two signals in the 260 nm chromatographic profiles that are not ob-
served in the chromatograms acquired at 340 nm: the first one at about 10 minutes, corre-
sponding to the one found in the RI chromatograms, and a second one at about 16 minutes
characterized by low intensity that has no corresponding peak in the RI chromatogram,
which suggests the presence of impurities. As for LDPE, the SEC-RI chromatograms are
26.00 26.50 27.00 27.50 28.00 28.50 29.00 29.50 30.00
0
100
Time (min.)
Re
lative
Ab
un
da
nce
30.50
C1
6:1
C1
6C
7 d
icar
bo
xylic
TM
S
C1
2:1
car
bo
xylic
TM
S
C1
2 c
arb
oxy
lic T
MS
C1
7:1
C1
7:2
C8
dic
arb
oxy
lic T
MS
C1
3:1
car
bo
xylic
TM
SC
13
car
bo
xylic
TM
S
C1
8:2
C1
8:1
C9
dic
arb
oxy
lic T
MS
C1
4:1
car
bo
xylic
TM
SC
14
car
bo
xylic
TM
S
C1
8:1
C1
0d
icar
bo
xylic
TM
S
C1
5:1
car
bo
xylic
TM
SC
15
car
bo
xylic
TM
S
C2
0
C1
1 d
icar
bo
xylic
TM
S
0
10000
20000
30000
40000
50000
60000
70000
80000
90000
100000
10 12 14 16 18 20 22 24
Inte
nsi
ty (
A.U
.)
Time (min.)
1 week
2 week
3 week
a)
-1000
-500
0
500
1000
1500
2000
2500
3000
10 12 14 16 18 20 22 24
Inte
nsit
y (A
.U.)
Time (min.)
unaged
2 week
3 week
4 week
b)
Preprints (www.preprints.org) | NOT PEER-REVIEWED | Posted: 30 April 2021 doi:10.20944/preprints202104.0792.v1
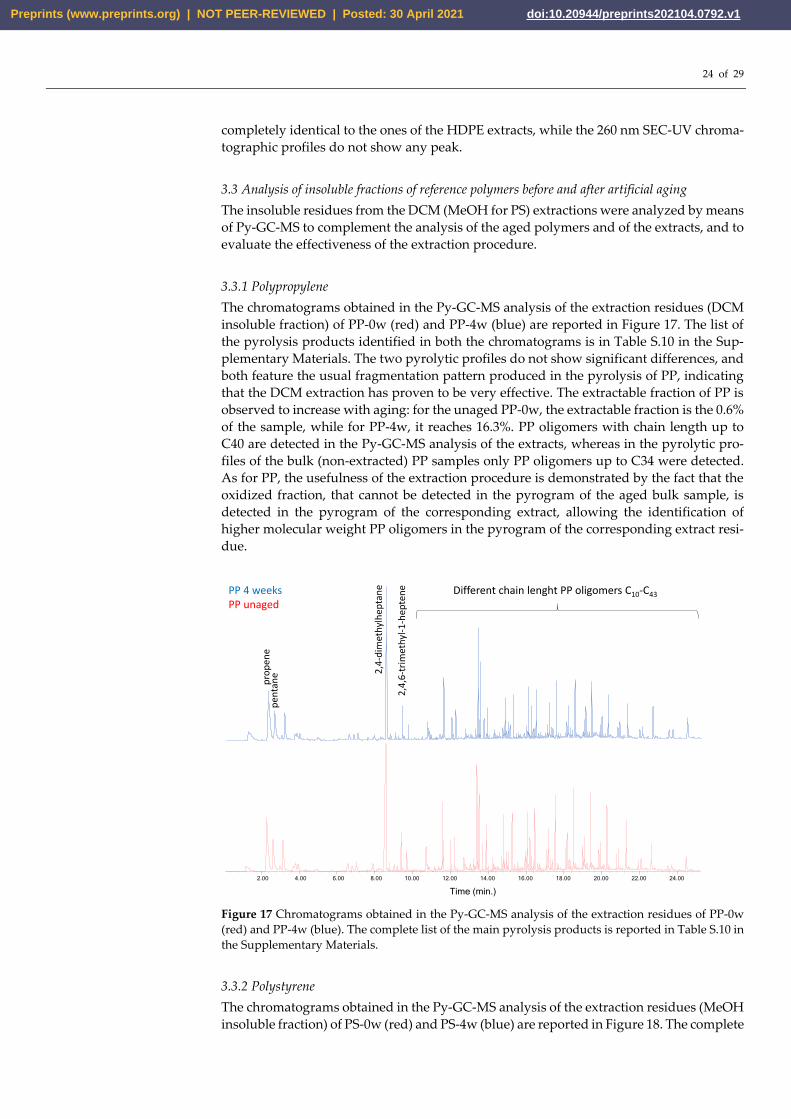
24 of 29
completely identical to the ones of the HDPE extracts, while the 260 nm SEC-UV chroma-
tographic profiles do not show any peak.
3.3 Analysis of insoluble fractions of reference polymers before and after artificial aging
The insoluble residues from the DCM (MeOH for PS) extractions were analyzed by means
of Py-GC-MS to complement the analysis of the aged polymers and of the extracts, and to
evaluate the effectiveness of the extraction procedure.
3.3.1 Polypropylene
The chromatograms obtained in the Py-GC-MS analysis of the extraction residues (DCM
insoluble fraction) of PP-0w (red) and PP-4w (blue) are reported in Figure 17. The list of
the pyrolysis products identified in both the chromatograms is in Table S.10 in the Sup-
plementary Materials. The two pyrolytic profiles do not show significant differences, and
both feature the usual fragmentation pattern produced in the pyrolysis of PP, indicating
that the DCM extraction has proven to be very effective. The extractable fraction of PP is
observed to increase with aging: for the unaged PP-0w, the extractable fraction is the 0.6%
of the sample, while for PP-4w, it reaches 16.3%. PP oligomers with chain length up to
C40 are detected in the Py-GC-MS analysis of the extracts, whereas in the pyrolytic pro-
files of the bulk (non-extracted) PP samples only PP oligomers up to C34 were detected.
As for PP, the usefulness of the extraction procedure is demonstrated by the fact that the
oxidized fraction, that cannot be detected in the pyrogram of the aged bulk sample, is
detected in the pyrogram of the corresponding extract, allowing the identification of
higher molecular weight PP oligomers in the pyrogram of the corresponding extract resi-
due.
Figure 17 Chromatograms obtained in the Py-GC-MS analysis of the extraction residues of PP-0w
(red) and PP-4w (blue). The complete list of the main pyrolysis products is reported in Table S.10 in
the Supplementary Materials.
3.3.2 Polystyrene
The chromatograms obtained in the Py-GC-MS analysis of the extraction residues (MeOH
insoluble fraction) of PS-0w (red) and PS-4w (blue) are reported in Figure 18. The complete
2.00 4.00 6.00 8.00 10.00 12.00 14.00 16.00 18.00 20.00 22.00 24.00
Time (min.)
pro
pen
ep
enta
ne
PP 4 weeksPP unaged
2,4
-dim
eth
ylh
epta
ne
2,4
,6-t
rim
eth
yl-1
-hep
ten
e Different chain lenght PP oligomers C10-C43
Preprints (www.preprints.org) | NOT PEER-REVIEWED | Posted: 30 April 2021 doi:10.20944/preprints202104.0792.v1

25 of 29
list of the pyrolysis products identified in both chromatograms in Table S.11 in the Sup-
plementary Materials. The pyrolytic profiles of the extraction residues of the unaged PS-
0w and aged PS-4w samples are very similar, showing mainly the pyrolysis products of
reference unaged PS: toluene, styrene and its dimer and trimer. By comparing the two
profiles, the only difference is the lower relative abundance of the styrene dimer and sty-
rene trimer in the profile of the aged PS-4w. It is to be underlined that after MeOH extrac-
tion, the insoluble residue of the yellowed PS-4w appears white, indicating that all the
colored products that were formed during artificial aging were efficiently extracted in
MeOH.
Figure 18 Chromatograms obtained in the Py-GC-MS analysis of the extraction residues of PS-0w
(red) and PS-4w (blue). The complete list of the main pyrolysis products is reported in Table S.11 in
Supplementary Materials.
3.3.3 Polyethylene terephthalate
The Py-GC-MS profiles of the extraction residues (DCM insoluble fraction) of PET-0w and
PET-4w resulted completely undistinguishable, as observed also for the DCM extracts.
They are also very similar to the pyrograms of the corresponding bulk (non-extracted)
samples featuring benzene, vinyl benzoate, benzoic acid, biphenyl, divinyl terephthalate
and ethan-1,2-diyldibenzoate. As expected, PET appears not to be affected by photo-oxi-
dation in the adopted conditions. Figure S.13 in the Supplementary Materials reports the
chromatograms obtained in the Py-GC-MS analysis of the extraction residues of the PET-
0w (red) and PET-4w (blue). The complete list of the pyrolysis products identified in both
chromatograms is reported in Table S.12 in the Supplementary Materials.
3.3.4 Polyethylene
The pyrolysis profile of the extraction residues (DCM insoluble fraction) of LDPE, both
unaged 0w and aged 4w, are very similar to the ones of the corresponding profiles for
HDPE. Therefore, only LDPE is discussed here. Figure 19 reports the chromatograms ob-
tained in the Py-GC-MS analysis of the extraction residues of the LDPE-0w (red) and
LDPE-4w (blue). The complete list of the pyrolysis products identified in both the chro-
matograms is reported in Table S.13 in the Supplementary Materials. The pyrogram of the
extraction residue of LDPE-4w does not show the presence of any of the oxidized products
(saturated aldehydes, monocarboxylic acids, alcohols, and ketones) that were observed in
2.00 4.00 6.00 8.00 10.00 12.00 14.00 16.00 18.00 20.00 22.00
Time (min.)24.00
PS 4 weeksPS unaged
tolu
ene
styr
ene
α-m
eth
ylst
yren
e
1,2
-dip
hen
ylet
han
e
styr
ene
dim
er
styr
ene
trim
er
Preprints (www.preprints.org) | NOT PEER-REVIEWED | Posted: 30 April 2021 doi:10.20944/preprints202104.0792.v1

26 of 29
the analysis of the extract. The DCM extraction step has proven to be very effective in the
extraction of HDPE-4w and LDPE-4w samples, just as observed for the PP-4w and PS-4w
samples. The extractable fraction increases with aging for both LDPE (from 2.1% for
LDPE-0w to 11.3% for LDPE-4w) and HDPE (from 0.6% for HDPE-0w to 2.6% for HDPE-
4w). Moreover, even in this case, in the pyrograms of the insoluble residues of both sam-
ples, PE oligomers are observed to present higher molecular weight (up to C33) than in the
pyrograms of the corresponding bulk samples (molecular weight up to C26).
Figure 19 Chromatograms obtained in the Py-GC-MS analysis of the extraction residues of the
LDPE-0w (red) LDPE-4w (blue) The complete list of the main pyrolysis products is reported in Table
S.13 in the Supplementary Materials.
5. Conclusions
EGA-MS, Py-GC-MS, and SEC were applied for the first time to fully characterize
reference polymers in the form of microplastic sand to investigate the effects of artificial
photoaging on micropowders of LDPE, HDPE, PP, PS, and PET and to gain insights on
the nature of the degradation products that may be relevant to a better understanding of
the fate and toxicity potential of microplastics released or generated in the environment
from dispersed plastic waste. To characterize with optimized sensitivity the degraded/ox-
idized fraction, all the polymers - unaged and aged up to 4 weeks in a solarbox - were
fractionated by extraction with refluxing dichloromethane or, in the case of PS, with meth-
anol, that is, with non-solvents for the undegraded polymers but good solvents for the
most highly oxidized and/or low molecular weight/oligomeric fractions generated by the
photo-oxidation processes. Both the bulk polymers (that is, the polymer micropowders
before fractionation by solvent extraction, irrespective of aging) and the fractions obtained
upon solvent extraction (solvent extracts and the insoluble residues) were then further
analyzed and compared.The EGA-MS analyses on bulk polymers allowed to assess the
changes in the thermal degradation behavior induced by photo-oxidative degradation,
while the Py-GC-MS analyses provided additional information on the degradation prod-
ucts formed during induced aging, in particular in the case of HDPE and LDPE for which
carboxylic acids, aldehydes, ketones and alcohols were detected. However, because of
their low concentration, volatility and high polarity, the efficient characterization of these
C1
0:1
2.00 4.00 6.00 8.00 10.00 12.00 14.00 16.00 18.00 20.00 22.00 24.00
Time (min.)
LDPE 4 weeksLDPE unaged
C6
:1
C7
:1 C8
:1
C9
:1
C1
1:1
C1
2:1
C1
3:1
C1
4:1
C1
5:1
C1
6:1
C1
7:1
C1
8:1
C1
9:1
C2
0:1
C2
1:1
C2
2:1
C2
3:1
C2
4:1
C2
5:1
C2
6:1
C2
7:1
C2
8:1
C2
9:1
C3
0:1
C3
1:1
C3
2:1
C3
3:1
Preprints (www.preprints.org) | NOT PEER-REVIEWED | Posted: 30 April 2021 doi:10.20944/preprints202104.0792.v1
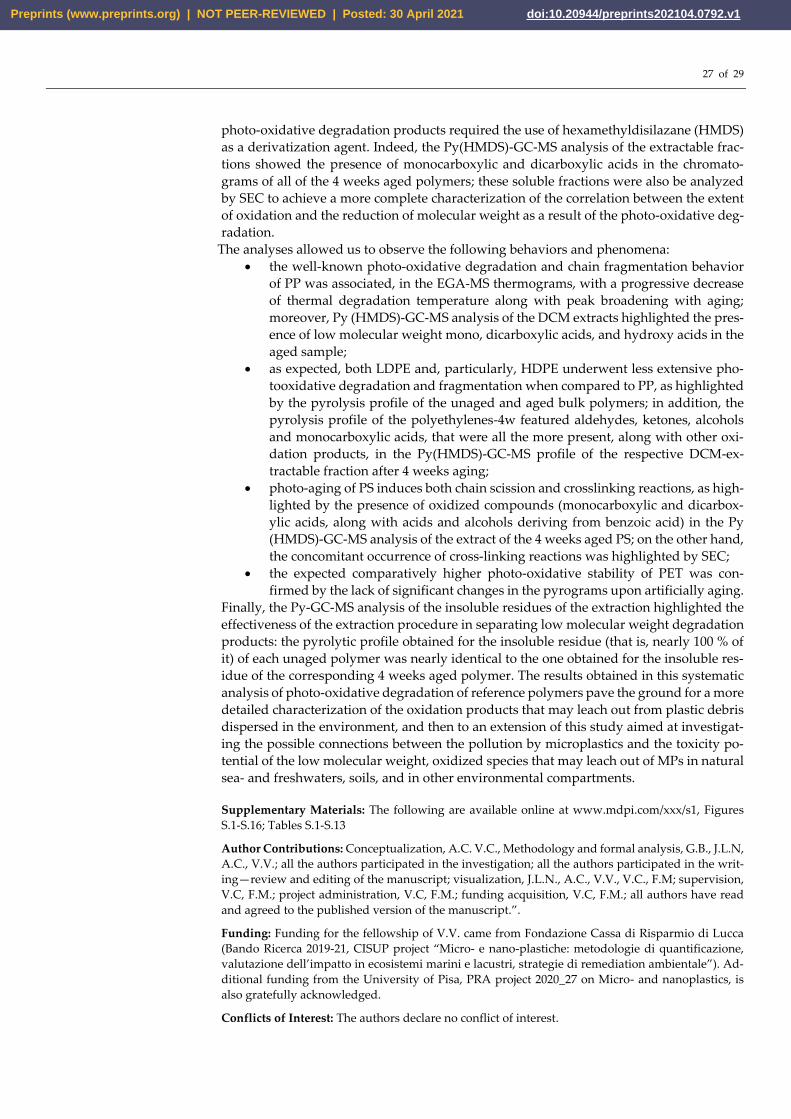
27 of 29
photo-oxidative degradation products required the use of hexamethyldisilazane (HMDS)
as a derivatization agent. Indeed, the Py(HMDS)-GC-MS analysis of the extractable frac-
tions showed the presence of monocarboxylic and dicarboxylic acids in the chromato-
grams of all of the 4 weeks aged polymers; these soluble fractions were also be analyzed
by SEC to achieve a more complete characterization of the correlation between the extent
of oxidation and the reduction of molecular weight as a result of the photo-oxidative deg-
radation.
The analyses allowed us to observe the following behaviors and phenomena:
• the well-known photo-oxidative degradation and chain fragmentation behavior
of PP was associated, in the EGA-MS thermograms, with a progressive decrease
of thermal degradation temperature along with peak broadening with aging;
moreover, Py (HMDS)-GC-MS analysis of the DCM extracts highlighted the pres-
ence of low molecular weight mono, dicarboxylic acids, and hydroxy acids in the
aged sample;
• as expected, both LDPE and, particularly, HDPE underwent less extensive pho-
tooxidative degradation and fragmentation when compared to PP, as highlighted
by the pyrolysis profile of the unaged and aged bulk polymers; in addition, the
pyrolysis profile of the polyethylenes-4w featured aldehydes, ketones, alcohols
and monocarboxylic acids, that were all the more present, along with other oxi-
dation products, in the Py(HMDS)-GC-MS profile of the respective DCM-ex-
tractable fraction after 4 weeks aging;
• photo-aging of PS induces both chain scission and crosslinking reactions, as high-
lighted by the presence of oxidized compounds (monocarboxylic and dicarbox-
ylic acids, along with acids and alcohols deriving from benzoic acid) in the Py
(HMDS)-GC-MS analysis of the extract of the 4 weeks aged PS; on the other hand,
the concomitant occurrence of cross-linking reactions was highlighted by SEC;
• the expected comparatively higher photo-oxidative stability of PET was con-
firmed by the lack of significant changes in the pyrograms upon artificially aging.
Finally, the Py-GC-MS analysis of the insoluble residues of the extraction highlighted the
effectiveness of the extraction procedure in separating low molecular weight degradation
products: the pyrolytic profile obtained for the insoluble residue (that is, nearly 100 % of
it) of each unaged polymer was nearly identical to the one obtained for the insoluble res-
idue of the corresponding 4 weeks aged polymer. The results obtained in this systematic
analysis of photo-oxidative degradation of reference polymers pave the ground for a more
detailed characterization of the oxidation products that may leach out from plastic debris
dispersed in the environment, and then to an extension of this study aimed at investigat-
ing the possible connections between the pollution by microplastics and the toxicity po-
tential of the low molecular weight, oxidized species that may leach out of MPs in natural
sea- and freshwaters, soils, and in other environmental compartments.
Supplementary Materials: The following are available online at www.mdpi.com/xxx/s1, Figures
S.1-S.16; Tables S.1-S.13
Author Contributions: Conceptualization, A.C. V.C., Methodology and formal analysis, G.B., J.L.N,
A.C., V.V.; all the authors participated in the investigation; all the authors participated in the writ-
ing—review and editing of the manuscript; visualization, J.L.N., A.C., V.V., V.C., F.M; supervision,
V.C, F.M.; project administration, V.C, F.M.; funding acquisition, V.C, F.M.; all authors have read
and agreed to the published version of the manuscript.”.
Funding: Funding for the fellowship of V.V. came from Fondazione Cassa di Risparmio di Lucca
(Bando Ricerca 2019-21, CISUP project “Micro- e nano-plastiche: metodologie di quantificazione,
valutazione dell’impatto in ecosistemi marini e lacustri, strategie di remediation ambientale”). Ad-
ditional funding from the University of Pisa, PRA project 2020_27 on Micro- and nanoplastics, is
also gratefully acknowledged.
Conflicts of Interest: The authors declare no conflict of interest.
Preprints (www.preprints.org) | NOT PEER-REVIEWED | Posted: 30 April 2021 doi:10.20944/preprints202104.0792.v1

28 of 29
References
1. 1. Andrady, A.L. Microplastics in the marine environment. Marine Pollution Bulletin 2011, 62, 1596-1605,
doi:https://doi.org/10.1016/j.marpolbul.2011.05.030.
2. 2. Betts, K. Why small plastic particles may pose a big problem in the oceans. Environmental Science & Technology 2008,
42, 8995-8995, doi:10.1021/es802970v.
3. 3. Browne, M.A.; Crump, P.; Niven, S.J.; Teuten, E.; Tonkin, A.; Galloway, T.; Thompson, R. Accumulation of microplastic
on shorelines woldwide: sources and sinks. Environmental Science & Technology 2011, 45, 9175-9179.
4. 4. Frere, L.; Paul-Pont, I.; Rinnert, E.; Petton, S.; Jaffré, J.; Bihannic, I.; Soudant, P.; Lambert, C.; Huvet, A. Influence of
environmental and anthropogenic factors on the composition, concentration and spatial distribution of microplastics: a case
study of the Bay of Brest (Brittany, France). Environmental Pollution 2017, 225, 211-222.
5. 5. Jambeck, J.R.; Geyer, R.; Wilcox, C.; Siegler, T.R.; Perryman, M.; Andrady, A.; Narayan, R.; Law, K.L. Plastic waste inputs
from land into the ocean. Science 2015, 347, 768, doi:10.1126/science.1260352.
6. 6. Shahul Hamid, F.; Bhatti, M.S.; Anuar, N.; Anuar, N.; Mohan, P.; Periathamby, A. Worldwide distribution and abun-
dance of microplastic: How dire is the situation? Waste Management & Research 2018, 36, 873-897,
doi:10.1177/0734242X18785730.
7. 7. Horton, A.A.; Walton, A.; Spurgeon, D.J.; Lahive, E.; Svendsen, K. Microplastics in freshwater and terrestrial environ-
ments: Evaluating the current understanding to identify the knowledge gaps and future research priorities. Science of the Total
Environment 2017, 586, 127-141.
8. 8. Frias, J.; Nash, R. Microplastics: finding a consensus on the definition. Marine pollution bulletin 2019, 138, 145-147.
9. 9. Fendall, L.S.; Sewell, M.A. Contributing to marine pollution by washing your face: Microplastics in facial cleansers.
Marine Pollution Bulletin 2009, 58, 1225-1228, doi:https://doi.org/10.1016/j.marpolbul.2009.04.025.
10. 10. Gewert, B.; Plassmann, M.; Sandblom, O.; MacLeod, M. Identification of Chain Scission Products Released to Water by
Plastic Exposed to Ultraviolet Light. Environmental Science & Technology Letters 2018, 5, 272-276,
doi:10.1021/acs.estlett.8b00119.
11. 11. Ceccarini, A.; Corti, A.; Erba, F.; Modugno, F.; La Nasa, J.; Bianchi, S.; Castelvetro, V. The Hidden Microplastics: New
Insights and Figures from the Thorough Separation and Characterization of Microplastics and of Their Degradation Byproducts
in Coastal Sediments. Environmental Science & Technology 2018, 52, 5634-5643, doi:10.1021/acs.est.8b01487.
12. 12. Bejgarn, S.; MacLeod, M.; Bogdal, C.; Breitholtz, M. Toxicity of leachate from weathering plastics: An exploratory screen-
ing study with Nitocra spinipes. Chemosphere 2015, 132, 114-119, doi:https://doi.org/10.1016/j.chemosphere.2015.03.010.
13. 13. La Nasa, J.; Lomonaco, T.; Manco, E.; Ceccarini, A.; Fuoco, R.; Corti, A.; Modugno, F.; Castelvetro, V.; Degano, I. Plastic
breeze: Volatile organic compounds (VOCs) emitted by degrading macro- and microplastics analyzed by selected ion flow-tube
mass spectrometry. Chemosphere 2021, 270, 128612, doi:https://doi.org/10.1016/j.chemosphere.2020.128612.
14. 14. Schwaferts, C.; Niessner, R.; Elsner, M.; Ivleva, N.P. Methods for the analysis of submicrometer- and nanoplastic parti-
cles in the environment. TrAC Trends in Analytical Chemistry 2019, 112, 52-65, doi:https://doi.org/10.1016/j.trac.2018.12.014.
15. 15. Zhang, S.; Wang, J.; Liu, X.; Qu, F.; Wang, X.; Wang, X.; Li, Y.; Sun, Y. Microplastics in the environment: A review of
analytical methods, distribution, and biological effects. TrAC Trends in Analytical Chemistry 2019, 111, 62-72,
doi:https://doi.org/10.1016/j.trac.2018.12.002.
16. 16. Dümichen, E.; Eisentraut, P.; Bannick, C.G.; Barthel, A.-K.; Senz, R.; Braun, U. Fast identification of microplastics in
complex environmental samples by a thermal degradation method. Chemosphere 2017, 174, 572-584,
doi:https://doi.org/10.1016/j.chemosphere.2017.02.010.
17. 17. David, J.; Weissmannová, H.D.; Steinmetz, Z.; Kabelíková, L.; Demyan, M.S.; Šimečková, J.; Tokarski, D.; Siewert, C.;
Schaumann, G.E.; Kučerík, J. Introducing a soil universal model method (SUMM) and its application for qualitative and quan-
titative determination of poly (ethylene), poly (styrene), poly (vinyl chloride) and poly (ethylene terephthalate) microplastics in
a model soil. Chemosphere 2019, 225, 810-819.
18. 18. David, J.; Steinmetz, Z.; Kučerík, J.; Schaumann, G.E. Quantitative Analysis of Poly(ethylene terephthalate) Microplas-
tics in Soil via Thermogravimetry–Mass Spectrometry. Analytical Chemistry 2018, 90, 8793-8799, doi:10.1021/acs.anal-
chem.8b00355.
19. 19. Primpke, S.; Fischer, M.; Lorenz, C.; Gerdts, G.; Scholz-Böttcher, B.M. Comparison of pyrolysis gas chromatog-
raphy/mass spectrometry and hyperspectral FTIR imaging spectroscopy for the analysis of microplastics. Analytical and Bio-
analytical Chemistry 2020, 412, 8283-8298, doi:10.1007/s00216-020-02979-w.
20. 20. Tsuge, S.; Ohtani, H.; Watanabe, C. Pyrolysis-GC/MS data book of synthetic polymers: pyrograms, thermograms and
MS of pyrolyzates; Elsevier: 2011.
21. 21. Moldoveanu, S.C. Analytical pyrolysis of synthetic organic polymers; Elsevier: 2005.
22. 22. La Nasa, J.; Biale, G.; Fabbri, D.; Modugno, F. A review on challenges and developments of analytical pyrolysis and
other thermoanalytical techniques for the quali-quantitative determination of microplastics. Journal of Analytical and Applied
Pyrolysis 2020, 149, 104841, doi:https://doi.org/10.1016/j.jaap.2020.104841.
23. 23. Lomonaco, T.; Manco, E.; Corti, A.; La Nasa, J.; Ghimenti, S.; Biagini, D.; di Francesco, F.; Modugno, F.; Ceccarini, A.;
Castelvetro, V.; et al. Release of harmful volatile organic compounds (VOCs) from photo-degraded plastic debris: a neglected
Preprints (www.preprints.org) | NOT PEER-REVIEWED | Posted: 30 April 2021 doi:10.20944/preprints202104.0792.v1

29 of 29
source of environmental pollution. Journal of Hazardous Materials 2020, 394, 122596, doi:https://doi.org/10.1016/j.jhaz-
mat.2020.122596.
24. 24. Manco, E. Studio della correlazione tra le caratteristiche strutturali e i composti organici volatili emessi da polimeri di
sintesi a seguito di processi di invecchiamento foto- e termoossidativo. University of Pisa, 2019.
25. 25. La Nasa, J.; Biale, G.; Mattonai, M.; Modugno, F. Microwave-assisted solvent extraction and double-shot analytical py-
rolysis for the quali-quantitation of plasticizers and microplastics in beach sand samples. Journal of Hazardous Materials 2021,
401, 123287, doi:https://doi.org/10.1016/j.jhazmat.2020.123287.
26. 26. La Nasa, J.; Biale, G.; Ferriani, B.; Trevisan, R.; Colombini, M.P.; Modugno, F. Plastics in Heritage Science: Analytical
Pyrolysis Techniques Applied to Objects of Design. Molecules 2020, 25, doi:10.3390/molecules25071705.
27. 27. Castelvetro, V.; Corti, A.; La Nasa, J.; Modugno, F.; Ceccarini, A.; Giannarelli, S.; Vinciguerra, V.; Bertoldo, M. Polymer
Identification and Specific Analysis (PISA) of Microplastic Total Mass in Sediments of the Protected Marine Area of the Meloria
Shoals. Polymers 2021, 13, doi:10.3390/polym13050796.
28. 28. Gewert, B.; Plassmann, M.M.; MacLeod, M. Pathways for degradation of plastic polymers floating in the marine envi-
ronment. Environmental Science Processes and Impacts 2015, 17, 1513.
29. 29. Chiellini, E.; Corti, A.; D'Antone, S.; Baciu, R. Oxo-biodegradable carbon backbone polymers – Oxidative degradation
of polyethylene under accelerated test conditions. Polymer Degradation and Stability 2006, 91, 2739-2747.
30. 30. Luda, M.P.; Dall'Anese, R. On the microstructure of polypropylenes by pyrolysis GC-MS. Polymer Degradation and
Stability 2014, 110, 35-43.
31. 31. Bottino, F.A.; Cinquegrani, A.R.; Di Pasquale, G.; Leonardi, L.; Pollicino, A. Chemical modifications, mechanical prop-
erties and surface photo-oxidation of films of polystyrene (PS). Polymer Testing 2004, 23, 405-411.
32. 32. Castelvetro, V.; Corti, A.; Bianchi, S.; Ceccarini, A.; Manariti, A.; Vinciguerra, V. Quantification of poly(ethylene tereph-
thalate) micro- and nanoparticle contaminants in marine sediments and other environmental matrices. Journal of Hazardous
Materials 2020, 385, 121517.
33. 33. Castelvetro, V.; Corti, A.; Biale, G.; Ceccarini, A.; Degano, I.; La Nasa, J.; Lomonaco, T.; Manariti, A.; Manco, E.;
Modugno, F.; et al. New methodologies for the detection, identification, and quantification of microplastics and their environ-
mental degradation by-products. Environmental Science and Pollution Research 2021, doi:10.1007/s11356-021-12466-z.
Preprints (www.preprints.org) | NOT PEER-REVIEWED | Posted: 30 April 2021 doi:10.20944/preprints202104.0792.v1