ArterialSpinLabeling(ASL)fMRI:Advantages,Theoretical...
14
Hindawi Publishing Corporation International Journal of Biomedical Imaging Volume 2012, Article ID 818456, 13 pages doi:10.1155/2012/818456 Review Article Arterial Spin Labeling (ASL) fMRI: Advantages, Theoretical Constrains and Experimental Challenges in Neurosciences Ajna Borogovac and Iris Asllani Department of Radiology, Columbia University, New York, NY 10032, USA Correspondence should be addressed to Iris Asllani, [email protected] Received 18 April 2011; Revised 27 September 2011; Accepted 11 October 2011 Academic Editor: Alayar Kangarlu Copyright © 2012 A. Borogovac and I. Asllani. This is an open access article distributed under the Creative Commons Attribution License, which permits unrestricted use, distribution, and reproduction in any medium, provided the original work is properly cited. Cerebral blood flow (CBF) is a well-established correlate of brain function and therefore an essential parameter for studying the brain at both normal and diseased states. Arterial spin labeling (ASL) is a noninvasive fMRI technique that uses arterial water as an endogenous tracer to measure CBF. ASL provides reliable absolute quantification of CBF with higher spatial and temporal resolution than other techniques. And yet, the routine application of ASL has been somewhat limited. In this review, we start by highlighting theoretical complexities and technical challenges of ASL fMRI for basic and clinical research. While underscoring the main advantages of ASL versus other techniques such as BOLD, we also expound on inherent challenges and confounds in ASL perfusion imaging. In closing, we expound on several exciting developments in the field that we believe will make ASL reach its full potential in neuroscience research. 1. Introduction Until we find a method that can directly and noninvasively measure the production and consumption of ATP, we must rely on measuring physiological correlates of ATP to study the brain at various functional states such as activation and disease. Cerebral blood flow (CBF) is one such correlate. CBF delivers glucose and oxygen to the brain to maintain basal ATP production and to replenish it during increased neuronal activity. Changes in CBF are concomitant with changes in neuronal activity, such as those occurring during task activation, or changes in metabolism that often indicate presence of disease [1]. Because of this close coupling with brain function, CBF is an essential physiological parameter, which is why much effort has been dedicated to developing reliable methods for measuring it. All the major methods that have been developed for measuring CBF are based on the principles of compart- mental modeling and tracer kinetics. These principles yield models that describe the dynamics of a tracer as it crosses the arterial tree into the brain’s microvasculature (nondiffusible tracers) and into the tissue (diffusible tracers) prior to venous washout. Different methods use different types of tracers. One of the main advantages of ASL fMRI is that, unlike most other methods, it uses arterial water as an endogenous tracer and thus does not require injection of exogenous tracers that can be uncomfortable and potentially harmful. Also, because ASL is noninvasive, it is safe to repeat over time and can therefore be used to track changes in CBF such as those due to disease progression or drug therapy. Important, ASL yields an absolute measurement of CBF and therefore any change in flow can be expressed in physiologically meaningful units rather than as a % change. Furthermore, ASL yields CBF images with higher spatial and temporal resolution than any other current technique. And yet, despite these numerous advantages, ASL has yet to emerge as the technique of choice for measuring CBF at baseline or during task activation. The main motivation for this review was to postulate on the main reasons for this relatively slow-paced advancement of ASL. To this aim, we first start with a description of the general theoretical frame- work of ASL including various labeling implementations that have been developed to date. Then we highlight the key advantages of ASL versus other methods while expounding on its theoretical limitations and experimental challenges. We close with a review of recent developments in the field
Transcript of ArterialSpinLabeling(ASL)fMRI:Advantages,Theoretical...

Hindawi Publishing CorporationInternational Journal of Biomedical ImagingVolume 2012, Article ID 818456, 13 pagesdoi:10.1155/2012/818456
Review Article
Arterial Spin Labeling (ASL) fMRI: Advantages, TheoreticalConstrains and Experimental Challenges in Neurosciences
Ajna Borogovac and Iris Asllani
Department of Radiology, Columbia University, New York, NY 10032, USA
Correspondence should be addressed to Iris Asllani, [email protected]
Received 18 April 2011; Revised 27 September 2011; Accepted 11 October 2011
Academic Editor: Alayar Kangarlu
Copyright © 2012 A. Borogovac and I. Asllani. This is an open access article distributed under the Creative Commons AttributionLicense, which permits unrestricted use, distribution, and reproduction in any medium, provided the original work is properlycited.
Cerebral blood flow (CBF) is a well-established correlate of brain function and therefore an essential parameter for studying thebrain at both normal and diseased states. Arterial spin labeling (ASL) is a noninvasive fMRI technique that uses arterial wateras an endogenous tracer to measure CBF. ASL provides reliable absolute quantification of CBF with higher spatial and temporalresolution than other techniques. And yet, the routine application of ASL has been somewhat limited. In this review, we start byhighlighting theoretical complexities and technical challenges of ASL fMRI for basic and clinical research. While underscoring themain advantages of ASL versus other techniques such as BOLD, we also expound on inherent challenges and confounds in ASLperfusion imaging. In closing, we expound on several exciting developments in the field that we believe will make ASL reach itsfull potential in neuroscience research.
1. Introduction
Until we find a method that can directly and noninvasivelymeasure the production and consumption of ATP, we mustrely on measuring physiological correlates of ATP to studythe brain at various functional states such as activation anddisease. Cerebral blood flow (CBF) is one such correlate.CBF delivers glucose and oxygen to the brain to maintainbasal ATP production and to replenish it during increasedneuronal activity. Changes in CBF are concomitant withchanges in neuronal activity, such as those occurring duringtask activation, or changes in metabolism that often indicatepresence of disease [1]. Because of this close coupling withbrain function, CBF is an essential physiological parameter,which is why much effort has been dedicated to developingreliable methods for measuring it.
All the major methods that have been developed formeasuring CBF are based on the principles of compart-mental modeling and tracer kinetics. These principles yieldmodels that describe the dynamics of a tracer as it crosses thearterial tree into the brain’s microvasculature (nondiffusibletracers) and into the tissue (diffusible tracers) prior to venouswashout. Different methods use different types of tracers.
One of the main advantages of ASL fMRI is that, unlike mostother methods, it uses arterial water as an endogenous tracerand thus does not require injection of exogenous tracers thatcan be uncomfortable and potentially harmful. Also, becauseASL is noninvasive, it is safe to repeat over time and cantherefore be used to track changes in CBF such as those dueto disease progression or drug therapy. Important, ASL yieldsan absolute measurement of CBF and therefore any changein flow can be expressed in physiologically meaningful unitsrather than as a % change. Furthermore, ASL yields CBFimages with higher spatial and temporal resolution than anyother current technique.
And yet, despite these numerous advantages, ASL has yetto emerge as the technique of choice for measuring CBF atbaseline or during task activation. The main motivation forthis review was to postulate on the main reasons for thisrelatively slow-paced advancement of ASL. To this aim, wefirst start with a description of the general theoretical frame-work of ASL including various labeling implementations thathave been developed to date. Then we highlight the keyadvantages of ASL versus other methods while expoundingon its theoretical limitations and experimental challenges.We close with a review of recent developments in the field
2 International Journal of Biomedical Imaging
MC = control ML = label Δ = (MC −ML)
Signal ∼18 Signal ∼6Signal ∼2
− =
CBF = f (T1, λ, etc.) Δ/MC
min)Signal ∼12
· CBF mL/(100 g·
·
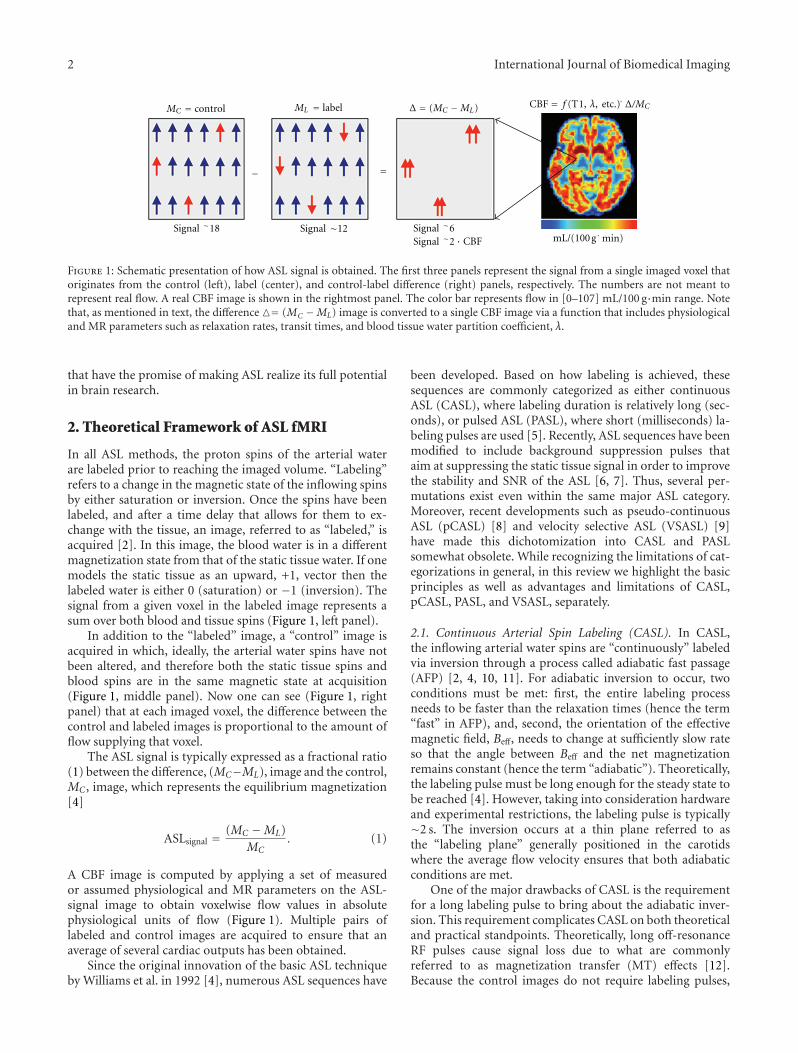
Figure 1: Schematic presentation of how ASL signal is obtained. The first three panels represent the signal from a single imaged voxel thatoriginates from the control (left), label (center), and control-label difference (right) panels, respectively. The numbers are not meant torepresent real flow. A real CBF image is shown in the rightmost panel. The color bar represents flow in [0–107] mL/100 g·min range. Notethat, as mentioned in text, the difference �= (MC −ML) image is converted to a single CBF image via a function that includes physiologicaland MR parameters such as relaxation rates, transit times, and blood tissue water partition coefficient, λ.
that have the promise of making ASL realize its full potentialin brain research.
2. Theoretical Framework of ASL fMRI
In all ASL methods, the proton spins of the arterial waterare labeled prior to reaching the imaged volume. “Labeling”refers to a change in the magnetic state of the inflowing spinsby either saturation or inversion. Once the spins have beenlabeled, and after a time delay that allows for them to ex-change with the tissue, an image, referred to as “labeled,” isacquired [2]. In this image, the blood water is in a differentmagnetization state from that of the static tissue water. If onemodels the static tissue as an upward, +1, vector then thelabeled water is either 0 (saturation) or −1 (inversion). Thesignal from a given voxel in the labeled image represents asum over both blood and tissue spins (Figure 1, left panel).
In addition to the “labeled” image, a “control” image isacquired in which, ideally, the arterial water spins have notbeen altered, and therefore both the static tissue spins andblood spins are in the same magnetic state at acquisition(Figure 1, middle panel). Now one can see (Figure 1, rightpanel) that at each imaged voxel, the difference between thecontrol and labeled images is proportional to the amount offlow supplying that voxel.
The ASL signal is typically expressed as a fractional ratio(1) between the difference, (MC−ML), image and the control,MC , image, which represents the equilibrium magnetization[4]
ASLsignal = (MC −ML)MC
. (1)
A CBF image is computed by applying a set of measuredor assumed physiological and MR parameters on the ASL-signal image to obtain voxelwise flow values in absolutephysiological units of flow (Figure 1). Multiple pairs oflabeled and control images are acquired to ensure that anaverage of several cardiac outputs has been obtained.
Since the original innovation of the basic ASL techniqueby Williams et al. in 1992 [4], numerous ASL sequences have
been developed. Based on how labeling is achieved, thesesequences are commonly categorized as either continuousASL (CASL), where labeling duration is relatively long (sec-onds), or pulsed ASL (PASL), where short (milliseconds) la-beling pulses are used [5]. Recently, ASL sequences have beenmodified to include background suppression pulses thataim at suppressing the static tissue signal in order to improvethe stability and SNR of the ASL [6, 7]. Thus, several per-mutations exist even within the same major ASL category.Moreover, recent developments such as pseudo-continuousASL (pCASL) [8] and velocity selective ASL (VSASL) [9]have made this dichotomization into CASL and PASLsomewhat obsolete. While recognizing the limitations of cat-egorizations in general, in this review we highlight the basicprinciples as well as advantages and limitations of CASL,pCASL, PASL, and VSASL, separately.
2.1. Continuous Arterial Spin Labeling (CASL). In CASL,the inflowing arterial water spins are “continuously” labeledvia inversion through a process called adiabatic fast passage(AFP) [2, 4, 10, 11]. For adiabatic inversion to occur, twoconditions must be met: first, the entire labeling processneeds to be faster than the relaxation times (hence the term“fast” in AFP), and, second, the orientation of the effectivemagnetic field, Beff, needs to change at sufficiently slow rateso that the angle between Beff and the net magnetizationremains constant (hence the term “adiabatic”). Theoretically,the labeling pulse must be long enough for the steady state tobe reached [4]. However, taking into consideration hardwareand experimental restrictions, the labeling pulse is typically∼2 s. The inversion occurs at a thin plane referred to asthe “labeling plane” generally positioned in the carotidswhere the average flow velocity ensures that both adiabaticconditions are met.
One of the major drawbacks of CASL is the requirementfor a long labeling pulse to bring about the adiabatic inver-sion. This requirement complicates CASL on both theoreticaland practical standpoints. Theoretically, long off-resonanceRF pulses cause signal loss due to what are commonlyreferred to as magnetization transfer (MT) effects [12].Because the control images do not require labeling pulses,

International Journal of Biomedical Imaging 3
their signal would not be affected by MT. Consequently, thedifference (MC −ML) would reflect not only the blood flowbut also the loss in signal due to MT effects that are presentin ML but not MC . The MT effects constrained the initialapplication of CASL to a single slice where in order to balancethese effects, two labeled images were acquired, one aboveand one below the imaged slice [13]. To circumvent thisconstraint, Alsop and Detre applied an amplitude-modu-lated (AM) RF pulse with the same duration as the labelingpulse during the acquisition of the control image [14].While causing approximately the same MT effects during theacquisition of the control images as during the labeled, theAM pulses affect a double inversion, that is, no net inversion,on the inflowing spins thus meeting the requirement ofno change in magnetization state during the acquisition ofthe control image [14]. The introduction of the AM pulsesmoved CASL from single slice to whole-brain imaging thusopening new venues for its applications.
Practically, the requirement for long RF pulses is sotaxing on the hardware that most commercially available MRscanners do not offer CASL as part of their software package.Several techniques have been developed to overcome thisproblem. They differ in the way label and control scans arerealized [15]. In a recent study, Pohmann et al. investigatedthe sensitivity of four of these CASL techniques using bothsimulation and experimental data [15]. Briefly, the CASLimplementations tested were the following:
(i) dual-coil (DC-CASL) which works as the conven-tional CASL method described above except that ituses two separate coils for labeling and imaging,respectively [16, 17]. Since labeling is achievedindependently from imaging, the MT effects arecompletely avoided. However, the need for an addi-tional transmit channel increases the level of tech-nical expertise and hardware requirements thereforemaking DC-CASL difficult for routine application.
(ii) Almost continuous ASL (ACASL) where the labelingpulse is regularly and briefly interrupted thus allevi-ating the burden on the RF amplifier to produce longpulses. To ensure equal MT effects on both label andcontrol images, two different variations of the controlacquisition were considered: one restricted the im-aged volume to a single slice, referred to as ss-ACASL,whereas the other allowed for multislice acquisitionhence referred to as ms-ACASL.
(iii) Pseudo-continuous ASL (pCASL) which instead ofa long rectangular labeling pulse applies short andshaped pulses in combination with rephrased gradi-ents to adiabatically invert the inflowing spins [18].An advantage of this sequence compared to DC-CASL is that it does not require an additional labelingcoil and it can be implemented with the standard coilsprovided by the manufacturer.
As expected from theoretical considerations, ss-ACASLyielded higher SNR followed by the dual-coil DC-CASLacquisition. However, both these methods limit the appli-cation of CASL for routine CBF measurement as the first
is constrained to a single slice whereas the second requiresadditional personnel expertise and hardware work to be im-plemented. Realistically, pCASL is the optimum choicebecause it can be widely applied using standard hardwarewithout substantial sacrifice in SNR. As discussed below, webelieve that currently pCASL holds the best promise for rou-tine application of ASL at higher magnetic fields.
2.2. Pseudo-Continuous ASL (pCASL). As mentioned above,one of the major drawbacks of CASL is the requirement forlong RF labeling pulses, which, in addition to causing MTeffects that confound the ASL signal, are also quite taxingon the hardware and therefore not widely available. BecausePASL uses short RF pulses, it is less susceptible to MT effects.However, PASL suffers from low sensitivity compared toCASL; the SNR of PASL can be 30% to 50% lower than thatof CASL [19–21].
Pseudo-continuous ASL was developed as an intermedi-ate technique that takes advantage of CASL’s superior SNRand PASL’s high labeling efficiency without the need for longlabeling pulses [18, 20, 22]. This is achieved by using a trainof short RF pulses rather than continuous RF to bring aboutinversion of the water spins [22]. Given that the ASL signalrepresents the amount of labeled spins captured within animaged voxel, a more efficient labeling pulse and decreasedMT effects in pCASL should be reflected in higher SNR com-pared to conventional ASL. This theoretical statement wasempirically evaluated by Wu et al. who compared optimizedpCASL with standard PASL and CASL at 3T [20]. Theauthors found that pCASL provides a 50% improvement inSNR compared to PASL and an 18% increase in labelingefficiency compared to CASL (80% versus 68%, resp.) [20].
In addition to increased intrasubject SNR and feasibility,pCASL has been shown to have lower intersubject variabilitycompared to standard ASL [23]. Gevers et al. comparedthe reproducibility and reliability of pCASL, conventionalCASL, and PASL based on images acquired on 6 healthyvolunteers who were scanned twice at three different imagingcenters [23]. When compared to conventional CASL andPASL, pCASL with background suppression showed the leastdata dispersion and best reproducibility [23]. While Geverset al. study was done on only healthy young volunteers, Xuet al. compared the reliability and precision of pCASL withthose of 15O PET on 8 young healthy subjects and 14 elderly,2 of which were diagnosed with early Alzheimer’s disease(AD) [24]. The authors found that compared to previousASL and PET perfusion studies, pCASL offers as good or evenbetter reliability in repeated measurements for both youngand elderly subjects. The relationship between quantitativeASL CBF, age, and AD was found consistent with previousreports, further validating the approach [24].
Recently, Dai et al. have proposed a new approach forachieving pseudo-continuous labeling of the arterial spinswith higher efficiency than CASL for the same RF powerdeposition at 3T [18]. The main new feature of this imple-mentation is that it replaces the rectangular train of RF pulseswith a more sophisticated Hanning pulse to achieve a moreprecise labeling profile without compromising the labeling
4 International Journal of Biomedical Imaging
(a) (b)
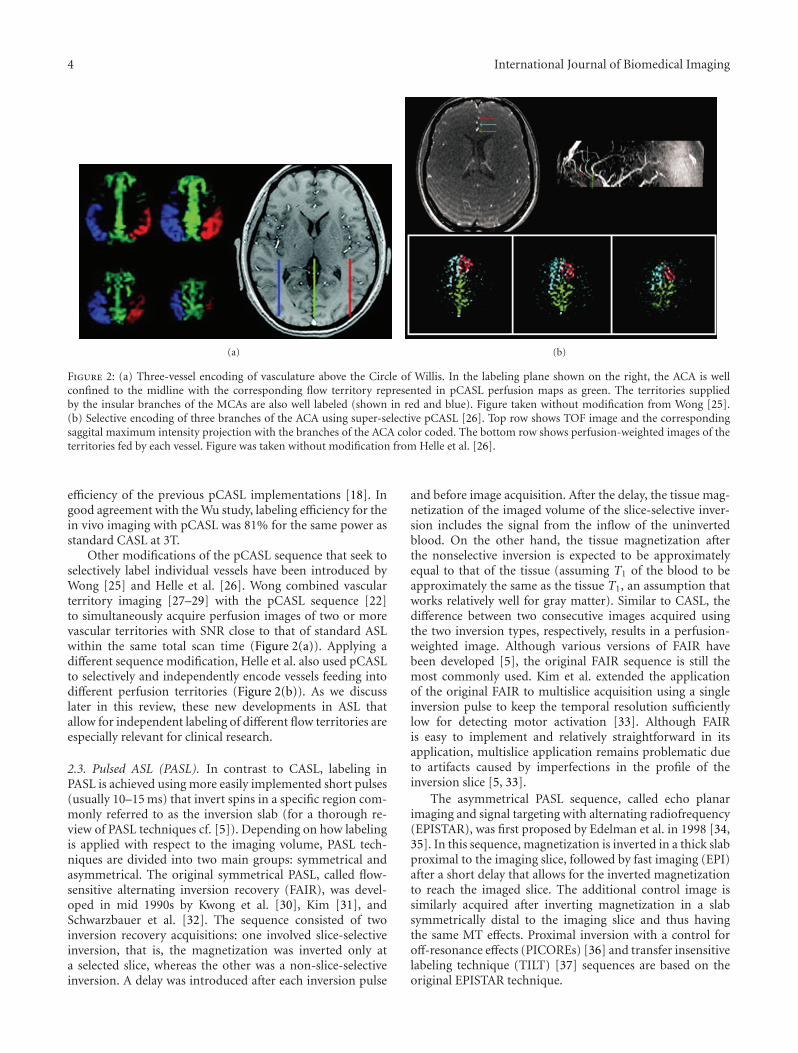
Figure 2: (a) Three-vessel encoding of vasculature above the Circle of Willis. In the labeling plane shown on the right, the ACA is wellconfined to the midline with the corresponding flow territory represented in pCASL perfusion maps as green. The territories suppliedby the insular branches of the MCAs are also well labeled (shown in red and blue). Figure taken without modification from Wong [25].(b) Selective encoding of three branches of the ACA using super-selective pCASL [26]. Top row shows TOF image and the correspondingsaggital maximum intensity projection with the branches of the ACA color coded. The bottom row shows perfusion-weighted images of theterritories fed by each vessel. Figure was taken without modification from Helle et al. [26].
efficiency of the previous pCASL implementations [18]. Ingood agreement with the Wu study, labeling efficiency for thein vivo imaging with pCASL was 81% for the same power asstandard CASL at 3T.
Other modifications of the pCASL sequence that seek toselectively label individual vessels have been introduced byWong [25] and Helle et al. [26]. Wong combined vascularterritory imaging [27–29] with the pCASL sequence [22]to simultaneously acquire perfusion images of two or morevascular territories with SNR close to that of standard ASLwithin the same total scan time (Figure 2(a)). Applying adifferent sequence modification, Helle et al. also used pCASLto selectively and independently encode vessels feeding intodifferent perfusion territories (Figure 2(b)). As we discusslater in this review, these new developments in ASL thatallow for independent labeling of different flow territories areespecially relevant for clinical research.
2.3. Pulsed ASL (PASL). In contrast to CASL, labeling inPASL is achieved using more easily implemented short pulses(usually 10–15 ms) that invert spins in a specific region com-monly referred to as the inversion slab (for a thorough re-view of PASL techniques cf. [5]). Depending on how labelingis applied with respect to the imaging volume, PASL tech-niques are divided into two main groups: symmetrical andasymmetrical. The original symmetrical PASL, called flow-sensitive alternating inversion recovery (FAIR), was devel-oped in mid 1990s by Kwong et al. [30], Kim [31], andSchwarzbauer et al. [32]. The sequence consisted of twoinversion recovery acquisitions: one involved slice-selectiveinversion, that is, the magnetization was inverted only ata selected slice, whereas the other was a non-slice-selectiveinversion. A delay was introduced after each inversion pulse
and before image acquisition. After the delay, the tissue mag-netization of the imaged volume of the slice-selective inver-sion includes the signal from the inflow of the uninvertedblood. On the other hand, the tissue magnetization afterthe nonselective inversion is expected to be approximatelyequal to that of the tissue (assuming T1 of the blood to beapproximately the same as the tissue T1, an assumption thatworks relatively well for gray matter). Similar to CASL, thedifference between two consecutive images acquired usingthe two inversion types, respectively, results in a perfusion-weighted image. Although various versions of FAIR havebeen developed [5], the original FAIR sequence is still themost commonly used. Kim et al. extended the applicationof the original FAIR to multislice acquisition using a singleinversion pulse to keep the temporal resolution sufficientlylow for detecting motor activation [33]. Although FAIRis easy to implement and relatively straightforward in itsapplication, multislice application remains problematic dueto artifacts caused by imperfections in the profile of theinversion slice [5, 33].
The asymmetrical PASL sequence, called echo planarimaging and signal targeting with alternating radiofrequency(EPISTAR), was first proposed by Edelman et al. in 1998 [34,35]. In this sequence, magnetization is inverted in a thick slabproximal to the imaging slice, followed by fast imaging (EPI)after a short delay that allows for the inverted magnetizationto reach the imaged slice. The additional control image issimilarly acquired after inverting magnetization in a slabsymmetrically distal to the imaging slice and thus havingthe same MT effects. Proximal inversion with a control foroff-resonance effects (PICOREs) [36] and transfer insensitivelabeling technique (TILT) [37] sequences are based on theoriginal EPISTAR technique.
International Journal of Biomedical Imaging 5
As mentioned in the previous section, several ASL meth-ods have been developed that, rather than labeling all ofthe feeding arteries, allow for selective imaging of individualperfusion territories. Regional perfusion imaging (RPI) tech-nique developed by Van Laar et al. is based on concatenatedTILT sequence labeling pulses and allows a labeling slab tobe positioned at any angulation with respect to the imagingvolume [38]. The RPI technique was the first to allow re-gional CBF measurement of individual feeding arteries.However, the sequence is very sensitive to magnetic fieldinhomogeneities and thus not best suited for high fieldimaging. A more recent sequence, pulsed star labeling ofarterial regions (PULSARs), [29, 39] also based on theoriginal EPISTAR sequence, has used an optimized watersuppression pulse that presaturates the imaging volume thusincreasing the sensitivity of the signal to flow [39]. Comparedto the original RPI method, the PULSAR technique is lesssensitive to field inhomogeneities, has better labeling effi-ciency and higher SNR. However, the sequences are difficultto implement and suffer from low sensitivity.
Combining the PULSAR labeling technique with a look-locker method for sampling at multiple time points and aperiodic saturation scheme for clear definition of the arterialblood bolus, a quantitative STAR labeling of arterial regions(QUASAR) [40] technique was developed. Deconvolving thesignal from multiple time points, the QUASAR methodyields a simultaneous measurement of both arterial bloodvolume (aBV) and CBF [40].
Although it has yet to become routine in functional im-aging of the brain, several other studies have reported onsimultaneous measurement of aBV and CBF [3, 41, 42].Simultaneous measurement of aBV and CBF using endoge-nous tracers may become an important tool in studying dis-eases in which the two physiological parameters may bedissociated.
2.4. Velocity Selective ASL (VSASL). While the pulsesequence of VSASL contains all the main elements of theconventional ASL acquisition of label and control images, thedifference is that in VSASL labeling is achieved based on thevelocity of the arterial water rather than its position. Usingvelocity selective pulses, a velocity cutoff, Vc, is imposed withthe resulting labeled image containing, at least theoretically,only the spins whose velocity, V , meets the condition V ≤Vc. Assuming that the velocities in the arterial tree aremonotonically decreasing, the amount of labeled blood in agiven imaged voxel, that is, the ASL signal, is simply
ASLsignal = PLD · CBF, (2)
where CBF and PLD represent the amount of flow and thepostlabeling delay for that voxel [9].
An implication of (2) is the interdependence of the ASLsignal on Vc via CBF and PLD. Wu et al. performed asystematic evaluation of the interaction between PLD and Vc
and showed that while the experimental data were in goodagreement with the expected flow values in gray matter, asignificant signal from large vessels persisted for velocities upto Vc = 4 cm/s [43]. Therefore, the authors recommended
a low cutoff Vc = 4 cm/s for quantitative measurement of tis-sue perfusion.
3. Which ASL Is Better?
With all the available ASL implementations, the obviousquestion is “which one is the best”? The answer is complexand perhaps warrants a review paper of its own, but thechoice would depend on the application and should obvi-ously involve, among others, considerations of availability ofhardware, software, and technical expertise, as well as braincoverage needed and SNR assumed by the power analysisfor the tested hypotheses. Unfortunately, the choice is oftenbased on availability rather than scientific considerations.The need for technical expertise and sequence development,which to a certain degree depend on the type of scanneravailable, has hampered application-specific optimization ofASL imaging.
Generally, PASL has been more widely used because it iseasier to implement and conceptually more straightforwardthan CASL. Also, because shorter labeling pulses are needed,PASL sequences are less affected by MT than the standardCASL sequence. However, drawbacks are still present suchas low SNR, high sensitivity to transit times, and sliceprofile artifacts that can limit brain coverage. Although moredifficult to implement, CASL, on the other hand, has beenshown to yield higher SNR for whole brain imaging thanPASL. While there is promise in VSASL, the technique isstill relatively new, and more studies are needed to assess itssensitivity and applicability in disease and activation studies[44].
The recent development of pCASL, which draws on therespective advantages of CASL and PASL to provide reliableperfusion images with high SNR, has contributed to a sub-stantial increase in applications of ASL at 3T. Due to itshigh efficiency, multislice capability, and relative ease of im-plementation without over-taxing the hardware, pCASL isbecoming the best choice for a broad range of applicationsin brain research. Also, the potential of pCASL to selectivelylabel vessels varying in size and orientation without com-promising the SNR may prove invaluable in studying diseasediagnosis, progression, and treatment.
With the concomitant advances in parallel imaging andfast acquisition pulses, ASL is primed to become the essentialfMRI method for brain research. However, as mentionedabove, the ASL signal is transformed into a physiologicalunit of CBF using a set of known or assumed MR andphysiological parameters such as relaxation times, partitioncoefficient, transit times, inversion efficiency, and so forth[45]. It follows that any error in the estimation or assumptionof these parameters would affect the absolute quantificationof CBF. Furthermore, ASL images typically go through aprocessing algorithm that involves realignment, tissue seg-mentation, and normalization to the MNI or Talairach spacefor group analyses [46]. A detailed description of how each ofthese parameters and steps can affect quantification of flowis beyond the scope of this review. Here we focus onthe basic principles of CBF quantification and describerecent analytical methods that have been developed to

6 International Journal of Biomedical Imaging
increase ASL’s sensitivity for detecting changes in CBF whileminimizing the effects of confounds such as partial volumeeffects (PVEs) and arterial transit times (ATTs).
4. From Signal to Absolute Quantificationof CBF
ASL is based on the theory of tracer kinetics, which wasfirst applied for measuring CBF in humans by Kety andSchmidt in 1948 [47]. In ASL, the tracer is the magneticallylabeled arterial water, which is a diffusible endogenoustracer. The theory provides the mathematical tools thatdescribe the relationship between the arterial concentrationof the labeled water and the resulting tissue concentration.These mathematical tools were the basis of the “generalkinetic model for quantitative perfusion imaging with ASL”developed by Buxton et al. [48] in which the Bloch’s equationfor longitudinal magnetization was modified to includedelivery and clearance terms proportional to local blood flowas shown in (3):
dMT(t)dt
= M0T −MT(t)
T1+ f ·
(λMA(t)−MT(t)
λ
), (3)
where M0T is the equilibrium magnetization of tissue, λ is the
partition coefficient for water, and MT and MA represent thetime-dependent longitudinal magnetizations of tissue andarterial blood, respectively, [48].
Based on this generic model, several solutions have beensuggested for both CASL and PASL techniques [39, 45]. Also,based on the timing of the acquisition parameters, modelshave been constructed to mathematically describe the signalfrom the various compartments within the brain [2, 21, 45].For a short postlabeling delay, most of the label is assumedto be in the arterial compartment whereas for longer delaysa two-compartment model separates the tissue signal fromthat of the arterial blood. Although numerous studies haveshown good agreement of CBF values with the more con-ventional flow measurement techniques such as autoradio-graphy, microsphere method, and PET [49–51], there areseveral confounds that affect the absolute quantification ofCBF with ASL. In the next few sections, we review someof these confounds and describe new analytical methodsthat have been developed to minimize their impact on CBFquantification.
4.1. Partial Volume Effects. One of the constraints in ASLimaging is the need for fast image acquisition to ensure thatthe signal from the labeled blood is captured before it relaxesto its equilibrium state. Fast imaging is done at the expenseof spatial resolution, which means that the signal from agiven voxel will reflect a mixture of signals generated fromall the three main brain tissues—gray matter (GM), whitematter (WM), and CSF—comprising the voxel [52]. Becausethe flow values from each of these tissues are different, adifference in flow values between two voxels could be simplydue to a difference in tissue heterogeneity rather than a truedifference in flow. These cross-tissue contamination effects,
known as partial volume effects (PVEs), are a direct conse-quence of limited spatial resolution in imaging in general. InASL, PVEs are exacerbated by the nonlinear dependency ofits signal on tissue heterogeneity via contributions from GM,WM, and CSF in the control image, MC , in the denominatorof (1), (cf. [52] for details).
PVEs can be quite appreciable in cortical regions whereGM can be as thin as 2 mm. To give a sense of the magnitudeof these effects, a voxel containing 80% GM and 20% CSFwould be generally assumed and analyzed as a GM voxel[52]. For such a voxel, a simple calculation based on (1)and assuming the relative tissue magnetization intensities forSE-EPI to be MCSF : MGM : MWM ∼1.6 : 1.2 : 1.0, CBF in GMwould be underestimated by ∼24% [52].
Recently, postprocessing algorithms have been developedto correct for PVEs in ASL imaging [52, 53]. In theoriginal method developed by our group, a linear regressionalgorithm is spatially applied on the difference, (MC −ML),image as well as the control, MC, image. The algorithm as-sumes that within a given spatially selective kernel, the equi-librium magnetization values and blood flow are uniformlydistributed [52]. For the MC image, the algorithm modelsthe equilibrium magnetization of a given voxel as a weightedsum of contributions from each tissue and each voxel withinthe kernel. For the (MC −ML) image, that is, the perfusion-weighted image, the intensity at each voxels is expressed asa weighted sum of flow distributions from GM and WMwithin the kernel, independently. In both cases, the weightingcoefficients are the tissue’s fractional volumes obtained asposterior probability values from the segmentation of a high-resolution images [52].
This method yields a measure of flow, referred to as “pureflow” or “flow density” that is independent of voxel’s tissuecontent. In other words, one can compute a pure gray matterCBF (CBFd GM) and a pure white matter CBF (CBFd WM)image, independently. For each voxel, CBFd from a giventissue represents the amount of blood flow the voxel wouldhave were it comprised entirely of that tissue [52]. As we dis-cuss in some detail below, this novel parameter, CBFd, hasbeen shown to be more sensitive in detecting changes in CBFover time than the net CBF obtained with conventional ASL[54, 55].
A disadvantage of this method is that the linear regressionis applied spatially thus causing an inherent spatial smooth-ing of the raw data. Due to SNR considerations, the larger thespatial kernel of the linear regression the higher the SNR. Onthe other hand, the larger the kernel, the larger the smooth-ing effect of the PVE correction (PVEc) algorithm. Thiscould be detrimental to detecting localized changes in CBFsuch as those found in stroke or in highly localized activationparadigms. To circumvent this drawback, Chappell et al.have implemented the above method in the time domain byacquiring multiple ASL images with varying delay times [53].Because it is applied in time rather than space, this PVEcmethod protects spatial features of CBF, thus avoiding theintroduction of added smoothness to the boundaries of theregions of hypo- or hyperperfusion (Figure 3). In this case,the drawback is the time needed to acquire the data, which

International Journal of Biomedical Imaging 7
100 g/min
GM PVE True Standard Spatial PV 5× 5LR 9× 9LR
100
80
60
40
20
0CBF
(mL/ )
(a)
(b)
(c)
Figure 3: CBF images from three simulation data sets: (a) homogenous gray matter CBF, (b) superimposed spatially sinusoidal fluctuation,and (c) localized regions of hypo- and hyperperfusion. CBF images from conventional CASL (3rd column) are compared with those fromPVE correction performed in the time domain [41] (4th column) [40], and PVE correction done spatially with a small and a large kernelsize (columns 5th and 6th, resp.). Note that the time-domain PVE (4th column) retains the spatial features of the true hypo/hyperperfusedregions (2nd column) whereas the spatially applied PVE method has a smoothing effect that increases with the size of the kernel. Figure wastaken without modification from Chappell et al. [53].
is an impediment especially for activation studies or studieswhere the patient’s time in the scanner is restricted.
4.2. The Transit Times Confound. For all ASL techniques,blood is labeled at a location distal from the region of inter-est. Therefore, if acquisition were to take place immediatelyfollowing the labeling pulse, not all of the labeled bloodwould have made it into the tissue, and consequently CBFwould be misestimated; a voxel containing arterial bloodwith labeled spins destined for another voxel would have itsCBF overestimated whereas a voxel that was imaged prior toall the labeled blood having reached it would have its CBFvalue underestimated. To describe the transit times of theblood from the labeling location to a given imaged voxel, twophysiological parameters have been defined: arterial transittime (ATT), which represents the average time it takes theblood to cross the vasculature from the labeling plane tothe microvasculature in the region of interest, and tissuetransit time (TTT), which is the time it takes labeled bloodto exchange with region’s tissues [2]. The postlabeling delayis inserted at the end of the labeling pulse to allow for thelabeled blood to reach the volume of interest and exchangewith the tissue. However, a compromise needs to be madebetween the length of the delay and loss of signal due torelaxation processes. For regions with long transit times, thedelay will still not be sufficient, and the interpretation of databecomes more complicated [2].
For certain applications where CBF needs to be measuredat a localized region, the distance between the labeling loca-tion and the region of interest can be shortened (within thelimits imposed by the MT effects) and the effect of transittimes minimized. However, for many studies, hypotheses in-volve whole brain acquisition of the CBF in which the CASLtechniques with labeling plane positioned in the carotid
would be the method of choice. In this case, differentareas of the brain will have different transit times thereforequantification would require knowledge or estimation ofthese times for each region. For studies in which the one-compartment arterial model is employed, that is, when thelabeled blood is assumed to be mostly in macrovasculature,ATT is the main parameter that needs to be estimated;for the two-compartment model that includes the tissuemicrovasculature, estimation of TTT becomes essential.
By acquiring multiple ASL images at varying postlabelingdelay values, ATT can be estimated via a parametric fit of thecurves representing the fractional ASL signal versus time [2].Because this step requires relatively long scanning times, ATTis not routinely measured in ASL imaging. Instead, whencomputing the CBF, ATT values are generally assumed tobe either homogeneous throughout the brain or uniformlydistributed within an acquisition slice and varying linearlywith the ascending slice positions.
Recently, there have been two developments in estima-tion of ATT: first, improvements in technology and increasedSNR at higher fields have allowed for voxelwise and ROI-wise parametric fitting of the multiple-PLD curves. Second, amethod that varies labeling duration rather than postlabelingdelay has been developed [55]. This method has been shownto be ∼30% shorter than the multiple-PLD method [55].Results have shown substantial heterogeneity in mean ATTvalues across the brain and across subjects even for healthyyoung volunteers (Figure 4), [55].
To estimate TTT, Wang et al. proposed a method thatinvolved the use of flow encoding bipolar gradients to ob-tain the ratio of the perfusion signals in the vascular andmicrovascular compartments as a function of postlabelingdelay [56]. The global mean tissue transit time was estimatedat 1100 and 1400 ms for two conditions of the bipolar

8 International Journal of Biomedical Imaging
Stan
dard
dev
iati
on o
f ar
teri
al t
ran
sit
tim
e (s
)M
ean
arte
rial
tra
nsi
t ti
me
(s)
Stru
ctu
ral
1.5
0
0
0.5
Figure 4: Voxelwise estimation of ATT values using a multiple-labeling-duration acquisition described in Borogovac et al. [55]. The units inthe color bars are in seconds. Note regional heterogeneity in group mean ATT shown in the 2nd row. Also, across subjects standard deviationmaps (3rd row) indicate variability in ATT especially in the posterior regions. This variability is expected to be higher in disease. Figure takenwith permission from Borogovac et al. [55].
gradients with encoding velocity of 29 and 8 mm/sec, respec-tively. The mean TTT measured within cerebral vascularterritories was shortest in the deep middle cerebral artery(MCA). As proof of concept, the method was applied on twopatients with cerebrovascular disease where prolonged tissuetransit times were demonstrated in the affected hemisphere[56]. However, the method suffers from dependency onthe specific encoding velocity, and its routine application ishampered by the need for multiple-PLD acquisition.
With the above general background on the theoreticalbasics of ASL fMRI and its confounding factors in assessingCBF, we proceed with reviewing the advantages and some ofthe experimental challenges for applications of ASL in basicand clinical research.
5. ASL fMRI: Better Than BOLD?
Several imaging methods have been developed that exploitthe neurovascular coupling of neuronal activity to localchanges in CBF cerebral blood volume (CBV), and otherphysiological correlates [57]. The most pervasively used hasbeen blood oxygenation level-dependent (BOLD) MRI,which, since its discovery in the early 1990s has been exten-sively used to map regions in the brain that respond to task-specific activation [58].
BOLD is a susceptibility-based method that creates“functional,” T2∗-weighted images by exploiting local inho-mogeneities in the magnetic field due to changes in therelative concentrations of oxygenated and deoxygenated he-moglobin (dHb) accompanying brain activation [58].
In contrast with the nuclear medicine methods, bothBOLD and ASL MRI use endogenous tracers and therefore
are completely noninvasive and more readily available. Be-cause BOLD has higher SNR and higher temporal resolutionthan ASL, it is more suited for event-related designs, espe-cially when absolute quantification is not essential to the hy-pothesis being tested. Also, BOLD is easier to implementand does not usually require any additional programming ofthe RF and gradient pulses already provided by the manufac-turer.
However, ASL offers several advantages over BOLD, es-pecially in applications where slow varying changes in brainfunction are investigated:
(1) Spatial Localization. Because the BOLD effect originatesfrom an intricate interplay between changes in CBF, CBV andoxygen consumption, its signal is composite in nature andunable to pinpoint to a single correlate of neuronal activity[59–61]. Furthermore, because the signal comes primarilyfrom the intravascular dHb, the spatial correlation to theactual site of activation is relatively poor with considerablespatial spreading onto the venous structures [62]. In con-trast, the ASL signal is straightforward to interpret becauseit reflects, at least theoretically, a single physiological pro-cess, namely, CBF. Consequently, the task-specific patternsmapped with ASL yield better spatial correlations with theactual site of regional involvement than BOLD [63].
(2) Signal Quantification. The conclusions from BOLD stud-ies have been mainly qualitative in nature as the baselinevalues are commonly unaccounted for, and the signal istypically expressed in percent change [64]. The effect of base-line variability in BOLD fMRI data has been experimentally

International Journal of Biomedical Imaging 9
shown by Cohen et al. [65] and Brown et al. [66]. Bothstudies reported a mismatch between the change in baselineCBF and the corresponding BOLD response on the samesubjects and for the same stimulus [65, 66].
ASL, on the other hand, yields a physiologically quan-tifiable measure thus allowing baseline levels to be directlycompared before and after activation [21].
(3) Power Spectrum. The power spectrum of the BOLD sig-nal shows higher amplitudes at low frequencies in what hasbeen described as the 1/f noise. This temporal autocor-relation makes BOLD fMRI unsuitable for application inexperimental designs with fundamental frequency below0.01 Hz, that is, for task events spaced by more than ∼90seconds apart [67]. In contrast, due to pairwise subtractionof adjacent time points, the power spectrum of ASL isessentially frequency independent, which makes it ideal fortracking slow varying changes in the brain such as those dueto emotional responses, mood changes, disease, drug ther-apy, and so forth. In a recent study, Borogovac et al. [55]used PVEc ASL fMRI to compare changes in CBF due tomotor-visual activation within the same session and acrosstwo sessions separated by 1 month (Figure 5). The study un-derscored the utility of the CBFd parameter mentionedabove in detecting longitudinal changes in CBF. Because thisphysiological parameter is relatively independent of tissueheterogeneity across subjects, it was more stable acrosstime and ∼60% more sensitive in detecting changes due toactivation [55].
(4) Susceptibility Effects. Because BOLD is a susceptibility-based technique, gradient echo (GE) EPI is commonlyemployed to achieve maximum sensitivity. Consequently,BOLD is prone to artifacts in the areas with high suscepti-bility such as those around tissue-bone or tissue air bound-aries, especially at high fields. ASL, on the other hand, canbe combined with spin echo (SE) imaging to reduce bulksusceptibility artifacts thus yielding greater sensitivity in low-er brain regions and more precise localization [68]. However,as higher field scanners become more available, the feasibilityof using spin-echo-based BOLD fMRI is also increasing.
6. ASL fMRI in Aging and Disease
The BOLD response is a sensitive indicator of where neuralactivity occurs, but it is very difficult to interpret the mag-nitude of the BOLD response as a quantitative reflection ofunderlying physiology. The effect of the baseline state is per-haps the most serious issue for interpreting BOLD measure-ments in disease. For example, in a recent study of subjectsat risk for AD, Fleisher and colleagues have found a reducedBOLD response in the hippocampus to a memory task in theat-risk subjects compared with controls [69]. However, byincluding ASL measurements as well, they found that, duringthe performance of the task, the two groups had similarabsolute levels of flow, but that flow in the baseline state waselevated in the at-risk group [69].
According to a 2008 review paper by Deibler et al. [70],during a period of one year more than 3000 ASL procedures
were performed as part of routine clinical brain MRI eval-uation at 1.5 T and 3.0 T. As mentioned above, much of thevalue of ASL imaging comes from its noninvasive nature andthe fact that it can be acquired within a routine MR scancommonly prescribed to patients.
In general, ASL applications in the clinical realm canbe divided into two main groups: vascular diseases such asstroke and carotid occlusive diseases [71–73], and “func-tional” diseases, including normal aging [54], Alzheimer’sdisease (AD) [74], and schizophrenia [75]. This dichotomi-zation is not meant to be inclusive, but it serves to underscorethe physiological basis for the observed CBF measure. Invascular diseases, changes in CBF are to a response in struc-tural changes in the brain, such as carotid occlusions, hema-tomas, tumors, or the advent of a stroke and other ischemicevents. In “functional” diseases, changes in CBF (in timeor as compared to healthy populations) can occur indepen-dently of structural changes in the brain or precede them.
In their recent review of ASL applications in routineclinical practice, Deibler et al. described the use of ASL for arange of diseases where hyperperfusion can be detected bothfocally, as in luxury perfusion, spontaneous recanalization,seizure activity, tumors, among others, and globally, as inyoung populations, or during conditions of hypercapnia, andreported cases of postcarotid endarterectomy [70, 76].
It is important to emphasize that the ASL confoundsdescribed in the section above become even more relevantin clinical applications. For example, in studies of stroke andcarotid occlusive diseases, estimation of transit times is ofprimary importance [71, 72]. In this case, concomitant mea-surement of CBF would increase the reliability of the transittime measurements and would make the interpretation of theresults more straightforward.
In studies that involve comparison of CBF between youngand elderly populations, PVE becomes a main confoundbecause of the atrophy present in the latter [54]. Recently,our group has applied the PVEc algorithm to ASL data ac-quired on young and elderly populations. The largest PVEcontribution was found in the frontal lobe and accounted foran additional 10% and 12% increase in the age-related CBFdifference between men and women, respectively, [54].
7. Future Directions in ASL fMRI
There are two significant challenges in ASL imaging thatcontinue to hamper its routine application in brain researchand comprise the main focus of current ASL developmentresearch: low SNR and relatively low temporal resolution.Our numerical simulations, based on tissue relaxation timesat 3 T, assuming average GM CBFd of 100 mL/(100 g×min)[77] and Gaussian distribution of noise, have shown that thehighest achievable SNR is ∼4%. High field imaging is ben-eficial for ASL because, in addition to the expected increasein the SNR due to field considerations, there is an increase inSNR that is due to longer T1 values at higher fields; increasedT1 translates into less labeling loss, that is, signal loss, dueto relaxation. Wang et al. showed that, for PASL, the SNRand CNR increased 2.3x and 2.7x, respectively, for restingstate perfusion at 4 T compared to 1.5 T [21]. However,

10 International Journal of Biomedical Imaging
Fun
ctio
n
Time(30 days)
Baseline CBFd (D1)
Baseline CBFd (D30)
120
120
0
0
(a)
ΔCBFd (D1 on-D1 off)
ΔCBFd (D30 on-D1 off)
40
5
40
5
Time(30 days)
Fun
ctio
n(b)
Figure 5: Tracking functional changes over one month. (a) Comparing baseline CBF on day 1 (indicated by first red horizontal line in upperpanel, illustrating experimental design), and baseline CBF on day 30 (second red line in upper panel) shows stability over time. Middle panelshows the whole brain maps on day 1, and lower panel shows whole brain maps on day 30. (b) Comparing acute CBF changes inducedby visual or motor stimulation on day 30 to baseline CBF on day 1 (as illustrated in the upper panel) is similar to acute changes inducedby visual or motor stimulation on day 1 to baseline CBF on day 1. Middle panel shows the whole brain maps of day 1 stimulation to day1 baseline, and lower panel shows whole brain maps of day 30 stimulation to day 1 baseline. Maps show similar motor and visual cortexactivations. (Note that this is a modified version of Figure 3 in Borogovac et al. [55]).
there was no significant improvement in sensitivity for de-tecting changes in CBF due to motor activation [21], whichthe authors attributed to increased physiological noise andsusceptibility-related artifacts at 4 T. Because of the need forfast sequential scanning of control and labeled images, ASLhas generally relied on EPI imaging, which is problematicin higher fields due to field homogeneity imperfections thatintroduce distortions in regions of high magnetic susceptibil-ity. One solution has been to combine fast three-dimensional(3D) sequences with ASL imaging to provide higher SNRwhile reducing image distortions [24, 78]. Another approachfor increasing SNR in ASL is the use of a phase array receivercoils, which allow for image acquisition with shorter echotimes; a decrease in echo time is beneficial both in termsof SNR and in reducing distortions due to susceptibilityartifacts [79].
As mentioned above, temporal resolution is also inher-ently poor in ASL, especially for detecting fast changes inbrain function due to activation. This is a direct consequenceof the pairwise acquisition in ASL; to obtain one CBF image,two images, control and label, have to be acquired, thusdoubling the effective TR, which generally varies between4 s to 8 s. So far there have been two emerging methods forimproving temporal resolution in ASL: turbo-ASL [9] andsingle-shot ASL [80]. Because of the complexity of signalquantification in both techniques, they are restricted to ap-plications in which absolute quantification is not of primaryimportance. Hernandez-Garcia et al. combined a two-coilapproach with turbo CASL for detecting perfusion responses
in both block-design and event-related experiments [81].The higher temporal resolution was achieved by collectingthe control and labeled images after a single labeling period.With the advantage of optimum SNR of CASL and increasedtemporal resolution, the authors reported satisfactory sen-sitivity for detecting perfusion response to an event-relatedparadigm [81].
It has become clear that, given the complexity of ques-tions in brain research today, no single technique can bethe panacea of the experimental challenges we face in answer-ing them. The solution relies on combining the advantagesof various imaging techniques with advances in analyticalmethods for better evaluation of the physiological param-eters that underlie brain function at various states. In thisregard, ASL development is branched in three directions:first, developing new implementations of the technique thatare more suited to applications in higher fields and canincrease the spatial and temporal resolution of CBF imaging.At the moment, pCASL combined with novel fast imagingsequences holds the best promise.
The second is combining baseline ASL CBF measurementwith BOLD, in what is known as calibrated BOLD fMRI [61].With a separate measurement of blood flow with ASL, itis possible to calculate how much the oxygen metabolismwould have to change to give the measured BOLD response[82]. However, until an alternative is found to the require-ment for measurement under hypercapnic condition, cali-brated BOLD has yet to find wide application in the clinicalrealm.

International Journal of Biomedical Imaging 11
Third, because ASL suffers from low SNR, advances inanalytical methods that boost the sensitivity of the methodare imperative. Perhaps more important, sophisticated ana-lytical methods allow us to ask more sophisticated questionsabout brain function. For example, recently ASL fMRI hasbeen combined with multivariate analysis to detect covariateCBF patterns that could distinguish AD patients fromhealthy controls with 95% specificity and 100% sensitivity[83].
These recent insights and technical developments suggestthat ASL fMRI is on the cusp of realizing its full potential forbrain research.
Acknowledgments
The authors are greatly indebted to Scott Small, M.D., forinsightful discussions regarding the application of fMRI indisease. They also thank the anonymous reviewer for his/herthorough critique and invaluable suggestions. Partial fund-ing for research included in this review was provided by NIH/NIMH R21MH082308 grant.
References
[1] R. Buxton, Introduction to Functional Magnetic ResonanceImaging, Cambridge University Press, 2009.
[2] D. C. Alsop and J. A. Detre, “Reduced transit-time sensitivityin noninvasive magnetic resonance imaging of human cerebralblood flow,” Journal of Cerebral Blood Flow and Metabolism,vol. 16, no. 6, pp. 1236–1249, 1996.
[3] D. H. Kim and D. M. Spielman, “Reducing gradient imper-fections for spiral magnetic resonance spectroscopic imaging,”Magnetic Resonance in Medicine, vol. 56, no. 1, pp. 198–203,2006.
[4] D. S. Williams, J. A. Detre, J. S. Leigh, and A. P. Koretsky, “Mag-netic resonance imaging of perfusion using spin inversion ofarterial water,” Proceedings of the National Academy of Sciencesof the United States of America, vol. 89, no. 1, pp. 212–216,1992.
[5] X. Golay, J. Hendrikse, and T. C. C. Lim, “Perfusion imagingusing arterial spin labeling,” Topics in Magnetic ResonanceImaging, vol. 15, no. 1, pp. 10–27, 2004.
[6] D. M. Garcia, G. Duhamel, and D. C. Alsop, “Efficiencyof inversion pulses for background suppressed arterial spinlabeling,” Magnetic Resonance in Medicine, vol. 54, no. 2, pp.366–372, 2005.
[7] K. S. S. Lawrence, J. A. Frank, P. A. Bandettini, and F. Q. Ye,“Noise reduction in multi-slice arterial spin tagging imaging,”Magnetic Resonance in Medicine, vol. 53, no. 3, pp. 735–738,2005.
[8] A. C. Silva and S. G. Kim, “Pseudo-continuous arterial spinlabeling technique for measuring CBF dynamics with hightemporal resolution,” Magnetic Resonance in Medicine, vol. 42,no. 3, pp. 425–429, 1999.
[9] E. C. Wong, M. Cronin, W. C. Wu, B. Inglis, L. R. Frank, andT. T. Liu, “Velocity-selective arterial spin labeling,” MagneticResonance in Medicine, vol. 55, no. 6, pp. 1334–1341, 2006.
[10] M. Sardashti, D. G. Schwartzberg, G. P. Stomp, and W.T. Dixon, “Spin-labeling angiography of the carotids bypresaturation and simplified adiabatic inversion,” MagneticResonance in Medicine, vol. 15, no. 2, pp. 192–200, 1990.
[11] D. G. Norris, “Adiabatic radiofrequency pulse forms in bio-medical nuclear magnetic resonance,” Concepts in MagneticResonance B, vol. 14, no. 2, pp. 89–101, 2002.
[12] S. D. Wolff and R. S. Balaban, “Magnetization transfer contrast(MTC) and tissue water proton relaxation in vivo,” MagneticResonance in Medicine, vol. 10, no. 1, pp. 135–144, 1989.
[13] J. A. Detre, J. S. Leigh, D. S. Williams, and A. P. Koretsky, “Per-fusion imaging,” Magnetic Resonance in Medicine, vol. 23, no.1, pp. 37–45, 1992.
[14] D. C. Alsop and J. A. Detre, “Multisection cerebral blood flowMRI imaging with continuous arterial spin labeling,” Radiol-ogy, vol. 208, no. 2, pp. 410–416, 1998.
[15] R. Pohmann, J. Budde, E. J. Auerbach, G. Adriany, and K.Ugurbil, “Theoretical and experimental evaluation of contin-uous arterial spin labeling techniques,” Magnetic Resonance inMedicine, vol. 63, no. 2, pp. 438–446, 2010.
[16] G. Zaharchuk, P. J. Ledden, K. K. Kwong, T. G. Reese, B. R.Rosen, and L. L. Wald, “Multislice perfusion and perfusionterritory imaging in humans with separate label and imagecoils,” Magnetic Resonance in Medicine, vol. 41, no. 6, pp.1093–1098, 1999.
[17] W. Zhang, A. C. Silva, D. S. Williams, and A. P. Koretsky,“NMR measurement of perfusion using arterial spin labelingwithout saturation of macromolecular spins,” Magnetic Reso-nance in Medicine, vol. 33, no. 3, pp. 370–376, 1995.
[18] W. Dai, D. Garcia, C. De Bazelaire, and D. C. Alsop, “Con-tinuous flow-driven inversion for arterial spin labeling usingpulsed radio frequency and gradient fields,” Magnetic Reso-nance in Medicine, vol. 60, no. 6, pp. 1488–1497, 2008.
[19] E. C. Wong, R. B. Buxton, and L. R. Frank, “A theoretical andexperimental comparison of continuous and pulsed arterialspin labeling techniques for quantitative perfusion imaging,”Magnetic Resonance in Medicine, vol. 40, no. 3, pp. 348–355,1998.
[20] W.-C. Wu, M. Fernandez-Seara, J. A. Detre, F. W. Wehrli, andJ. Wang, “A theoretical and experimental investigation of thetagging efficiency of pseudocontinuous arterial spin labeling,”Magnetic Resonance in Medicine, vol. 58, no. 5, pp. 1020–1027,2007.
[21] J. Wang, D. C. Alsop, L. Li et al., “Comparison of quantitativeperfusion imaging using arterial spin labeling at 1.5 and 4.0Tesla,” Magnetic Resonance in Medicine, vol. 48, no. 2, pp. 242–254, 2002.
[22] D. M. Garcia, C. Bazelaire, and D. Alsop, “Pseudo-continuousflow driven adiabatic inversion for arterial spin labeling,” inProceedings of the 13th Meeting in International Society ofMagnetic Resonance in Medicine, 2005.
[23] S. Gevers, M. J. Van Osch, R. P.H. Bokkers et al., “Intra-andmulticenter reproducibility of pulsed, continuous and pseudo-continuous arterial spin labeling methods for measuring cere-bral perfusion,” Journal of Cerebral Blood Flow and Metabolism,vol. 31, no. 8, pp. 1706–1715, 2011.
[24] G. Xu, H. A. Rowley, G. Wu et al., “Reliability and precisionof pseudo-continuous arterial spin labeling perfusion MRI on3.0 T and comparison with 15O-water PET in elderly subjectsat risk for Alzheimer’s disease,” NMR in Biomedicine, vol. 23,no. 3, pp. 286–293, 2010.
[25] E. C. Wong, “Vessel-encoded arterial spin-labeling usingpseudocontinuous tagging,” Magnetic Resonance in Medicine,vol. 58, no. 6, pp. 1086–1091, 2007.
[26] M. Helle, D. G. Norris, S. Rufer, K. Alfke, O. Jansen, and M.J. P. Van Osch, “Superselective pseudocontinuous arterial spinlabeling,” Magnetic Resonance in Medicine, vol. 64, no. 3, pp.777–786, 2010.

12 International Journal of Biomedical Imaging
[27] P. J. Van Laar, J. Hendrikse, X. Golay, H. Lu, M. J. P. Van Osch,and J. Van Der Grond, “In vivo flow territory mapping ofmajor brain feeding arteries,” NeuroImage, vol. 29, no. 1, pp.136–144, 2006.
[28] J. Hendrikse, J. Van Der Grond, H. Lu, P. C. M. Van Zijl, andX. Golay, “Flow territory mapping of the cerebral arteries withregional perfusion MRI,” Stroke, vol. 35, no. 4, pp. 882–887,2004.
[29] R. Werner, D. G. Norris, K. Alfke, H. M. Mehdorn, and O.Jansen, “Continuous artery-selective spin labeling (CASSL),”Magnetic Resonance in Medicine, vol. 53, no. 5, pp. 1006–1012,2005.
[30] K. K. Kwong, D. A. Chesler, R. M. Weisskoff et al., “MRperfusion studies with T1-weighted echo planar imaging,”Magnetic Resonance in Medicine, vol. 34, no. 6, pp. 878–887,1995.
[31] S. G. Kim, “Quantification of relative cerebral blood flowchange by flow-sensitive alternating inversion recovery (FAIR)technique: application to functional mapping,” MagneticResonance in Medicine, vol. 34, no. 3, pp. 293–301, 1995.
[32] C. Schwarzbauer, S. P. Morrissey, and A. Haase, “Quantitativemagnetic resonance imaging of perfusion using magneticlabeling of water proton spins within the detection slice,”Magnetic Resonance in Medicine, vol. 35, no. 4, pp. 540–546,1996.
[33] S. G. Kim, N. V. Tsekos, and J. Ashe, “Multi-slice perfusion-based functional MRI using the FAIR technique: comparisonof CBF and BOLD effects,” NMR in Biomedicine, vol. 10, no.4-5, pp. 191–196, 1997.
[34] R. R. Edelman and Q. Chen, “EPISTAR MRI: multislicemapping of cerebral blood flow,” Magnetic Resonance inMedicine, vol. 40, no. 6, pp. 800–805, 1998.
[35] R. R. Edelman, B. Siewert, D. G. Darby et al., “Qualitativemapping of cerebral blood flow and functional localizationwith echo-planar MR imaging and signal targeting withalternating radio frequency,” Radiology, vol. 192, no. 2, pp.513–520, 1994.
[36] E. C. Wong, R. B. Buxton, and L. R. Frank, “Implementationof quantitative perfusion imaging techniques for functionalbrain mapping using pulsed arterial spin labeling,” NMR inBiomedicine, vol. 10, no. 4-5, pp. 237–249, 1997.
[37] X. Golay, M. Stuber, K. P. Pruessmann, D. Meier, and P.Boesiger, “Transfer insensitive labeling technique (TILT): ap-plication to multislice functional perfusion imaging,” Journalof Magnetic Resonance Imaging, vol. 9, no. 3, pp. 454–461,1999.
[38] P. J. Van Laar, J. Van Der Grond, and J. Hendrikse, “Brainperfusion territory imaging: methods and clinical applicationsof selective arterial spin-labeling MR imaging,” Radiology, vol.246, no. 2, pp. 354–364, 2008.
[39] X. Golay, E. T. Petersen, and F. Hui, “Pulsed star labelingof arterial regions (PULSAR): a robust regional perfusiontechnique for high field imaging,” Magnetic Resonance inMedicine, vol. 53, no. 1, pp. 15–21, 2005.
[40] E. T. Petersen, T. Lim, and X. Golay, “Model-free arterial spinlabeling quantification approach for perfusion MRI,” MagneticResonance in Medicine, vol. 55, no. 2, pp. 219–232, 2006.
[41] M. J. Brookes, P. G. Morris, P. A. Gowland, and S. T. Francis,“Noninvasive measurement of arterial cerebral blood volumeusing Look-Locker EPI and arterial spin labeling,” MagneticResonance in Medicine, vol. 58, no. 1, pp. 41–54, 2007.
[42] T. Kim and S. G. Kim, “Quantification of cerebral arterialblood volume and cerebral blood flow using MRI with
modulation of tissue and vessel (MOTIVE) signals,” MagneticResonance in Medicine, vol. 54, no. 2, pp. 333–342, 2005.
[43] W. C. Wu and E. C. Wong, “Feasibility of velocity selectivearterial spin labeling in functional MRI,” Journal of CerebralBlood Flow and Metabolism, vol. 27, no. 4, pp. 831–838, 2007.
[44] G. Duhamel, C. De Bazelaire, and D. C. Alsop, “Evaluationof systematic quantification errors in velocity-selective arterialspin labeling of the brain,” Magnetic Resonance in Medicine,vol. 50, no. 1, pp. 145–153, 2003.
[45] J. Wang, Y. Zhang, R. L. Wolf, A. C. Roc, D. C. Alsop,and J. A. Detre, “Amplitude-modulated continuous arterialspin-labeling 3.0-T perfusion MR imaging with a single coil:feasibility study,” Radiology, vol. 235, no. 1, pp. 218–228, 2005.
[46] I. Asllani, A. Borogovac, C. Wright, R. Sacco, T. R. Brown, andE. Zarahn, “An investigation of statistical power for continu-ous arterial spin labeling imaging at 1.5 T,” NeuroImage, vol.39, no. 3, pp. 1246–1256, 2008.
[47] S. S. Kety and C. F. Schmidt, “The nitrous oxide method forthe quantitative determination of cerebral blood flow in man:theory, procedure and normal values,” The Journal of ClinicalInvestigation, vol. 27, pp. 476–483, 1948.
[48] R. B. Buxton, L. R. Frank, E. C. Wong, B. Siewert, S.Warach, and R. R. Edelman, “A general kinetic model forquantitative perfusion imaging with arterial spin labeling,”Magnetic Resonance in Medicine, vol. 40, no. 3, pp. 383–396,1998.
[49] E. G. Walsh, K. Minematsu, J. Leppo, and S. C. Moore, “Radi-oactive microsphere validation of a volume localized contin-uous saturation perfusion measurement,” Magnetic Resonancein Medicine, vol. 31, no. 2, pp. 147–153, 1994.
[50] F. Q. Ye, K. F. Berman, T. Ellmore et al., “H215O PET vali-dation of steady-state arterial spin tagging cerebral blood flowmeasurements in humans,” Magnetic Resonance in Medicine,vol. 44, no. 3, pp. 450–456, 2000.
[51] J. R. Ewing, L. Wei, R. A. Knight et al., “Direct comparisonof local cerebral blood flow rates measured by MRI arterialspin-tagging and quantitative autoradiography in a rat modelof experimental cerebral ischemia,” Journal of Cerebral BloodFlow and Metabolism, vol. 23, no. 2, pp. 198–209, 2003.
[52] I. Asllani, A. Borogovac, and T. R. Brown, “Regression al-gorithm correcting for partial volume effects in arterial spinlabeling MRI,” Magnetic Resonance in Medicine, vol. 60, no. 6,pp. 1362–1371, 2008.
[53] M. A. Chappell, A. R. Groves, B. J. Macintosh, M. J. Donahue,P. Jezzard, and M. W. Woolrich, “Partial volume correctionof multiple inversion time arterial spin labeling MRI data,”Magnetic Resonance in Medicine, vol. 65, pp. 1173–1183, 2011.
[54] I. Asllani, C. Habeck, A. Borogovac, T. R. Brown, A. M.Brickman, and Y. Stern, “Separating function from structurein perfusion imaging of the aging brain,” Human Brain Map-ping, vol. 30, no. 9, pp. 2927–2935, 2009.
[55] A. Borogovac, C. Habeck, S. A. Small, and I. Asllani, “Mappingbrain function using a 30-day interval between baseline andactivation: a novel arterial spin labeling fMRI approach,”Journal of Cerebral Blood Flow and Metabolism, vol. 30, no. 10,pp. 1721–1733, 2010.
[56] J. Wang, D. C. Alsop, H. K. Song et al., “Arterial transit timeimaging with flow encoding arterial spin tagging (FEAST),”Magnetic Resonance in Medicine, vol. 50, no. 3, pp. 599–607,2003.
[57] R. Buxton, Introduction to Functional MRI, Cambridge Uni-versity Press, 1st edition, 2002.
[58] S. Ogawa, D. W. Tank, R. Menon et al., “Intrinsic signalchanges accompanying sensory stimulation: functional brain

International Journal of Biomedical Imaging 13
mapping with magnetic resonance imaging,” Proceedings of theNational Academy of Sciences of the United States of America,vol. 89, no. 13, pp. 5951–5955, 1992.
[59] S.-G. Kim and K. Ugurbil, “Comparison of blood oxygenationand cerebral blood flow effects in fMRI: estimation ofrelative oxygen consumption change,” Magnetic Resonance inMedicine, vol. 38, no. 1, pp. 59–65, 1997.
[60] B. M. Ances, O. Leontiev, J. E. Perthen, C. Liang, A. E. Lans-ing, and R. B. Buxton, “Regional differences in the couplingof cerebral blood flow and oxygen metabolism changes inresponse to activation: implications for BOLD-fMRI,” Neu-roImage, vol. 39, no. 4, pp. 1510–1521, 2008.
[61] T. L. Davis, K. K. Kwong, R. M. Weisskoff, and B. R. Rosen,“Calibrated functional MRI: mapping the dynamics of oxida-tive metabolism,” Proceedings of the National Academy ofSciences of the United States of America, vol. 95, no. 4, pp. 1834–1839, 1998.
[62] F. G. C. Hoogenraad, P. J. W. Pouwels, M. B. M. Hofman, J. R.Reichenbach, M. Sprenger, and E. M. Haacke, “Quantitativedifferentiation between BOLD models in fMRI,” MagneticResonance in Medicine, vol. 45, no. 2, pp. 233–246, 2001.
[63] G. K. Aguirre, J. A. Detre, and J. Wang, “Perfusion fMRI forfunctional neuroimaging,” International Review of Neurobiol-ogy, vol. 66, pp. 213–236, 2005.
[64] R. G. Shulman, D. L. Rothman, and F. Hyder, “A BOLD searchfor baseline,” NeuroImage, vol. 36, no. 2, pp. 277–281, 2007.
[65] E. R. Cohen, E. Rostrup, K. Sidaros et al., “Hypercapnic nor-malization of BOLD fMRI: comparison across field strengthsand pulse sequences,” NeuroImage, vol. 23, no. 2, pp. 613–624,2004.
[66] G. G. Brown, L. T. E. Zorrilla, B. Georgy, S. S. Kindermann, E.C. Wong, and R. B. Buxton, “BOLD and perfusion response tofinger-thumb apposition after acetazolamide administration:differential relationship to global perfusion,” Journal of Cere-bral Blood Flow and Metabolism, vol. 23, no. 7, pp. 829–837,2003.
[67] G. K. Aguirre, J. A. Detre, E. Zarahn, and D. C. Alsop,“Experimental design and the relative sensitivity of BOLDand perfusion fMRI,” NeuroImage, vol. 15, no. 3, pp. 488–500,2002.
[68] J. Wang, L. Li, A. C. Roc et al., “Reduced susceptibility effectsin perfusion fMRI with single-shot spin-echo EPI acquisitionsat 1.5 Tesla,” Magnetic Resonance Imaging, vol. 22, no. 1, pp.1–7, 2004.
[69] A. S. Fleisher, M. Donohue, K. Chen, J. B. Brewer, and P. S.Aisen, “Applications of neuroimaging to disease-modificationtrials in Alzheimer’s disease,” Behavioural Neurology, vol. 21,no. 1-2, pp. 129–136, 2009.
[70] A. R. Deibler, J. M. Pollock, R. A. Kraft, H. Tan, J. H. Burdette,and J. A. Maldjian, “Arterial spin-labeling in routine clinicalpractice—part 2: hypoperfusion patterns,” American Journalof Neuroradiology, vol. 29, no. 7, pp. 1235–1241, 2008.
[71] R. P. H. Bokkers, M. J. P. Van Osch, C. J. M. Klijn, L. J.Kappelle, and J. Hendrikse, “Cerebrovascular reactivity withinperfusion territories in patients with an internal carotid arteryocclusion,” Journal of Neurology, Neurosurgery and Psychiatry,vol. 82, no. 9, pp. 1011–1016, 2011.
[72] R. P. H. Bokkers, F. J. Wessels, H. B. Van Der Worp, J. J. M.Zwanenburg, W. P. Th. M. Mali, and J. Hendrikse, “Vasodila-tory capacity of the cerebral vasculature in patients withcarotid artery stenosis,” American Journal of Neuroradiology,vol. 32, no. 6, pp. 1030–1033, 2011.
[73] M. Viallon, S. Altrichter, V. M. Pereira et al., “Combineduse of pulsed arterial spin-labeling and susceptibility-weighted
imaging in stroke at 3T,” European Neurology, vol. 64, no. 5, pp.286–296, 2010.
[74] D. C. Alsop, W. Dai, M. Grossman, and J. A. Detre, “Arterialspin labeling blood flow MRI: its role in the early characteri-zation of Alzheimer’s disease,” Journal of Alzheimer’s Disease,vol. 20, no. 3, pp. 871–880, 2010.
[75] L. Scheef, C. Manka, M. Daamen et al., “Resting-state per-fusion in nonmedicated schizophrenic patients: a continuousarterial spin-labeling 3.0-T MR study,” Radiology, vol. 256, no.1, pp. 253–260, 2010.
[76] A. R. Deibler, J. M. Pollock, R. A. Kraft, H. Tan, J. H. Burdette,and J. A. Maldjian, “Arterial spin-labeling in routine clinicalpractice—part 3: hyperperfusion patterns,” American Journalof Neuroradiology, vol. 29, no. 8, pp. 1428–1435, 2008.
[77] I. Asllani, A. Borogovac, and J. Hirsch, “Constraints in abso-lute quantification of CBF using arterial spin labeling fMRI,”in Proceedings of the 15th Annual Meeting of the Organizationfor Human Brain Mapping, Poster Presentation, San Francisco,Calif, USA, June 2009.
[78] M. A. Fernandez-Seara, Z. Wang, J. Wang et al., “Continuousarterial spin labeling perfusion measurements using singleshot 3D GRASE at 3 T,” Magnetic Resonance in Medicine, vol.54, no. 5, pp. 1241–1247, 2005.
[79] R. L. Wolf and J. A. Detre, “Clinical neuroimaging usingarterial spin-labeled perfusion magnetic resonance imaging,”Neurotherapeutics, vol. 4, no. 3, pp. 346–359, 2007.
[80] J. H. Duyn, C. X. Tan, P. Van Gelderen, and M. N. Yongbi,“High-sensitivity single-shot perfusion-weighted fMRI,” Mag-netic Resonance in Medicine, vol. 46, no. 1, pp. 88–94, 2001.
[81] L. Hernandez-Garcia, G. R. Lee, A. L. Vazquez, and D. C. Noll,“Fast pseudo-continuous arterial spin labeling for functionalimaging using a two-coil system,” Magnetic Resonance inMedicine, vol. 51, no. 3, pp. 577–585, 2004.
[82] F. Hyder, I. Kida, K. L. Behar, R. P. Kennan, P. K. Maciejewski,and D. L. Rothman, “Quantitative functional imaging of thebrain: towards mapping neuronal activity by BOLD fMRI,”NMR in Biomedicine, vol. 14, no. 7-8, pp. 413–431, 2001.
[83] I. Asllani, C. Habeck, N. Scarmeas, A. Borogovac, T. R. Brown,and Y. Stern, “Multivariate and univariate analysis of con-tinuous arterial spin labeling perfusion MRI in Alzheimer’sdisease,” Journal of Cerebral Blood Flow and Metabolism, vol.28, no. 4, pp. 725–736, 2008.

Submit your manuscripts athttp://www.hindawi.com
VLSI Design
Hindawi Publishing Corporationhttp://www.hindawi.com Volume 2014
International Journal of
RotatingMachinery
Hindawi Publishing Corporationhttp://www.hindawi.com Volume 2014
Hindawi Publishing Corporation http://www.hindawi.com
Journal ofEngineeringVolume 2014
Hindawi Publishing Corporationhttp://www.hindawi.com Volume 2014
Shock and Vibration
Hindawi Publishing Corporationhttp://www.hindawi.com Volume 2014
Mechanical Engineering
Advances in
Hindawi Publishing Corporationhttp://www.hindawi.com Volume 2014
Civil EngineeringAdvances in
Acoustics and VibrationAdvances in
Hindawi Publishing Corporationhttp://www.hindawi.com Volume 2014
Hindawi Publishing Corporationhttp://www.hindawi.com Volume 2014
Electrical and Computer Engineering
Journal of
Hindawi Publishing Corporationhttp://www.hindawi.com Volume 2014
Distributed Sensor Networks
International Journal of
The Scientific World JournalHindawi Publishing Corporation http://www.hindawi.com Volume 2014
SensorsJournal of
Hindawi Publishing Corporationhttp://www.hindawi.com Volume 2014
Modelling & Simulation in EngineeringHindawi Publishing Corporation http://www.hindawi.com Volume 2014
Hindawi Publishing Corporationhttp://www.hindawi.com Volume 2014
Active and Passive Electronic Components
Hindawi Publishing Corporationhttp://www.hindawi.com Volume 2014
Chemical EngineeringInternational Journal of
Control Scienceand Engineering
Journal of
Hindawi Publishing Corporationhttp://www.hindawi.com Volume 2014
Antennas andPropagation
International Journal of
Hindawi Publishing Corporationhttp://www.hindawi.com Volume 2014
Hindawi Publishing Corporationhttp://www.hindawi.com Volume 2014
Navigation and Observation
International Journal of
Advances inOptoElectronics
Hindawi Publishing Corporation http://www.hindawi.com
Volume 2014
RoboticsJournal of
Hindawi Publishing Corporationhttp://www.hindawi.com Volume 2014