Arnold School of Public Health Office for the Study of Aging North Carolina Conference on Aging...
34
Arnold School of Public Health Office for the Study of Aging North Carolina Conference on Aging Session 2C: Healthy Aging Plenary Emerging Opportunities to Promote Cognitive Health Jim Laditka Jim Laditka
-
Upload
lilly-hindes -
Category
Documents
-
view
214 -
download
0
Transcript of Arnold School of Public Health Office for the Study of Aging North Carolina Conference on Aging...

Arnold School of Public HealthOffice for the Study of Aging
North Carolina Conference on Aging
Session 2C: Healthy Aging Plenary
Emerging Opportunities to Promote Cognitive Health
Jim LaditkaJim Laditka

North Carolina AD Prevalence
North Carolina Division of Aging and Adult Services Estimates 31,171 Moderate & Severe in 1998, 54,168 in 2020 . (Rates from U.S. GAO, Jan. 1998.)
0
10
20
30
40
50
60
65-69 70-74 75-79 80-84 85-89 90-94 95+
Age
Ra
te
Moderate, & Severe
Mild, Moderate, & Severe

Arnold School of Public HealthOffice for the Study of Aging
Data Sources
Long-term CareEvaluations S.C. Inpatient
HospitalizationsS.C. Emergency
Departments
MedicaidMental HealthRecords
MemoryClinics
Vital Records
ChartAbstracts
SouthCarolinaUnique
Identifier
AlgorithmTo RemoveDuplicates*
South CarolinaAlzheimer’s Disease
RegistryN.C. & G.A.Hospitals
P.A.C.E.
Other
Long-term CareEvaluations S.C. Inpatient
HospitalizationsS.C. Emergency
Departments
MedicaidMental HealthRecords
MemoryClinics
Vital Records
ChartAbstracts
SouthCarolinaUnique
Identifier
AlgorithmTo RemoveDuplicates*
South CarolinaAlzheimer’s Disease
RegistryN.C. & G.A.Hospitals
P.A.C.E.
Other
*Duplicates *Duplicates occur because individuals often use more than one name, social security number, or other identifying occur because individuals often use more than one name, social security number, or other identifying information when using health or social services.information when using health or social services.

South Carolina AD PrevalenceAlzheimer's Disease and Related Disorders
Prevalence South Carolina, 2002
0
10
20
30
40
50
60
70
65-6
9
70-7
4
75-7
9
80-8
4
85-8
9
90-9
4Age
%
SC Alzheimer's Disease Registry
SC State Health Plan
East Boston Study (includes Mild AD)
Southern Calif Study (includes Questionable AD)

Arnold School of Public HealthOffice for the Study of Aging
South Carolina AD Prevalence

AD Prevalence in SC
Prevalence of Alzheimer’s Disease, 2002,Prevalence of Alzheimer’s Disease, 2002,Comparing African Americans and European Americans, by SexComparing African Americans and European Americans, by Sex
AGE
55-64 65-74 75-84 85+
African Americans
Women (n=7,070)a 0.28 1.76 7.37 25.43
Men (=3,521)a 0.45 1.98 6.05 26.77
Non-Hispanic Whites
Women (n=12,914)a 0.14 0.81 4.18 16.47
Men (n=5,116)a 0.12 0.63 2.74 14.60
Prevalence Ratios and p-values:
African American Women Compared to non-Hispanic white Women
2.0p<0.0001
2.2p<0.0001
1.8p<0.0001
1.5p<0.0001
African American Men Compared to non-Hispanic white Men
3.8p<0.0001
3.1p<0.0001
2.2p<0.0001
1.8p<0.0001
aNumbers are Registry n’s, the number with an Alzheimer’s Diagnosis.
Arnold School of Public HealthOffice for the Study of Aging
All Persons Age 65+, ADRD, South Carolina, All Persons Age 65+, ADRD, South Carolina, 2002 Observed to Expected Ratio2002 Observed to Expected Ratio
O/E Ratio
0.47 - 0.58
0.59 - 0.86
0.87 - 0.95
0.96 - 1.00
1.10 - 1.20
1.20 - 1.30
1.30 - 1.50
1.60 - 1.70
Horry
Aiken
York
Berkeley
Colleton
Lee
Jasper
Sumter
Orangeburg
Florence
LaurensFairfield
Richland
UnionOconee
Kershaw
Greenville
Anderson
Lexington
Chester
Williamsburg
Dillon
Marion
Newberry
Chesterfield
Clarendon
Spartanburg
Saluda
Pickens
Barnwell
Hampton
Lancaster
Abbeville
Darlington
Marlboro
Edgefield
Georgetown
Dorchester
Calhoun
Allendale
Cherokee
McCormick
Charleston
Beaufort

Arnold School of Public HealthOffice for the Study of Aging
“Somehow, in all the confusion, I aged.”

Arnold School of Public HealthOffice for the Study of Aging
If you turn 65 today, your life expectancy is:
Women: 84.4
Men: 81.4SOURCE: Centers for Disease Control and Prevention, National Center for Health Statistics, National Vital Statistics System, 2003

Arnold School of Public HealthOffice for the Study of Aging / CHSPR
One typical study…
Kivipelto et al., Archives of Neurology, Oct. 2005
• 21 year follow-up beginning at mid-life.
• Obesity doubled the odds of developing AD.
• High blood pressure doubled the odds of developing AD.
• High total cholesterol doubled the odds of developing
AD.
• With all three factors, the odds of developing AD were
more than 6 times greater.

Adjusted rate of dementia, those who exercise the most,compared with those who exercise the least, followed 5 years
0.1 1 10Relative Risk of Dementia
Laurin et al. 2001
Larson et al. 2006
Ruvio et al. 2005
Scarmeas et al. 2001
Abbott et al. 2004
Broe et al. 1998

Arnold School of Public HealthOffice for the Study of Aging / CHSPR
Adjusted relative risk of developing cognitive impairment in those who exercise the most, compared with those who exercise the least, followed 5 years
0.1 1 10Relative Risk of Cognitive Impairment
Flicker et al. 2005
Laurin et al. 2001
Stewart et al. 2001
Weuve et al. 2004

Arnold School of Public HealthOffice for the Study of Aging
Adjusted relative risk of cognitive decline in those who exercise the most, compared with those who exercise the least, followed 5 years
0.1 1 10Relative Risk of Cognitive Decline
Lyttle et al. 2004
Schuit et al. 2001
Yaffe et al. 2001
Rockwood et al., Mech Ageing Dev, 2004; 125(7): 517-19

Arnold School of Public HealthOffice for the Study of Aging
Adjusted rates of developing Adjusted rates of developing Alzheimer’s DiseaseAlzheimer’s Diseasein those who exercise the most, versus those whoin those who exercise the most, versus those whoexercise the least, over 5 years of follow-upexercise the least, over 5 years of follow-up
0.01 0.1 1 10Relative Risk of Alzheimer's Disease
Larson et al. 2006
Laurin et al. 2001
Ruvio et al. 2005
Yoshitake et al. 1995
Abbott et al. 2004
Broe et al. 1998

Arnold School of Public HealthOffice for the Study of Aging
The association between mid-life physical activityThe association between mid-life physical activityand late-life dementia & Alzheimer’s Diseaseand late-life dementia & Alzheimer’s Diseasehas been reported as enhanced in ApoE4 carriershas been reported as enhanced in ApoE4 carriers
0.01 0.1 1 10Relative Risk of Dementia/AD
Dementia: ApoE4+
Dementia: ApoE4-
AD: ApoE4+
AD: ApoE4-
Rovio et al. Lancet Neurology 2005; 4: 705-11.
ee

Arnold School of Public HealthOffice for the Study of Aging
What kind of exercise? How much?

Arnold School of Public HealthOffice for the Study of Aging
Exercise Type and Intensity
• Frequency: – 3x/wk is better than <3x/wk (Laurin et al. 2001)– 5x/wk may offer little additional benefit (Lytle et al. 2004)
• Intensity: – more intense activity is associated with less cognitive
decline (Flicker et al. 2005, van Gelder et al. 2004)
• Duration: – 30min appears to be adequate – >30min & >60 min may offer little additional protection
(Schuit et al. 2001)

Study Design & Population
• Prospective observational study, Aerobics Center Longitudinal Study (ACLS).
• Baseline: 45,140 men, 14,820 women.
• Ages 20-88.
• Examined 1970-2001.
• Average 17 years of follow up.
• 1,012,125 person-years of observation.

Metabolic Equivalents (METs)Activity METs
Inactive (lying quietly) 1.0Walking, household 2.0Walking, 3.0 MPH* 3.3Walking, 3.5 MPH* 3.8Walking, 4.0 MPH* 5.0Walk or Run, 5.0 MPH* 8.0Running, 6.0 MPH* 10.0
*Level, firm surface (See Ainsworth et al., Med & Sci in Sports & Exercise, 2000)

Adjusted HRs of total dementia mortality
per 1-MET increase, by sex
Female Male
Adjusted for: age, exam year, BMI, smoking, alcohol intake, abnormal exercise ECG responses, HTN, DM, hypercholesterolemia, and health status.
P =0.04 P=0.0091.0
0.8

ACLS Maximal MET Tertiles
Women Men
Low < 5.8 < 7.2
Medium 5.8 - 7.6 7.2 - 9.5
High > 7.6 > 9.5

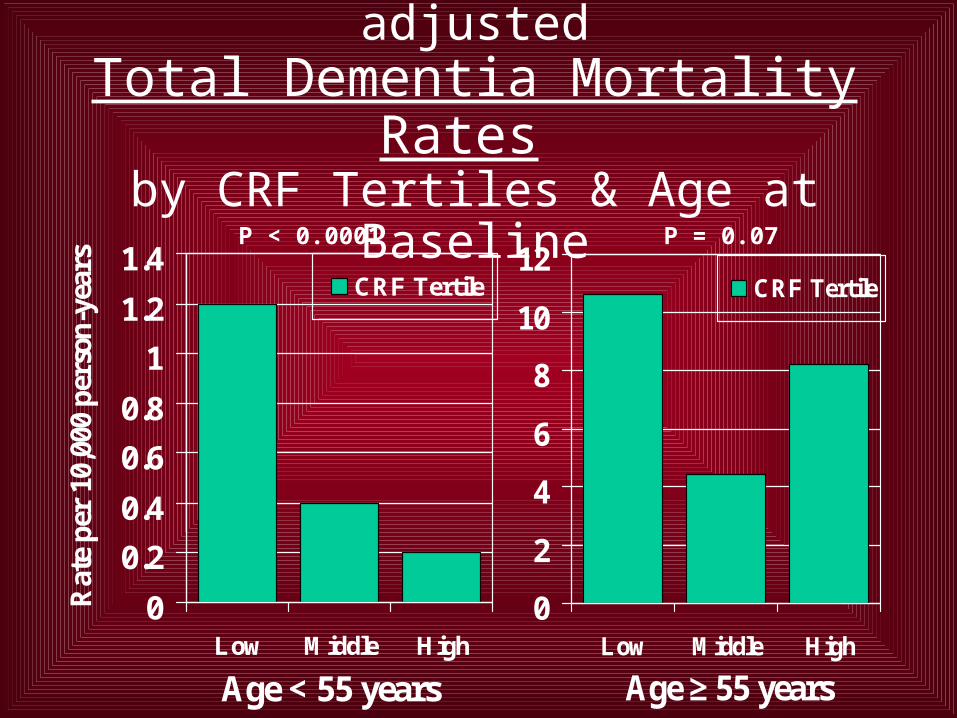
Sex and Examination Year-adjustedTotal Dementia Mortality Rates by CRF Tertiles & Age at Baseline
P = 0.07P < 0.0001
0
2
4
6
8
10
12
Low Middle High
Age ≥ 55 years
CRF Tertile
0
0.2
0.4
0.6
0.8
1
1.2
1.4
Low Middle High
Age < 55 years
Rat
e pe
r 10
,000
per
son-
year
s
CRF Tertile

Arnold School of Public HealthOffice for the Study of Aging
4 Recent meta-analyses
• Colcombe & Kramer (2003)• Heyn, Abreu & Ottenbacher (2004)• Netz, Wu, Becker & Tenebaum (2005)• Hendrie et al (2006)
• All found positive effects of exercise on cognition

Adjusted Odds Ratios for Depression at follow-up
Adjusted for: age, baseline examination year and survey response year. stressful occupation (yes or no), current smoking (yes or no), alcohol consumption (≥ 5 drinks/week or not), body mass index, hypertension, diabetes (present or not for each), and abnormal exercise ECG responses (present or not).
CRF N Events OR 95% CI
Low 363 55 1 Referent
Moderate 1,131 105 0.56 0.40-0.80
High 1,591 122 0.46 0.32-0.65
P-linear trend
<0.0001

Factors Related to Maintenance of Cognitive Health
• Avoid Vascular Damage
• “Heart Healthy” is “Brain Healthy” Blood pressure Cholesterol Diabetes Weight Smoking Physical activity

Arnold School of Public HealthOffice for the Study of Aging
“The Healthy Brain Initiative: A Roadmap to Maintaining Cognitive Health”
• CDC
• Alzheimer’s Association
• NIH
• AARP
• The Healthy Aging Research Network
• Other partners

• Physical Activity
• Diet
• Cognitive stimulation
• Environmental enrichment
Arnold School of Public HealthOffice for the Study of Aging
Invitational Expert Consensus Summit on Wellness for Persons with Dementia
Oct 20-21, 2005

Arnold School of Public HealthOffice for the Study of Aging
Physician Focus Groups, 2007
“What do you say to your patients
about maintaining brain health?”

Arnold School of Public HealthOffice for the Study of Aging
Physician Focus Groups, 2007
Preliminary result:
“Nothing”

Arnold School of Public HealthOffice for the Study of Aging
Physician Focus Groups, 2007
“Why is it that you do not discuss
brain health with your patients?”

Arnold School of Public HealthOffice for the Study of Aging
Physician Focus Groups, 2007
Preliminary result:
“There isn’t any evidence that there
is anything they can do about it.
It would be a waste of time.”
Sex and Examination Year-adjustedTotal Dementia Mortality Rates by CRF Tertiles & Age at Baseline
P = 0.07P < 0.0001
0
2
4
6
8
10
12
Low Middle High
Age ≥ 55 years
CRF Tertile
0
0.2
0.4
0.6
0.8
1
1.2
1.4
Low Middle High
Age < 55 years
Rat
e pe
r 10
,000
per
son-
year
s
CRF Tertile

“Epidemiology Cannot Establish Causation”
• Causal inferences are usually uncertain
• Causal inference is strengthened by evidence from all branches of medical science--pathophysiology, epidemiology, and controlled experiments
• Established causal inferences not relying on experimental evidence in humans– Thalidomide and birth defects
– Radiation and cancer
– Cigarette smoking and lung cancer

Arnold School of Public HealthOffice for the Study of Aging
North Carolina Conference on Aging
Session 2C: Healthy Aging Plenary
Emerging Opportunities to Promote Cognitive Health
Jim LaditkaJim Laditka