ARMENIA COMPREHENSIVE FOOD SECURITY, VULNERABILITY ...
6
1 ARMENIA COMPREHENSIVE FOOD SECURITY, VULNERABILITY ANALYSIS (CFSVA) UPDATE 2017 SOCIO-ECONOMIC TRENDS The Armenia Comprehensive Food Security, Vulnerability Analysis (CFSVA) Update presents the current food security and nutrition situation based on 2015 data, which were officially available for analysis in early 2017. The document explores the distribution of food insecurity and related areas where the Government of Armenia and partners could take measures to address the issues. Information presented in this Update will be used for tracking the progress of two National Indicators of the Sustainable Development Goal 2- End hunger, achieve food security and improved nutrition and promote sustainable agriculture. In 2015, the Armenian Gross Domestic Product (GDP) growth stood at 3.2 percent. 1 Following a decade of strong economic growth, the Armenian GDP contracted by 14.1 percent in 2009, as a result of the global economic crisis. The Armenian GDP has continued to grow since then, however 2015 marks a 0.4 percent decrease 2 in the level of growth from the year before. Yet, gains made in the economy during this period have not been inclusive. In Armenia, almost one in three person was living below the poverty line in 2015. The poverty rate has been slow to decline since the 2009 economic crisis. At 29.8 percent in 2015 4 , there has only been a 0.2 percentage point decrease from the year before. Concomitant with this decline, following a trend in growing unemployment in the preceding two years, the officially registered unemployment rate increased to 18.5 percent in 2015. 3 The poverty 4 rate is particularly high for unemployed people living in urban areas outside of Yerevan, reaching 46.7 percent. Women and young people continue to face difficulties in finding gainful employment. In 2015, nearly 45 percent of female and 24 percent of male youth aged 15 to 29 were neither pursuing any education nor working. 5 Women also faced significant obstacles in achieving higher wages, with female earnings amounting to 66.5 percent of men’s in 2015, a gender pay gap of 33.5 percent. 6 With unemployment and poverty rates remaining high and showing little sign of improvement, many people in Armenia are pursuing work opportunities abroad. Remittances are an important source of income for many households and they remain a significant contributing factor to the economy. Remittances as a share of GDP has been steadily decreasing since 2013, but still held a significant 14 percent share in 2015. 7 1 NSS RA official website. Retrieved from: http://armstat.am/am/?nid=12&id=01001 2 Ibid 3 NSS RA and the World Bank. (2015). Social snapshot and poverty in Armenia. Yerevan, Armenia 4 NSS Ra, UNICEF and WFP. (2016). Armenia Comprehensive Food Security, Vulnerability and Nutrition Analysis. Yerevan, Armenia 5 NSS RA. (2016). Women and Men in Armenia. Retrieved from: http://armstat.am/file/article/gender_2016_6.pdf 6 Ibid 7 WB. (2016). Personal remittances. Retrieved from: WB 2016 https://data.worldbank.org/indicator/BX.TRF.PWKR.DT.GD.ZS?locations=AM Methodology The Integrated Living Conditions Surveys (ILCS) 2015 database was used for this report. The ILCS is carried out each year by the National Statistical Service of the Republic of Armenia (NSS RA). The nutrition situation analysis is based on the 2015-16 Armenia Demographic and Health Survey (ADHS) results. Food security indicators were created using the methodology developed for the “Armenia Comprehensive Food Security, Vulnerability and Nutrition Analysis” endorsed by key stakeholders in 2016. 5 Note: As the food security analysis uses 2015 data, for consistency the same 2015year data is presented for macro-economic indicators.
Transcript of ARMENIA COMPREHENSIVE FOOD SECURITY, VULNERABILITY ...

1
A R M E N I A C O M P R E H E N S I V E F O O D S E C U R I T Y , VU L N E R A B I L I T Y
A N A L Y S I S ( C F S V A ) U P D A T E 2 0 1 7
SOCIO-ECONOMIC TRENDS
The Armenia Comprehensive Food Security, Vulnerability Analysis (CFSVA) Update presents the current food security and nutrition situation based on 2015 data, which were officially available for analysis in early 2017. The document explores the distribution of food insecurity and related areas where the Government of Armenia and partners could take measures to address the issues. Information presented in this Update will be used for tracking the progress of two National Indicators of the Sustainable Development Goal 2- End hunger, achieve food security and improved nutrition and promote sustainable agriculture.
In 2015, the Armenian Gross Domestic Product (GDP) growth stood at 3.2 percent.1 Following a decade of strong economic growth, the Armenian GDP contracted by 14.1 percent in 2009, as a result of the global economic crisis. The Armenian GDP has continued to grow since then, however 2015 marks a 0.4 percent decrease2 in the level of growth from the year before. Yet, gains made in the economy during this period have not been inclusive.
In Armenia, almost one in three person was living below the poverty line in 2015. The poverty rate has been slow to decline since the 2009 economic crisis. At 29.8 percent in 20154, there has only been a 0.2 percentage point decrease from the year before. Concomitant with this decline, following a trend in growing unemployment in the preceding two years, the officially registered unemployment rate increased to 18.5 percent in 2015.3 The poverty4rate is particularly high for unemployed people living in urban areas outside of Yerevan, reaching 46.7 percent. Women and young people continue to face difficulties in finding gainful employment. In 2015, nearly 45 percent of female and 24 percent of male youth aged 15 to 29 were neither pursuing any education nor working.5 Women also faced significant obstacles in achieving higher wages, with female earnings amounting to 66.5 percent of men’s in 2015, a gender pay gap of 33.5 percent.6
With unemployment and poverty rates remaining high and showing little sign of improvement, many people in Armenia are pursuing work opportunities abroad. Remittances are an important source of income for many households and they remain a significant contributing factor to the economy. Remittances as a share of GDP has been steadily decreasing since 2013, but still held a significant 14 percent share in 2015.7
1 NSS RA official website. Retrieved from: http://armstat.am/am/?nid=12&id=01001 2 Ibid 3 NSS RA and the World Bank. (2015). Social snapshot and poverty in Armenia. Yerevan, Armenia 4 NSS Ra, UNICEF and WFP. (2016). Armenia Comprehensive Food Security, Vulnerability and Nutrition Analysis. Yerevan, Armenia 5 NSS RA. (2016). Women and Men in Armenia. Retrieved from: http://armstat.am/file/article/gender_2016_6.pdf 6 Ibid 7 WB. (2016). Personal remittances. Retrieved from: WB 2016 https://data.worldbank.org/indicator/BX.TRF.PWKR.DT.GD.ZS?locations=AM
Methodology
The Integrated Living Conditions Surveys (ILCS) 2015 database was used for this report. The ILCS is carried out each year by the National Statistical Service of the Republic of Armenia (NSS RA). The nutrition situation analysis is based on the 2015-16 Armenia Demographic and Health Survey (ADHS) results.
Food security indicators were created using the methodology developed for the “Armenia Comprehensive Food Security, Vulnerability and Nutrition Analysis” endorsed by key stakeholders in 2016.5
Note: As the food security analysis uses 2015 data, for consistency the same 2015year data is presented for macro-economic indicators.

2
FOOD INSECURITY TRENDS
The global economic crisis caused food insecurity in Armenia to grow sharply. Despite economic growth, the level of food insecure households remains high at 16 percent, double the level in 2008 and one percentage point higher than the previous year. Figure 1 also shows an increasing gap
between levels of food security and food insecurity, indicating that recent economic growth has benefited only a segment of the population, but has left behind those worse off. This increasing disparity can be seen in other socioeconomic indicators in Armenia: aggregate income inequality (Gini coefficient), for example, increased from 0.339 in 2008 to 0.374 in 2015, revealing the worsening situation.8
Figure 1: Food security trends (2008-2015)
FOOD-INSECURE PREVALENCE
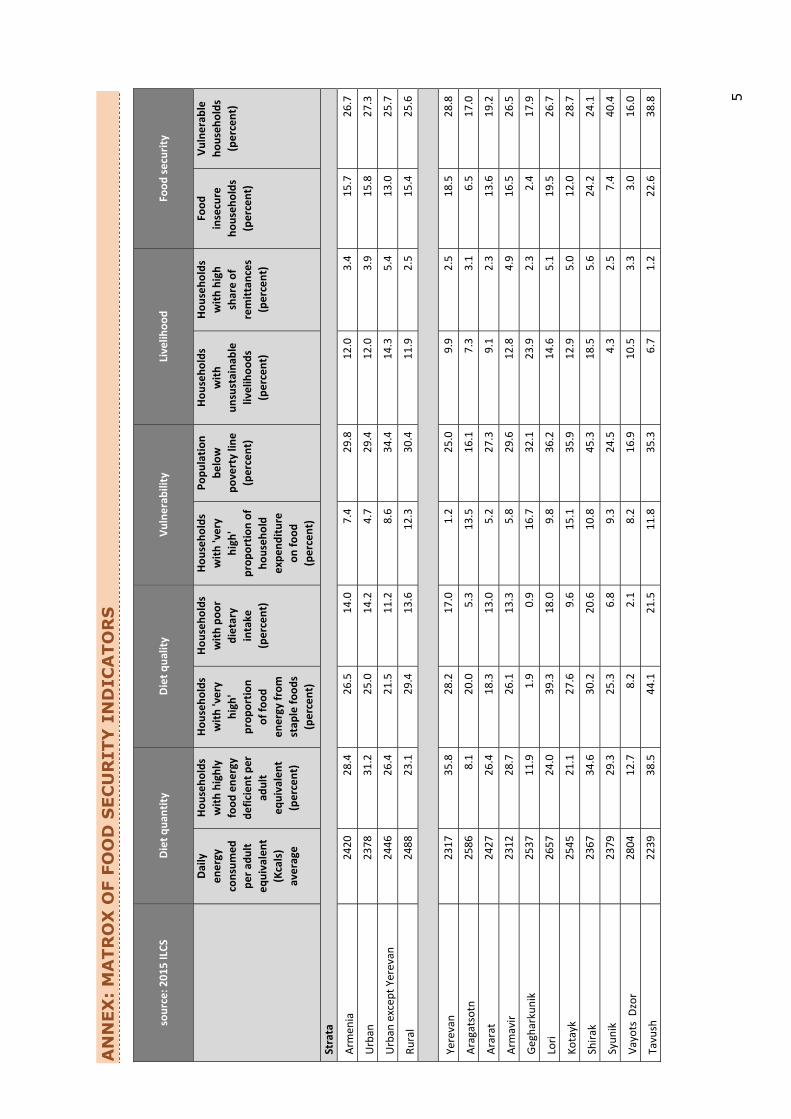
In 2015, the highest level of food insecurity was 24.2 percent, in Shirak province. This was followed by 22.6 and 19.5 percent prevalence in Tavush and Lori provinces respectively. Although the average food insecurity prevalence increased only by one percentage point in 2015 compared to the previous year (from 15 percent to 16 percent), in Tavush and Shirak provinces, the prevalence of food insecurity increased by 7 percentage points, demonstrating significant disparities and uneven territorial development in Armenia.
8 NSS RA and the World Bank. (2015). Social snapshot and poverty in Armenia. Yerevan, Armenia

3
PROFILE OF FOOD-INSECURE HOUSEHOLDS
As seen in previous years, in 2015 the households, which had an unemployed household head, were significantly more likely to be food insecure (28.1 percent) compared to the national average (15.7 percent). Food insecure households are likely to have lower incomes, with 47.6 percent of those below the poverty lines qualifying as food insecure and another 40.4 percent at risk of falling in food insecurity.
Another indicator that pointed to a higher likelihood of food insecurity was larger households. Those with a high percentage of dependents and households with six or more members were 6 percentage point more likely to be food insecure compared to the national average.
The combination of food energy deficiency and very high consumption of staple foods was used to create an indicator called ‘poor dietary intake’ to identify households lacking both dietary quality and quantity. The ‘poor dietary intake’ will be used as one of the National Indicators for tracking the progress of SDG2.
Figure 2: Percentage of households with poor dietary intake in 2014 and 2015 (both quality and quantity)
Figure 2 shows two percentage point increase in poor dietary intake prevalence, from 12 percent in 2014 to 14 percent in 2015. Certain provinces were considerably more affected than others: in Tavush, Shirak and Lori the level was 22, 21 and 18 percent respectively and increased significantly compared to 2014. Differing from the situation in 2014, when compared to other provinces Yerevan was the worst affected by both a high prevalence of food insecurity and a poor dietary intake, in 2015 the highest prevalence of these two indicators was observed in Tavush and Shirak. Increased poverty, decreased remittances, lack of self-production possibilities and market availability might account for this.

4
MALNUTRITION
Dietary diversity and feeding frequency are key indicators to ensure that children meet their nutrient and caloric requirements. In 2015, 50.2 percent of infants and young children aged 6-23 months were recorded as consuming the minimum dietary diversity, while only 24.5 percent had the minimum acceptable diet.9
Deficiencies in micronutrients can induce malnutrition and be an indicator for food insecurity. Whether or not a child receives an appropriate level of micronutrients is associated with mother’s education. Although levels of anemia among children aged 6-59 months have dropped in the past 10 years, it still remains a significant concern in Armenia. While the average prevalence in the country is 15.6 percent, it is still significantly higher (48.8 percent) in Gegharkunik.10
In 2015, 9.4 percent of children under 5 were stunted, 4.2 percent were wasted, 2.6 percent were underweight, and 13.6 percent were overweight. All four categories are less likely to occur in children in wealthier households and those who have mothers with higher than secondary education. Children who are overweight are more of a concern than those underweight, as the prevalence of underweight has tended to decrease in the past 10 years, while the prevalence of overweight has exhibited an opposing trend. Overweight remains especially prevalent among those in rural areas (16.4 percent) and in Ararat province (35.9 percent). Overweight children are more likely to become overweight as adults, which poses a severe public health concern.
CONCLUSIONS
• Armenia’s level of food insecurity continued to increase by one percentage point every year starting from 2012, reaching 16 percent in 2015;
• There is a growing gap between the food insecure and the food secure, indicating that the observed economic growth has not been inclusive;
• In 2015, nearly a third of Armenian households continued to be vulnerable towards becoming food insecure in the event of unexpected shocks;
• The situation in Tavush and Shirak provinces has been worsening between 2015 and 2016 with higher prevalence of food insecurity concomitant with a poorer diet quality and quantity;
• In 2015, 9.4 percent of children under 5 were stunted, while 13.6 percent were overweight.
9 NSS RA, Ministry of Health & ICF. (2017). Armenia Demographic and Health Survey 2015-16. Rockville, Maryland, USA 10 Ibid
For more information, please contact:
Lusine Markosyan, NSS RA, Tel.:+374 (11) 524326, E-mail: [email protected]
Elmira Bakhshinyan, WFP/Armenia, Tel.: +374 (10) 580538, E-mail: [email protected]
Naira Vardanyan, CRRC-Armenia, Tel.: +374 (10) 574898, E-mail: [email protected]
5
AN
NEX
: M
ATR
OX
OF
FOO
D S
ECU
RIT
Y I
ND
ICA
TOR
S
sour
ce: 2
015
ILCS
Di
et q
uant
ity
Diet
qua
lity
Vuln
erab
ility
Liv
elih
ood
Food
secu
rity
Daily
en
ergy
co
nsum
ed
per a
dult
equi
vale
nt
(Kca
ls)
aver
age
Hous
ehol
ds
with
hig
hly
food
ene
rgy
defic
ient
per
ad
ult
equi
vale
nt
(per
cent
)
Hous
ehol
ds
with
'ver
y hi
gh'
prop
ortio
n of
food
en
ergy
from
st
aple
food
s (p
erce
nt)
Hous
ehol
ds
with
poo
r di
etar
y in
take
(p
erce
nt)
Hous
ehol
ds
with
'ver
y hi
gh'
prop
ortio
n of
ho
useh
old
expe
nditu
re
on fo
od
(per
cent
)
Popu
latio
n be
low
po
vert
y lin
e (p
erce
nt)
Hous
ehol
ds
with
un
sust
aina
ble
livel
ihoo
ds
(per
cent
)
Hous
ehol
ds
with
hig
h sh
are
of
rem
ittan
ces
(per
cent
)
Food
in
secu
re
hous
ehol
ds
(per
cent
)
Vuln
erab
le
hous
ehol
ds
(per
cent
)
Stra
ta
Arm
enia
24
20
28.4
26
.5
14.0
7.
4 29
.8
12.0
3.
4 15
.7
26.7
Urba
n 23
78
31.2
25
.0
14.2
4.
7 29
.4
12.0
3.
9 15
.8
27.3
Urba
n ex
cept
Yer
evan
24
46
26.4
21
.5
11.2
8.
6 34
.4
14.3
5.
4 13
.0
25.7
Rura
l 24
88
23.1
29
.4
13.6
12
.3
30.4
11
.9
2.5
15.4
25
.6
Yere
van
23
17
35.8
28
.2
17.0
1.
2 25
.0
9.9
2.5
18.5
28
.8
Arag
atso
tn
2586
8.
1 20
.0
5.3
13.5
16
.1
7.3
3.1
6.5
17.0
Arar
at
2427
26
.4
18.3
13
.0
5.2
27.3
9.
1 2.
3 13
.6
19.2
Arm
avir
23
12
28.7
26
.1
13.3
5.
8 29
.6
12.8
4.
9 16
.5
26.5
Gegh
arku
nik
2537
11
.9
1.9
0.9
16.7
32
.1
23.9
2.
3 2.
4 17
.9
Lori
26
57
24.0
39
.3
18.0
9.
8 36
.2
14.6
5.
1 19
.5
26.7
Kota
yk
2545
21
.1
27.6
9.
6 15
.1
35.9
12
.9
5.0
12.0
28
.7
Shira
k
2367
34
.6
30.2
20
.6
10.8
45
.3
18.5
5.
6 24
.2
24.1
Syun
ik
2379
29
.3
25.3
6.
8 9.
3 24
.5
4.3
2.5
7.4
40.4
Vayo
ts D
zor
2804
12
.7
8.2
2.1
8.2
16.9
10
.5
3.3
3.0
16.0
Tavu
sh
2239
38
.5
44.1
21
.5
11.8
35
.3
6.7
1.2
22.6
38
.8

6
Sour
ce: 2
015
ILCS
Di
et q
uant
ity
Diet
qua
lity
Vuln
erab
ility
Liv
elih
ood
Food
secu
rity
Daily
ene
rgy
cons
umed
pe
r adu
lt eq
uiva
lent
(K
cals)
av
erag
e
Hous
ehol
ds
with
hig
hly
food
ene
rgy
defic
ient
per
ad
ult
equi
vale
nt
(per
cent
)
Hous
ehol
ds
with
'ver
y hi
gh'
prop
ortio
n of
fo
od e
nerg
y fro
m st
aple
fo
ods
(per
cent
)
Hous
ehol
ds
with
poo
r di
etar
y in
take
(p
erce
nt)
Hous
ehol
ds
with
'ver
y hi
gh'
prop
ortio
n of
ho
useh
old
expe
nditu
re
on fo
od
(per
cent
)
Popu
latio
n be
low
po
vert
y lin
e (p
erce
nt)
Hous
ehol
ds
with
un
sust
aina
ble
livel
ihoo
ds
(per
cent
)
Hous
ehol
ds
with
hig
h sh
are
of
rem
ittan
ces
(per
cent
)
Food
in
secu
re
hous
ehol
ds
(per
cent
)
Vuln
erab
le
hous
ehol
ds
(per
cent
)
Food
secu
rity
Fo
od in
secu
re
1789
95
.3
93.8
89
.0
11.0
79
.3
21.9
3.
7 10
0.0
0.0
Vuln
erab
le
2182
50
.2
44.2
0.
0 8.
4 42
.9
9.5
2.0
0.0
100.
0 Fo
od se
cure
27
58
0.0
0.0
0.0
5.9
6.3
10.4
3.
9 0.
0 0.
0 Lo
wes
t 19
26
70.4
62
.2
45.7
21
.7
100.
0 11
.6
1.9
50.1
38
.3
Seco
nd
2287
33
.5
34.2
13
.7
7.2
21.0
11
.8
1.4
18.0
42
.3
Mid
dle
2539
17
.7
17.6
5.
6 4.
5 0.
0 10
.3
4.1
5.6
24.0
Fo
urth
26
97
11.1
10
.4
2.1
2.4
0.0
11.6
4.
7 2.
1 17
.2
High
est
2921
8.
5 7.
8 1.
9 0.
8 0.
0 14
.5
4.8
1.9
12.5
Be
low
pov
erty
line
19
39
68.8
60
.6
43.1
19
.6
100.
0 11
.6
1.9
47.6
40
.4
Abov
e po
vert
y lin
e
2623
14
.9
15.2
4.
3 3.
3 0.
0 12
.1
3.9
5.1
22.2
Un
empl
oyed
hou
seho
ld h
ead
2298
41
.0
37.3
24
.3
3.8
40.2
34
.8
9.9
28.1
29
.0
Hous
ehol
d w
ith 6
or m
ore
mem
bers
23
44
35.6
37
.1
20.0
7.
7 40
.6
6.7
1.1
21.6
32
.6
Pens
ione
rs
2360
32
.4
31.7
17
.3
5.9
33.9
4.
1 1.
8 17
.5
29.9
Ho
useh
olds
hea
ded
by
wom
en
2392
30
.0
26.7
14
.4
7.5
32.1
12
.3
4.3
15.8
27
.5
Hous
ehol
ds w
ith h
igh
perc
enta
ge o
f dep
ende
nts
2436
28
.5
32.1
16
.5
9.3
39.0
25
.8
8.7
22.1
26
.4
Hous
ehol
ds w
ith d
isabl
ed
mem
ber
2366
34
.9
32.3
18
.0
7.0
34.7
5.
5 2.
0 18
.4
31.9
Enro
lled
in th
e po
vert
y be
nefit
syst
em
2415
33
.5
40.4
20
.5
13.2
51
.4
8.7
1.4
22.2
33
.3