ARKIVAL TECHNOLOGY CORPORATION
94
1 ARKIVAL TECHNOLOGY CORPORATION ENVIRONMENTAL STABILITY STUDY AND LIFE EXPECTANCIES OF MAGNETIC MEDIA FOR USE WITH IBM 3590 AND QUANTUM DIGITAL LINEAR TAPE SYSTEMS Ronald D. Weiss Arkival Technology Corporation 427 Amherst St. Nashua, NH 03063 Phone: (603) 881-3322 www.ARKIVAL.com
Transcript of ARKIVAL TECHNOLOGY CORPORATION

1
ARKIVAL TECHNOLOGY CORPORATION
ENVIRONMENTAL STABILITY STUDY AND LIFE EXPECTANCIES OFMAGNETIC MEDIA FOR USE WITH IBM 3590 AND QUANTUM DIGITAL
LINEAR TAPE SYSTEMS
Ronald D. Weiss
Arkival Technology Corporation427 Amherst St. Nashua, NH 03063
Phone: (603) 881-3322www.ARKIVAL.com

2
ARKIVAL TECHNOLOGY CORPORATION
ENVIRONMENTAL STABILITY STUDY AND LIFE EXPECTANCIES OFMAGNETIC MEDIA FOR USE WITH IBM 3590 AND QUANTUM DIGITAL
LINEAR TAPE SYSTEMS
National Archives and Records Administration#NAMA-01-F-0061
FINAL REPORTPERIOD of WORK: October 2001- June 2002
Federal Supply Service Contract Number: GS 35F 0611L
Arkival Technology Corporation427 Amherst St. Nashua, NH 03063
Phone: (603) 881-3322 www.ARKIVAL.com

3
TABLE of CONTENTSExecutive Summary………………………………………………………… 51.0 STUDY OVERVIEW…………………………………………………… 7
1.1 Technical Areas of Study1.2 Study Duration1.3 Tape Drive Recording Features1.4 Test Environments1.5 Data Collection and Analysis
2.0 TECHNICAL STUDIES2.1 Magnetic & Microstructure Analyses of the Recording Media….. 9
2.1.1 Transmission Electron Microscopy (TEM) Analysis2.1.2 Vibrating Sample Magnetometer (VSM) Analysis
2.2 VSM/Aging Study…………………………………………………. 142.3 Binder Hydrolysis ………………………………………………... 172.4 Physical Properties ……………………………………………….. 24
2.4.1 Resistivity2.4.2 Friction
2.5 RF Amplitude response …………………………………………….282.6 Error Study ……………………………………………………….. 31
2.6.1 Catastrophic Tape and Drive Failures
2.7 Life Expectancies (LE) …………………………………………… 382.7.1 Magnetic Saturation LE2.7.2 Error Rate (B*ER) LE
Conclusions ……………………………………………………………………….. 45Acknowledgements ……………………………………………………………….. 47Glossary …………………………………………………………………………… 49References …………………………………………………………………………..51Appendix …………………………………………………………………………...53
A.1.0 ……………………………………………………………………...53A.2.1 ………………………………………………………………………54A.2.2 ……………………………………………………………………...65A.2.3 ………………………………………………………………………67A.2.4 ……………………………………………………………………...73A.2.5 ………………………………………………………………………75A.2.6 ……………………………………………………………………...78A.2.7 ………………………………………………………………………82DATABASE: Magnetic Stability Predictive Model ……………………….93

4
This page intentionally left blank

5
EXECUTIVE SUMMARY
This study investigated environmental stability and life expectancies of magnetic mediaused with the high density, digital storage systems, specifically the IBM 3590 and bothQuantum’s Digital Linear Tape (DLT) and Super DLT products for the archivalpreservation of electronic records.
All magnetic media of the study were subjected to several temperature/humidityenvironments. Environmentally conditioned tape cassettes and tape samples wereperiodically tested for changes in bulk magnetic properties, physical and chemicalproperties, recording/playback performance, errors, life-expectancy (LE) and the overallimpact of these parameter changes on long term preservation.
The study determined the magnetic saturation moment to be the most sensitive toenvironmental storage. In all temperatures and humidities tested the DLT media exhibitedthe least change. A calculation of LE based on magnetic saturation changes showed theDLT media had the highest LE in almost all environmental conditions reported. In allcases, the LE of the 3590 media was less than that of the DLT; the magnitude of thedifference in LE varied with the environmental storage condition.
Binder hydrolysis extracts from the evaluated tape media revealed minimum degradationand only minor changes in their compositions over time. Tapes subjected to the mostsevere environmental condition of 100 oC and 100% RH did show significant signs ofphysical breakdown. The DLT and SDLT tapes were amongst the slowest to show visualsigns of degradation, although these too degraded eventually.
The changing values of resistivity with environmental exposure were substantial butwithin specification limits. The DLT and SDLT tapes were the most stable on both theirmagnetic and conductive sides.
Changes in friction coefficient resulting from time exposure to the three environmentalconditions indicated the DLT and SDLT media exhibited the least change.
The frequency response of each tape media was compared to its original after eachinterval of temperature/relative humidity (RH) exposure. Throughout all testenvironments, the DLT and SDLT tapes were the most stable among the subject tapes ofthis evaluation.
Tape/drive errors resulting from both the first write operation and all subsequent readswere studied for the SDLT, DLT and 3590; including changes resulting fromenvironmental exposure. Parameters of importance during write and read werecorrectable block errors, retries, non-correctable block errors and the error rate (B*ER).Although dependent upon the storage environment, the SDLT error correction efficiencywas most favorable followed thereafter by the DLT and 3590.

6
Selected end-of life (EOL) criteria and mathematical models were used with actual datato predict the life expectancies (LE) of these storage systems. LE’s were calculated onthe basis of the media storage at the different environmental conditions. The effectivenessof each Storage Device’s error correction code (ECC) efficiency influenced theirresulting life expectancies. The DLT and SDLT exhibited greater LE’s than the 3590 inalmost every environmental condition and results were consistent with the error studiesand the LE results based upon magnetic saturation.
In all technical investigation areas reported, the DLT/SDLT tape product demonstratedthe most environmentally stable performance and is the most favorable archival tapestorage medium.
Overall, the three products evaluated demonstrated an impressive ability to deliver datareliably and are representative of the progress of storage technology. Tape failures anddata losses however were observed with all three storage products studied. It is critical torecognize the likelihood of this potential failure and plan for it accordingly.

7
STUDY OVERVIEW
1.1 TECHNICAL AREAS OF STUDY
The specified tasks of the study embodied six (6) technical areas significant to a magneticstorage media undergoing change. They are
• Magnetic and microstructure analysis of the recording media• Intrinsic magnetic characteristics,• Physical characteristics,• Binder chemistry,• Recording characteristics,• Error/drive performance
A cooperative technical exchange was established with both IBM and Quantum, thestorage system manufacturers. Technical issues, recommendations and revisions in thetesting procedures were addressed with consideration to the study objectives and thecomplexity of the individual drive products. Test methods were finalized thereafter toinsure resulting data was indicative of the changing state of the recording media.
1.2 DURATION OF STUDY
Each identified property was measured for change at 3-4 week intervals during the courseof the study. The study duration varied by attribute depending upon its significanceand/or changes noted in the course of the study. The designated attribute is listed below:
Attribute -TestMagnetics- VSM parameter changesPhysical Properties
-Resistivity changes -Friction changesBinder HydrolysisRecording Property-RF Amplitude changesTape Error changes

8
1.3 STORAGE SYSTEM AND TAPE MEDIA STANDARDSInternational standards exist for all three of the products studied. ECMA/ISO/ANSI testmethods and procedures were used in this study when appropriate and applicable.Information provided in these standards and the manufacturers published productspecifications were used to determine technical detail. An overview of the relevantfeatures of the storage products studied is noted in Table A.1.1 in Appendix 1.0 alongwith their corresponding ECMA/ANSI specifications.
1.4 TEST ENVIRONMENTSThe selection of test environments was critical to the study and was specified by theNational Archives and Records Administration (NARA). Additional environments wereincluded in the Arkival study to accelerate changes in the tape storage medium. Thefollowing Table 1.2 compares the original equipment manufacturer (OEM) productspecifications, test environments used in this study and the storage environment used byNARA.
TABLE 1.2 ENVIRONMENTAL DATA
1.5 DATA COLLECTION & ANALYSIS
The complexity of these new tape storage products has changed dramatically since thelast NARA media report in 1988 (1). Discussion with both IBM and Quantum resulted inthe determination of appropriate data to be collected and compared for the purpose of thestudy. The collection of additional data also insured that information significant tochange would not be lost or overlooked. The extensive volume of test data beinggenerated from the different investigatory areas of the program, particularly the errorstudy needed management. Data management and analysis became a critical focus in theprogram as methods were developed to prepare the data for summary and reporting.Important data summaries are included in the appendix of this report._____________________________(1) Weir, T.E. National Archives Technical Information Paper #4 (June, 1988)
OEM Specs Store Operate TestIBM 3590 ECMA 278 32 oC /80%RH 32 oC /80%RH 25 oC /60%RH
DLT IV ECMA 286 32 oC /80%RH 32 oC /80%RH 25 oC /60%RH
Super DLT ECMA 320 32 oC /80%RH 40 oC /80%RH 25 oC /60%RH
Arkival Study Condition 1 Condition 2 Condition 340 oC /50%RH 50 oC /75%RH 50 oC /85%RH
NARA ER Storage Storage20oC/45%RH

9
1 TECHNICAL STUDY
2.1 MAGNETIC AND MICROSTRUTURE ANALYSES OF THERECORDING MEDIA
OBJECT: To characterize the recording media available for the three (3) storagedevicesBASIS: To technically characterize and identify the major media types andmanufacturing traits of recording tapes used in the study.
DISCUSSIONStorage device users typically have several brand name choices of recording media. Acommon practice in the industry is for tape manufacturers to have OEM arrangementswith one another regarding specific tapes for certain storage devices. Althoughsuggestive to users that they have different brands of choice, many brands are private-labeled as such and produced by one or two manufacturers. The aspect of the studywas designed to:
• Profile the intrinsic magnetic parameters of the recording media• Identify, compare and understand the microstructure of the recording media• Determine the technical fingerprint(s) of recording media available for the three
(3) storage devices being investigated• Technically identify the major media sources/licensees and determine the basis
for tapes used for the remainder of the study and…• Provide NARA with alternative media sources for each storage device evaluated
Specific tape purchases were made from Distributors at 3 nationwide locations so thatdifferent lots of media could beincluded in the study. Tape stockwas purchased with the followingbrand names. See table to right.
RESULTS
2.1.1 TEM ANALYSIS
Samples of various vendors’ tapes wereprepared for transmission electronmicroscopy (TEM) analysis to revealthe microstructure of the tapes in cross-section. This information was sought todetermine structure, uniqueness and
DLT IV: Quantum, Fuji, Maxell,Imation, Sony.
Super DLT: Quantum, MaxellIBM 3590: IBM, BASF(Emtec), ImationIBM 3590E IBM, BASF(Emtec), Imation

10
identity by tape manufacturer. The results of the ‘brand name’ tape study are includedin Appendix 2.1 Representative resultsare included in the followingdiscussion. The test tapes were studiedvia their TEM cross sections at severaldifferent magnifications. Two distinctmedia manufacturing technologieswere determined from the TEManalysis; single and double layermagnetic coatings. The IBM 3590media was all single coated and theQuantum DLT and SDLT media wereall double coated. The other referencetapes in the evaluation (BaFe and MP-DLTIII) were single coated.
Figure 1 is the lowest magnification(5kx) of the Fuji DLT IV tape showingits entire cross section, the front coat(magnetic later) on top, the substrate and the backcoat (conductive layer).
Figure 2, of the same tape at 25 kx magnification illustrates the double layer magneticcoating; the magnetic layer consists of a thin layer of oriented acicular metal particles andit’s non-magnetic under layer of spherical TiO2-type particles.
The Figure below, labeled Figure 6 is a high magnification (25kx) micrograph of theIBM 3590 tape showing its single layer technology.
The actual micrographs werealso used to measure mediacomponent thicknesses forthe magnetic calculations. Acomparison of measuredthicknesses obtained fromboth low and highmagnification TEM’s isincluded in Table 2.1.1.
When the Quantum DLTand SDLT tape data fromthe Table is grouped bylikely manufacturers, Fuji(MA) and Maxell (SH), the
11
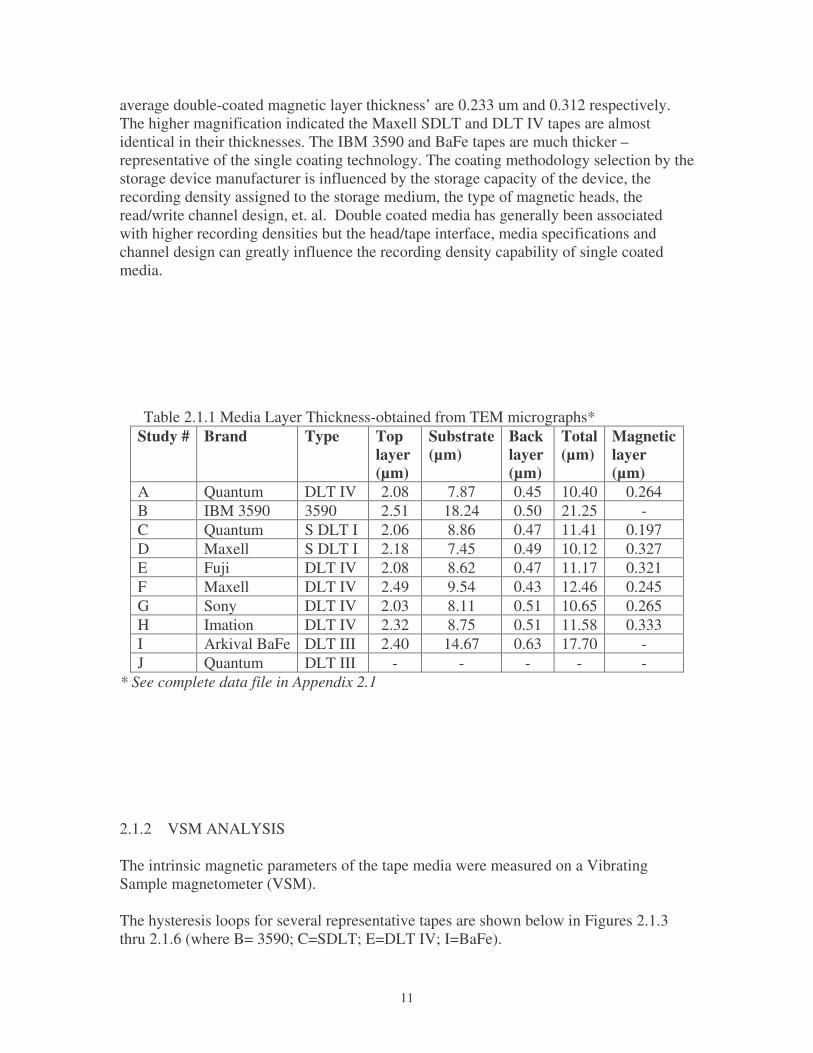
average double-coated magnetic layer thickness’ are 0.233 um and 0.312 respectively.The higher magnification indicated the Maxell SDLT and DLT IV tapes are almostidentical in their thicknesses. The IBM 3590 and BaFe tapes are much thicker –representative of the single coating technology. The coating methodology selection by thestorage device manufacturer is influenced by the storage capacity of the device, therecording density assigned to the storage medium, the type of magnetic heads, theread/write channel design, et. al. Double coated media has generally been associatedwith higher recording densities but the head/tape interface, media specifications andchannel design can greatly influence the recording density capability of single coatedmedia.
Table 2.1.1 Media Layer Thickness-obtained from TEM micrographs*Study # Brand Type Top
layer(µm)
Substrate(µm)
Backlayer(µm)
Total(µm)
Magneticlayer(µm)
A Quantum DLT IV 2.08 7.87 0.45 10.40 0.264B IBM 3590 3590 2.51 18.24 0.50 21.25 -C Quantum S DLT I 2.06 8.86 0.47 11.41 0.197D Maxell S DLT I 2.18 7.45 0.49 10.12 0.327E Fuji DLT IV 2.08 8.62 0.47 11.17 0.321F Maxell DLT IV 2.49 9.54 0.43 12.46 0.245G Sony DLT IV 2.03 8.11 0.51 10.65 0.265H Imation DLT IV 2.32 8.75 0.51 11.58 0.333I Arkival BaFe DLT III 2.40 14.67 0.63 17.70 -J Quantum DLT III - - - - -
* See complete data file in Appendix 2.1
2.1.2 VSM ANALYSIS
The intrinsic magnetic parameters of the tape media were measured on a VibratingSample magnetometer (VSM).
The hysteresis loops for several representative tapes are shown below in Figures 2.1.3thru 2.1.6 (where B= 3590; C=SDLT; E=DLT IV; I=BaFe).

12

13
A summary of the corresponding VSM results is shown in Table 2.1.2 below. There aretwo types of double coated tapes in the selection; one with an Is ~ 1.9 memu’s and acoercivity (Hc) of 1920 oersteds (Maxell-type); the other with ~2.4 memu’s and an 1810coercivity (Fuji-type). The IBM 3590, DLT III and the BaFe tapes represent the thickersingle coating technology and usually have higher saturation and remanence values.
Table 2.1.2 Summary of VSM Data*Study
#Brand Type Is
(memu)Ir
(memu)SQ
(Ir/Is)Hc
(Oe)SFD SQt OR
(Sql/Sqt)A Quantum DLT IV 1.96 1.56 0.79 1915 0.35 0.40 1.98B IBM 3590 18.64 15.21 0.82 1622 0.34 0.37 2.19C Quantum S DLT I 1.74 1.44 0.83 1934 0.35 0.35 2.36D Maxell S DLT I 1.96 1.64 0.84 1930 0.35 0.37 2.26E Fuji DLT IV 2.29 1.91 0.83 1811 0.34 0.37 2.25F Maxell DLT IV 1.77 1.41 0.80 1920 0.35 0.36 2.20G Sony DLT IV 2.40 1.99 0.83 1819 0.33 0.37 2.24H Imation DLT IV 2.50 2.03 0.80 1801 0.33 0.40 2.00I Arkival BaFe DLT III 9.57 7.05 0.74 1405 0.33 0.38 1.92J Quantum DLT III 19.34 15.24 0.79 1479 0.35 0.38 2.07* See complete data file in Appendix A.2.1
The TEM and VSM results determined the manufacturing sources of tape being soldunder both OEM and private label brands. It is of interest to note that neither IBM norQuantum manufactures their own media for these tape drive products. The IBM andQuantum products are produced for them by the OEM’s and sold as private labeledmedia. Both Quantum and IBM have also confirmed that the sources identified are thepresent media licensees, respectively. Also obvious from the data is that the Imation andSony DLTIV product is most likely made by Fuji under private label. The QuantumSDLT media is very similar to that being used for the Quantum DLT IV product and islikely selected DLT IV media made by Maxell. Depending upon product sourceavailability, this information will provide NARA with the capability of having alternativemedia sources for each storage device (i.e. with the exception of Super DLT media).
The five sources of OEM Tape used for the remainder of the study were:
Quantum DLT IV: Fuji, MaxellQuantum Super DLT: Maxell
IBM 3590: BASF (Emtec), Imation

14
2.2 VSM/ AGING STUDY
OBJECT: To determine the changes in the recording media resulting fromenvironmental exposure.BASIS: Observe the intrinsic magnetic parameters of the recording media thatcould/will affect the media’s ability to record, store and retrieve data.
DISCUSSIONThe intrinsic magnetic parameters have typically demonstrated their sensitivity tochanges in media performance. The effects of environmental exposure on these magneticparameters are also an important indicator of the life expectancy of the media. AVibrating Sample Magnetometer (VSM) was used to obtain Hysteresis curves for themagnetic tapes under study. The VSM parameters (Is, Ir and Hc) for each tape samplewere compared to its original after each interval of Temperature/RH exposure. Inaddition to the standard test conditions (40C/50% RH and 50C/75% RH) additional testconditions were utilized to accelerate change and induce trends. (0%; 30%; 50%; 75%;85% and 100% RH at 40, 50 and 80oC).
RESULTS
Effects of Temperature and Humidity Exposure on the Magnetic Properties.
Samples of each tape studied were environmentally conditioned for periods of time from100 hours to 3500+hours. Typical results are shown in Table 2.2.1 below for a 29 dayexposure to 80C/85%RH. Tables of similar data for other study conditions are includedin Appendix 2.2. Each tape sample had three replicates. The saturation magnetization(Is), remanent magnetization (Ir), and coercive force (Hc) were measured before andafter exposure to 80C /85% relative humidity (RH) for 29 days. The last columns showthe percent change of these parameters over this exposure period. In the case ofQuantum DLT tape, there is a 21 % loss in Is, a 21.6 % loss in Ir and only a slightchange in Hc (~3 %).
Ir and Hc are structure sensitive properties and changes in the magnetic particle as wellas oxidation can affect them. The change in Is is proportional to the amount of oxidationof the metal particles (MP) when they are converted from ferromagnetic iron to non-ferromagnetic iron oxide. Little change however, is to be expected in Hc until moretape/particle oxidation takes place. The total degree of oxidation seen in this table, asmeasured by Is, varies from 3 to 43 %. The BaFe tape was the most stable and indicatedthe least amount of change. In the case of MP-DLTIII tape, a notable loss in Hc wasobserved after 29 days.

15
TABLE 2.2.1 VSM Data 80C/ 85% RH
Changes in these magnetic properties were monitored throughout the 6 monthperiod (see the Appendix A.2.2 for complete data).
The typical behavior of Iswith environmentalexposure is represented inFigures 2.2.1 through 2.2.3for a 3590 tape. Thefigures illustrate the mediachange for three of the testenvironments(40C/50%RH;50C/75%RH and
Case: 80 C/85 % RH
Initial AFTER 29 DAYS AVG % AVG %Is Ir Hc Is Ir Hc delta Is delta Ir
Quantum DLT 1 1.717 1.439 1946 1.357 1.128 1890 -21.0 -21.6 2 1.697 1.444 damaged 3 1.647 1.4 damaged
IBM 3590 1 17.23 14.06 1628 12.42 9.861 1566 -28.3 -30.0 2 16.89 13.7 12.02 9.436 3 16.12 13.07 11.6 9.271
Quantum S DLT I 1 1.512 1.341 1983 1.197 1.026 1917 -20.3 -21.5 2 1.599 1.361 1.228 1.057 3 1.486 1.269 1.237 1.031
Fuji DLT IV 1 1.75 1.528 1861 1.463 1.289 1825 -14.8 -15.7 2 1.927 1.672 1.66 1.42 3 1.883 1.67 1.614 1.395
Arkival BaFe 1 9.051 6.75 1395 8.746 6.431 1352 -2.9 -4.0 2 9.054 6.778 8.835 6.514 3 8.802 6.6 8.553 6.382
MP DLT III- 1 17.25 13.7 1488 9.82 7.384 1273 -42.8 -45.8 2 18.26 14.52 10.44 7.835 3 17.39 13.7 10.02 7.496
Fig. 2.2.1 Is vs Exposure Time -40C/ 50% RH
17.300
17.400
17.500
17.600
17.700
17.800
17.900
18.000
18.100
18.200
0 500 1000 1500 2000 2500 3000 3500 4000
Time (hr)
Is (m
emu)
IBM 3590Poly. (IBM 3590)

16
Fig 2.2.2 Is vs Exposure Time 40C & 50 % RH
17.300
17.400
17.500
17.600
17.700
17.800
17.900
18.000
18.100
18.200
0 500 1000 1500 2000 2500 3000 3500 4000
Time (hr)
Is (m
emu)
IBM 3590Poly. (IBM 3590)
50C/85%RH). The figures all show the increasing loss of magnetization (Is) withexposure time to theirrespective environments. Acomparison of the threefigures also indicates a greaterloss of the magnetization (Is)with the more adverseenvironments.
Changes in magneticcharacteristics will bedetrimental to performanceand the most favorable tape/media is one where little or no
change takes place. Table 2.2.2 below is a summary from these findings. The observedmagnetization changes are the basis for the rating order.
Table 2.2.2 Is Change as a function of Environmental Storage*40C 50C 80C
Least change DLT-FujiIBM-BASF (Emtec)
DLT-Fuji DLT-Fuji
IBM-BASF IBM-BASFSDLT-Maxell SDLT-Maxell SDLT-Maxell
* includes all humidities testedThe DLT Fuji media exhibited the least magnetic property change over all theenvironmental conditions studied. The resulting Hc data suggests no substantive changeswithin the present study data base.
Fig. 2.2.3 Is vs Exposure Time- 50C/85% RH
16.000
16.500
17.000
17.500
18.000
18.500
0 500 1000 1500 2000 2500 3000 3500 4000
time (hr)
Is (m
emu)
IBM 3590Poly. (IBM 3590)

17
2.3 BINDER HYDROLYSIS AND LUBRICANT STUDY
OBJECT: To determine Binder Hydrolysis and Lubrication content changes in therecording media resulting from environmental exposure.BASIS: Observe the intrinsic binder chemistry and lubrication means of the recordingmedia that could/will affect the media’s ability to record, store and retrieve data.
DISCUSSIONThe long-term stability of magnetic tape is dependent upon many factors including theintegrity of the polymer binder in the magnetic recording layer. Most polymer bindersare composed of polyester polyurethanes and are prone to (hydrolytic) degradation overlong times and/or over shorter times under severe conditions. Early studies indicated thatcontrolling humidity is essential for the long-term stability of polymer binder, much moreso than controlling exposure to air (3). The hydrolysis of the polyester polyurethane binderwas implicated as a major cause of binder degradation and because polyester hydrolyzesfaster than polyurethane (4) most binder hydrolysis studies have first and foremostconsidered polyester hydrolysis.
Several literature reports specifically address binder hydrolysis in magnetic tape. Partialhydrolysis not been distinguished from exhaustive hydrolysis in the literature. Partialhydrolysis is defined here as the hydrolysis of large polyester chains into smaller polymerpieces that are still too large to be readily extracted by organic solvents. Exhaustivehydrolysis is the complete hydrolysis of polyester chains into low MW carboxylic acidand alcohol monomers that are readily extracted by organic solvents. One expects abreakdown in the physical structure (e.g., flaking, formation of sticky residue, etc.) and aloss of storage/retrieval performance in magnetic tape that has undergone partialhydrolysis. One does not expect, however, to form significant solvent extractablehydrolysis products until the binder is near the exhaustive hydrolysis stage.
Prior to this work, tape binder hydrolysis was studied in detail by NML (2) and Fuji(5) .The question of hydrolytic stability of magnetic tape binder was specifically addressed bysubjecting several different magnetic tape samples to elevated temperatures. The NMLdata was fit to a kinetic model developed to describe the level of extractable binderhydrolysis product as a function of time. The model is based on a simple first orderkinetic equation and makes a key assumption: magnetic tape lubricants are volatilecompounds that vaporize to leave no appreciable lubricant concentration on the tapes.This assumption may not be valid under the conditions of the NML study and asignificant portion of the NML solvent extracts attributed to binder hydrolysis productsmay in fact have been due to lubricant. See discussion in Appendix A.2.3.
(2) Van Bogart, T.W.C National Media Labs Techl. Rept. RE0017 (June, 1994)(3) E. F. Cuddihy, IEEE Transactions on Magnetics, volume MAG-16, 1980, p. 558-568(4) J. L. Cohen and J. J. Van Aartsen, J. Polymer. Science Symposium, volume 42, 1973, p. 1325-1338),(5) K. Hanai and Y. Kakuishi, Proceedings of the 10th NASA Goddard Conference on MassStorage Systems and Technologies in cooperation with the 19th IEEE Symposium on MassStorage Systems, U. of Maryland, April , 2002, p. 311-315

18
The data reported below, result from exposing magnetic tape samples to aging conditionsthat included elevated temperature and varying humidities. The purpose being:
-to determine the mass of solvent extractable organic compounds from the sevenmagnetic tapes as a function of time spent under different aging conditions;-to determine the molecular weight and, where possible, the molecular identity ofsolvent extractables;-to determine the lubricant loss (% weight) from each tape sample as a function oftime;-to determine, where possible, the molecular identity of the lubricants used ineach tape sample.
RESULTS
Table 2.3.2 summarizes the extraction data for each magnetic tape sample at time zero(i.e., before being subjected to aging conditions).
Table 2.3.2. Time Zero ExtractionsTape Tape
Sampleweight
(g)
Weight ofCH2Cl2
Extractables(mg)
%Extractables
Initial GC-MSextractables
(time 0)
IBM 3590-Emtec
1.015 6.0 0.6 butyl ester,trichlorobenzene
QuantumSDLT
1.003 6.0 0.6 butyl ester,cyclohexanone,trichlorobenzene
Fuji DLTIV
1.004 10.0 1.0 butyl ester, tracecyclohexanone,trichlorobenzene
MaxellDLT IV
1.001 3.0 0.3 butyl ester,cyclohexanone,trichlorobenzene
BaFe 1.005 7.0 0.7 butyl ester, tracecyclohexanone,
trichlorobenzene,other esters
MP-DLTIII
1.002 5.0 0.5 butyl ester, tracecyclohexanone,
trichlorobenzene,other esters
IBM 3590-Imation
1.004 9.0 0.9 butyl ester,trichlorobenzene

19
Gas Chromatograph-Mass Spectrometer (GC-MS) studies of the extracts reveal 2-3 major componentsin most of the tapes at time zero. These include a butylester of a long chain (fatty) acid, cyclohexanone, andtrichlorobenzene. The butyl ester is characterized by itsMS fragmentation pattern that includes a characteristicMcLafferty rearrangement fragment (m/z 56, C4H8
+) foran ester of a four carbon alcohol. Cyclohexanone isreadily identified based on its MS fragmentation pattern. It is used in the synthesis of thepolymer binder (6) and its presence in the tape samples may be unintentional.Trichlorobenzene is also identified on the basis of its MS fragmentation pattern. The MSspectrum observed is a strong match for either one of the following isomers 1,2,3- or1,2,4- or 1,3,5-trichlorobenzene and includes the molecular ion signal at m/z 180, 182 and184 due to the presence of 3 chlorine atoms, each with a 35Cl : 37C natural abundanceratio of 100 : 32.5.
The extraction of trichlorobenzene was unexpected and control experiments werecarried out to verify that the trichlorobenzene was indeed originating with the magnetictape samples. Pure methylene chloride samples (i.e., solvent blanks) from the same batchas used for the magnetic tape extractions were subjected to GC-MS analysis. These runsdid not reveal any traces of trichlorobenzene. The trichlorobenzene likely originates withthe magnetic tape samples and is not a contaminant. A search of the chemistry literaturereveals multiple industrial uses for trichlorobenzene including use as a solvent (b.p. 214oC for 1,2,4-trichlorobenzene, 218-219 oC for 1,2,3-trichlorobenzene and 208 oC for1,3,5-trichlorobenzene), a lubricant (m.p. 16 oC for 1,2,4-trichlorobenzene, 53-55 oC for1,2,3-trichlorobenzene and 63-65 oC for 1,3,5-trichlorobenzene), a lubricant additive, atermite exterminator, an agricultural intermediate, a dielectric fluid and a hydraulic fluid.No literature, however, was found in which trichlorobenzene was specifically mentionedas a lubricant for magnetic tape.
The GC-MS analysis for each tape enables direct comparisons between the tapes.The data reveal striking compositional similarities between the Quantum SDLT and theMaxell DLT IV tapes. See Table 2.3.2. They appear to be identical. The Fuji DLT IV isalso similar to the Quantum SDLT and the Maxell DLT IV tapes, but contains lesscyclohexanone. Likewise, the IBM 3590 Emtec and Imation tapes appear to be verysimilar to one another, but different from the others.
Tables 2.3.3 through 2.3.8 summarize the pertinent extraction data for eachmagnetic tape sample at temperatures ranging from 50 oC to 100 oC and % RH’s rangingfrom 30% to 100%._______________(6) K. Nakamae, K. Yamaguchi, S Asaoka, Y. Karube and Sudaryanto, Int. J. Adhesion andAdhesives, volume 16, 1996, p. 277-283)
O R
O
fatty acid ester radical cation
H
C4H8+
m/z 56
McLafferty Rearrangement of a butyl ester:

20
Table 2.3.3. Percent Extractables at 50 oC and 31% RH for Indicated Times
Tape 7.1 days 14.2 days 18.7 days 36.0 daysIBM 3590-
Emtec1.0 1.2 1.1 1.4
QuantumSDLT
2.3 2.2 2.5 2.4
Fuji DLT IV 1.9 1.8 2.2 2.5Maxell DLT
IV0.9 1.1 0.9 1.3
BaFe 1.9 2.4 2.0 2.1MP-DLT III 1.6 1.0 1.4 1.5IBM 3590-
Imation1.7 1.8 1.6 1.9
Table 2.3.4. Percent Extractables at 50 oC and 54.5% RH for Indicated Times
Tape 7.1 days 14.2 days 18.7 days 36.0 daysIBM 3590-
Emtec1.1 1.1 1.5 1.8
QuantumSDLT
2.2 2.0 2.6 2.5
Fuji DLT IV 2.1 2.2 2.4 2.8Maxell DLT
IV0.9 1.0 0.6 1.1
BaFe 2.0 2.2 2.5 2.3MP-DLT III 1.4 1.2 1.0 1.5IBM 3590-
Imation1.8 1.6 2.1 2.2
Table 2.3.5. Percent Extractables at 75 oC and 30% RH for Indicated Times
Tape 7.1 days 14.2 days 18.7 days 36.0 daysIBM 3590-
Emtec2.1 2.9 2.4 2.7
QuantumSDLT
1.3 1.5 1.4 1.6
Fuji DLT IV 2.2 2.9 2.6 2.6Maxell DLT
IV1.1 1.9 1.2 1.3
BaFe 2.0 2.2 2.3 2.5MP-DLT III 1.2 0.2 1.4 1.5IBM 3590-
Imation1.4 0.8 1.5 2.0

21
Table 2.3.6. Percent Extractables at 75 oC and 50% RH for IndicatedNumber of Days (d)
Tape 7.1 d 14.2 d 18.7 d 36.0 d 74 d 110 d 142 dIBM 3590-
Emtec2.3 2.5 2.6 2.5 2.9 2.6 1.7
QuantumSDLT
2.3 2.6 2.8 2.2 3.0 2.5 1.6
Fuji DLTIV
2.9 2.2 3.0 2.8 3.1 1.7 1.2
MaxellDLT IV
1.7 1.6 2.5 2.5 1.9 2.0 1.5
BaFe 2.1 1.5 1.7 1.9 1.5 1.4 0.9MP-DLT
III1.8 2.1 2.5 1.9 2.4 1.6 1.2
IBM 3590-Imation
1.6 1.8 2.2 1.9 2.3 1.7 1.0
Table 2.3.7. Percent Extractables at 75 oC and 75% RH for IndicatedNumber of Days (d)
Tape 7.1 d 14.2 d 18.7 d 36.0 d 74 d 110 d 142 dIBM 3590-
Emtec2.5 2.9 2.8 3.2 2.6 1.9 1.2
QuantumSDLT
2.1 2.6 2.9 3.0 2.2 1.4 1.1
Fuji DLTIV
2.7 2.2 2.8 3.3 1.9 1.9 0.9
MaxellDLT IV
1.5 1.7 1.9 2.1 1.5 1.6 1.2
BaFe 1.6 1.6 2.2 2.4 1.7 1.7 0.9MP-DLT
III2.0 2.5 2.3 2.7 1.2 1.6 1.3
IBM 3590-Imation
1.5 2.2 2.1 2.4 1.9 1.5 1.0

22
Fig. 2.3.1 Percent Extrables vs Exposure Time 75C & 75% RH
0
0.5
1
1.5
2
2.5
3
3.5
7 14 19 36 74 110 142
Time (days)
Per
cent
(%)
IBM 3590-Emtec
Quantum SDLT
Fuji DLT IV
Maxell DLT IV
BaFe
MP-DLT III
IBM 3590-Imation
Table 2.3.8. Percent Extractables at 100 oC and 100% RH for IndicatedNumber of Days (d)
Tape 2.2 d 4.4 d 7.1 d 9.5 d 11.3 d 14.4 d 16.2 dIBM 3590-
Emtec1.0 1.2 1.0 0.8 1.2 2.5 1.9
QuantumSDLT
2.2 2.1 1.2 1.8 2.0 3.5 3.3
Fuji DLTIV
1.5 1.8 2.8 2.0 2.4 2.4 2.8
MaxellDLT IV
1.5 1.1 0.3 1.0 1.6 3.2 2.4
BaFe 2.2 2.2 1.3 2.2 2.2 2.5 2.8MP-DLT
III1.4 0.9 1.4 1.9 1.9 1.1 0.8
IBM 3590-Imation
1.0 1.4 1.4 0.5 0.8 1.5 2.2
Most of the extraction data suggest very modest increases in percent extractablesover time. For the samples held at 75 oC, this increase in % extractables is followed bymodest decreases at extended times. The trend is especially noticeable in the 75 oCsamples held at 50% (Table 2.3.6) and 75% (Table 2.3.7) relative humidities- also seeFigure 2.3.1.
The initial rise in percentextractables is consistent with a slowdecomposition of the tape structure whichreleases lubricant and other additives forextraction. The slow decline that followsis consistent with the slow evaporation ofvolatile additives like cyclohexanone incombination with the slow hydrolysis ofester based lubricants to form non-volatilefatty acids and volatile alcohols.
The data for the samples held at 50oC do not show the same trend toward amaximum at intermittent times followed by
a slow decrease. Much longer aging times (probably on the order of months) wouldlikely be needed to achieve a

23
maximum % extractables for the 50 oC samples. Overall, the extraction data arequalitatively and quantitatively (wt % extracted) similar to that reported in the NMLstudy. Unlike the NML study, however, our extracts were subjected to GC-MS analyses.The GC-MS data reveal relatively minor changes in the compositions of the extracts overtime. Even for the samples subjected to 100 oC and 100% RH, the GC-MS data largelyreveal the same set of molecules as seen at time zero. Some changes monitored by GC-MS over time include the loss of volatile cyclohexanone (b.p. 155 oC) at all temperaturestested for those samples that contained it (Quantum SDLT, Fuji DLT IV, Maxell DLTIV, BaFe, MP-DLT III). Other changes include the slow depletion of the butyl estersignal at 75 oC and 100 oC, most likely due to hydrolysis. The butyl ester shouldhydrolyze to the corresponding fatty acid and butanol, neither of which is detected.Butanol (b.p. 118 oC) would evaporate as it is formed and the fatty acid may not besoluble in methylene chloride and/or it may further degrade. Trichlorobenzene, presentin all of the tape samples at time zero, continues to be detected even after long durationsat 75 oC and 100 oC. All seven tape samples showed remarkable resilience to exhaustivehydrolysis, even under the most severe conditions tested. The magnetic tape samples didnot visibly change at 50 or 75 oC, even after prolonged heating at high humidity. Underthe most severe conditions tested (100 oC, 100% RH), the tapes showed signs of physicalbreakdown, but even then the degradation was not accompanied by exhaustive binderhydrolysis.
The tapes subjected to the most severe aging conditions showed significant signs ofphysical breakdown. All 7 samples show visible signs of severe degradation afterapproximately 5 days at 100 oC and 100% RH. Specifically, the tapes became stiff andbrittle with small particle flakes falling off of the substrate backing. The MP-DLT IIItape degraded the fastest under these severe conditions. In addition to becoming brittleand flaky, MP-DLT III tape released rust colored particles during the decomposition.The Quantum SDLT and Maxell DLT IV tapes were amongst the slowest to show visualsigns of degradation, although these too degraded eventually.

24
2.4 PHYSICAL PROPERTIES
OBJECT: To determine the physical and electrical changes in the recording mediaresulting from environmental exposure.BASIS: Observe both the electrical resistivity and dynamic friction of the recordingmedia that could/will affect the media’s ability to record, store and retrieve data.
1.4.1 Resistivity
DISCUSSIONThe resistivity specification has importance due to the static charge buildup that occursfrom high speed tape motion and the stationary read/write head. Static discharge isdetrimental to the recording media and read circuitry and will affect the reliability ofmagnetic recording and playback. Suitable binder additives and a carbon-based back-layer are employed to contain the resistivity to acceptable limits set by the manufacturers.
The resistivity tests employed the methods described in the ISO/ECMA specifications forthese storage products. It was determined however that the ISO/ECMA voltage specifiedfor the IBM 3590 product (500V) generates sufficient conductive heating to distort thetest tapes and invalidate subsequent resistivity readings. Lower voltages were required forthe test as well as low current measuring equipment.
RESULTS
The initial resistance (R) values for the study tapes are shown in Table 2.4.1. Theresistance values of the magnetic surface(MAG) range in value from ~2 (3590 &DLT) to >300 (DLTIII)MegOhms/square. The conductivesurfaces (BACK) are typically 11 to 12MegOhms/square (except for DLT-Fujiand the 3590 BASF). These values areconsistent with the requirements ofECMA 278, 286 and 320 specifications.which calls for a magnetic side R > 1 anda back side <100. There wasconsiderable variation observed with the3590 BASF measurements whencompared to the other tapes.
The tabulated effects of environmental exposure on the tape resistivities are included inAppendix 2.4. The data collected represents resistivity changes for both the magnetic andconductive sides of the tape media over a period of 125 days. Several representative timeof exposure curves for all tapes samples are shown in Figures 2.4.1 thru 2.4.3. The
Table 2.4.1 RESISTANCE TABLE AVE R/SQ STD DEV
(megohm/sq) Tape/Type Initial side Initial side
MAG BACK MAG BACK
3590 Imation 11 11 2.3 0.53590 BASF 2 1 416 272SDLT 25 11 0.2 0.1DLT-Fuji 2 1 3.6 0.0Arkival BaFe 123 12 2.3 0.5MP-DLT III 308 12 0.9 0.1

25
Fig. 2.4.1 Resistivity MAG SIDE 40C/30% RH
0.0
50.0
100.0
150.0
200.0
250.0
300.0
350.0
400.0
450.0
0 21 43 63 96 125
Sorage Time (Days)
MO
hm/s
quar
e
3590 Im
3590 BASF
SDLT
DLT Fuji
BaFe
MP-DLT III
Fig 2.4.2 Resistivity MAG SIDE 50C/85% RH
-100.0
100.0
300.0
500.0
0 21 43 63 96 125
Storage Time (days)
MO
hm/s
quar
e
3590 Im
3590 BASF
SDLT
DLT Fuji
BaFe
MP-DLT IIIFig. 2.4.3 Resistivity BACK SIDE 40C/35%RH
0.0
200.0
400.0
600.0
800.0
1000.0
0 21 43 63 96 125
Storage Time (Days)
MO
hm/s
quar
e
3590 Im
3590 BASF
SDLT
DLT Fuji
BaFe
MP-DLT III
40C/30% RH MAG side exposure can be compared to the most extreme condition of50C/85%RH in Figures 2.4.1 and 2.4.2. Figure 2.4.3 shows the time exposure curves forthe BACK side at 40C/35% RH. The extent of 3590 tape resistivity changes can bereadily observed in the figures.
Several tapes resistances exhibited considerable changes in resistivity but there appears tobe no uniform discernable trend with temperatureor humidity. The changing values of resistivitywith exposure (see Appendix 2.4) are all withintheir specification limits so none of the tapes wereeliminated for being out of specification. Themechanism by which these resistivity changesoccur reflect some chemical or physical instabilityin these tapes. It is preferable that little or nochange in resistivity occur with environmentalexposure. Tapes were ranked therefore with regardto the degree of resistive change on exposure to these environments.
The SDLT (DLT-Maxell) was the most stable onboth sides while both 3590 tapes were the mostunstable on both sides. See Table 2.4.3.
In
summary, resistive changes wereobserved with environmental exposure.None of the tapes studied exceeded theresistivity specifications and the mostfavorable tapes were determined bydemonstrating the least amount of changeto the test environments.

26
1.4.2 FRICTION
DISCUSSION
The friction specification has importance relating to the high speed tape motion and thestationary read/write head. High friction coefficients will affect the tape motion over thehead and the corresponding quality of the data both in a record and playback mode. Alsoof concern are localized high-friction areas on the tape surface where the high speedtape/head interface will cause discrete and instantaneous heating. Local temperatures atthese disparities can exceed the curie point of the magnetic materials and cause datalosses. High friction is detrimental to the recording media and heads and will affect thereliability of magnetic recording and playback. Binder additives are employed to deliverlubrication through the useful life of the tape. Tape Friction coefficients should becontained to limits set by the manufacturer.
RESULTS
The values of the initial coefficient of friction are shown in Table 2.4.2. The averagevalues are shown for the samples used in the test as well as their standard deviations. Thedata indicates the tests were quite repeatable and consistent. The values of friction
coefficient ranged from a low of 0.34 for3590 (Imation) to a high of 0.54 for the3590 (BASF).
The ISO/ECMA specification requires thattapes must have a coefficient of frictiongreater than 0.28. All of the test tapes wereoriginally within the specification. Thechanges in friction as a function of relativehumidity and temperature exposure areincluded in Appendix 2.4.2. Apparent is thefact that all of the tapes were within thespecification even after environmental
exposure for 105 days. Most changes observed are small and within the measurementaccuracy. Several tapes showed a slight increase of about 0.1 in friction coefficient.
Table 2.4.2 Coefficient of Friction
INITIAL COEFFICIENT OF FRICTION(ECMA 278 test method)
AVE* STDEV3590-Imation 0.34 0.02SDLT-Maxell 0.43 0.04DLT-Fuji 0.46 0.043590-BASF(Emtec) 0.54 0.05MP-DLT III 0.53 0.04BaFe-Arkival 0.41 0.04
*averaged over 16 measurements for each tape

27
Fig. 2.4.5 DLT Friction Coefficient vs. Time (50C/ 30,50,75,85% RH)
0.0
0.2
0.4
0.6
0.8
0 21 43 63 84 105
Time (Days)
Fric
tion
Coe
ffici
ent
30%
50%
75%
85%
Fig. 2.4.6 3590 Friction Coefficient vs. Time (50C/ 30,50,75,85% RH)
0.0
0.2
0.4
0.6
0.8
0 21 43 63 84 105
Time (Days)Fr
ictio
n C
oeffi
cien
t
30%
50%
75%
85%Fig. 2.4.7 Comparative Friction Coefficient vs Time
(50C/50% RH)
0.0
0.2
0.4
0.6
0.8
0 21 43 63 84 105
Time (Days)
Fric
tion
Coe
ffici
ent
DLT Fuji
3590 Im
SDLT
BaFe
MP-DLTIII
Tape lubricants are usually organic ester/acids which can react with water or air. Theresults do not indicate any notable changein friction coefficient with environmentalexposure and any lubricant reaction or losswould likely be replenished from within thebinder. Depletion of all available lubricantin the binder would take longer than theexposure times of this study. Figures 2.4.5and 2.4.6 are representative friction trenddata with time of exposure for four differenthumidities.Most of thedata showslittle changein the
friction coefficient for the test conditions of the study.
Figure 2.4.7compares thechanges infrictioncoefficient forall the tapes in the study at one condition.
Long term changes in resistivity and frictioncould be detrimental to performance for thereasons discussed above. The most favorabletape/ media is one where little or no change
takes place. On this basis, the following Table 2.4.3 is a summary of the findings.
Table 2.4.3 RANKING OF CHANGE
Resistance Magnetic side Conductive sideleast change SDLT/DLT -Maxell SDLT/DLT –Maxell
DLT -FujiFrictionleast change SDLT/DLT-Maxell &
Fuji

28
2.5 RF AMPLITUDE RESPONSE
OBJECT: To determine recording property changes in the media resulting fromenvironmental exposure.BASIS: Observe radio frequency (RF) signal strength of the recording media thatcould/will affect the media’s ability to record, store and retrieve data.
DISCUSSIONTape Storage devices record data using different bit densities. It is not uncommon to havea single tape contain data written at three different bit densities (See Appendix 2.5). Thesebit densities (bits/unit tape length) relate to specific recording frequencies (RF). Theplayback signal strength (dB) of these individual frequencies is an important part of theread channel functionality in the Storage Device. OEM’s establish a minimum signalstrength specification to assure reliable data recovery. Losses in tape signal strengthresulting from environmental conditions can adversely affect data integrity and may be aresult of many factors, including physical and magnetic changes. Tape drives use severalelectronic compensation means to accommodate for such changes but they are limited inrange and extent.
Tape width changes, for example occur with the environment. The use of embeddedlinear control-tracktechnology (servo tracks)provides for accurate tapeposition tracking of the datacontained in the adjacentdata tracks. In addition,storage devices employing“Partial Response MostLikelihood” (PRML)technology make fewerdemands on the signalstrength and signal-to-noise(S/N) ratios of the media.The digital complexity ofthese newer tape driveproducts does not providefor RF recording orplayback measurements.The Quantum DLT 8000
tape drive was the only storage device that had the capability of utilizing single frequencydata in its commercial configuration. A comparison of media for this study required abroader-based test. To this end an alternative testing means was used that embodied thelinear control tracks in a video recorder similar to the embedded servo tracking used inthese storage devices*._________________* Servo tracking and Partial Response technology have been employed in video recordingdevices for almost two decades.
Table 2.5.1 RF Amplitudes (ave.) All Storage Media- dBRF AMPLITUDE
freq (Mhz) 2.5 5.0 7.5 10.0SDLT 37.4 36.6 25.6 0DLT IV (Y) 36.0 31.0 23.2 0DLT III 34.4 33.4 7.8 03590 (R) 37.2 39.4 11.6 03590 (Br) 38.2 41.6 26.4 0BaFe 35.2 35.2 9.6 0
STDEV CHARTfreq (Mhz) 2.5 5.0 7.5 10.0
SDLT 1.0 0.5 1.4 0.0DLT IV (Y) 1.9 1.8 12.6 0.0DLT III 2.1 5.9 10.0 0.03590 (R) 1.7 1.7 14.2 0.03590 (Br) 0.4 0.5 1.0 0.0BaFe 2.0 2.3 11.8 0.0

29
This approach employed a high bandwidth professional VCR adapted for the test. Thetwo aspects of this study were the RF signal performance with time exposure tothe test environments and the corresponding change in error performance. See discussionof the test setup in Appendix. 2.5.
RESULTS
Table 2.5.1 above shows the relative signal strength of the different tape media as afunction of frequency (frequency response). The higher frequency output from the doublecoated tapes (SDLT, DLT) compared to the single coated tapes (3590-R, DLTIII ) can beobserved (with the exception of the 3590 Br). The signal levels at the 10 Mhz frequencywere insufficient to report reliable data and change. See Appendix 2.5 to relatefrequencies to bit densities.
The frequency response of each tape sample is compared to its original after each intervalof Temperature/RH exposure. In addition to the standard test conditions (40C/50% RHand 50C/75% RH) an additional extreme condition (50C/85% RH) was used to acceleratechange. The data, corresponding graphs, averages and standard deviations are included inAppendix 2.5.
A summary of RFamplitude changes isshown in Table 2.5.2.The amplitudechange(s) beingreported occurredduring theenvironmentalexposure period of~120 days. Theamplitude differences(e.g. dB at start of testless dB at end of test)are reported as afunction of frequency.
Included in the Tableare the standarddeviations resultingfrom the individual
Table 2.5.2 RF Amplitude Change (dB) - 4 monthsEnvironmental Storage
40'/50%Freq
(Mhz) 2.5 5.0 7.5 10.0SDLT 2.5 3.0 3.0 0.0DLT IV Fuji 3.5 4.5 3.0 0.0MP-DLT III -20.0 -30.5 -7.5 0.03590 BASF 3.0 2.0 14.5 0.03590 Imation 0.0 1.0 1.0 0.0BaFe 2.0 2.0 0.0 0.0
50'/75%Freq(Mhz) 2.5 5.0 7.5 10.0
SDLT 2.0 1.5 1.5 0.0DLT IV Fuji 1.5 4.5 14.5 0.0MP-DLT III -33.5 -35.5 -12.0 0.03590 BASF 0.5 1.5 26.5 0.03590 Imation -4.0 -6.5 -13.5 0.0BaFe -1.0 4.5 -12.0 0.0
50'/85%Freq(Mhz) 2.5 5.0 7.5 10.0
SDLT 0.0 2.0 4.0 0.0DLT IV Y 0.0 6.0 -9.0 0.0DLT III -34.0 -35.0 0.0 0.0
3590 R 1.0 1.0 -4.0 0.03590 Br 0.0 0.0 1.0 0.0BaFe 1.0 4.0 2.0 0.0

30
Fig. 2.5.1 MP DLTIII RF vs Environmental Exposure 50C/75%RH
0
10
20
30
40
50
2.5 5.0 7.5 10.0 12.5
Frequency (Mhz)
Am
plitu
de (d
B)
Start
25 days
46 days
73 days
96 days
117 days
media tested at the same measurement frequencies. Greater variation exists with the highfrequency measurement and is reflected in the standard deviations. Several observationscan be made from the resulting data. There appears to be a general trend of higherfrequency signal losses (> 7.5 Mhz) resulting from the higher temperature/humidityexposure. The DLT III media was the most sensitive to the environmental tests and itsdegradation consistency was observed throughout all three conditions studied. See Figure2.5.1. In this data the frequency response of the tape is observed to be diminishing withexposure time. Behavior of this type will result in data loss. Although not a designatedtape for this evaluation, the MP-DLT III tape was most affected by the storage
environment. In general, the newer, higherdensity media (DLT, SDLT) experienced lesschange with environmental exposure.
Throughout all test environments, the SDLTmedia (Maxell DLT) was the most stablealong with the BaFe tape control tape.

31
2.6 ERROR STUDY
OBJECT: To determine the error profile changes in the recording media resultingfrom environmental exposure.BASIS: Observe all pertinent and available error data of each storage system and itsrecording media that could/will affect the media’s ability to record, store and retrievedata.
DISCUSSION
The most critical aspect of this study was the investigation of the tape/drive errorperformance. It is in the study of errors that all magnetic, electrical and physical elementsof tape media interact with one another. The effects of magnetic saturation loss, RF signallosses, binder hydrolysis, resistance and friction changes all manifest themselves as errorsand the eventual loss of data when situations prevail such that error correction is noteffective. The fact that media errors occur with time and/or environmental exposure is nota new or unexpected result. The issue was however the extent of the error change and theability of the storage systems to correct, compensate and deliver accurate data. It was theintent of this aspect of the study to observe pertinent error information, report changesand to determine the life expectancy of the media and the storage system as they interact.
Basic to the study were correctable (corrected) errors and uncorrectable (uncorrected)errors- see Glossary. Error information of this type is indirectly available from theSmall Computer Systems Interface (SCSI) bus system which was common to all threestorage devices. This SCSI error information was the basis for determining mediaquality, media changes and life expectancy.
Significant to this study was the need for a common denominator to compare differentmedia and observe error rates and changes. The error rate (B*ER) definition proved tobe a meaningful measure of change and compatible with all three storage systems.Appropriate SCSI errors were recorded between periods of environmental exposuresuch that changes could be observed and life expectancy (LE) predicted. In additionto error profiling, other parameters such as read retries, tape test time and tape lengthusage also proved helpful in evaluating media quality and the effects ofenvironmental storage.
The media testing requirement for the study made good use of Arkival’s proprietary testsoftware for error data acquisition. This test software was adapted to all three storagesystems and used specific SCSI errors in a convenient report format for reporting mediaquality and error changes.

32
RESULTS
The Arkival software was used to report tape errors during the initial write process andall subsequent reads. The data written was random and block length defined to inducetape streaming for all products tested.
The following tape quality comparison was based upon first usage tape errors. Importantparameters monitored during the write process were write correctable block errors,retries, non-correctable block errors and the error rate (B*ER- defined as the ratio ofdefective blocks reported to number of bytes read or written). See discussion in Appendix2.6. Similarly during reads, the parameters were read correctable block errors, retries,non-correctable block errors and the read error rate (B*ER).
The following tables summarize the findings for the IBM 3590, Quantum DLT andSDLT products. The number of cartridges tested for each media type is approximately thesame and comprised of different lots from each tape manufacturer. Differences in errorrates have been seen observed in lot-to-lot sampling. Averages for all the lots arepresented in Tables 2.6.1 and 2.6.2. The actual data can be found in Appendix 2.6 asExcel workbooks by Storage media type.
Table 2.6.1 First WRITE performance
n/a – not available and reported as correctable errors.
Drive/Media Lots BlockCount
Retries CorrectableErrors
RawWriteErrors
Non-Correctable
Errors
Write Count WRITEB*ERx10^9
IBM 3590-BASF
2 141706 1148 1148 n/a 0 9069178 127
IBM 3590-IMATION
3 143224 1739 1739 n/a 1 9166316 191
QuantumDLT IV-Maxell
2 613918 0 0 4508 0 47693451522 95
QuantumDLT IV-
Fuji
4 613481 9 9 7080 0 47436066442 149
QuantumSDLT-Maxell
5 1740702
750 750 83765 0 143353181360 587

33
Table 2.6.2 First READ performance
Drive/Media Lots BlockCount
Retries CorrectableBlockErrors
RawReadBlockErrors
Non-Correctable
BlockErrors
Read Count(bytes)
READB*ERx10^9
IBM 3590-BASF
2 141799 995 995 n/a 0 8933279 111
IBM 3590-IMATION
3 142372 1231 1231 n/a 0 8969408 138
QuantumDLT IV-Maxell
2 613528 0 0 162 0 48410151360 3
QuantumDLT IV-
Fuji
4 613410 0 0 15 0 48721026728 0.3
QuantumSDLT-Maxell
5 1740636 0 0 1814 0 141190454400 13
n/a – not available and reported as correctable errors0
The IBM 3590 reports correctable errors (blocks) as such but the Quantum DLT andSDLT report correctable errors (blocks) as Raw errors. An explanation of the tablefields is included in the Glossary and discussed in Appendix 2.6. The number ofcorrectable block errors and retries is lower in the Quantum products and indicativeof either more efficient error correction, better media or a difference in the basis forthe manufacturer’s SCSI error report. The B*ER is also lower in the Quantumproducts. This is particularly of interest because of the higher storage capacity of theQuantum media.
Effects of Environmental exposure and Multiple Uses
Multiple Tape Use Observations and Effects (Room Temperature (RT) Storage)
This study employed the use of control tapes to monitor the Room Temperature/RHerror performance of the media. The ambient room environment was typically 21oC/50% RH . Control Tapes were stored on open library shelves as accessible cassetteswithout their protective shipping/storage jackets.
Control tapes were tested before and after the environmentally exposed tapes. Theerror performance and functionality of the control tapes gave added reliabilityinformation as to the performance of the test drives; particularly on the days andtimes the drives were used to test for and evaluate environmental media changes. Thecontrol tapes also provided an error performance history for tapes stored at room

34
Fig. 2.6.1 SDLT- Control Tape Behavior and Drive to Drive Variability
0
250
500
1/25
/200
2
2/25
/200
2
3/25
/200
2
4/25
/200
2
5/25
/200
2
6/25
/200
2
7/25
/200
2
Test Dates
B*E
R x
10^9
2ndary
Primary
temperature/RH environments. An observation of control tape performance was notedon the basis of a greater frequency of testing. Many tapes exhibited a parabolic-typeerror behavior; demonstrating a higher error rate during their early use, diminishing inerror rate and stabilizing for a period of time thereafter and then exhibiting an errorrate increase with continuing use. A higher B*ER was observed for the first time tapeuse of all three tape-types but the magnitude of the B*ER was a lot dependentvariable. The parabolic-type error behavior effect was observed on both the primary
and secondary test drives and was not related toa tape brand or drive type.Figure 2.6.1 shows the control tapeperformance of the SDLT product on both aprimary and secondary drive. Typical of allcontrol tapes in the study, general trendsobserved were repeatable and resulting fromthe media. It is likely that much of the higherB*ER seen in the early usage period has to dowith the tape burnishing process performed bythe media manufacturer(s). The B*ER increasesobserved after the stable period wereconsiderably lower than the error rates
observed in tapes undergoing environmental exposure and change.
EFFECTS OF ENVIRONMENTAL EXPOSURE
The three test environments produced results that were somewhat predictable suchthat higher temperatures and humidities generate higher error rates. In every mediatype observed humidity was a greater factor than temperature.
The effects of environmental storage
Data tables in Appendix 2.6 contain data points, standard deviations and the basis forthe graphs discussed here. During the course of the study there were losses of datadue to a variety of reasons and the utilization of five (5) test tapes for each conditionproved advantageous to obtain the following results and conclusions. In almost allcases reported a single drive was the basis for data comparisons. In the case of the50oC/ 85% RH storage environment, a contamination issue delayed the study andfewer data points are reported for that environment.
Another item of note is the occasional and abnormally high B*ER’s observed inalmost all the media tested in accelerated environments. Observation of the controltape performance at that point in time suggested a definite environmentally forcedtape error condition. Continued use of tapes containing such anomalies did, in mostcases demonstrate their return to the average group behavior. Environmentally-induced error effects do occur and the subsequent use of the tape burnished orminimized the defect such that normal ECC was applied successfully. Root causeanalysis was not possible and beyond the scope of this work. What is of importance is

35
Fig. 2.6.5 3590 50C/ 75%RHBrand-to-Brand Differences
0.0
50.0
100.0
150.0
200.0
250.0
1 2 3 4 5 6
Time-Months
BE
R x
10^9
R-50C/75%RH
50C/75%RH
Fig. 2.6.2 COMPARING MEDIA TYPES 40C/ 50% RH
0.0
50.0
100.0
150.0
200.0
250.0
1 2 3 4 5 6
TIME- MONTHS
B*E
R x
10̂9
DLT (Y)
SDLT (G)
3590 (R)Fig. 2.6.3 COMPARING MEDIA TYPES
50C/ 75% RH
0.0
50.0
100.0
150.0
200.0
250.0
1 2 3 4 5 6
TIME-MONTHSB
*ER
x10
^9 DLT (Y)
SDLT (G)
3590 (R)
Fig. 2.6.4 COMPARING MEDIA TYPES 50C/ 85% RH
0.0
50.0
100.0
150.0
200.0
250.0
1 2 3 4
TIME-MONTHS
B*E
R x
10^9 DLT (Y)
SDLT (G)
3590 (R)
that in most cases, data was recoverable. Also see Catastrophic Tape and DriveFailures-Section 2.6.1.
The following data shows the effects of environmental storage on the B*ER over theexposure time. Figures 2.6.2, 2.6.3 and 2.6.4 show the effect of the 40oC / 50% RH,
50oC / 75% RH and 50oC / 85% RH environmentalstorage for the DLT, SDLT and 3590. The lower B*ERrates were evident in the SDLT and DLT products. The3590 B*ER was about twice that of the DLT andSDLT. Most media tested showed continuing increasesin the B*ER withexposure time;indicating a continuingdegradation with useand exposure to theenvironment. These
data also illustrate the similarity in behavior of both theDLT and SDLT products.
.
Figure 2.6.5 shows the effect of the 50oC / 75% RH environmental storage for twodifferent 3590 tapes. The two data setsrepresent two supply sources and resultsdiffered. Both DLT suppliers howeverexhibited similar behavior in this environment.

36
Fig. 2.6.6 3590 All Storage Conditions
0.0
50.0
100.0
150.0
200.0
250.0
1 2 3 4 5 6
Time-Months
B*E
R x
10^9 40C/50%RH
50C/75%RH
50C/85%RH
Fig. 2.6.8 SDLT All Storage Conditions
0.0
50.0
100.0
150.0
200.0
250.0
Start 1 2 3 4 5
Months
B*E
R x
10^9 40C/50%RH
50C/75%RH
50C/85%RH
Fig. 2.6.7 DLT ALL Storage Conditions
0.0
50.0
100.0
150.0
200.0
250.0
Start 1 2 3 4 5
Months-Time
B*E
R x
10^9 40C/50
50C/75
50C/85
Another perspective on the data analysis was observing the storage media at alltemperature and humidity conditions. This analysis is shown in Figures 2.6.6, 2.6.7and 2.6.8. In this case a representative tape was selected for each Storage Device-type: BASF (Emtec) for the 3590, Fuji for the DLT and Maxell for the SDLT. Inalmost every media case reported, independent of the Storage Device-type, the mediachanges (B*ER) increased the increasing temperature/ humidity storage. The highertemperature/humdities demonstrated a greater number of (absolute)errors and highererror rates (B*ER). (note: There was no forced air circulation in the 50C/85%container and this lack of air movement in the storage environment may have hadsome influence on the test resllts)
In all testing to date the typical tape degradationobserved has been within the limits and errorcorrection capabilities of the drive products beingtested except when catastrophic failure occurred.
NON-correctable errors
Error recovery definitionshave changed the meaningof Non-correctable errors:during the first write andread operations, certain tapes exhibited non-correctableerrors. In the data tables included in Appendix 2.6 theoccurrences of non-correctable errors have beenhighlighted for convenient viewing. On a write pass theoccurrence of an non-correctable error causes the data tobe written at another location on the tape until the data is
written without error. On a read pass, the non-correctable error is considered “hard”only if it fails after the multiple read retry procedure. Non-correctable errors duringread operations cause catastrophic tape failure. The occurrence of non-correctableerrors at any time in the cartridge life is problematical and likely to make datarecovery difficult at some point in the future. There was a greater frequency of non-correctable error occurrence in 3590 cartridgesthan DLT’s. Certain SDLT lots did exhibit a highfrequency of non-correctable errors also.
2.6.1 Catastrophic Tape and Drive Failures
During the study, media for both the IBM 3590 andthe Quantum SDLT experienced catastrophic tapefailure. SDLT tape failures were experienced duringfirst write operations evidencing media defect

37
conditions that caused hard failures. Media defects of this type are tolerable to a degreeand will likely be found and the tape cassette eliminated at incoming inspection.
The more common failure mode however occurs when the tape is being read and datarecovered. Failures of this type allow useable reads of the non-failing portion of the tapeuntil the failure point is reached (some place in its length). The tape generates a hardfailure condition and all remaining data is lost. Observed failures of this type resultedfrom tapes stored in environments designed to accelerate media failures. The totaldependence on error correcting electronics can obviously result in data loss. Storagefacilities should utilize tape backups when and where possible. Further, because of the lotvariations observed, the backup tapes should be stored on different tape lots than thoseused for master tapes.
Some 6-7 months into the study both an IBM 3590 and a Quantum SDLT tape drivefailed to perform read operations. Both drives failed within a week of one another andrequired field engineering support. The Quantum drives, because of their smaller size andweight were easily returnable for factory repair.

38
2.7 LIFE EXPECTANCIES
Two methods of projecting Life Expectancy (LE) follow. First, a LEprojection based upon changes in the intrinsic magnetic parameters of thetapes. Second, a LE based upon the changes in tape error rates as observed intape drives.
2.7.1 Life expectancy (LE) on the basis of magnetic parameter change ONLY
OBJECT: To determine the life expectancies of the magnetic tapes based uponcorrosion and subsequent changes in their intrinsic magnetic parameters.BASIS: Observe the intrinsic magnetic parameter changes with environmentalexposure. Determine a suitable end of life criteria that would be detrimental toperformance such that the reliability of stored data is in question. Project the lifeexpectancy of these tapes with the use of the actual data collected for magnetic lossand suitable mathematical models. Specifically, the object was to determine the timeof storage in a given environment for tapes to reach their end-of-life criteria.
DISCUSSION:Changes in the magnetic properties of tapes resulting from environmental exposure areattributed primarily to the chemical changes(corrosion) of the magnetic metal particlescontained within. H2O and/or O2 must come in contact with the unoxidized metal forthese metal particles to corrode. This happens by diffusion through the two layersseparating the two reactants, the polymer binder and the metal’s oxide layer. The slowestof these steps ,diffusion through the oxide layer is rate determining. The mathematicalrelationship of this change is used to find the rate constant, k, for each condition for eachtape- See discussion and details in Appendix A.2.7. The rate constant can be extrapolatedfor any reasonable temperature and humidity and thereafter, Life expectancy (LE)forecasted.
A ten percent loss of magnetism was used as an end of life (EOL) indicator (typicallosses are not necessarily uniform and defect counts do increase substantially for a tapethat looses 0.1 Is.). (7)
Two typical LE charts are included below in Figure 2.7.1 and 2.7.2. These charts showthe relative LE’s of the different media studied. LE was found to vary between years anddays depending upon the adversity of the storage environment. The complete series of LEdata for all the tapes and environmental conditions studied is included in Appendix 2.7.
(7) Djalali, A., Glatfelter, W., Judge, J.S., Seng, D. and Speliotis, D., J. Electrochem. Soc., 91, 430(1991)

39
Fig. 2.7.1 LIFE EXPECTANCIES- 50 C & 50 % RH
0.51.5 1.1 1.9
50.0
1.2
0.0
10.0
20.0
30.0
40.0
50.0
60.0
DLT IV 3590 S DLT I DLT IV DLT III
Quantum IBM Quantum Fuji Ark BaFe
LIFE
TIM
ES
(Y
R)
Figure 2.7.1. LE’s at 50C/50%RH.
Fig. 2.7.2 LIFE EXPECTANCIES - 80 C & 100 % RH
3.8 2.5 3 8.4
413
1.10
50
100
150
200
250
300
350
400
450
DLT IV 3590 S DLT I DLT IV DLT III
Quantum IBM Quantum Fuji Ark BaFe
LIFE
TIM
E (D
AY
S)
Figure 2.7.2. LE’s at 80C/100%RH. (note: y-axis units- days not years)

40
The following Table 2.7.1 summarizes Life Expectancies based upon the magneticparticle corrosion for six different environmental storage conditions.
Table 2.7.1. SUMMARY of LE’s based on Magnetic Particle Corrosion(units of years except where noted)
Temp/RH 3590Emtec
DLT IVMaxell
DLT IVFuji
SDLTMaxell
ArkivalBaFe
MP-DLT III
40C/50% 6.3 18.3 16.3 62.1 111 7.550C/75% 0.8 1.0 1.2 1.4 26 0.6
LE below (days)80C/100% 2.7 5.7 8.4 5.2 413 1.1
The data also provided a comparative LE media analysis at specific temperatures andhumidifies. One such example is Figure 2.7.3. In this Figure the LE’s of all the studytapes (without controls) are plotted for the 50C temperature and full range ofhumidities.
Fig. 2.7.3 LIFE EXPECTANCIES- 50 C vs. RH
0.00
0.50
1.00
1.50
2.00
2.50
3.00
3.50
4.00
0 10 20 30 40 50 60 70 80 90
% RH
lifet
ime
(yr)
Quantum DLT IVIBM 3590Quantum SDLTFuji DLT IVLinear (Quantum DLT IV)Linear (IBM 3590)Linear (Quantum SDLT)Linear (Fuji DLT IV)
Changes in intrinsic magnetic characteristics (e.g. saturation magnetization)will bedetrimental to performance and the most favorable tape/media is one where little orno change takes place. Although rankings are condition dependent, the DLT media(either Fuji or Maxell) exhibited the least magnetic property change among the studygroup in almost all cases and exhibited less change than the 3590 media (either Emtecor Imation).

41
2.7.2 Error Rate (B*ER) Life Expectancy (LE)
OBJECT: To determine the life expectancies of the magnetic tapes when used inconjunction with their respective Storage Systems (IBM 3590, Quantum DLT andSDLT)
BASIS: Observe the tape error changes resulting from environmental exposure anduse. Determine a measure of life expectancy or end-of-life criteria that is common toall three products being evaluated and representative of a condition such that thereliability of stored data is in question. To forecast the life expectancy of these tapeproducts based upon the actual data and suitable mathematical models (trendanalysis).
DISCUSSION:
Life ExpectanciesThis study and others before it make use of different environmental storage conditions toaccelerate media change and/or accelerate changes in media properties that are essentialto data integrity. Information derived from such changes is used for the expectation ofmedia life, or the prediction of life expectancy. In a prior study (1) the storage system’slife expectancy was based on the most vulnerable tape property; binder hydrolysis. Thetapes in this study showed little, if any signs of binder hydrolysis. Furthermore, newerstorage systems utilize many physical and electronic means to correct and compensate formedia changes as they occur. It is for this reason LE is best measured by using thosecompensation and correction means when the media is considered part of the storagesystem.
In the previously referenced NML study, an effort was dedicated to determineappropriate “end-of-life” (EOL) criteria to determine Life Expectancy (LE) values. EOLcriteria are system specific but not available from Storage System manufacturers. At best,they offer guidelines for use. This study used the drive/cartridge guidelines and systemperformance specifications as a basis for establishing EOL criteria. See discussion inAppendix 2.7.
When published, Error Rates for correctable (recoverable) error are stated in terms of bitsread, e.g. Quantum states their “Recoverable READ Error Rate as 1 in 10^6 bits read”and IBM states that “no single cartridge can have a dropout error in 1x10^7 bits. For thisstudy, EOL criteria was defined in terms of the Error rate (B*ER). Table 2.7.2 lists EOLcriteria by cartridge type, native storage capacity and B*ER maximum values.
42
Fig.2.7.3 COMPARING MEDIA TYPES 50C/ 75% RH
0
500
1 3 5 7 9 11 13 15 17 19 21 23 25
TIME-MONTHS
B*E
R x
10^9 DLT (Y)
SDLT (G)3590 (R)Linear (3590 (R))
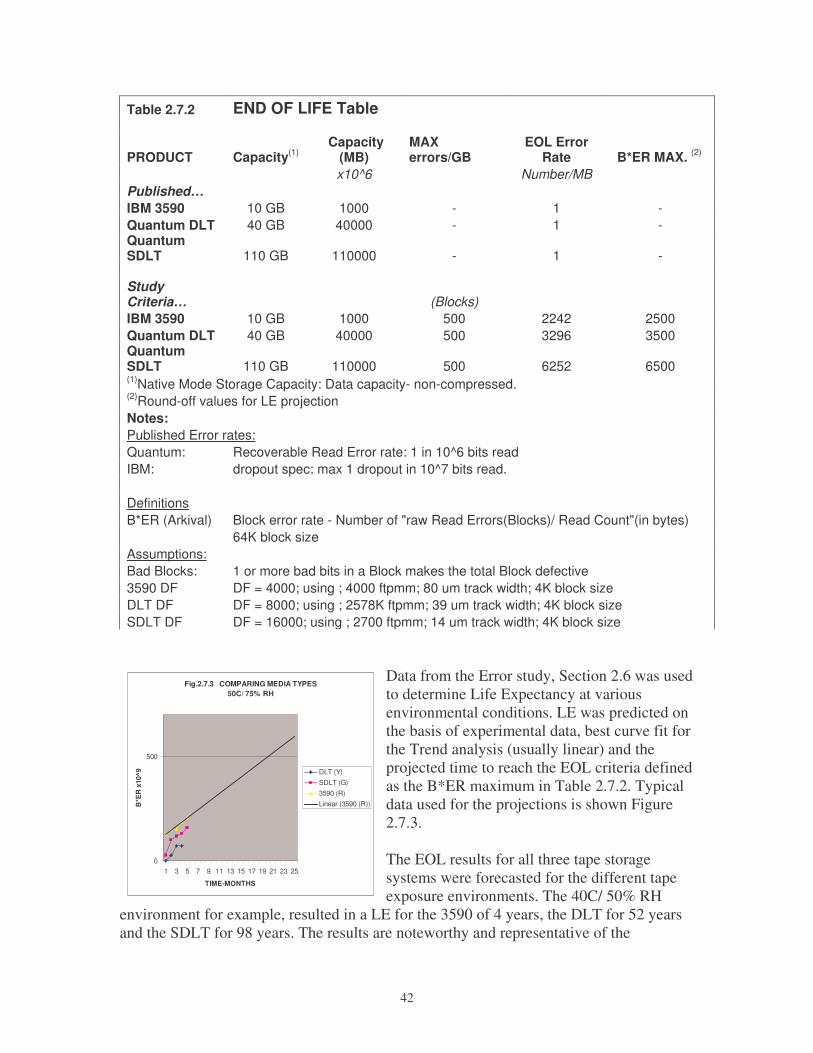
Data from the Error study, Section 2.6 was usedto determine Life Expectancy at variousenvironmental conditions. LE was predicted onthe basis of experimental data, best curve fit forthe Trend analysis (usually linear) and theprojected time to reach the EOL criteria definedas the B*ER maximum in Table 2.7.2. Typicaldata used for the projections is shown Figure2.7.3.
The EOL results for all three tape storagesystems were forecasted for the different tapeexposure environments. The 40C/ 50% RH
environment for example, resulted in a LE for the 3590 of 4 years, the DLT for 52 yearsand the SDLT for 98 years. The results are noteworthy and representative of the
Table 2.7.2 END OF LIFE Table
PRODUCT Capacity(1) Capacity
(MB)MAXerrors/GB
EOL ErrorRate B*ER MAX. (2)
x10^6 Number/MBPublished…IBM 3590 10 GB 1000 - 1 -Quantum DLT 40 GB 40000 - 1 -QuantumSDLT 110 GB 110000 - 1 -
StudyCriteria… (Blocks)IBM 3590 10 GB 1000 500 2242 2500Quantum DLT 40 GB 40000 500 3296 3500QuantumSDLT 110 GB 110000 500 6252 6500(1)Native Mode Storage Capacity: Data capacity- non-compressed.(2)Round-off values for LE projectionNotes:Published Error rates:Quantum: Recoverable Read Error rate: 1 in 10^6 bits readIBM: dropout spec: max 1 dropout in 10^7 bits read.
DefinitionsB*ER (Arkival) Block error rate - Number of "raw Read Errors(Blocks)/ Read Count"(in bytes)
64K block sizeAssumptions:Bad Blocks: 1 or more bad bits in a Block makes the total Block defective3590 DF DF = 4000; using ; 4000 ftpmm; 80 um track width; 4K block sizeDLT DF DF = 8000; using ; 2578K ftpmm; 39 um track width; 4K block sizeSDLT DF DF = 16000; using ; 2700 ftpmm; 14 um track width; 4K block size

43
significant technology advancements. Most notable is the ECC efficiency of the DLT andSDLT products.
The LE prediction itself should serve only as a general guideline with the understandingthat it predicts average trends only. An LE prediction of 100 years for a specific mediawill serve little purpose when an error condition violates the ECC capabilities of thesystem in less than a year. Section 2.6.1 describes both the catastrophic tape and drivefailures experienced during the course of this study.
A review of both the LE’s forecasted by the corrosion analysis and that of the B*ERshow a similar ranking order with the DLT and SDLT media performing best in mostenvironments. In these tape products one expects some form of media failure to occurbefore the system failure. The system employs sophisticated error correction andcompensation means to overcome changes like those forecasted in the corrosion analysis.The corrosion analysis forecast however is significant because it predicts the most likelycause of media failure that results in error generation. The generation of error clusters ismost problematic in that it increases the probability of catastrophic failure by violatingthe multiple error-per-block condition that excludes error correction and blockreplacement; causing non-correctable hard errors and making data recovery unlikely.

44

45
CONCLUSION
Two different media technologies were determined by TEM and VSM analysis. Theresults made obvious the distinction between the single and double coated tapetechnology; single coated tape for the 3590 and double coated tape for the DLT andSDLT storage systems. Neither IBM nor Quantum manufactures their own media forthese tape drive products and this analysis helped identify the manufacturers of tapemedia being sold as OEM and private label products; 3590 tapes are manufactured byBASF (Emtec) and Imation, DLT tapes are manufactured by Fuji and Maxell and SDLTby Maxell only.
The results indicated DLT media exhibited the least change in remanent magnetization atall three environmental storage conditions. All the tapes studied demonstrated a decreasein their remanent magnetization with environmental exposure time. Higher temperaturesand higher humidities increased their magnetization loss. The DLT Fuji mediademonstrated the least remanent magnetic loss for the environmental conditions studied,when compared to the 3590 and SDLT
Extractable organic compounds were identified from all tapes by GC-MS and only aminor change in the extractables was found at the higher temperature and humidityconditions (100oC and 100% RH). These extreme conditions also revealed minor changesin the compositions of the extractables over time. Significant signs of physicalbreakdown were determined at 100oC and 100% RH; the SDLT and DLT tapes wereamongst the slowest to show visual signs of decomposition, although these toodecomposed eventually.
The values of tape resistivity exhibited significant change with environmental exposurebut the changes observed were within specification limits. Tapes were ranked withrespect to the magnitude of resistive change on exposure to these test environments. TheSDLT tapes were the most stable on both magnetic and conductive sides.
Friction coefficient changes were relatively small in the three environments investigated.On the basis that friction coefficient changes will affect tape performance, the mostfavorable media was one where little or no change occurred. The results indicate theSDLT and DLT media exhibited the least change in friction coefficient.
Losses in the RF amplitude were generally observed with exposure to higher temperatureand humidity; particularly higher frequencies (>7.5 Mhz). The frequency response datameasured after each cycle of Temperature/RH exposure showed the SDLT was the moststable among the tapes of this evaluation.
The error study examined tape errors in new media and error changes in the mediaresulting from environmental exposure. Error types observed during the first write andsubsequent reads were correctable block errors, retries, non-correctable block errors andthe error rate (B*ER). The DLT-Maxell and DLT-Fuji media demonstrated lower writeand read error rates than the 3590 media during first write and read testing. All tapes

46
tested showed an increase in the number of correctable errors and error rate with highertemperatures and higher humidities. Among the study group, lower error rates wereobserved with DLT and SDLT tapes compared to the 3590 tapes. The error correctioncapability of each Storage Device type is demonstrated in the error rates reported. TheSDLT product performance was best and typically followed by the DLT and 3590.
The life expectancies of the test tapes were predicted on the basis of magnetic saturation.Although LE was found to be condition dependent, the DLT-Fuji media exhibited theleast saturation change among the tape group in almost all temperatures and humiditiesstudied (e.g. storage at 50C/ 75% RH resulted in a DLT LE of 1.2 years compared to a3590 LE of 0.76 years); the magnitude of the difference varied by environmental storagecondition. Compared to the DLT and 3590, the SDLT exhibited more variability in theLE results; perhaps due to the stress imposed by the laser burning of the servo tracks.
LE’s were also predicted on the basis of tape performance in their respective tape drives.The error-based LE was found to be condition dependent as was the saturation-based LE.The SDLT demonstrated the best LE for the tape exposure environments studiedfollowed by the DLT and the 3590 (e.g. storage at 50C/ 75% RH resulted in a DLT LE of16 years compared to a 3590 LE of 10 years). In this case the LE predictions had thebenefit of the drive error correction capability. The effectiveness of the different StorageDevice’s ECC efficiency is observed via the differences in life expectancies reported.
In every technical investigation areas reported above, the DLT and SDLT tape productdemonstrated the most environmentally stable performance and is the most favorablearchival storage medium. Tape failures and data losses however were observed with allthree storage products studied. It is critical to recognize this potential failure likelihoodand to plan for it accordingly.

47
ACKNOWLEDGEMENTS
The author recognizes the technical contributions of the following individuals
Leo Cappabianca Pat JudgeDon Dempster Prof. Glen MillerMark Garvey Jim RichardsonMike Garvey Bob SchmidtJohn Judge Ed Wiatrzyk
John Judge and Glen Miller deserve special thanks for their guidance, advice andindependent research in difficult study areas. A special note of thanks is also extended toDon Dempster for his dedication to the project and to Jim Richardson who contributed somuch in collecting and consolidating the very large data base of test results.
Appreciation is also extended to Dr.Vivek Navale, of the National Archives and RecordsAdministration for his guidance and technical advice throughout the program.

48
This page intentionally left blank

49
Glossary
ANSI. American National Standards InstituteBaFe. Barium FerriteBER. Bit Error rateB*ER. Error RateBlocks.BOT. Beginning of TapeBUER. Burst Error rate. Four or more SER’sbus. An electrical pathway that consists of an adapter card installed in a host computerand one or more SCSI devices connected with cables.CD. Compact discdB. decibelsDLT. Digital Linear Tape. A Quantum Corporation Tape Storage product.DSC. Differential scanning calorimetryECMA. European Computer Manufacturers AssociationECC. Error Correction Codeemu. electromagnetic unitsEOL. End of lifeEOT. End of TapeExtractables. Tape binders and lubricants that can be extracted with a solvent.Exhaustive Binder Hydrolysis. The complete hydrolysis of polyester chains into lowMW carboxylic acid and alcohol monomers that are readily extracted by organicsolvents.ftp. Flux changes per ___. Usually mm or inchesGC-MS. Gas Chromatography-Mass SpectrometryGPC. Gel permeation ChromatographyHc. Coercivity of a magnetic material. the magnetic field strength necessary to reduce thesamples magnetization to zero after being saturated.Hydrolysis. A chemical reaction in which water reacts with a compound to give 2 ormore products. Many hydrolysis reactions are known. Esters hydrolyze to givecarboxylic acid and alcohol products. Long chain esters, like those used as lubricants inmagnetic tape, hydrolyze to give fatty acids (long chain carboxylic acids) and alcohols.The process is very similar to saponification whereby triglycerides present in animal fatsare reacted with caustic water to produce glycerol and a fatty acid salt called soap.
Hydrolytic Stability. A measure of a tape binder’s ability to avoid hydrolysis.Hz. Hertz (cycles/second)Ir. The remanence magnetization of the sample – the magnetization remaining after thesample has been saturated and the external field is removed, i.e. reduced to zero.Is. The saturation magnetization of the sample. The highest value of magnetizationattainable for the sample.ISO. International Standards Organization

50
McLafferty Rearrangement. A common electron impact fragmentation pathway formolecules containing a C=O double bond (i.e., carbonyl compounds) and a hydrogenatom in the �-position (i.e., 4 atoms removed from the C=O double bond).
LE. Life Expectancy. The time that a storage medium is capable of successfullydelivering its pre-recorded dataMethylenedianiline. A hydrolysis product of polymers prepared from the monomermethylenebis(phenyl isocyanate). The 2002 Fuji study includes the hydrolysis of apolyester polyurethane binder prepared in part from methylenebis(phenyl isocyanate).Mhz. MegahertzMOT. Middle of TapeMP. Metal ParticleMW. Molecular weightNARA. National Archives and Records AdministrationOEM. Original Equipment ManufacturerOR. Orientation Ratio. A hysteresis loop relationship defined as SQl/SQt
Partial Binder Hydrolysis. The hydrolysis of large polyester chains into smaller, but stillrelatively large polymeric pieces that are not readily extracted by organic solvent.Phthalic Acid. A common monomer used in the formation of various polymers includingpolyesters.PRML. Partial Response Most Likelihood.RF. Radio FrequencyRH. Relative HumiditySCSI. Small Computer Systems Interface. An industry standard computer interface forconnecting SCSI devices such as tape drives, hard disk drives, etc..SDLT. Super Digital Linear Tape. A Quantum Corporation Tape Storage product.SER Symbol Error RateSFD. Switching Field Distribution. A hysteresis loop parameterS/N. signal-to-noiseSTE. Single Track ErrorSQ. Squareness. A hysteresis loop relationship defined as Ir/Is.TEM. Transmission Electron MicroscopeUBER. Uncorrected Bit Error rateVSM. Vibrating Sample Magnetometer

51
REFERENCES
(1) Weir, T.E. National Archives Technical Information Paper #4 (June, 1988)(2) Van Bogart, T.W.C National Media Labs Techl. Rept. RE0017 (June, 1994)(3) E. F. Cuddihy, IEEE Transactions on Magnetics, volume MAG-16, 1980, p. 558-568(4) J. L. Cohen and J. J. Van Aartsen, J. Polymer. Science Symposium, volume 42, 1973, p. 1325-1338),(5) K. Hanai and Y. Kakuishi, Proceedings of the 10th NASA Goddard Conference on MassStorage Systems and Technologies in cooperation with the 19th IEEE Symposium on MassStorage Systems, U. of Maryland, April , 2002, p. 311-315(6) K. Nakamae, K. Yamaguchi, S Asaoka, Y. Karube and Sudaryanto, Int. J. Adhesion andAdhesives, volume 16, 1996, p. 277-283)(7) Djalali, A., Glatfelter, W., Judge, J.S., Seng, D. and Speliotis, D., J. Electrochem. Soc., 91, 430(1991)

52

53
APPENDIX
The appendix of this study is comprised of two parts; the following written section andthe Excel work sheets included in the CD version of the report. The written Appendixsections correspond to the report sections and contain an “A.” prefix. The Excelworksheets correspondingly contain the “AE. “Prefix.
A.1.0 STUDY OVERVIEW
A.1.3 STORAGE SYSTEM & TAPE MEDIA STANDARDS
TABLE A.1.1 below is an overview of applicable features of the storage productsinvestigated in this study. Also noted are corresponding ECMA/ANSI specifications.
Table A.1.1 OVERVIEW OF RECORDING PROPERTIES
Tape Drive DLT4000 DLT7000 DLT8000 SDLT220 IBM 3590 UnitsTape Format DLT4 DLT5 DLT6 SDLT1 3590
ECMA spec # 231 259 286 320 278 -Recording Media DLT III DLT IV DLT IV SDLT 3590 -
Tape Speed 2.49 4.06 4.26 2.946 2 m/sWrite Gap Length 89 89 64 10 90 um
Write Gap Width 22 22 22 2 n/a mmRead Gap Length 89 18 18 3.7 n/a um
Read Gap Width um 43 43 39.4 14 n/a umPhysical Recording
Densities 4fn/a n/a n/a n/a 10200 ftpmm
Physical RecordingDensities 2f
2142 2254 2578 5400 n/a ftpmm
Physical RecordingDensities 1f
1071 1127 1289 675 2550 ftpmm
Bandwidth of ReadAmplifier
4.5 10 10 25 n/a MHz
Highest PhysicalRecording Density
2142 2254 2578 5400 10200 ftpmm
Frequency 2,666,790 4,575,620 5,748,940 7,954,200 10,200,000 Hz

54
A.1.5 DATA COLLECTION & ANALYSIS
A cassette color coding scheme was used for testing and processing convenience. Thescheme correlates a color code with a specific cassette type/manufacturer. SeveralFigures and Tables in this report make brand reference by color designation (e.g., Y,B, G, R…).
Quantum DLT IV: Fuji– YELLOW (Y)Maxell– BLUE (B)
Quantum SDLT: Maxell– GREEN ( G)
IBM 3590: BASF– RED (R)IMATION– BROWN (Br)
DLT 4000 Arkival BaFe-GOLDMP-DLTIII- PURPLE
A.2.0 TECHNICAL STUDY AREAS
A.2.1 Magnetic & Microstructure Analyses of the Recording Media
The tape brands studied, type and their identifier designations are shownin Table 2.1.1 below:
Table A.2.1 Tape Brands, Types and CodesStudy # Brand Type Serial Number Identifier #2A Quantum DLT IV 432966 SH 105M2554 79B IBM 3590 N4044023546135C Quantum S DLT I 534232 222 SH 138M2060 114D Maxell S DLT I 519451 204 SH 136M1778 114E Fuji DLT IV 366065 MA139F632 47F Maxell DLT IV 353562 SH 130M8787 51G Sony DLT IV 135958 MA139F481 42H Imation DLT IV 106671 MA134F451 21I Arkival BaFe DLT IIIJ Quantum DLT III

55
A.2.1.1 Tape Supply
Availability of certain tape media was an issue at the period in which the study wasinitiated. Specifically the IMATION product for the IBM 3590 was difficult to obtainfrom normal distribution outlets. Supply was obtained after contacting IMATIONdirectly.
A similar situation prevailed with the SDLT tape media. Tape media was readilyavailable from normal distribution sources, although limited to the Maxell brand only.At a point later in the program additional SDLT media had to be obtained directlyfrom Quantum.
DLT tape was readily available from normal distribution sources both locally andnationally. There are also multiple sources for the DLT IV tape product but several ofthese sources appeared to be private labeled stock made via OEM arrangements witheither of the two manufacturers, Fuji and Maxell.
A.2.1.1Tape Performance
Early in the program certain unexplained tape drive/ media performance issues wereexperienced with the Quantum Super DLT error testing using the Arkival testsoftware. Discussions with Quantum led to Arkival being provided with a (non-SCSI)software diagnostic tool called GS-Link. Error correlations were attempted with thetwo test programs and problem SDLT media returned to Quantum for analysis.Quantum’s test results on the returned media suggested the presence of tape edgedamage that was not repeatable from drive to drive. This study continued with newSDLT replacement media supplied by Quantum.
Additional tape media had to be purchased for the study due to the experimentalproblems encountered in the high humidity (85%) salt chamber and failing mediaexperienced at first write and read operations.
A.2.1.1 Tape Test Requirements
The following Table A.2.1 summarizes the Tape quantity requirements for the study.Some variation did take place as the experimental conditions dictated alternativerequirements. The Table can best be viewed in the ‘Normal Page View’ mode.
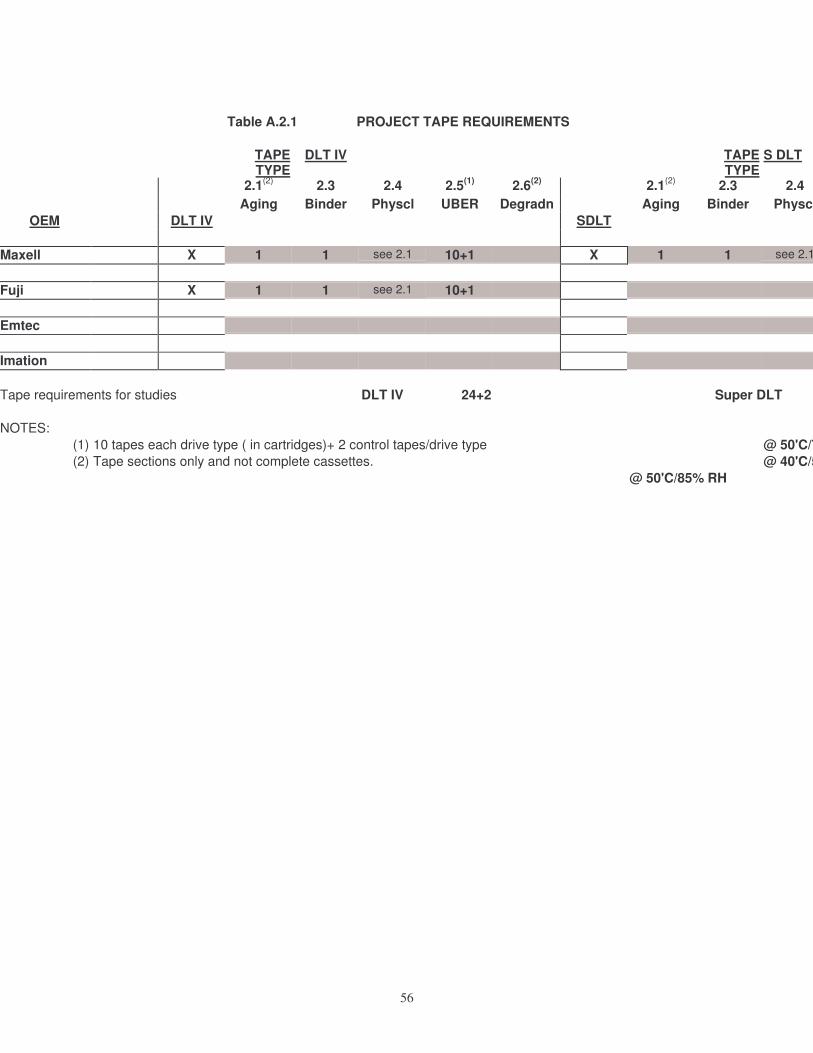
56
Table A.2.1 PROJECT TAPE REQUIREMENTS
TAPETYPE
DLT IV TAPETYPE
S DLT
2.1(2) 2.3 2.4 2.5(1) 2.6(2) 2.1(2) 2.3 2.4Aging Binder Physcl UBER Degradn Aging Binder Physcl
OEM DLT IV SDLT
Maxell X 1 1 see 2.1 10+1 X 1 1 see 2.1
Fuji X 1 1 see 2.1 10+1
Emtec
Imation
Tape requirements for studies DLT IV 24+2 Super DLT
NOTES:(1) 10 tapes each drive type ( in cartridges)+ 2 control tapes/drive type @ 50'C/75% RH(2) Tape sections only and not complete cassettes. @ 40'C/50% RH
@ 50'C/85% RH

57
TEM Analysis
The Tables below list the TEM’s taken for each tape and the magnifications used:
Some typical TEM’s are shown in Figures 1-6 – thefirst five of DLT-Fuji tape displaying the doublecoating characteristic at various magnifications and the sixth of the 3590 Emtec tape at 25kx demonstrating its single layer characteristic.
Figure 1 is the lowest magnification (5kx) of the Fuji tape showing its entire crosssection, the front coat on top, the substrate with its typical white spots and the backcoat.
In Figure 2, one observes the entire front coat(at 25 kx), the magnetic layer with its orientedacicular particles and its underlayer with itsspherical TiO2-like particles. Figure 3 is across-section showing the back coat – note thefine carbon particles in this photo. The next twophotos are higher magnification to observe moredetail in themagnetic toplayer.Figure 6 isthe IBM3590 tape
shown for contrast with its single layer coating;confirmed later with the magnetic measurements.
Table 2A

58

59
Table 3A is a summary of the low mag results on these tapes. The comparisons of the lowmag results are shown in Table 3B.
The tapes are grouped bysuspected manufacturers (SHfor Maxell and MA for Fujiand the BaFe and IBM. TheFuji and Maxell are almostidentical in their thicknesses.BaFe and IBM are muchthicker.

60
Table 4 below contains the high magnification results for these tapes and allows acomparison of the magnetic layer thicknesses. The results are similar but there is aslightly thicker layer for the Fuji tapes (0.31 +/_.04) than the Maxell tapes (0.23+/_.06). The magnetic results also support this relationship (Is for Maxell is about20% less than for Fuji).

61
VSM Analysis
The hysteresis loops for these tapes are shown in the Figures below.

62

63
A summary of these VSM results are shown in Table A.2.2.5 below.
Table A.2.2.5 VSM Data AnalysisStudy#
Brand Type Is(memu)
Ir(memu)
SQ(Ir/Is)
Hc(Oe)
SFD SQt OR(Sql/Sqt)
A Quantum DLT IV 1.96 1.56 0.79 1915 0.35 0.40 1.98B IBM 3590 18.64 15.21 0.82 1622 0.34 0.37 2.19C Quantum S DLT I 1.74 1.44 0.83 1934 0.35 0.35 2.36D Maxell S DLT I 1.96 1.64 0.84 1930 0.35 0.37 2.26E Fuji DLT IV 2.29 1.91 0.83 1811 0.34 0.37 2.25F Maxell DLT IV 1.77 1.41 0.80 1920 0.35 0.36 2.20G Sony DLT IV 2.40 1.99 0.83 1819 0.33 0.37 2.24H Imation DLT IV 2.50 2.03 0.80 1801 0.33 0.40 2.00I Arkival BaFe DLT III 9.57 7.05 0.74 1405 0.33 0.38 1.92J Quantum DLT III 19.34 15.24 0.79 1479 0.35 0.38 2.07
It is clear that there are two types of double coated tapes, magnetically – one with anIs ~ 1.9 memu’s and a coercivity of 1920 oersteds (Maxell) and the other with an Is~2.4 memu’s and a coercivity of 1810 oersteds (Fuji). The IBM tapes represent athicker, single coated technology (Is ~19 memu; Hc ~1600 oersteds).

64
The SDLT media was very similar to that being used for the Quantum DLT IV productand may indeed be selected DLT IV media with an embedded servo pattern on the backside.
The study determined likely manufacturing sources for tapes sold under both OEM andprivate label brands. The TEM results and the VSM results were the basis for thisdetermination. It is of interest to note that neither IBM nor Quantum manufactures theirown media for these tape drives products. Both Quantum and IBM have also confirmedthat the sources identified are the present media licensees.

65
A.2.2 VSM/ Aging Study- Experimental Procedures
The seven-(7) different media types/brands used in the Aging Study included the fivestandard type/brands used throughout the study with the addition of BaFe
Quantum DLT IV: Fuji, MaxellQuantum Super DLT: Maxell
IBM 3590: BASF (Emtec), IMATION
and MP-DLT III tape as references- making a total of seven (7) samples. Three (3) VSMsamples of each of the seven- (7) different media were used for the environmentalexposure along with the control tapes. This quantity of samples allowed for sample
averaging and accidental sample loss. Theindividual VSM samples were circular elementsuniformly punched from a designated tape. Theelements are assigned a number and position ona high temperature storage jar cap and weremounted with double-sided tape (magneticsurface exposed to the temperature/humidityenvironment). See photo at left. The saturatedsalt solution in the jar determined the humidityand the oven selection, the temperature. Theclosed jars were set in designated temperature
ovens for prescribed periods, removed, room temperature acclimatized and measured onthe VSM.
Table A.2.3 shows the saturated salt make-up used for establishing temperatures andhumidities for the Aging (VSM) environmental tests.
Table A.2.3 SATURATED SALT SOLUTION EXPOSURES( based on the data from J. F. Young, J. App. Chem., v17, p241 (1967))
Humidity 100 85 75 50 30 0(% R.H.)
Temp. (oC)
25 D/I H2O KCl NaCl Co(NO3)2 MgCl2 Drierite
40 D/I H2O KCl (83oC) NaCl Na2Cr2O7 MgCl2 (32 oC) Drierite
50 D/I H2O K2CrO6 (86 oC) NaCl NaBr (49) MgCl2 (31 oC) Drierite
80 D/I H2O BaCl2 (85+ oC) NaCl (73 oC) NaBr (52) MgCl2 (29 oC) Drierite
( ) indicates slight variations from the nominal humidity values.

66
The basis for the selected temperatures and humidities follow from the publishedISO/ECMA specifications for the three tape products.
Table A.2.4 ISO/ECMA EnvironmentsProduct ISO/ECMA
Spec. No.Condition Temp RH Conditioning
timeIBM 3590 278
Tape TestEnvironment
23o+/- 2o C 40-60% 24 h min
CartridgeOperating
16oC-32oC 20-80%(26o wetbulb)
24 h min
CartridgeStorage
5oC-32oC 5%-80%(26o wetbulb)
QuantumDLT
286
Tape TestEnvironment
23o+/- 2o C 40-60% 24 h min
CartridgeOperating
10oC-40oC 20-80%(26o wetbulb)
24 h min
CartridgeStorage
16oC-32oC 20%-80%(26o wetbulb)
QuantumSDLT
320
Tape TestEnvironment
23o+/- 2o C 40-60% 24 h min
CartridgeOperating
10oC-40oC 20-80%(26o wetbulb)
24 h min
CartridgeStorage
16oC-32oC 20%-80%(26o wetbulb)

67
A.2.3 Binder Hydrolysis
A.2.3.1 Experimental Procedures
Different magnetic tape samples were to be exposed to accelerated aging conditions thatinclude elevated temperature (50, 75 and 100oC) and varying humidities (30%, 50%, 75%and 100% RH). The purpose being:
-to determine the mass of solvent extractable organic compounds from the sevenmagnetic tapes as a function of time spent under accelerated aging conditions;-to determine the molecular weight and, where possible, the molecular identity ofsolvent extractables;-to determine the lubricant loss (% weight) from each tape sample as a function oftime;-to determine, where possible, the molecular identity of the lubricants used ineach tape sample.
Seven different magnetic tapes were studied: IBM 3590-Emtec and Imation,Quantum SDLT (Maxell), Fuji and Maxell DLT IV, BaFe and MP-DLT III. Each type ofmagnetic tape was cut into strips of approximately 1 gram size, accurately weighed and
carefully wound into a spool. The spools wereplaced into open ended glass vials and the glassvials were neatly packed in an upright positioninside aluminum cages. The cages were placed inautoclavable polypropylene bins (see photo at left)that were filled with approximately 1 inch ofdistilled, deionized water. The water level wassufficiently low that none of the glass vials wereimmersed in the aqueous drink. The aqueous
solutions in some bins were saturated with the appropriate inorganic salts in order tomaintain a constant relative humidity (% RH) within the bins. The polypropylene binswere sealed and placed in one of three ovens each at a constant temperature (± 3 oC), forspecified times.
Table A.2.3.1. Description of Accelerated Aging Bins
Salt solutions for maintaining constanthumidity: Lange’s Handbook ofChemistry, 13th Ed., McGraw-Hill:NY, 1985.
At known intervals, each binwas removed from its respective oven,opened, and samples of each type of
magnetic media were removed. Each sample was allowed to cool and then transferred to
/Bin # T (oC) Salt(sat’d)
% RH
1 50 MgCl2 312 50 Na2Cr2O7 54.53 75 MgCl2 304 75 NaBr 505 75 NaCl 766 100 none 100

68
a glass flask for methylene chloride (CH2Cl2) extraction. After adding a clean stir-barand methylene chloride, the tapes were magnetically agitated in the solvent for 24 hours(see photo left). The methylene chloride layer was then decanted into a clean, pre-
weighed round-bottomed flask. The solvent was thenevaporated from each round-bottomed flask using acommercial rotary evaporator. Weighing the round-bottomed flasks after evaporation of all solvent revealedthe mass extracted from each tape and the % extractable.
Approximately 1-3 milligram (mg) of each extractwas dissolved in 1 mL of fresh CH2Cl2 and submitted for
GC-MS analysis on an HP 5890A gas chromatograph coupled to a 70 eV electron impact(EI) mass spectrometer. For molecules with a molecular weight of 100 atomic mass units(amu), this would correspond to a solution with a concentration between 1x10⁻² and 3x10-
2 M (molar or moles/L). For much larger molecules with a molecular weight of 1000amu, this would correspond to a solution with a concentration between 1x10⁻³ and 3x10⁻³
M. This entire concentration range is appropriate for the GC-MS technique utilized. TheGC-MS analysis was qualitative in nature and designed to identify but not quantifycompounds present in the solvent extracts. Following each GC-MS run, an electronicMS library was searched to help identify each compound present in the solvent extracts.
A.2.3.2 Earlier Binder Studies and Discussion
Prior to this work, tape binder hydrolysis was studied in detail by NML (1). Thequestion of hydrolytic stability of magnetic tape binder was specifically addressed bysubjecting several different magnetic tape samples to elevated temperatures. The NMLdata was fit to a kinetic model developed to describe the level of extractable binderhydrolysis product as a function of time. The model is based on a simple first orderkinetic equation and makes a key assumption: magnetic tape lubricants are volatilecompounds that vaporize to leave no appreciable lubricant concentration on the tapes.This assumption may not be valid under the conditions of the NML study and asignificant portion of the NML solvent extracts attributed to binder hydrolysis productsmay in fact have been due to lubricant. In fact, the NML report offers no compelling datato support the notion that lubricants present in the magnetic tape readily evaporate. TheNML assumption is based upon a gas chromatography study designed to measure butylmyristate concentrations as a function of time spent under accelerated aging conditions.Butyl myristate is a common magnetic tape lubricant. The data indicate a slow reductionin butyl myristate concentration over a period of about 80 weeks at 58 oC. Most
______________________________________
(1) van Bogart, J W. C., National Media Lab Technical Report RE0017, 1994
interesting, the loss of lubricant was found to be humidity dependent, the most rapid rateof loss occurring at the highest %RH levels tested. A much more plausible explanation

69
for the humidity dependent loss of butyl myristate is its slow hydrolysis to myristic acidand butanol. As such, the kinetic model developed to explain the time dependence ofacetone extracts is flawed.
The NML kinetic model also predicts that the concentration of binder hydrolysisextraction products should reach an equilibrium “plateau” at long times. This is notobserved. The weight percent of acetone extracts reaches a maximum at intermittenttimes before falling off to a non-zero value (~0.5 wt %) at long times. The NML kineticmodel was adjusted to explain why “it appears as if the extractable binder [hydrolysis]products are further reacting to produce a ‘non-extractable’ binder component.” There isno physical or chemical evidence presented to support the further reaction of binderhydrolysis products into “non-extractable” products and the existence of these latterspecies must be questioned. A less complicated explanation for the NML experimentaldata is presented here. This reinterpretation of NML data distinguishes partial fromexhaustive binder hydrolysis. Thus, although visible signs of partial binder hydrolysis(e.g., sticky tape formation) are noted by NML upon exposing magnetic tapes toaccelerated aging conditions, the extent of exhaustive binder hydrolysis resulting in theformation of low MW, readily extractable hydrolysis fragments was minimal. Instead, theextracts consisted largely of lubricants and a few volatile components either left overfrom the chemical manufacture of the tapes or used as additives. Partial hydrolysis of thepolyester containing binder releases lubricants and other components present in theinterior of the tape structure resulting in an initial rise in % extractables as a function oftime spent under accelerated aging conditions. Over extended times, however, the morevolatile components are lost and the ester lubricants are slowly hydrolyzed to non-volatilefatty acids. The net result is a steady decline in percent extractables at long reactiontimes.
Recently, a study concerning storage stability of metal particle media (6) reporteda polymer binder consisting of polyester polyurethane and PVC cross-linker wasextracted with tetrahydrofuran (THF) and analyzed by gel permeation chromatography(GPC) using an ultraviolet detector. It is unclear which species were actually detected byUV and there was no mention made of the detected molecule(s) molar absorptivity, animportant constant for back-calculating concentrations. The proceedings paper does notindicate magnetic tape sample sizes utilized in the study. Consequently, it is difficult tocompare and contrast the Fuji study to the NML or other studies. The Fuji results, plottedas the number of extracted molecules versus time, show a steady increase in the numberof extracted molecules as a function of time spent under ambient conditions. Given thelimited amount of information available, we project that somewhere between 1.0 and 2.0milligrams of exhaustive hydrolysis products were apparently isolated by GPC. Thiswould correspond to 0.001 to 0.002 weight percent of hydrolysis product collected for a100 gram sample. With limited experimental detail it appears possible that the weightpercent of exhaustive hydrolysis product collected by the Fuji group could easily fallwithin the experimental noise of the extractables collected in the NML study (i.e.,between 0.5 and 3.1 weight percent). In other words, the mass of exhaustive binderhydrolysis products collected in the Fuji study may be minimal compared to the totalmass of acetone extracts collected from the NML magnetic tape.

70
1994 NML Binder Hydrolysis Study. The most thorough investigation reportedto date concerning binder hydrolysis in magnetic tape was that performed by Dr. John W.C. van Bogart of the National Media Lab (NML) in 1994. In the NML study the questionof hydrolytic stability of magnetic tape binder was specifically addressed by subjectingseveral different magnetic tape samples to elevated temperatures (40 and 75 oC) andvarying relative humidities (0 to 90% RH) for periods of up to 3 years. At intermittenttimes, samples of each tape were extracted with acetone. The acetone extracts were notsubmitted for detailed chemical analysis. No attempt was made to characterize thechemical composition of any species present in the acetone extracts save butyl myristate,a suspected lubricant. Under the most severe conditions tested (75oC, 90% RH), theweight percent of acetone extracts from a high grade VHS tape gradually rose from~1.4% (time zero) to ~3.1% (~16 weeks) before slowly dropping off and eventuallyreaching 0.5-1% (140 weeks). A lower grade VHS tape behaved similarly with theweight percent of acetone extracts reaching a maximum of 2.6% at approximately 16weeks before slowly falling off to 0.6% at approximately 140 weeks.
Without the aid of chemical analysis, the NML data was fit to a kinetic model thatwas developed to describe the level of extractable binder hydrolysis product as a functionof time. The model is based on a simple first order kinetic equation and makes a keyassumption: magnetic tape lubricants are volatile compounds that vaporize to leave noappreciable lubricant concentration on the tapes. This assumption may not be valid underthe conditions of the NML study.
The NML report notes that some of the tapes investigated contained the butylester of myristic acid as lubricant. The literature reports a melting point of 6.5-7.2 oC forbutyl myristate (Z. Phys. Chem. (Leipzig), 251 (1972), p. 303) and a boiling point of 195oC at a pressure of 18 Torr (Justus Liebigs Ann. Chem., 473 (1929), p. 255). There areno literature values available for the boiling point for butyl myristate at atmosphericpressure, but one can use a pressure-temperature nomograph to estimate a boiling point of340 oC at atmospheric pressure. A molecule with this boiling point should not beconsidered volatile at either 40 or 75 oC, the temperatures employed in the NML binderhydrolysis study. The NML belief that lubricants including butyl myristate are volatileunder the conditions of the aging experiments is based upon data collected from twoseparate labs. These labs utilized gas chromatography to measure butyl myristateconcentrations as a function of time spent under accelerated aging conditions (58 oC andvarying %RH). Although the data from the labs “show a considerable amount of scatter”that “differ by as much as 30%,” the data indicate a slow reduction in butyl myristateconcentration over a period of about 80 weeks at 58 oC (see Figure 7.4, page 40, NationalMedia Lab Technical Report RE0017, 1994). Most revealing, the loss of lubricant wasfound to be humidity dependent, the fastest losses occurring at the highest humiditylevels tested. It is unlikely that %RH would have a profound effect on lubricantvolatility. A much more plausible explanation for the loss of butyl myristate at 58 oC isits slow hydrolysis to myristic acid and butanol. Like polyester binder, the butyl ester ofmyristic acid should hydrolyze faster at higher humidities (i.e., higher concentrations ofwater). In summary, the NML report offers no compelling data to support the notion thatlubricants present in the magnetic tape completely evaporate at or below 75 oC. Their

71
slow hydrolysis to fatty acid and alcohol is a much more likely scenario. As such, thekinetic model developed to explain the time dependence of acetone extracts is flawed.Aside from problems associated with evaporation of lubricant, other problems with theNML model also exist. The model predicts that the concentration of binder hydrolysisextraction products should reach an equilibrium “plateau” at long times. This is notobserved. As described above, the weight percent of acetone extracts reaches amaximum at intermittent times before falling off to a non-zero value (~0.5 wt%) at verylong times (see Figure 7.1, page 37, National Media Lab Technical Report RE0017,1994). In order to fit the flawed model to the experimental data, a fudge factor wasintroduced. Thus, the model is adjusted to explain why “it appears as if the extractablebinder [hydrolysis] products are further reacting to produce a ‘non-extractable’ bindercomponent.” There is no physical or chemical evidence presented to support the furtherreaction of binder hydrolysis products into “non-extractable” products and the existenceof these latter species must be questioned. Finally, the model includes an additional termfor unspecified “other low MW extractables,” a second fudge factor needed for anacceptable fit. In total, the kinetic model is designed to account for 3 types ofcomponents in the acetone extracts: low MW binder hydrolysis components, tapelubricant and “other low MW extractables.” None of these components were identifiedby modern methods (e.g., GC-MS). The only basis for the creation of 3 distinct types ofextracts seems to be a combination of expectation (i.e., experimental bias) and datafitting.A less complicated explanation for the NML experimental data is presented here. Thisreinterpretation of NML data distinguishes partial from exhaustive binder hydrolysis.Thus, although visible signs of partial binder hydrolysis (e.g., sticky tape formation) arenoted by NML upon exposing VHS tapes to accelerated aging conditions, the extent ofexhaustive binder hydrolysis resulting in the formation of low MW, readily extractablehydrolysis fragments may be minimal. Instead, the extracts consist largely of lubricantsand a few volatile components either left over from the chemical manufacture of the tapesor used as additives. Partial hydrolysis of the polyester containing binder releaseslubricants and other components present in the interior of the tape structure resulting inan initial rise in % extractables as a function of time spent under accelerated agingconditions. Over extended times, however, the more volatile components are lost andnon-volatile fatty acid ester lubricants are slowly hydrolyzed to non-volatile fatty acids.The net result is a steady decline in percent extractables at long reaction times. Thisreinterpretation of NML data is based partly on the experimental data collected by theUNH group in the present study (see below).
2002 Fuji Photo Film Report. Very recently, Kazuko Hanai and YutakaKakuishi of the Fuji Photo Film Company reported a study concerning storage stability ofmetal particle media (K. Hanai and Y. Kakuishi, Proceedings of the 10th NASA GoddardConference on Mass Storage Systems and Technologies in cooperation with the 19thIEEE Symposium on Mass Storage Systems, University of Maryland, College Park, April16, 2002, p. 311-315). In the study, polymer binder consisting of polyester polyurethaneand PVC cross-linker were extracted with tetrahydrofuran (THF) and analyzed by gelpermeation chromatography using an ultraviolet detector. It is unclear which specieswere actually detected by UV and it is worth noting that multiple UV active species

72
including lubricants could be extracted from the tape. No mention is made of thedetected molecule(s) molar absorptivity, an important constant for back-calculatingconcentrations. The authors do mention that phthalic acid and methanediphenyldiisocyanate (or more appropriately methylene diphenyl isocyanate (MDI) of formulaO=C=N-C6H4CH2C6H4-N=C=O) were utilized in the formation of the polyesterpolyurethane binder, both of which could potentially be detected by UV(methanediphenyl diisocyanate as the corresponding hydrolysis product) followingexhaustive hydrolysis of the binder. Unfortunately, the proceedings paper does notindicate magnetic tape sample sizes utilized in the study. Moreover, hydrolysisproduct(s) are reported in terms of molecule numbers rather than weight percents orconcentrations. Consequently, it is difficult to compare and contrast the Fuji study to theNML or other studies. The Fuji results, plotted as the number of extracted moleculesversus time, show a steady increase in the number of extracted molecules as a function oftime spent under ambient conditions. The number of extracted molecules varies fromapproximately 3.6 x 10¹⁸ to 6.8 x 10¹⁸ for samples stored between 0.1 and 14 years,respectively. Since one mole corresponds to 6.02 x 10²³ (Avogadro’s number)molecules, the Fuji samples containing hydrolysis products contain between 5.9 x 10⁻⁶
and 1.12 x 10⁻⁵ moles. Assuming an average molecular weight of 182 for the hydrolysisproducts (4, 4’-methylenedianiline from MDI and phthalic acid have a MW’s of 198.27and 166.13, respectively), somewhere between 1.1 and 2.0 milligrams of exhaustivehydrolysis products were apparently isolated by GPC. If the Fuji group started with 1gram of magnetic tape for each analysis, then this would correspond to 0.11 to 0.20weight percent of hydrolysis product collected. If the Fuji group started with 10 grams ofmagnetic tape, then this would correspond to 0.011 to 0.020 weight percent of hydrolysisproduct collected. If the Fuji group started with 100 grams of magnetic tape, then thiswould correspond to 0.0011 to 0.0020 weight percent of hydrolysis product collected.Without further experimental detail reported, it is difficult to compare the Fuji data to theNML study, but it appears possible that the weight percent of exhaustive hydrolysisproduct collected by the Fuji group could easily fall within the experimental noise of thetotal weight percent extractables collected in the NML study (i.e., between 0.5 and 3.1weight percent). In other words, the mass of exhaustive binder hydrolysis productscollected in the Fuji study may be minimal compared to the total mass of acetone extractscollected from magnetic tape. The use of GPC with UV detection to isolate such smallquantities of exhaustive binder hydrolysis product is intriguing and certainly deservesfurther consideration.

73
A.2.4 Physical Properties
A.2.4.1 Experimental Procedures
ResistivityThe test procedures followed the test method(s) outlined in the ISO/ECMAspecifications. Test fixtures were designed, constructed and plated to specification. Seephoto below. The Resistivity Pre-Tests evolved experimental observations that requirednecessary modifications to the ISO/ECMA specifications. It was determined that theISO/ECMA voltage specified for the IBM 3590 product (500V) generates sufficientconductive heating to distort the test tapes and invalidate resistivity readings. Lowervoltages were required for the test as well as low current measuring equipment.
A length of ~1m of each tape evaluated was loosely wound on a small cassette spoolalong with an equal length sample for the friction measurement. The spools were affixedto an environmental container cover that was designed to suspend the samples over a
saturated salt solution. Tapes in this study were alsoexposed to a range of temperatures and humidities. Therewere a total of 4 jars per oven temperature (both 40C and50C) representing 8 test conditions (2 temperatures and 4humidities in each); the conditions were: 40C and 50C and30%, 50%, 75% and 85% relative humidities.
Tape samples were weighted for the measurement to insurea firm contact with the ISO/ECMA resistivity fixture.
Surfaces were kept clean and the measurement performed in a dust free environment.
FrictionThe ISO/ECMA specification does not specify the experimental hardware for the frictiontest. The test describes the procedure for pulling tape sections over a specified rod. Oneside of tape section was weighted, makes a 90o wrap around the rod, and pulled with auniform force. Starting and sliding force (friction) was recorded. In many labs, suchfriction measurements are done manually with weights and spring gages. A manual pre-test of the friction measurement proved totally inadequate and non-repeatable. A moreaccurate sample holding method, appropriate fixturing and motor control (1mm/sec) wasrequired for this test. It was further noted that the ISO/ECMA ceramic material specifiedfor the friction test was outdated and irrelevant for the drive products being evaluated. AnAlSiMag 2 material for the head equivalent friction test was ordered but was not beavailable in time for the study. The test fixture was also designed to accommodateinterchangeable ceramic rods and tape heads for the friction test but the proposed rodmaterial change was never approved by Quantum or IBM.

74
Friction measurements are reported therefore for tape surface (magnetic layer side) totape surface (conductive coating side) only. See experimental setup in photo.
A length of ~1m of each tape being evaluated wasloosely wound on a cassette spool along with an equallength sample for the resistance measurement. Thespools were affixed to an environmental storagecontainer cover that was designed to suspend thesamples over a saturated salt solution. There were atotal of 4 jars per oven temperature (both 40C and50C); representing 8 test conditions (2 temperatures
and 4 humidities in each). The conditions were: 40C and 50C and 30%, 50%, 75%and 85% relative humidities.
Samples were placed back into their respective chambers for additionalenvironmental exposure after data was obtained. The full data set is included inAppendix AE.2.4.

75
A.2.5 RF Amplitude Response
A.2.5.1 Experimental Procedures
The tape drives for the study could not be used for RF measurements. An alternativetest means was used that employed professional video recorders. The use of linearcontrol tracks in video recorders provides accurate tape position tracking for the videodata contained in the video tracks. Access to these control tracks allowed forcustomized single frequency recording and subsequent RF measurements of therecording media under study.
Special video amplifier circuits were integrated into the VCR to overcome thecomplexity of the measurement, the necessity to write specific data frequencies (2f,4f, etc.) and the measurement of very low level amplitudes from the recording mediabeing evaluated. RF signals were written using a precise frequency source via acommercial chipset designed for high-end video applications.
The tapes under test contained the recorded RF analog region and simplified datarecorded with three different data patterns. A comparison of the data files on the testtapes was made against the same patterns on disc and differences reported as errors.There was no compression and no error correction used in the test.
The subject test tapes were reloaded into professional videocassettes and evaluated assuch. Considerable care given to loading detail, edge feathering and tape pre-tensioning. The process resulted in a series of high quality beta cassettes containingthe three (3) data tape stocks of the study along with a BaFe tape and a MP-DLT IIImetal particle tape for reference.
The following Table A.2.5.1 describes the Storage Devices investigated, theirrecording densities (defined as 1f, 2f, and 4f) and information regarding recordingfrequencies and bandwidth.
Table A.2.5.1 Recording PropertiesThe tests tapeswere written withfour RF signals(2.5, 5.0, 7.5 and10 MHz). RFsignals werewritten using aprecisionfrequency sourceshown below.
Tape Drive DLT4000
DLT7000
DLT8000
SDLT220
3590 Units
HighestPhysical
RecordingDensity
2142 2254 2578 5400 10200 ftpmm
Frequency 2,666,790
4,575,620
5,748,940
7,954,200
10,200,000
Hz
Bandwidthof Read
Amplifier
4.5 10 10 25 n/a MHz

76
Frequency Response All Storage Media
0
5
10
15
20
25
30
35
40
45
3 5 8 10
Frequency (Mhz)
Am
plit
ud
e (d
B)
SDLT
DLT IV (Yellow )
DLT III
3590 (Red)
3590 (Brow n)
BaFe
RF Amplitude response- Test Stand Diagram
RF Monitor
RecordHeads
HP 8656B Signal Generator RecordPreAmp
Sony SLO 1800 Video Recorder
Tektonix 492 Spectrum Analyzer
The test setup consisted of a HP 8656B Signal Generator, a Record Preamp, aSLO 1800 Video Recorder, and a Tektronix 492 Spectrum Analyzer. The RecordHeads are detached and connected to a Record Preamp for media writing toeliminate any filtering from the Sony SLO 1800. The Record Heads arereattached to the SLO 1800 for tape media playback. The RF Monitor output hasa 10:1 Gain from the RP24 (record/playback) board. During the record mode, theHP 8656B Signal Generator is programmed to output 2.5MHz, 5MHz, 7.5MHz,and 10MHz. The record amplitude is adjusted to generate a 2.5 Volt output at theRecord Preamp. Each frequency is applied for a specified time on to the tapemedia being tested. The tapes are placed in environmental chambers and re-measured for RF signal degradation.
A periodic tape re-winding schedule in the environmental chambers wasemployed such that the entire tape length was exposed to the test environment;thereby eliminating the BOT, MOT and EOT issue. Custom tape rewinders wereused to provide continuous environmental tape exposure within the chambers.Daily rewinding at elevated temperatures proved harmful to several of therecording tapes. The fragility of the thin tape media was prone to edge damageand slight stretching while being continuously wound and rewound on the guidesand rollers of the recyclers.
Figure A.2.6.1 Circuit Frequency ResponseChanging the test cycle(s) in theenvironmental chambers to a singlerewinding schedule at the beginningof each exposure cycle provedsatisfactory.
The recording of simplified data for error analysis did not prove applicable to the double coated DLT and SDLT media. Limitations in the circuitry complicated by the very lowsignal outputs made this error test

77
unlikely to yield useable results. Error performance was only available via the errorpart of this study. See section 2.6.
The circuit frequency dependence, with the appropriate test media was measured toassure reliable data collection. The data in Figure A.2.6.1 confirmed the expectedfrequency roll-off and signal weighting. The signal levels at the 10 MHz frequencywere insufficient to report reliable data and change.
The complete set of test tapes were written and initial data recorded. Cassettes wereplaced in their in their appropriate environmental chambers and environmentallyrewound. At 3-4 week intervals the test tapes were removed from the testenvironments, acclimatized to room temperature and read. Control tapes stored atroom temperature were typically run before and after each environmental test groupto assure that the test drive was functioning properly
Environmental Storage
Two Tenney Environmental chambers were used to store tapes and the recyclers atthe 50oC/ 75% RH and 40oC/ 50% RH conditions. Each chamber was equipped withtime programmable Temperature/RH data loggers to assure the consistency andaccuracy of the storage environment over the life of the study.
The 50oC/ 85% RH environment was accomplished via a custom designed storagebox that accommodated the test tapes and the recycler. Both were suspended over asaturated salt (K2CrO6) solution but unlike the environmental chambers there was noforced air circulation within the box.

78
A.2.6 Error Study
A.2.6.1 Experimental Procedures
Tape Media
The tape media for the error study represented five (5) test tapes for each drive type(3590, DLT and SDLT) at each of three environmental conditions- along with two (2)RT control tapes for each drive type. When applicable, the media quantity wasdoubled to include one additional media manufacturer for each drive type.
The study included tapes from the following OEM/Type's:
Quantum DLT IV: Fuji (15 tapes); Maxell (15 tapes)Quantum SDLT: Maxell (15 tapes)IBM 3590: BASF (15 tapes), IMATION (15 tapes)
The five tapes for each storage condition provided for both performance variationsand the averaging of data as well as protection against unanticipated tape losses in thethree (3) controlled environments:
40oC/ 50% RH50oC/ 75% RH50oC/ 85% RH
Two tapes from each OEM were kept at room temperature (20o C and 50% RH) andused as control tapes throughout the study. The periodic testing of these control tapesenabled the determination of error changes (and trends) resulting from multiple usewhich was inherent also in the environmental test data.
Each environmental chamber included one or more tapes made with traditionalrecording media. The BaFe and MP-DLTIII control tapes were monitored in aQuantum DLT 4000 drive.
Tapes were stored in the test environments in their manufactured cassettes and not inplastic shipping or storage containers *.
The study utilized two drives of each type (3590, DLT and SDLT) to provide fordrive-to-drive variability data and a drive backup in the event of any drive-typefailure.
* Note: IBM 3590 type cassettes are not supplied in protective outershipping/handling cases.

79
Environmental Storage
Two Tenney Environmental chambers were used to store tapes at the 50oC/ 75% RHand 40oC/ 50% RH conditions. Each chamber wasequipped with time programmable Temperature/RHdata loggers to monitor the storage environment overthe life of the study. See photo at left.
The 50oC/ 85% RH environment was accomplished viaa custom designed high temperature storage box thataccommodated the 27 test tapes suspended over asaturated salt (K2CrO6) solution. At one point in thestudy, the test cartridges in the box were covered withcaked salt from the saturated salt solution and had tobe discarded. The vapor pressure buildup within thetest box caused a vapor loss due to a leaky seal. The
test had to be restarted with new replacement tapes and an improved method ofsealing and containing the vapor pressure.
Test Procedure
At 3-4 week intervals the test tapes were removed from the test environments,acclimatized to room temperature* and error-evaluated in their respective tape driveswith the test software. Due to the extensive tape testing time per storage condition the27 test tapes in each lot were time-staggered such that only one lot was out of theenvironmental chambers at a time. The ambient stored control tapes were typicallyrun before and after each environmental test group to assure that the drives werefunctioning properly. All tapes were tested on both the primary and secondary driveof each type. The average test time for each tape was 20 minutes for the IBM 3590type, 2 hours for the DLT IV types and 3 hours for the SDLT type.
The two IBM 3590 drives were obtained via an IBM selling partner, the twoQuantum DLT drives thru a national Distributor and the SDLT drives from Compaqand Quantum. Early in the drive testing program a high failure rate was experiencedwith the SDLT test system configuration. Ensuing discussions with Quantum resultedin their providing replacement drives for test and analysis. Error testing was re-startedwith new SDLT drives that incorporated the latest engineering changes and softwaremodifications. The Quantum firmware also included the necessary VSC's (vendorspecific codes) for collecting error data.
* Note: particular care and handling was used to assure that condensation did not occurwhen tapes were removed from environmental chambers.

80
Pre-Test IBM Tape In ARkival Chamber
0
5
10
15
20
25
30
35
40
0 25000 50000 75000 100000 125000 150000
Blocks
Num
ber
of E
rror
s in
100
0 B
lks
Orig Read CorrNew Read CorrNew Read Unc
A.2.6.2 Arkival Test Software
The software was used to study variations in data error rate for multiple vendors’tape cartridges. The test tapes were written once and read many times throughoutthe study. During reads, the program read the data blocks and periodicallycaptured designated SCSI log pages. The software contains commands to monitor
• Data patterns• Block sizes• File marks• Log page sampling• Host data compare control
The program also maintained event files which contained the following types ofinformation:
• Tape identification• Target tape drive identification• Time-stamp of events• Summary statistics (number and size of the blocks written
and read)
The program communicated to the drives via the ASPI (Advanced SCSIProgramming Interface) driver. The OS for the program was Microsoft NTversion 4.0.
The post processing and analysis of the log page data took place after the datacollection process.
A.2.6.3 Additional Tape/Drive AnalysisFig. A.2.6.1 Error Summary by Block
The individual tapes employed in thestudy reported error data on a block-basis. This reporting method enabledan in-depth study of individualblocks containing errors. Errorblocks are representative of physicaltape regions that are prone to eithererror generation and/or multipleerror clustering. The generation ofmultiple errors in a particular datablock will increase the probability ofviolating error correction capabilities and causing hard read errors- making datarecovery unlikely. An error analysis by block count enabled such a determination tobe made. Figure A.2.6.1 is representative of an error study by block. In the 3590

81
Error Analysis by Tape Head(Y35- 2mo 50C/ 75% RH)
0
5000
10000
15000
20000
25000
30000
35000
Raw ReadErrors
RAW RDERRS - HD
0
RAW RDERRS - HD
1
RAW RDERRS - HD
2
RAW RDERRS - HD
3
RDBERx10^9
Heads
Raw
Rea
d E
rror
s 2mo
start
example, the starting data for both the initial write and read pass is compared with~480 hours of environmental storage at 50oC and 85% RH.
In addition to the reporting and analysis of the major error categories and rates therestill remain other technical areas of interest that could be addressed for detailed erroranalysis and cause. Due to the fact that Storage Device manufacturers restrict availabledata detail, analysis of this type is limited to storage devices that make this informationavailable. One such analysis is the study of the Raw Error rate by head. In the DLT (Y35) example shown in Figure A.2.6.2 an error analysis by head is presented. In this casethe starting data is compared to the data obtained some 2 months after environmentalstorage at 50 C/ 75% RH. Errors changes by head number are highlighted between thedashed lines. Additional information of this type is helpful in determining driveanomalies and causes of media failure.
Fig. A.2.6.2 Error Analysis by Tape HeadA.2.6.4 Catastrophic Failures
During the course of the study, mediafor both the IBM 3590 and theQuantum SDLT experiencedcatastrophic tape failures. Tape failures(SDLT) were also experienced duringfirst write operations suggesting amedia defect condition that caused ahard failure. Media defects of this typeare likely to be found at incominginspection. The more common failuremode however tends to occur as thetape is being read and data recoveryattempted. Failures of this type do
allow multiple reads of the good portion of the tape until the failure point is reached. Dataat and after the failure point is considered lost.

82
A.2.7 Life Expectancies
A.2.7.1 Life expectancy (LE) on the basis of Magnetic Saturation
Changes in the magnetic properties of tapes resulting from environmental exposure areattributed primarily to the chemical changes of the magnetic metal particles containedwithin. In order for these metal particles to corrode the H2O and/or O2 must come incontact with the unoxidized metal. This happens by diffusion through the two layersseparating the two reactants, the polymer binder and the metal’s oxide layer. First watermust diffuse through the polymer binder and then through the ever present oxide layerbefore reaching the elemental metal. The slowest of these steps, diffusion through theoxide layer is rate determining. The rate of oxidation slows as the oxidation proceededand the oxide layer is thickened. The mathematical relationship of this change is used tofind the rate constant, k, for each condition for each tape. From this data a rate constantcan be extrapolated and/or interpolated for any reasonable temperature and humidity.
A ten percent loss of magnetism is used as an end of life (EOL) indicator (a 10% loss inIs would imply a 10 % loss in average signal, but typical losses are not uniform anddefect counts do increase substantially for a tape that looses 0.1 Is.).
A typical Life Expectancy chart isincluded in Figure A.2.7.1.
Fig. A.2.7.1. Lifetimes at 50 C/50 % RH.
A.2.7.1 Discussion
The physical nature of the corrosion reaction can be understood by reference to FigureA.2.7.2 below. In order for the metal to corrode the H2O and/or O2 must come in contactwith the unoxidized metal. This happens by diffusion through the two layers separatingthe two reactants. First water must diffuse through the polymer binder and then through
LIFETIMES @ 50 C & 50 % RH
0.2 1.210.9 4.6
334.0
1.30.0
50.0
100.0
150.0
200.0
250.0
300.0
350.0
400.0
DLT IV 3590 S DLT I DLT IV DLT III
Quantum IBM Quantum Fuji Ark BaFe
lifet
ime
(yrs
)

83
the ever present oxide layer before reaching the elemental metal. The reaction wouldhave three steps:
1. Diffusion through polymer.2. Diffusion through oxide.3. Reaction with the metal.
The slowest of these steps wouldbe rate determining. Step 3 wouldbe almost instantaneous relative todiffusion processes. Diffusionthrough the polymer would be fastcompared to the oxide as thepolymer is of much lower densityand somewhat porous. Therefore,
step 2 would be rate determining. This being the case, the rate of oxidation would slowas the oxidation proceeded and the oxide layer thickened. This can be expressed asfollows:
Let x = the thickness of the oxide. t= time
then the rate of oxidation = r = dx/dt = k/x
or xdx = kdt
or x^2 = kt + C, but when t = 0, x = 0, so C = 0
Therefore, we may expect that (∆Is)2 = kt. This relationship may be used to find the rateconstant, k, for each condition for each tape. Figure 2.7.2.3 below is an example of howthe data may be treated. Series 2 is a plot of delta Is versus time and clearly exhibits the
parabolic shape which weanticipated. Series 1 is a plot of∆Is2 vs. time and is clearly a linearrelationship. Much of the data isnot as clear as this, but thereasonableness of this treatmentjustifies treating all the datasimilarly and obtaining rateconstants from the slope of plots of∆Is2 vs. time. These rate constantsfor 85 % RH are shown in TableA.2.7.1. From the values of theserate constants an Arrhenius plot
can be made to determine the temperature dependence of the rate of corrosion.
Figure A.2.7.2 Corrosion Reaction
METAL POLYMER METAL OXIDE
H2O diffusionand/orO2
Fig. A.2.7.2.3CORROSION VS TIME
(IBM 3590 AT 80 C/85 %RH)
y = 0.032x + 0.5015
0
5
10
15
20
25
0 200 400 600 800
TIME (HRS)
DE
LTA
Is &
DE
LTA
(Is)
^2
Series1
Series2
Linear (Series1)
Poly. (Series2)

84
Table A.2.7.1 Corrosion RatesCorrosion Rates
sample RH T rate const. 1000/T log k ∆Ε∆Ε∆Ε∆Ε Z(%) (Deg
C)(k in(memu)^2/hr)
(deg K)
85Quantum DLT IV 40 1.00E-06 3.19 -6.00
50 2.00E-05 3.10 -4.70 5.83 12.980 2.00E-04 2.83 -3.70
IBM 3590 40 2.00E-04 3.19 -3.7050 7.00E-04 3.10 -3.15 6.13 15.980 3.20E-02 2.83 -1.49
Quantum S DLTI
40 2.00E-06 3.19 -5.70
50 6.00E-06 3.10 -5.22 4.68 9.2780 1.00E-04 2.83 -4.00
Fuji DLT IV 40 2.00E-07 3.19 -6.7050 5.00E-06 3.10 -5.30 7.83 18.680 2.00E-04 2.83 -3.70
Arkival BaFe 40 1.00E-06 3.19 -6.0050 7.00E-06 3.10 -5.15 5.15 10.680 9.00E-05 2.83 -4.05
MP DLT III 40 2.00E-04 3.19 -3.7050 1.30E-03 3.10 -2.89 7.14 19.280 8.21E-02 2.83 -1.09
A typical plot is shown below in Figure A.2.7.4. The slope of this line is the energy ofactivation for transport of theoxidizing species through the oxidelayer. The interpretation of theintercept is vague, but none the less,allows the calculation of theoxidation rate at any othertemperature at this humidity. Thetables and graphs for the other tapesand other RH conditions arecompiled in AE.2.7.
Fig. A.2.7.4 IBM 3590 85 % RH
y = -6.1337x + 15.871-4
-3.5
-3
-2.5
-2
-1.5
-1
-0.5
02.8 2.9 3 3.1 3.2 3.3
1000/T (deg K)
log
k

85
A summary of these determined values are shown in Table A.2.7.2. Here ∆E is theactivation energy and Z is the pre-exponential term as follows:
k = 10Z *10 -∆E/RT
Table A.2.7.2 Data Summary∆Εα∆Εα∆Εα∆Εα
sample % RH0 30 50 75 85 100
Quantum DLT IV 6.58 4.95 4.39 2.3 5.83 5.02IBM 3590 7.47 7.91 2.47 6.53 6.13 6.69Quantum S DLT I 9.11 3.17 0.78 4.24 4.68 4.98Fuji DLT IV 7.39 3.32 6.45 4.55 7.83 5.09Arkival BaFe 2.76 5.68 4.27 6.38 5.15 4.45MP DLT III 6.71 4.91 7.55 7.33 7.14 6.43
Zsample % RH
0 30 50 75 85 100Quantum DLT IV 14.6 10.1 7.98 2.08 12.9 10.8IBM 3590 19.1 20.6 4.91 16.9 15.9 17.7Quantum S DLT I 29.8 4.88 -2.7 7.66 9.27 10.6Fuji DLT IV 16.4 5.37 14.1 8.91 18.6 10.7Arkival BaFe 3.13 11.7 7.5 14.4 10.6 8.58MP DLT III 17.2 12.2 19.8 19.4 19.2 17.3

86
There appears to be no obvious trend in these values with humidity.
Regarding the relationship of k to humidity: The value of log k was found to be bestrepresented as a function of (RH)2. This relationship is plotted for the IBM sample inFigure 3. It can be seen that the dependence of log k on humidity can be approximatedby a quadratic dependence:
Log k =A [ RH ]2 + B
Where A and B represent the slope and intercept for the lines shown in Figure A.2.7.5.Similar graphs have been constructed for the other tapes and are available in AppendixAE.2.5. These relationships should be thought of as merely empirical as no theoreticalinterpretation comes to mind.
The determined values for A and B are listed in Table A.2.7.3 below.
Fig. A.2.7.5 IBM 3590 TAPE EXAMPLE
y = 7E-05x - 1.9863
y = 0.0001x - 3.9118
y = 0.0001x - 4.6603
-5
-4.5
-4
-3.5
-3
-2.5
-2
-1.5
-1
-0.5
00 2000 4000 6000 8000 10000 12000
(RH)^2
log
k
40 deg C50 deg C80 deg CLinear (80 deg C)Linear (50 deg C)Linear (40 deg C)

87
Table A.2.7.3 EFFECT OF HUMIDITY ON RATE CONSTANTA B
TEMP (C) SLOPE INTERCEPT
Quantum DLT IV 40 1.00E-04 -6.45E+0050 5.00E-05 -5.17E+0080 7.00E-05 -4.36E+00
IBM 3590 40 1.00E-04 -4.66E+0050 1.00E-04 -3.91E+0080 7.00E-05 -1.99E+00
Quantum SDLT I 40 -4.00E-05 -5.06E+0050 1.00E-04 -6.22E+0080 1.00E-04 -4.76E+00
Fuji DLT IV 40 6.00E-05 -6.44E+0050 7.00E-05 -5.72E+0080 7.00E-05 -4.33E+00
Arkival BaFe 40 4.00E-05 -6.22E+0050 5.00E-06 -5.26E+0080 7.00E-05 -4.52E+00
MP DLT III 40 1.00E-04 -4.41E+0050 8.00E-05 -3.50E+0080 9.00E-05 -1.82E+00

88

89
With the relationships above, the value for the rate constant can be extrapolated orinterpolated for any reasonable temperature and humidity. As an end of life indicator,one can identify the time for the tape to loose ten percent of its magnetism. (note: tapelosses are not necessarily uniform and defect counts will be large for a tape that looses0.1 Is.) T0.1 is defined as this tape life, then:
T0.1 = 0.01 (Is)2 / k
These values of effective tape lifetimes are shown in Figure A.2.7.6 for a storagecondition of 50C and 50 % RH. LE values range from less than 1 year to more than 25years for the BaFe tape. In general, the lifetimes are quite long – probably longer thanthe lifetime of the drive that one would need to interpret them.
Fig. A.2.7.6 LIFETIMES AT 50 C/ 50 % RH
0.211.22 1.65 1.51
25.3
1.25
0
5
10
15
20
25
30
DLT IVQuantum
3590IBM
S DLT IQuantum
DLT IVFuji
Ark BaFe DLT III
LIF
ETI
ME
(Y
EA
RS
)

90
Life Expectancies can be determined for all tapes tested at various temperatures andRelative Humidities. The values for 50 C and different humidities is shown in FigureA.2.7.7 below
The conclusions therefore are based upon such trends rather than the data at thedesignated conditions (40C/50%RH & 50C/75%RH). Changes in magneticcharacteristics will be detrimental to performance and the most favorable product/tapemedia is one where little or no change takes place. The rankings are somewhat conditiondependent, but in all cases the raw data indicates the DLT Fuji media exhibited the leastmagnetic property change.
Fig. A.2.7.7 All Tapes- Life Expectancy @ 50 C vs. RH
0.00
0.50
1.00
1.50
2.00
2.50
3.00
3.50
4.00
0 10 20 30 40 50 60 70 80 90
% RH
lifet
ime
(yr)
Quantum DLT IVIBM 3590Quantum SDLTFuji DLT IVDLT IIILinear (Quantum DLT IV)Linear (IBM 3590)Linear (Quantum SDLT)Linear (Fuji DLT IV)Linear (IBM 3590)Linear (DLT III)

91
Fig. A.2.7.1 SDLT B*ER vs Bl_ER
y = 0.0795x
0
10
20
30
40
50
60
70
80
0 200 400 600 800 1000
B*ER
Bl_
ER
x 1
000
Series1
Linear (Series1)
A.2.7 Life Expectancies (LE’s) based on media errors
Newer tape storage systems utilize both physical and electronic means to correct andcompensate for tape errors. It is for this reason LE of the tape is best measured whenemploying all error compensation and correction means, i.e., when the tape is consideredpart of the storage system. The effectiveness of the Storage Device’s ECC efficiency isobviously inherent in the differences of the life expectancies reported.
Manufacturers of media and tape storage products no longer publish specifications forerror types, quantities or maximum errors allowable. This information does exist and islikely used for internal product specifications that are not available to the user.Information of this type may be found indirectly in drive performance specifications or attimes published as guidelines (” exceptional, good, normal and high”). When published,Error Rates for correctable (recoverable) error are stated in terms of bits read, e.g.Quantum states their “Recoverable READ Error Rate as 1 in 10^6 bits read” and IBMstates that “no single cartridge can have a dropout error in 1x10^7 bits. Unfortunately, biterror rates are only of use at an engineering level and not directly beneficial to the enduser that only has access to block data.
All the products studied use blockarchitecture and errors are reported only interms of blocks. The block sizedetermination is arbitrary and decided by theuser. Tape errors vary in size and area andblocks can contain one or more errors. Forthe purpose of this study, it was determinedthat any block containing one or more errorsbe considered part of the error statistics. Forthe tape storage systems being studied, ageneral review of the block error rate(number of bad blocks/ total blocks read) fordifferent block sizes suggested that an
average of 1 error per defective block was a reasonable determination.
Using the conclusions above an end of life (EOL) criteria was defined in terms of anError rate (B*ER) based upon the number of bits or bytes read. B*ER was defined as thenumber of defective blocks/the total number of bytes read. This definition allowed ageneral comparison with the bit error rate reported in product specifications. Acorrelation between the B*ER and the corresponding block error rate (Bl_ER) wasexamined for all three storage systems. In all case there was a linear correlation (seeFigures A.2.7.1 and A.2.7.2). Although the B*ER is not a unique definition, it wasapplicable to all three products investigated.

92
Fig. A.2.7.2 3590 B*ER vs Bl_ER
0
5
10
15
20
25
30
0 100 200 300 400
B*ER
Bl_
ER
x 1
000
Series1
EOL criteria are system specific and Storage System manufacturers do not make EOLcriteria known; at best, they offer guidelines for use. This study used the drive/cartridge
performance guidelines and published system errorrates as a basis for establishing EOL criteria. Thedetermination of the EOL criteria for each StorageDevice type took into consideration the storagedensity of the system; a figure of merit based uponthe published bit density (ftpmm), the read trackwidth of the Storage Device and a (test) block sizeof 4K bytes. Also considered was the nature of errorgeneration and error clustering that increases theprobability of catastrophic failure by violating themultiple error per block condition.
Table 2.7.2 lists EOL criteria by cartridge type, native storage capacity and B*ERmaximum values. The information reported for media error rates could not be referencedto any OEM published specifications.
Table 2.7.2 END OF LIFE Table
PRODUCT Capacity(1) Capacity
(MB)MAX
errors/GBEOL Error
Rate B*ER MAX. (2)
x10^6 Number/MBPublished…IBM 3590 10 GB 1000 - 1 -Quantum DLT 40 GB 40000 - 1 -QuantumSDLT 110 GB 110000 - 1 -
StudyCriteria… (Blocks)IBM 3590 10 GB 1000 500 2242 2500Quantum DLT 40 GB 40000 500 3296 3500QuantumSDLT 110 GB 110000 500 6252 6500(1)Native Mode Storage Capacity: Data capacity- non-compressed.(2) Round-off values for LE projectionNotes:Published Error rates:Quantum: Recoverable Read Error rate: 1 in 10^6 bits readIBM: Dropout spec: max 1 dropout in 10^7 bits read.
DefinitionsB*ER (Arkival) Block error rate - Number of "raw Read Errors(Blocks)/ Read Count"(in bytes)
64K block sizeAssumptions:Bad Blocks: 1 or more bad bits in a Block makes the total Block defective3590 DF DF = 4000; using ; 4000 ftpmm; 80 um track width; 4K block sizeDLT DF DF = 8000; using ; 2578K ftpmm; 39 um track width; 4K block sizeSDLT DF DF = 16000; using ; 2700 ftpmm; 14 um track width; 4K block size

93
DATABASE: Magnetic Stability Predictive Model
This study developed data to predict the life expectancies of the IBM 3590, QuantumDLT and SDLT magnetic tapes based upon their corrosion and subsequent changes intheir Saturation Magnetization (Is). The report projects the life expectancy (LE) of thesetapes with the use of the actual data collected for magnetic saturation loss and suitablemathematical models. The Magnetic Stability Predictive Model was developed tospecifically determine the time of storage in a given environment for tapes to reach theirend-of-life criteria.
These LE’s were calculated from the smoothed curves derived from the raw data from thesix RH points for each tape and temperature. The temperature dependence was thenobtained from an Arrhenius plot for each humidity and used to calculate the LE’s for thevarious temperatures. (See Appendix AE.DB.1-4). This method of calculation smoothesout raw data fluctuations and the resulting LE’s do not directly correlate point by pointwith the raw measurements. The LE’s for the DLT tapes are generally higher (similar tothe SDLT tape) while the 3590 tape results are lower. The LE for the study tapes areshown in the following tables (Tables DB.1-DB.4). The highlighted areas represent theenvironmental conditions of interest.
Table DB.1 LIFE EXPECTANCY (YEARS) FOR QUANTUM SDLT I
TEMP (C) RH (%) 0 30 50 75 85 10010 5.95E+05 1.95E+05 2.46E+04 4.15E+02 5.11E+01 1.41E+0020 4.54E+04 1.74E+04 2.92E+03 8.63E+01 1.41E+01 6.39E-0130 4.10E+03 1.83E+03 4.00E+02 1.99E+01 4.26E+00 3.05E-0140 4.32E+02 2.21E+02 6.21E+01 5.03E+00 1.38E+00 1.53E-0150 5.22E+01 3.04E+01 1.08E+01 1.39E+00 4.82E-01 7.98E-0260 7.18E+00 4.73E+00 2.10E+00 4.12E-01 1.79E-01 4.33E-0270 1.11E+00 8.18E-01 4.47E-01 1.32E-01 7.03E-02 2.44E-0280 1.90E-01 1.56E-01 1.04E-01 4.49E-02 2.91E-02 1.42E-0290 3.59E-02 3.28E-02 2.62E-02 1.62E-02 1.27E-02 8.50E-03100 7.43E-03 7.46E-03 7.10E-03 6.20E-03 5.77E-03 5.24E-03
Table DB.2 LIFE EXPECTANCY (YEARS) FOR FUJI DLT IVTEMP (C) RH (%) 0 30 50 75 85 100
10 1.48E+04 8.04E+03 2.86E+03 3.10E+02 1.09E+02 1.57E+0120 1.86E+03 1.10E+03 4.55E+02 6.63E+01 2.72E+01 5.10E+0030 2.67E+02 1.71E+02 8.14E+01 1.57E+01 7.43E+00 1.79E+0040 4.34E+01 3.00E+01 1.63E+01 4.08E+00 2.21E+00 6.71E-0150 7.90E+00 5.86E+00 3.60E+00 1.15E+00 7.07E-01 2.67E-0160 1.59E+00 1.26E+00 8.70E-01 3.52E-01 2.42E-01 1.13E-0170 3.52E-01 2.97E-01 2.29E-01 1.15E-01 8.85E-02 4.99E-0280 8.50E-02 7.61E-02 6.48E-02 4.00E-02 3.42E-02 2.31E-0290 2.22E-02 2.10E-02 1.97E-02 1.48E-02 1.39E-02 1.12E-02100 6.21E-03 6.20E-03 6.37E-03 5.74E-03 5.95E-03 5.63E-03

94
Table DB.3 LIFE EXPECTANCY (YEARS) FOR QUANTUM DLT IV(MAXELL)
TEMP. (C) RH (%) 0 30 50 75 85 10010 4.83E+04 2.32E+04 5.50E+03 3.65E+02 8.86E+01 7.84E+0020 4.60E+03 2.47E+03 7.21E+02 7.13E+01 2.13E+01 2.69E+0030 5.11E+02 3.06E+02 1.08E+02 1.55E+01 5.61E+00 9.87E-0140 6.54E+01 4.32E+01 1.83E+01 3.72E+00 1.61E+00 3.87E-0150 9.50E+00 6.90E+00 3.45E+00 9.76E-01 4.99E-01 1.60E-0160 1.55E+00 1.23E+00 7.19E-01 2.77E-01 1.66E-01 7.02E-0270 2.81E-01 2.42E-01 1.64E-01 8.47E-02 5.89E-02 3.23E-0280 5.61E-02 5.22E-02 4.09E-02 2.77E-02 2.22E-02 1.55E-0290 1.23E-02 1.23E-02 1.10E-02 9.62E-03 8.81E-03 7.74E-03100 2.90E-03 3.12E-03 3.16E-03 3.54E-03 3.67E-03 4.01E-03
Table DB.4 LIFE EXPECTANCY (YEARS) FOR IBM 3590TEMP. (C) RH (%) 0 30 50 75 85 100
10 3.49E+03 2.22E+03 1.29E+03 6.28E+02 4.60E+02 1.52E+0220 4.90E+02 3.20E+02 1.94E+02 1.01E+02 7.75E+01 2.74E+0130 7.83E+01 5.25E+01 3.31E+01 1.85E+01 1.47E+01 5.54E+0040 1.41E+01 9.67E+00 6.33E+00 3.75E+00 3.09E+00 1.24E+0050 2.81E+00 1.98E+00 1.34E+00 8.42E-01 7.18E-01 3.05E-0160 6.19E-01 4.45E-01 3.11E-01 2.06E-01 1.82E-01 8.15E-0270 1.49E-01 1.09E-01 7.87E-02 5.49E-02 4.99E-02 2.35E-0280 3.88E-02 2.90E-02 2.15E-02 1.58E-02 1.47E-02 7.30E-0390 1.09E-02 8.29E-03 6.32E-03 4.84E-03 4.65E-03 2.41E-03100 3.27E-03 2.53E-03 1.98E-03 1.59E-03 1.56E-03 8.46E-04
Note: The calculations for these Tables are given in the Excel Appendices:temp-rh SDLT (C);temp-rh fuji DLT IV (E);temp-rh QUANTUM DLT IV (A);temp-rh ibm.