Arkansas - apers.org · From its humble beginnings in 1957 as a multi-employer defined benefit...
82
Arkansas Public Employees Retirement System Comprehensive Annual Financial Report 2010
Transcript of Arkansas - apers.org · From its humble beginnings in 1957 as a multi-employer defined benefit...

ArkansasPublic Employees Retirement System
Comprehensive Annual Financial Report 2010

A Pension Trust Fund of the State of Arkansas
Prepared byArkansas Public Employees Retirement System
124 West Capitol Avenue, Suite 400Little Rock, AR 72201
Gail H. Stone, Executive DirectorMichele Williams, Deputy Director
Comprehensive
Annual Financial ReportFor the Year EndedJune 30, 2010

P C
Public Pension Coordinating Council
Presented to
.
Presented by the Public Pension Coordinating Council, a confederation of
National Association of State Retirement Administrators (NASRA)
National Conference on Public Employee Retirement Systems (NCPERS) National Council on Teacher Retirement (NCTR)
Alan H. Winkle
Program Administrator
Public Pension Standards AwardFor Funding and Administration
2010
Arkansas Public Employees Retirement System
In recognition of meeting professional standards for plan design and administration as
set forth in the Public Pension Standards
P C

PageIntroductory SectionA History of APERS 7Membership Information 8Letter of Transmittal 9Letter from the Board Chair 12Board of Trustees 13Organizational Chart and Administrative Staff 14Professional Consultants and Investment Managers 15Financial SectionFinancial Statements: Statement of Plan Net Assets 19 Statement of Changes in Plan Net Assets 20Notes to Financial Statements: Description of the System 21 Summary of Significant Accounting Practices 23
Cash and Cash Equivalents 23Investments 24
Legally Required Reserves 29Required Supplementary Information: Schedule of Employer Contributions 31 Schedule of Funding Progress 31Supporting Schedules: District Judge Schedule of Funding Progress 32 Schedule of Investment Expense 32 Schedule of Payments for Professional Consultants 32 Schedule of Administrative Expense 33Investment SectionReport on Investments 37Outline of Investment Policies 39Actual vs. Target Asset Allocation 40Manager Distribution 41Performance Comparisons: Fiscal Years 2006 through 2010 42 Current Year and Preceding 3 - Year & 5 - Year Rates of Return 42Portfolio Characteristics 43List of Ten Largest Assets Held 44Schedule of Brokerage Commissions 45Schedule of Investment Fees 46
PageActuarial SectionActuary’s Certification Letter 49Summary of Assumptions Used in Actuarial Valuations 51Summary of Actuarial Methods and Assumptions 52Active Member Valuation Data - Comparative Statements 55Short Condition Test 57Analysis of Financial Experience 58Analysis of Financial Experience - Gains and Losses by Risk Area 59Summary of Plan Provisions (Contributory and Non-Contributory) 60Summary of Provisions - District Judges 63Statistical SectionSchedule of Revenues by Source 67Schedule of Expenses by Type 67Schedule of Benefit Expenses by Type 67Schedule of Retired Members by Type of Benefit for APERS 68Schedule of Average Benefit Paymentsfor APERS 69Statistical Graphs 70AppendixAPERS & ASPRS Combined Statement of Plan Net Assets 73APERS & ASPRS Combined Statement of Changes to Plan Net Assets 74Schedule of Participating Employers 75
Table of Contents

This Page Intentionally Left Blank

IntroductionIntroduction
A History of APERS
Membership Information
Letter of Transmittal
Letter from the Board Chair
Board of Trustees
Organizational Chart and Administrative Staff
Professional Consultants and Investment Managers

This Page Intentionally Left Blank

Introduction
Arkansas Public Employees Retirement System 7
From 1957 through 1965, county employers (Act 42 of 1959), municipal employers (Act 64 of 1961), college and university employers (Act 149 of 1963) and non-teaching public school employers (At 63 of 1965) joined the System.
With the establishment of reciprocity, service rendered to other state authorized retirement systems could be recognized for vesting in conjunction with service rendered to APERS.
Any member joining the System prior to January 1, 1978 was required to contribute a percentage of their salary to the System. However, effective January 1, 1978, all new members were no longer required to contribute to the System; only the employer contributed. All contributory members of the System were given an opportunity to remain contributory or choose to be non-contributory.
Throughout the next several years, various other non-state employers were added to the System through various legislative enactments. Act 653 of 1989 required that all newly hired public school employees be enrolled in the Arkansas Teacher Retirement System (ATRS). The School Division became a closed-plan.
In 1991, Act 757 provided for fractional service credit for members who work less than 80 hours per month. Act 975 changed the final average salary (FAS) used in the calculation of retirement benefits from five (5) years to four (4) years. Act 1137 of 1997 set the way for the FAS to be set at three (3) years. Act 1143 required adherence for retirement systems to the Qualified Domestic Relation Orders (QDRO).
Effective July 1, 1997 the vesting requirements changed from ten (10) years to five (5) years for all active and future members of the System with the exception of members of the General Assembly (Act 1356 of 1995).
A History of APERS
Highlights
From its humble beginnings in 1957 as a multi-employer defined benefit retirement plan for State of Arkansas employees, the Arkansas Public Employees Retirement System (APERS), formerly Arkansas State Employees Retirement System, has developed into a mature system that continues to satisfy the general financial objective of level contribution financing.
As of June 30, 2010, the assets of the System remained healthy at $ 4.9 billion despite a recently tough investment environment. The APERS investment program has seen rates of return that range from (20.9)% (fiscal year 2009) to 11.95%% (fiscal year 2010). The investment of these assets is allocated among numerous investment managers that include domestic equities, domestic fixed income, international equities and alternative investments (i.e. timber, real estate).
With changes in the retirement world, APERS has experienced the implementation of a Deferred Retirement Option Plan (DROP), the ability to retire at any age with 28 years actual service, the Partial Annuity Withdrawal (PAW), and the ability to purchase various types of service (i.e. federal, out-of-state, military, national guard/reserves). Enhancements to the monthly retirement annuity have included Ad Hoc increases for retirees and increases in the multipliers for active members, as well as a reduction in the years utilized to calculate the final average salary.
APERS membership has grown steadily. Our active to retired lives is approximately 1:1.8, according to the 2010 APERS Report of Actuarial Valuation and Experience Gain/(Loss). Over the next several years, we will be experiencing the “Baby Boomers” retirement and the active to retired lives is anticipated to be more like 1:1.
Introduction
Arkansas Public Employees Retirement System8
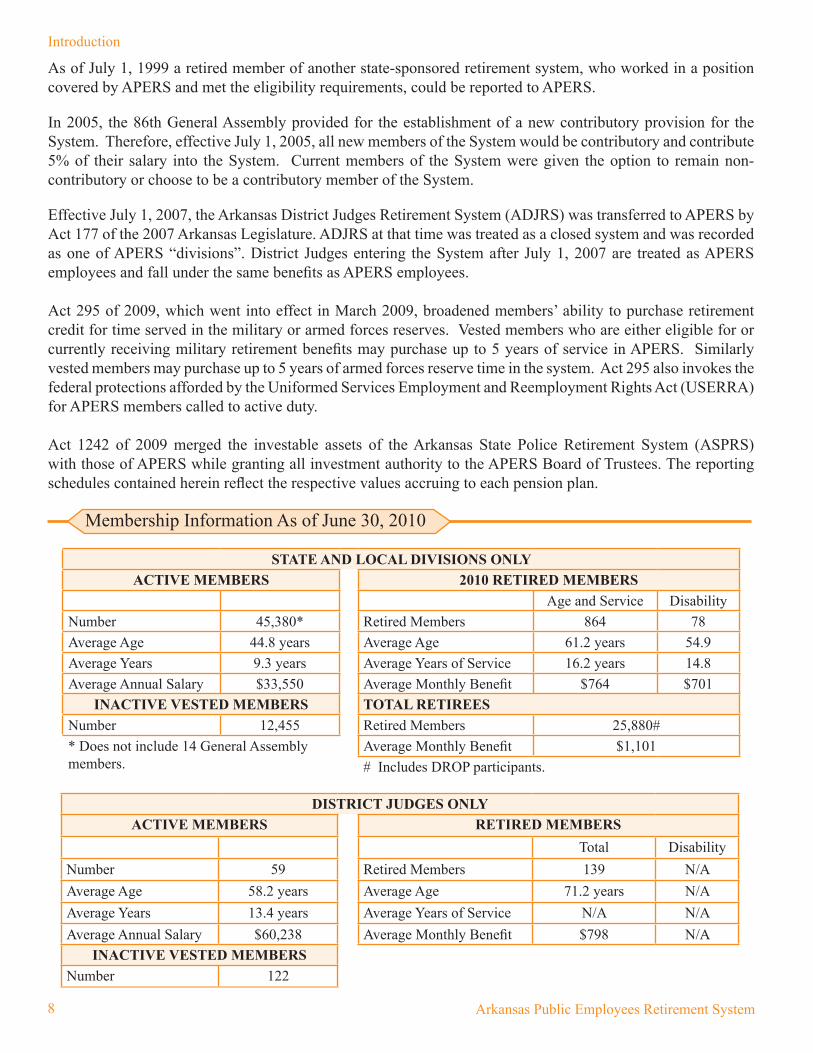
As of July 1, 1999 a retired member of another state-sponsored retirement system, who worked in a position covered by APERS and met the eligibility requirements, could be reported to APERS.
In 2005, the 86th General Assembly provided for the establishment of a new contributory provision for the System. Therefore, effective July 1, 2005, all new members of the System would be contributory and contribute 5% of their salary into the System. Current members of the System were given the option to remain non-contributory or choose to be a contributory member of the System.
Effective July 1, 2007, the Arkansas District Judges Retirement System (ADJRS) was transferred to APERS by Act 177 of the 2007 Arkansas Legislature. ADJRS at that time was treated as a closed system and was recorded as one of APERS “divisions”. District Judges entering the System after July 1, 2007 are treated as APERS employees and fall under the same benefits as APERS employees.
Act 295 of 2009, which went into effect in March 2009, broadened members’ ability to purchase retirement credit for time served in the military or armed forces reserves. Vested members who are either eligible for or currently receiving military retirement benefits may purchase up to 5 years of service in APERS. Similarly vested members may purchase up to 5 years of armed forces reserve time in the system. Act 295 also invokes the federal protections afforded by the Uniformed Services Employment and Reemployment Rights Act (USERRA) for APERS members called to active duty.
Act 1242 of 2009 merged the investable assets of the Arkansas State Police Retirement System (ASPRS) with those of APERS while granting all investment authority to the APERS Board of Trustees. The reporting schedules contained herein reflect the respective values accruing to each pension plan.
Membership Information As of June 30, 2010
STATE AND LOCAL DIVISIONS ONLYACTIVE MEMBERS 2010 RETIRED MEMBERS
Age and Service DisabilityNumber 45,380* Retired Members 864 78Average Age 44.8 years Average Age 61.2 years 54.9Average Years 9.3 years Average Years of Service 16.2 years 14.8Average Annual Salary $33,550 Average Monthly Benefit $764 $701
INACTIVE VESTED MEMBERS TOTAL RETIREESNumber 12,455 Retired Members 25,880#* Does not include 14 General Assembly members.
Average Monthly Benefit $1,101# Includes DROP participants.
DISTRICT JUDGES ONLYACTIVE MEMBERS RETIRED MEMBERS
Total DisabilityNumber 59 Retired Members 139 N/AAverage Age 58.2 years Average Age 71.2 years N/AAverage Years 13.4 years Average Years of Service N/A N/AAverage Annual Salary $60,238 Average Monthly Benefit $798 N/A
INACTIVE VESTED MEMBERS Number 122

Introduction
Arkansas Public Employees Retirement System 9
Phone (501) 682-7800 FAX Number (501) 682-7825 WATS Line 1-800-682-7377
January 6, 2011
APERS Board of TrusteesArkansas Public Employees Retirement System124 West Capitol Avenue, Suite 400Little Rock AR 72201
Dear Board Members:
It is my honor to present to you the 2010 Annual Financial Report of the Arkansas Public Employees Retirement System (“APERS” or the “System”) for the fiscal year ended June 30, 2010. The report evidences our continuing effort to provide reliable and timely information on the financial status of APERS and the changes therein for the fiscal year.
Accountability is the imperative of financial reporting. It insists that APERS resources be safeguarded and used for the benefit of all members, that transactions be executed only with the proper authorization of the board and management, and that transactions be recorded properly to permit the reporting of timely reliable financial information on the activities of the System.
Responsibility for both the accuracy of the data and completeness and fairness of the presentation, including all disclosures, rests with the management of the System. To the best of our knowledge and belief, the enclosed data is accurate in all material respects and is reported in a manner designed to present fairly the financial status of the System and changes therein.
APERS was established by legislation enacted in 1957 and has subsequently expanded to include State, County, Municipal, School, and other political subdivisions. A comprehensive list of all participating employers is provided at the end of the Statistical Section. The Summary of Plan Provisions is presented in the Actuarial Section. The mission of the System is to provide current and future retirement or survivor benefits for its members. All services provided by the staff are performed to meet that objective.
The APERS Annual Financial Report is presented in six sections: an Introductory Section, which contains the administrative organization, a letter of transmittal, and the Chairman’s report; a Financial Section, which contains the report of the independent auditors, the financial statements of the System, and required supplementary information; an Investment Section, which contains a report on investment activity, investment policies, investment results, and various investment schedules; an Actuarial Section, which contains the Actuary’s certification letter and the results of the Annual Actuarial Valuation; a Statistical Section, which includes significant trend data pertaining to the System, and an Appendix, which lists all Participating Employers as of June 30, 2010. I trust that you and the members of the System will find this annual report helpful in understanding your public employees’ retirement system - a system that continues to maintain a strong and positive financial future.
ECONOMIC CONDITION AND OUTLOOKThe economic condition of the system is based primarily upon investment earnings. For the last five years, the System’s annualized rate of return has been 2.31% The System’s investments are evaluated quarterly by Callan Associates, Inc. and compared to market indicators and comparable funds. A comparable analysis of rates of return is presented in the Investment Section.
FOR THE FUTUREThe fund recognized a positive 11.95% rate of return. As anticipated, the funding status of the retirement system moved down to 74.1% in fiscal 2010 from 78% in 2009. With the enactment in 2005 of the new employee contributory provisions, the System has enjoyed improved cash flow.

Introduction
Arkansas Public Employees Retirement System10
FUNDING A pension fund is well funded when it has enough money in reserve to meet all earned future obligations to participants. The System’s funding objective is to meet long-term benefit promises through contributions that remain approximately level as a percent of member payroll. The greater the level of funding, the larger the ratio of assets accumulated to the actuarial accrued liability and the greater level of investment potential. The advantage of a well-funded plan is that the participants can be assured that sufficient assets exist which are committed to the payment of benefits. The actuarial accrued liability and actuarial value of assets of the System as of June 30, 2010, amounted to $7.3 billion and $5.4 billion, respectively. A detailed discussion of funding is provided in the Actuarial Section of this report. Funding status and progress for the System is presented in the required supplementary information in the Financial Section.
FINANCIAL INFORMATIONThe Management of the System is responsible for maintaining a system of adequate internal accounting controls designed to provide reasonable assurance that transactions are executed in accordance with management’s general or specific authorization and are recorded as necessary to maintain accountability for assets and to permit preparation of financial statements in accordance with Generally Accepted Accounting Principals. This System includes written policies and procedures adopted by the Board of Trustees and promulgated in accordance with the State’s Administrative Procedures Act.
ADDITIONSThe reserves needed to finance retirement benefits are accumulated through the collection of employer and employee contributions and through earnings on investments. The increase for fiscal year 2010 totaled approximately $707.3 million (see Table 1).
The overall increase was approximately $1.7 billion compared to the decrease of fiscal year 2009 due primarily to higher investment earnings and somewhat higher employee and employers’ contributions. The Investment Section of this report reviews activity and the results of the investment portfolio for fiscal year 2010. The net assets of the System were $4.7 billion on June 30, 2010, an increase of approximately $ 378.7 million from 2009.
DEDUCTIONSThe primary deductions of the System included the payment of benefits to members and beneficiaries, the refund of contributions to former members, and the cost of administering the retirement system. Deductions for fiscal year 2010 totaled approximately $328.6 million (see Table 2), an increase of approximately $20.6 million over fiscal year 2009 deductions. The increase in benefit payments resulted primarily from an increase in both the number and average amount of benefits paid and cost-of-living increases granted. The net increase in Plan net assets was approximately $379 million during fiscal year 2010.
TABLE 1.
OPERATING ADDITIONS
Employer contributions $170,186,564 Employee contributions 30,334,716 Investment earnings 500,632,900 Miscellaneous additions 6,099,736
TOTAL $707,253,916
TABLE 2.
OPERATING DEDUCTIONS
Benefit payments $318,998,006 Refunds of contributions 3,586,861 Administrative expenses 5,981,358
TOTAL $328,566,225

Introduction
Arkansas Public Employees Retirement System 11
INVESTMENTSThe investments of the System are governed primarily by an investment authority known as the “Prudent Investor Rule”. The rule established a standard for all fiduciaries, which included anyone that has investment authority with respect to the fund. The Prudent Investor Rule states that in making investments, the fiduciaries shall exercise the judgment and care, under the circumstances then prevailing, which an institutional investor of ordinary prudence, discretion, and intelligence exercises in the management of large investments entrusted to it, not in regard to speculation, but in regard to the permanent disposition of funds, considering probable safety of capital as well as probable income. By permitting diversification of investments within a fund, the fund may reduce overall risks and increase returns. A summary of the asset allocation can be found in the Investment Section.
The Arkansas Investment Code permits the fund to establish an investment policy based upon certain investment criteria and allows for the delegation of investment authority to professional investment managers. The statement of investment policy outlines the responsibility for the investment of the fund and the degree of risk that is deemed appropriate for the fund. Investment managers appointed by the Board are listed in the Introductory Section. For fiscal year 2010, investments provided a positive 11.95% rate of return. The System’s annualized rate of return over the last three years was approximately a negative 5.42%.
AUDITThe System is audited each fiscal year by the Division of Legislative Audit.
ACTUARIAL SURVEY AND VALUATIONAn actuarial review of the System is performed annually. The assumptions utilized by the actuary in performing the valuation are reviewed annually by the Board. The actuarial firm, Gabriel, Roeder, Smith & Company, completed the actuarial review and valuation and served as technical advisor to the System. Actuarial certification and supporting statistics are included in the Actuarial and Statistical Sections of this report.
ACKNOWLEDGEMENTSThe compilation of this report reflects the combined efforts of the staff under the leadership of the Arkansas Public Employees Retirement System Board of Trustees. It is intended to provide extensive and reliable information for making management decisions, determining compliance with legal provisions, and determining responsible stewardship for the assets contributed by the System’s members and their employers.
We would like to take this opportunity to express our gratitude to the Board, the staff, the advisors, and the many people who have worked so diligently to ensure the successful operation and financial soundness of the Arkansas Public Employees Retirement System.
Sincerely yours,
Gail H. StoneExecutive Director

Introduction
Arkansas Public Employees Retirement System12
January 6, 2011
Dear Members:
On behalf of the Board of Trustees, I am pleased to present the APERS Annual Financial Report for the fiscal year ending June 30, 2010. The Arkansas Public Employees Retirement System continues to be in sound condition with 74% of all commitments prefunded. The assets accumulated to pay your retirement benefits are carefully invested to ensure the necessary funding when your future benefits are due to you. As Board members we serve as trustees to ensure that your interests are properly safeguarded. We have the responsibility and the mandate to provide retirement benefits to all participants commensurate with the valuable service each has rendered to the citizens of Arkansas.
Act 1242 of 2009 merged the investable assets of the Arkansas Public State Police Retirement System (ASPRS) with those of APERS beginning July 1, 2009. The retirement systems themselves remain separate entities. Thus, you will see the investment schedules broken out to reflect the market values accruing to each system. Act 1242 bestowed all investment authority on the APERS Board of Trustees.
The APERS board members are cognizant of the need to balance cost containment with the well being of the System’s membership. While APERS remains in the top quartile of public plans in terms of financial health, we will continue to seek ways to keep the costs associated with the benefit program under control. The strong investment results being reported here offset some of the expense, but prudent cost cutting will be foremost in the Board’s mind.
As Board Chair, I assure you that all of the APERS trustees have the best interests of the System and its membership in mind as we chart the future direction of the investment program and all other policy areas of the plan. As your board, we also recognize the dedication and fine work of the entire administrative staff of APERS; they are committed to delivering the highest quality service to all stakeholders.
Sincerely,
Artee Williams, ChairAPERS Board of Trustees

Introduction
Arkansas Public Employees Retirement System 13
Board Members Expiration of Term
Mr. Artee Williams, Chair March 9, 2014Executive Director, Department of Workforce ServicesState Employee Representative
Mr. Maurice Henry, Vice Chair March 9, 2012Hope Public SchoolsSchool Employee Representative
The Honorable Martha Shoffner Ex-Officio MemberState Treasurer
The Honorable Jim Wood Ex-Officio MemberState Auditor
Mr. Richard Weiss Ex-Officio MemberDirector, Department of Finance and Administration
Ms. Ouida Wright March 9, 2011Conway, ARState Employee Representative
Mr. Bill Gaddy March 9, 2013Little Rock, ARState Employee Representative
The Honorable Mike Jacobs March 9, 2015Clarksville, ARCounty Employee Representative
Mayor Charles "Stephen" Northcutt March 9, 2016Malvern, ARMunicipal Employee Representative
Board of Trustees

Introduction
Arkansas Public Employees Retirement System14
Gail Stone Executive DirectorMichele Williams Deputy DirectorJay Wills Staff AttorneyCraig Blackard Internal AuditorWilliam Dull Chief Financial OfficerCarlos Borromeo Chief Investment OfficerSusan Bowers Associate Director, InvestmentsBecky Walker Human Resources\Operations ManagerPam Stroud Member Services ManagerJon Aucoin Communications ManagerPhillip Norton Information Systems ManagerAllison Woods Member Records ManagerAbbi Bruno Retiree Services Manager
Administrative Member
Chief Finanical Officer
Internal Auditor
ServicesServices
Social SecurityAnalyst
Staff Attorney
CommunicationsHR\Operations Information
Deputy Director
Executive Director
Board of Trustees
MemberRecords
Systems
Investments
Chief InvestmentOfficer
ServicesRetiree
Organizational Chart
Administrative Staff

Introduction
Arkansas Public Employees Retirement System 15
Custodial Bank Actuary Investment ConsultantThe Bank of New York Mellon Gabriel, Roeder, Smith & Company Callan Associates, Inc.
One Mellon Center Actuaries & Consultants 300 Galleria Parkway, Suite 950500 Grant Street One Towne Square, Suite 800 Atlanta, GA 30339
Pittsburg, PA 15258 Southfield, MI 48076
State Street Global Advisors Mellon Capital Management CastleArk Management, L.L.C.3475 Piedmont Road, NE Ste 1920 One Mellon Center, Suite 4200 One North Wacker Drive, Suite 3950
Atlanta, GA 30305 Pittsburg, PA 15258 Chicago, IL 60606
National Timber Asset Management, L.L.C. SSI Investment Management Pinnacle Forest Investments, L.L.C.655 Simonds Road 9440 Santa Monica Blvd. 8th Floor 650 South Shackleford Road, Suite 400
Williamstown, MA 01267 Beverly Hills, CA 90210 Little Rock, AR 72211
Horrell Capital Management Prudential Investments, Inc. INTECH900 S. Shackleford Road, Ste 200 Two Gateway Center 525 Okeechobee Blvd., Suite 1800
Little Rock, AR 72211 Newark, NJ 07102 West Palm Beach , FL 33401
Pyramis Global Advisors INVESCO Capital Management Westwood Management Corp.900 Salem Street, OT3N1 1166 Avenue of the Americas 200 Crescent Court, Suite 1200
Smithfield, RI 02917 New York, NY 10036 Dallas, TX 75201
INVESCO Real Estate Stephens Investment Management Group Artisan PartnersThree Galleria Tower, Suite 500 9 Greenway Plaza, Suite 1900 875 East Wisconsin Avenue, Suite 800
Dallas, TX 75240 Houston, TX 77046 Milwaukee, WI 53202
UBS Global Asset Management Golden Capital Management Manning & Napier AdvisorsOne North Wacker Drive 10715 David Taylor Drive, Suite 400 655 Metro Place South, Suite 800
Chicago, IL 60606 Charlotte, NC 28262 Dublin, OH 43017
Lazard Asset Management MacKay Shields Wellington Management Company 30 Rockefeller Plaza 9 West 57th Street 280 Congress Street
New York, NY 10020 New York, NY 10019 Boston, MA 02210
Professional Consultants
Investment Managers

This Page Intentionally Left Blank

FinancialFinancial
Financial Statements: Statement of Plan Net Assets Statement of Changes in Plan Net Assets
Notes to Financial Statements: Description of the System Summary of Significant Accounting Practices
Cash and Cash EquivalentsInvestments
Legally Required Reserves
Required Supplementary Information: Schedule of Employer Contributions Schedule of Funding Progress
Supporting Schedules: District Judge Schedule of Funding Progress Schedule of Investment Expense Schedule of Payments for Professional Consultants Schedule of Administrative Expense

This Page Intentionally Left Blank

Financial Section
Arkansas Public Employees Retirement System 19
6/30/10 6/30/09ASSETS APERS APERSCash and Cash Equivalents $ 119,233,185 $ 144,370,189 Securities Lending Collateral Investments in Cash Equivs. (Notes 3 & 5) Receivables:
Dec 2004 Actuarial Liability Receivable 11,949,695 11,063,510Contributions 2,214,443 2,230,764Investment Principal Receivable 27,293,510 45,728,778Accrued Investment Income Receivable 14,878,479 12,486,745
Total Receivables 56,336,127 71,509,797Investments At Fair Value (Notes 3, 4 & 5)
Government Securities:U.S. Government Securities 56,692,011 79,110,077Futures 1,089,585 1,247,843Government Agency Securities 200,033,915 372,632,738
Corporate Securities:Collateralized Obligations 181,322,952 126,099,722Corporate Bonds 497,737,991 301,391,448Convertible Bonds 173,917,850 135,055,273Convertible Preferred Stock 35,097,199 39,503,362Common Stock 1,570,950,462 1,499,257,304Equity Index Funds 494,513,356 337,125,950Equity Co-mingled 32,510,013 30,033,865High Yield Income Fund 50,850,253 42,208,121
International Securities:Global Fixed Income Fund 3,840,549 0Government Fixed Obligations 0 13,469,217Corporate Fixed Income 9,212,260 5,156,065Equity Securities 281,549,155 264,903,613Equity Pooled Fund Units 500,233,798 448,929,500Emerging Markets 18,109,421 15,783,408Forward Contracts 79,024 (81,302)
Real Estate 166,155,640 188,073,758Timberland 294,495,311 294,367,676Municipal Bonds 5,221,420 6,961,524Commercial Loans 34,220,712 43,914,142
Total Investments 4,607,832,877 4,245,143,304Securities Lending Collateral Investments, At Fair Value (Notes 3 & 5):
Corporate Bonds 182,188,563 249,979,379Bank Obligations 130,270,736 0Asset Backed Securities 38,751,500 60,640,313Repurchase Agreements 80,043,105 112,640,635
Total Securities Lending Collateral Investments 431,253,904 423,260,327Prepaids and Other Assets 129,340 127,404Fixed Assets, Net 71,899 79,562TOTAL ASSETS 5,214,857,332 4,884,490,583LIABILITIES
Accrued Expenses and Other Liabilities 6,687,309 6,304,171Investment Principal Payable 47,661,684 104,638,383Other Post Employment Benefits (Note on page 29) 754,059 475,017Securities Lending Liability 431,253,904 423,260,327
TOTAL LIABILITIES 486,356,956 534,677,898NET ASSETS HELD IN TRUST FOR PENSION BENS. (Note 6) $4,728,500,376 $4,349,812,685 (A schedule of Funding Progress is on page 31).
APERS Statement Of Plan Net Assets
The APERS & ASPRS Combined Statement Of Plan Net Assets can be found on page 73

Financial Section
Arkansas Public Employees Retirement System20
6/30/10 6/30/09ADDITIONS APERS APERS
ContributionsEmployer $ 170,186,564 $ 159,827,501 Plan Members 30,334,716 23,722,994
Total Contributions 200,521,280 183,550,495
Investment Income:Interest 62,331,626 62,046,908Dividends 43,820,724 45,164,566Net Appreciation in Fair Value of Plan Investment 410,511,458 (1,269,800,874)Security Lending Income 2,050,050 10,670,818Real Estate Income (7,588) (70,140)Other 7,620 (62,078)
Total Investment Income 518,713,890 (1,152,050,800)Less: Investment Expense 18,080,990 21,680,124
Net Investment Income 500,632,900 (1,173,730,924)Other Sources:
Miscellaneous Additions (331,483) 3,165,392Transfer from Teachers Retirement System 6,355,482 6,344,427Miscellaneous Transfers from State Agencies 75,737 71,997
Total Other Additions 6,099,736 9,581,816TOTAL ADDITIONS 707,253,916 (980,598,613)
DEDUCTIONSBenefits 318,998,006 299,896,780Refunds of Contributions 3,586,861 2,661,289Administrative Expenses 5,981,358 5,482,554TOTAL DEDUCTIONS 328,566,225 308,040,623
NET INCREASE (DECREASE) 378,687,691 (1,288,639,236)
NET ASSETS (Note 6)Beginning of Year 4,349,812,685 5,638,451,921
End of Year $4,728,500,376 $4,349,812,685
See Notes to Financial Statements
The APERS & ASPRS Combined Statement Of Changes In Plan Net Assets can be found on page 74
APERS Statement Of Changes In Plan Net Assets

Financial Section
Arkansas Public Employees Retirement System 21
Reporting Entities
As of June 30, 2010 and 2009, the number of participating employers was as follows:
6/30/10 6/30/09
State 243 240County 85 85Municipal 164 163School 166 169District Judges 64 67District Court 39 38Other Non-State 26 26
Total 787 788
As of June 30, 2010 and 2009, membership was as follows:Retirees and beneficiaries receiving benefits (includes DROP participants) 25,880 24,972Terminated plan members entitled to but not yet receiving benefits 12,455 12,310Active plan members 45,394 44,702
A brief description of the Arkansas Public Employees Retirement System (“APERS” or the “System”) follows.
General Information - APERS is a cost-sharing, multiple employer, defined benefit pension plan established by authority of the Arkansas General Assembly with the passage of Act 177 of 1957 to provide retirement benefits for eligible employees and elected officials of state and local governmental entities in Arkansas. The laws governing operations of APERS are set forth in Arkansas Code Annotated, as Amended, Title 24, Chapter 4, with related laws in Chapter 2 and Chapter 7.
The general administration and responsibility for the proper operation of the system is vested in the nine member Board of Trustees of the Arkansas Public Employees Retirement System. Membership includes three state and three non-state employees, all appointed by the Governor, and three ex-officio trustees, including the Auditor of State, the Treasurer of State and the Director of the Department of Finance and Administration.
Reporting Entity - The executive director and administrative staff of APERS also serve as the executive director and administrative staff of two other state retirement systems, the Arkansas State Police Retirement System, and the Arkansas Judicial Retirement System. These systems do not constitute part of the APERS reporting entity under the provisions of Governmental Accounting and Financial Reporting Standards Statement No. 14, The Financial Reporting Entity, because these systems are legally separate, fiscally independent entities with separate Boards of Trustees. The nature of the relationship between these systems and APERS is merely a sharing of administrative resources, and as such, does not require inclusion of these systems in APERS financial statements.
Membership - APERS covers all state employees who are not covered by another authorized plan, all county employees, municipal employees whose municipalities have elected coverage under the System, college and university employees and certain non-teaching school employees and other public entities specifically defined by law.
Description Of The System
Notes To Financial Statements

Financial Section
Arkansas Public Employees Retirement System22
Contributions - Contribution provisions applicable to the participating employers are established by the APERS Board of Trustees, and shall be based on the actuary’s determination of the rate required to fund the Plan. The additional cost of public safety service for public safety employees is determined by the actuary as well. Administrative costs of APERS are financed through investment earnings.
APERS was established as a contributory plan. However, with the passage of Act 793 of 1977, existing members and previous members were offered the opportunity to choose to become non-contributory members. Anyone joining the System subsequent to January 1, 1978, and had not previously been a member, was automatically enrolled as a non-contributory member.
Act 2084, enacted by the 2005 General Assembly, directed APERS to establish a new Contributory plan that became effective July 1, 2005. All covered employees first hired on or after July 1, 2005, contribute 5% of their salary into the plan. Employees hired before June 30, 2005, who were in the Non-contributory system, were given the option to join the
Employer Contribution Rates
6/30/10 6/30/09State Division 11.00% 11.01%
Wildlife Subdivision 23.00% 23.01%State Capitol Police Subdivision 11.00% 11.01%Administrative Offices of the Courts Subdivision N/A 12.00%
County Division 11.00% 11.01%Municipal Division 11.00% 11.01%School Division 4.00% 4.00%
Other Non-State Division 11.00% 11.01%
new contributory system by Dec. 31, 2005. Non-contributory members who did not join the new contributory program by that deadline remain non-contributory members.
Members may have employee contributions in the system if: 1.) They were a member of APERS on or before Jan. 1, 1978; 2.) They are a member first hired after July 1, 2005, or 3.) They purchased service in the System.
Employee contributions are refundable if APERS-covered employment terminates before a monthly benefit is payable. Employee contributions remaining on deposit with APERS earn interest credits (4% per year), which are included in the refund. Pursuant to the provisions of Act 625 of 1983 and Act 1097 of 1993, certain agencies employing individuals in public safety positions are required to remit additional contributions in amounts determined by an independent actuary.
Employee refunds do not include contributions made by employers. Employer contribution rates during the fiscal year ending June 30, 2010 and 2009, are as follows:
Benefits -Benefit provisions are established by state law and may be amended only by the Arkansas General Assembly. Members are eligible for full benefits (1) at age sixty-five (65) with five (5) years of actual service, (2) at any age with twenty-eight (28) years of actual service, or (3) under the old contributory plan (prior to 7/1/05), at age sixty (60) with twenty (20) years of actual service, or at age fifty-five (55) with thirty-five (35) years of credited service. The normal retirement benefit amount, paid on a monthly basis, is determined by the member’s final average salary and the number of years of service. A member may retire with a reduced benefit at age fifty-five (55) with at least five (5) years of actual service or at any age with 25 years of actual service. APERS also provides for disability and survivor benefits.
Tax Status - During the fiscal years ended June 30, 2010 and 2009, APERS was confirmed as exempt from federal income taxes under Section 501(a) of the Internal Revenue Code.
(Continued)Notes To Financial Statements
Funded Status and Funding Progress - Pension Plans -The schedules of funding progress, presented as required sup-plementary information (RSI) following the notes to the financial statements, present multiyear trend information about whether the actuarial values of plan assets are increasing or decreasing over time relative to the AALs for benefits. The funded status of each plan as of June 30, 2010, the most recent actuarial date, is as follows (for both APERS and District Judges, dollar amounts in millions) :

Financial Section
Arkansas Public Employees Retirement System 23
Summary of Significant Accounting Practices
Cash and Cash Equivalents
Actuarial Assumptions - The information presented in the required supplementary information was determined as part of the actuarial valuations at the dates indicated. Additional information as of the latest actuarial valuation follows:
Plan
ValuationDate
June 30
(1)ActuarialValue ofAssets
(2)ActuarialAccruedLiability(AAL)
(3)Unfunded(Excess)
AAL(UAAL)(2) - (1)
(4)FundedRatio(1)/(2)
(5)AnnualCoveredPayroll
(Millions)
(6)UAAL
(Excess) AsPercentage of Covered
Payroll (3)/(5)APERS 6/30/10 $5,409 $7,304 $1,895 74% $1,523 124%District Judges 6/30/10 $11 $27 $16 42% $4 441%
Valuation Date - June 30, 2010 APERS District Judges
Actuarial Cost Method Ultimate entry age normal (state & local)Entry age normal (General Assembly)
Entry age normal
Amortization Method Level percent of payroll (state & local) Level dollar (New Plan & Paid Off Old Plan)Level dollar (General Assembly) Level dollar (Still paying Old Plan)
Remaining Amortization Period 30 years (state & local) 27 years (New Plan & Paid Off Old Plan)18 years (General Assembly) 25 years (Still paying Old Plan)
Asset Valuation Method 4-year smoothed market with 25% corridor 4-year smoothed market with 25% corridor(New Plan & Paid Off Old Plan)Market value (Still paying Old Plan)
Actuarial Assumptions: Investment Rate of Return 8.0% 8.0% Projected Salary Increases 4.7% - 10.6% 4.7% - 9.8% Wage Inflation Rate 4.0% 4.0% Cost-of-Living Adjustment 3.0% annual compounded increase 3.0% annual compounded increase on benefits
for service after January 1, 2005 Mortality Table RP-2000 Combined Mortality Table projected
to 2015, set forward 2 years for men.RP-2000 Combined Mortality Table projected to 2015, set forward 2 years for men.
Deposits are carried at cost and are included in “Cash and Cash Equivalents”. Cash and cash equivalents include demand accounts, cash in state treasury and short-term investment funds (STIF). The cash is invested in the STIF through daily sweeps of excess cash by the System’s custodial bank. The Short-term Investment Fund is a bank sponsored commingled fund which invests in U.S. Government and Agency securities and other short-term instruments. State Treasury Manage-ment Law governs the management of funds held in the State Treasury (Cash in State Treasury) and it is the responsibil-ity of the Treasurer of State to ensure the funds are adequately insured and collateralized. Cash and equivalents totaled $119,234,374 at June 30, 2010. This total consisted of cash deposits with financial institutions of $544,719, STIF accounts in the amount of $116,687,115, and $2,002,341 cash in the state treasury, and a petty cash fund of $200.
Custodial Credit Risk – Custodial credit risk for deposits is the risk that, in the event of the failure of a depository financial institution, the System will not be able to recover deposits or will be able to recover collateral securities. The System’s deposit policy is to place deposits only in collateralized or insured accounts. As of June 30, 2010 none of the System’s bank balance of $544,719 was exposed to custodial credit risk. The foreign currency cash balance of $886,169 was subject to custodial credit risk.
(Continued)Notes To Financial Statements

Financial Section
Arkansas Public Employees Retirement System24
Investments are reported at fair value as determined by the custodian bank. The bank’s determination of fair values includes, among other things, using pricing services or quotes by independent brokers at current exchange rates. As of June 30, 2010, the System had the following investments (in the schedule to the right):
• Arkansas Code Annotated 24-2-601 thru 24-2-619 authorizes the Board to Trustees of the Arkansas Public Employees Retirement System to have full power to invest and reinvest monies of the system and to hold, purchase, sell, assign, transfer or dispose of any of the investments, or proceeds of the investment in accordance with the prudent investor rule.
• Security transactions and any resulting gains or losses are accounted for on a trade basis. Net investment income includes net appreciation in the fair value of investments, interest income, dividend income and total investment expense, which includes investment management and custodial fees and all other significant investment related costs.
• The Code also states the system shall seek to invest not less than five percent (5%) nor more than ten percent (10%) of the System’s portfolio in Arkansas related investments. APERS recognizes a legal responsibility to seek to invest in the Arkansas economy, while realizing its primary, legal, and fiduciary commitment is to beneficiaries of the retirement system, under the prudent investor rule.
Asset allocation guidelines have been established as follows:
Investments Investment Type Fair ValueU.S. Government Agency Securities $ 207,978,701U.S. Government Securities 58,943,658Convertible Bonds 180,825,380Collateralized Obligations 188,524,591Municipal Bonds 5,428,800Convertible Preferred Stock 36,491,161Domestic Stock 1,633,344,212Domestic Equity Commingled 33,801,220High Yield Income Fund 52,869,883Real Estate 172,754,876Timberland 306,191,839Commercial Loans 35,579,863Domestic Equity Index Funds 514,154,040Corporate Bonds 517,506,749Futures 1,132,860International Government Fixed 3,993,085Forwards 82,163Global Corporate Fixed 9,578,145Global Equity 292,731,498International Equity Pooled Fund Units 520,101,682Emerging Markets Collateralized Obligations 347,714Emerging Markets 18,480,962
Total $4,790,843,083
Securities Lending CollateralU.S. Corporate Floating Rate $ 181,683,158Asset Backed Floating Rate 31,314,195Repurchase Agreements 83,222,193Certificate of Deposit 19,080,830Commercial Paper 66,394,348Time Deposits 48,536,000
Total 430,230,724Total Investments $5,221,073,807
Custodial Credit Risk – Custodial credit risk for investments is the risk that in the event of failure of the counterparty to a transaction, the System will not be able to recover the value of its investments or collateral securities that are in the possession of an outside party. Investment securities are exposed to custodial credit risk if the securities are uninsured, are not registered in the name of the government, and are held by either the counterparty or the counterparty’s trust department or agent but not in the System’s name. The System’s investment policy for custodial credit risk is described below. Within the System’s total $5,221,073,807 investments at June 30, 2010 there were no investments exposed to custodial credit risk.Interest Rate Risk – Interest rate risk is the risk that changes in interest rates will adversely affect the fair value of investments. Also, investments can be highly sensitive to changes in interest rates due to their terms or characteristics. The System does not have a formal investment policy that limits investment maturities as a means of managing its exposure to fair value losses arising from increased interest rates.
* See footnote at bottom of page.
**All figures on this page are a combined total of APERS & ASPRS, of which 3.82% is allocated to ASPRS**
Asset Allocation
TargetLevel
Lower Limit
Upper Limit
• Equities 46% 41% 51%• International Equities 16% 11% 21%• Fixed Income 21% 16% 26%
• Global Energy 2% 0% 7%• Alternatives 15% 10% 20%
100%

Financial Section
Arkansas Public Employees Retirement System 25
Investment Maturities (in years)Investment Type Fair Value Less Than 1 1-5 6-10 More than 10
US Government Securities $ 58,943,659 $ 0 $ 46,144,639 $ 2,777,072 $ 10,021,948US Government Agency 207,978,701 184,548 20,316,447 11,544,112 175,933,594Collateralized Obligations 188,524,590 136,065 20,797,703 10,554,410 157,036,412Convertible Bonds 180,825,380 12,783,706 104,950,515 7,738,575 55,352,584Corporate Bonds 517,506,749 15,319,327 199,147,219 191,661,205 111,378,998High Yield Income Fund 52,869,883 0 35,443,360 17,426,523 0Emerging Mkts. Coll. Obligations 347,714 0 0 347,714 0Emerging Markets 18,480,961 0 10,194,569 6,514,729 1,771,663Global Corporate Fixed 9,578,145 0 5,913,804 2,901,841 762,500Global Government Fixed 3,993,085 3,408,109 460,668 0 124,308Commercial Loans 35,579,863 0 34,280,570 1,299,293 0Municipal Bonds 5,428,800 __________0 0 5,428,800 0
Total $1,280,057,530 $ 31,831,755 $477,649,494 $258,194,274 $512,382,007
Securities Lending Collateral Fair Value Less Than 1 1-5 6-10 More than 10Asset Backed Floating Rate $ 31,314,195 $ 6,772,535 $ 3,352,498 $17,662,868 $3,526,294Corporate Floating Rate 181,683,158 89,547,018 92,136,140 0 0Certificate of Deposit 19,080,830 19,080,830 0 0 0Commercial Paper 66,394,348 66,394,348 0 0 0Repurchase Agreements 83,222,193 83,222,193 0 0 0Time Deposits 48,536,000 48,536,000 0 0 0
Total $430,230,724 $313,552,924 $95,488,638 $17,662,868 $3,526,294
Mortgage-Backed Securities – As of June 30, 2010 the System held mortgage-backed securities of approximately $121 million at fair value. The overall return or yield on mortgage-backed securities depends on the amount of interest collected over the life of the security and the change in the market value. Although the System will receive the full amount of principal if prepaid, the interest income that would have been collected during the remaining period to maturity, net of any market adjustment is lost. Accordingly, the yields and maturities of mortgage-backed securities generally depend on when the underlying mortgage loan principal and interest are repaid. If market rates fall below a mortgage loan’s contractual rate, it is generally to the borrower’s advantage to repay the existing loan and obtain new lower financing. In addition to changes in interest rates, mortgage loan prepayments depend on other factors such as loan type and geographic location of the related properties. At June 30, 2010 the System held no mortgage-backed securities that were considered as highly sensitive to changes in interest rates.
Corporate Bonds – As of June 30, 2010, the System held corporate bonds with a fair value of approximately $517 million. Corporate bonds are debt instruments that are issued by private corporations. They have a term maturity, and can have either a fixed or variable interest rate. Variable interest rate bonds have adjustments that are made periodically and vary directly with movements in interest rates. As of June 30, 2010, the System held the following security that was considered highly sensitive to changes in interest rates.
Asset-Backed Securities - As of June 30, 2010 the System held asset-backed securities with a fair value of approximately $68 million. These securities represent interests in various trusts consisting of pooled financial assets other than mortgage loans conveyed by the issuing parties. The System’s ability to recover the amount of principal invested in these securities depends on the performance and quality of the trust assets. At June 30, 2010 the System held no asset-backed securities that were considered as highly sensitive to changes in interest rates.
* See footnote at bottom of page.
**All figures on this page are a combined total of APERS & ASPRS, of which 3.82% is allocated to ASPRS**

Financial Section
Arkansas Public Employees Retirement System26
Currency % Fair ValueAustralian Dollar 3.46 $ 10,253,476Brazilian Real 2.34 6,928,214British Pound Sterling 29.43 87,122,330Canadian Dollar 0.69 2,033,853Danish Krone 0.79 2,323,704Euro Currency 30.02 88,868,466Hong Kong Dollar 2.88 8,514,285Hungarian Forint 0.00 6,584Japanese Yen 13.61 40,284,012Mexican Nuevo Peso (0.46) (1,355,951)Norwegian Krone 0.74 2,197,942New Zealand Dollar 0.23 685,756Polish Zloty 0.27 805,268Singapore Dollar 0.58 1,722,647South Korean Won 0.24 702,169Swedish Krone 0.12 360,435Swiss Franc 14.67 43,429,000Thailand Baht 0.37 1,101,223Total Fair Value 100.00% $295,983,413
Pooled Funds - APERS has approximately $520 million invested in international pooled funds. APERS could be indirectly exposed to credit and market risks associated with forward currency contracts to the extent that these pooled funds hold forward currency contracts for purposes of managing exposure to fluctuations in foreign exchange rates.
• The coupon is fixed at 7% until February 2010, and then resets to 7.9 times the difference between the 10 year and the 2 year yields. The maximum coupon over the life of the note is 11% and the minimum is 4%.
Convertible Corporate Bonds – As of June 30, 2010, the System held convertible bonds with a fair value of approximately $181 million. Convertible bonds convey an option to the bondholders to be exchanged for another asset, generally a fixed number of shares of common stock at a pre-stated price. As of June 30, 2010, the System held no convertible securities that were considered highly sensitive to changes in interest rates.
Foreign Currency Risk - A foreign currency risk is the risk that changes in exchange rates will adversely affect the fair value of an investment. The System does not have a formal investment policy for foreign currency risk. All foreign currency investments are in equities, fixed income, cash and forward contracts. The System’s exposure to foreign currency at June 30, 2010 was as follows:
Description TradeDate
MarketValue
RateCalculation
ResetDate
Bear Stearns 02/01/07 1,140,700 * *
Credit Risk – Credit risk of investments is the risk that the issuer or other counterparty will not meet its obligation. This credit risk is measured by the credit quality of investments in debt securities as described by nationally recognized statistical rating organizations. The System does not have a formal investment policy for credit risk. The System’s exposure to credit risk as rated by Standard and Poor’s (S&P) and Moody’s Investor Service as of June 30, 2010 is as follows:
**All figures on this page are a combined total of APERS & ASPRS, of which 3.82% is allocated to ASPRS**
* See footnote at bottom of page.

Financial Section
Arkansas Public Employees Retirement System 27
Standard & Poor’s Moody’s Investor Service
Rating Fair Value Rating Fair ValueAGY $ 207,978,701 AGY $ 207,978,701AAA 96,276,226 Aaa 87,846,681AA 48,888,487 Aa 65,537,325A 166,461,357 A 132,594,650BBB 315,864,640 Baa 290,082,063BB 130,820,667 Ba 166,771,582B 111,344,354 B 61,342,014CCC or below 25,714,529 C or below 14,235,969Not Rated 117,764,913 Not Rated 194,724,889Totals $1,221,113,874 Totals $ 1,221,113,874
Securities Lending Collateral Securities Lending CollateralAAA $ 25,507,610 Aaa 19,876,914AA 101,874,120 Aa 155,673,988A 200,190,448 A 146,303,663BBB N/A Baa 11,945,255BB 11,945,255 Ba N/AB 2,014,804 B 4,082,236CCC or below 3,526,294 CCC or below 7,176,475Not Rated 85,172,193 Not Rated 85,172,193Totals $ 430,230,724 Totals $ 430,230,724
The Bank of New York provided the above summaries of S&P and Moody’s ratings.* See footnote at bottom of page.
Concentration of Credit Risk – The concentration of credit risk is the risk of loss attributed to the magnitude of the System’s investment in a single issuer (not including investments issued or guaranteed by the U.S. government, investments in mutual funds or external investment pools). The System does not have a formal investment policy for concentration of credit risk. None of the System’s investments in any one issuer (other than those issued or guaranteed by the U.S. Government) represented more than five percent (5%) of total investments.
Securities Lending - Arkansas Code and the Board of Trustees policies permit the System to participate in a securities lending program. The Program is administered by Bank of New York (the “Custodian”). The legal and contractual authorization for the securities lending program is contained in the Securities Lending Discretionary Agency Agreement executed between APERS and the Custodian. For the year ended June 30, 2010 there were no violations of the Agency Agreement. Certain securities of the trust fund are loaned to participating brokers. As of June 30, 2010, types of securities loaned included U.S. Government Securities, corporate securities and international securities. Brokers who borrow the securities provide collateral in the form of cash and cash equivalents, U.S. Treasury or Government Agency securities, or letters of credit (for the marginal percent collateralization only). Collateral must be provided in the amount of 102% for domestic loans and 105% for international loans. The Custodian provides for full indemnification to the System funds for any losses that might occur in the program due to the failure of a broker to return a security that was borrowed (and if the collateral is inadequate to replace the securities lent) or failure to pay the trust funds for income of the securities while on loan. The System cannot pledge or sell collateral securities received unless the borrower defaults. Cash collateral received is invested in APERS’ name; accordingly, investments made with cash collateral appear as an asset on the Statement of Plan Net Assets. A corresponding liability is recorded as APERS must return the cash collateral to the borrower upon expiration of the loan. The loan maturity dates generally do not match the maturity dates of the investments made with cash collateral received. The cash collateral investments had an average weighted maturity of 19 days on June 30, 2010, whereas the weighted average loan maturity was 2 day. As of June 30, 2010 investments with cash collateral were approximately $295 million.
**All figures on this page are a combined total of APERS & ASPRS, of which 3.82% is allocated to ASPRS**

Financial Section
Arkansas Public Employees Retirement System28
APERS’ external investment managers anticipate that the counterparties will be able to satisfy their obligations under the contracts. Investments in limited partnerships and commingled funds may include derivatives that are not shown in any derivative totals. The external investment managers do invest in mortgage-backed securities which are reported at fair value in the Statement of Plan Net Assets, and are based on the cash flows from interest and principal payments by the underlying mortgages. Therefore, they are sensitive to prepayments by mortgages which are likely in a declining interest rate environment, therefore reducing the value of the securities. The external investment managers invest in mortgage-backed securities to diversify APERS’ portfolio and increase return while minimizing the extent of risk.
Foreign Currency Forward ContractsReceivables Notional FMV Gain/LossPayable in EUR/Receivable in USD $ (792,524.80) $ (783,985.07) $ 8,539.73 Payable in GBP/Receivable in USD (1,172,080.00) (1,196,861.67) (24,781.67)Payable in AUD/Receivable in USD (726,900.00) (711,527.74) 15,372.26 Payable in AUD/Receivable in USD (547,000.00) (546,944.56) 55.44 Payable in AUD/Receivable in USD (293,600.00) (286,515.72) 7,084.28 Payable in CAD/Receivable in USD (366,400.00) (362,493.91) 3,906.09 Payable in CAD/Receivable in USD (363,500.00) (351,985.64) 11,514.36 Payable in HUF/Receivable in USD (1,745,169.07) (1,684,260.71) 60,908.36 Payable in MXN/Receivable in USD (84,354.22) (84,161.08) 193.14 Payable in MXN/Receivable in USD (918,300.00) (906,089.23) 12,210.77 Payable in MXN/Receivable in USD (2,207,625.33) (2,159,769.94) 47,855.39 Payable in NOK/Receivable in USD (59,772.11) (58,469.08) 1,303.03 Payable in NZD/Receivable in USD (844,000.00) (820,158.28) 23,841.72 Payable in NZD/Receivable in USD (731,300.00) (723,850.28) 7,449.72 Payable in NZD/Receivable in USD (729,300.00) (732,374.16) (3,074.16)Payable in PLN/Receivable in USD (699,071.67) (675,900.70) 23,170.97 Payable in SEK/Receivable in USD (45,823.94) (45,195.99) 627.95 Total $(12,326,721.14) $(12,130,543.76) $ 196,177.38 PayablesPayable in USD/Receivable in AUD $ 694,600.00 $ 675,423.00 $ (19,177.00)Payable in USD/Receivable in AUD 566,121.31 554,520.17 (11,601.14)Payable in USD/Receivable in CAD 367,300.00 359,329.01 (7,970.99)Payable in USD/Receivable in CAD 365,500.00 350,021.67 (15,478.33)Payable in USD/Receivable in CAD 151,683.62 146,899.53 (4,784.09)Payable in USD/Receivable in GBP 1,440,738.97 1,438,135.76 (2,603.21)Payable in USD/Receivable in MXN 918,300.00 907,290.72 (11,009.28)Payable in USD/Receivable in MXN 84,194.85 84,010.46 (184.39)Payable in USD/Receivable in NZD 733,900.00 706,059.63 (27,840.37)Payable in USD/Receivable in NZD 283,919.61 278,880.80 (5,038.81)Payable in USD/Receivable in NZD 436,200.00 427,873.54 (8,326.46)Total $ 6,042,458.36 $ 5,928,444.29 $(114,014.07)
Foreign Currency Forward Contracts Notional FMV Gain/LossPending Receivables $(12,326,721.14) $(12,130,543.76) $ 196,177.38Pending Payables 6,042,458.36 5,928,444.29 (114,014.07)Total $ 82,163.31
**All figures on this page are a combined total of APERS & ASPRS, of which 3.82% is allocated to ASPRS**
GASB 53: Investment Derivatives - Derivative instruments are financial contracts or agreements whose values de-pend on the values of one or more underlying assets, reference rates, and/or financial indexes. Derivative instruments include futures contracts, forward contracts, swap contracts, options contracts, and forward foreign currency exchange. APERS, through its external investment managers, could hold such instruments. The external investment managers may enter these certain investments on behalf of APERS, primarily to enhance the performance and reduce the volatility of its portfolio. The external investment managers could enter into swaps and futures contracts to gain or hedge exposure to certain markets and to manage interest rate risk and they use forward foreign exchange contracts primarily to hedge foreign currency exposure. APERS could be exposed to risk if the counterparties to the contracts are unable to meet the terms of the contracts. APERS’ external investment managers seek to control this risk through counterparty credit evaluations and approvals, counterparty credit limits, and exposure monitoring procedures.

Financial Section
Arkansas Public Employees Retirement System 29
Other Post Employment Benefits (OPEB) - GASB 45, Accounting and Financial Reporting by Employers for Post employment Benefits Other Than Pensions (OPEB), requires that OPEB expense of proprietary and fiduciary funds should be recognized on the accrual basis in the fund financial statements. APERS is considered a fiduciary fund in the State-wide Comprehensive Annual Financial Report.The 2010 charge of $267,000 is a prorated amount from the Department of Finance and Administration based on a State-wide actuarial study. The amount charged to APERS is based on budgeted employees of the Agency and is composed of: (1) the annual required contribution (ARC) which is the normal cost and 1/30 of the unfunded actuarial accrued liability (UAAL), (2) one-year’s interest on the net OPEB, (3) adjustments to the ARC to offset the effect of actuarial amortization of past under or over contributions, and (4) minus actual contributions. The State of Arkansas 2010 CAFR will contain the complete OPEB footnote required by GASB 45.
By law, APERS must maintain reserve accounts showing each division's equity in the System’s net assets available for benefits. Act 308 of 1999 consolidated County, Municipal, School and other Non-State employers into the Local Government Division. Significant reserve accounts and a brief description of those accounts are as follows: The Members’ Deposit Account (“MDA”) represents members’ contributions held in trust until member retirement, at which time contributions are transferred to the Retirement Reserve Account, described below. The MDA Interest Reserve Account represents the accumulated interest paid on the Members Deposit Account
held in trust until member retirement, at which time interest on member contributions is transferred to the Retirement Reserve Account described below. The Employers’ Accumulation Account accumulates employers’ contributions to be used in providing the reserves required for transfer to the Retirement Reserve Account as members retire or become eligible for disability benefits. The Retirement Reserve Account is the account to which member contributions, interest on those contributions, and employer contributions are transferred upon member retirement. The Deferred Annuity Account is the amount set up to cover estimated retirement benefits to inactive vested
Legally Required Reserves
FuturesContract Expiration Notional FMV
Unrea l i zed Gain/Loss
Credit Rating
U.S. 10yr Treasury Note Sept. 2010 $ (5,346,250) $ (5,392,063) $ (45,813) AAA/AaaU.S. 2yr Treasury Note Sept. 2010 12,875,047 12,910,859 35,813 AAA/AaaU.S. 5yr Treasury Note Sept. 2010 21,333,594 21,539,984 206,391 AAA/Aaa
U.S. Treasury Bond Sept. 2010 20,201,838 20,782,500 580,662 AAA/AaaU.S. Ultra Long Bond Sept. 2010 (806,813) (814,875) (8,063) AAA/Aaa90-day Australian Bill Sept. 2010 824,285 824,224 (61) AAA/Aaa90-day Canadian B.A. Dec. 2010 245,108 246,379 1,270 AAA/Aaa
Australian 10-year Bond Sept. 2010 (350,654) 4,669 355,323 AAA/AaaNew Zealand 3-month Bill Sept. 2010 666,911 666,828 (83) AAA/Aa+
U.K. Short Gilt Sept. 2010 2,019,097 2,023,765 4,668 AAA/AaaU.K. Long Gilt Sept. 2010 $ 1,447,714 $ 1,450,466 $ 2,753 AAA/Aaa
$53,109,876 $54,242,736 $1,132,860
TBA CUSIP NotionalFair Market
ValueYears to maturity Credit Rating
FNCI TBA 4.50 CG07 D4510CG07 $ 1,190,000.00 $ 1,255,259.60 13.67 Aaa/Aaa*FNCL TBA 5.00 JP07 F5010JP07 1,340,000.00 1,417,679.80 28.59 Aaa/Aaa*GNMA TBA 5.00 BR08 G5010BR08 9,630,000.00 10,218,296.70 27.81 Aaa/Aaa*GNMA II TBA 4.50 G230J 999AA1974 1,000,000.00 1,039,220.00 30.08 Aaa/Aaa*FGOLD TBA 4.50 FG30 999ABV464 2,500,000.00 2,580,475.00 27.65 Aaa/Aaa*FNMA 30YR TBA 5.50 FN30 999ACG979 2,100,000.00 2,247,000.00 27.68 Aaa/Aaa*
$17,760,000.00 $18,757,931.10
*the above listed securities all carry an implied AAA/Aaa rating from the U.S. Government
**All figures on this page are a combined total of APERS & ASPRS, of which 3.82% is allocated to ASPRS**

Financial Section
Arkansas Public Employees Retirement System30
members who are not currently receiving benefit payments.
As a by-product of achieving level contribution financing, actuarial accrued liabilities usually become more and more funded over a period of years. Funded ratios in the 80% to 95% range are common in public sector retirement plans. The reserve strength of APERS remains strong, both by
absolute and relative measures. Sufficient assets were available to pay estimated retirement benefits applicable to retired individuals or beneficiaries currently receiving benefits and inactive vested individuals who are not currently receiving benefits. The tables below explain reserve balances for the respective divisions for the fiscal years ending June 30, 2010 and 2009.
Divisions - Respective Reserve Balances
2010 Reserve BalancesLocal Government Division
June 30, 2010 State Division CountyEmployers
MunicipalEmployers
School Employers
Non-StateEmployers
DistrictJudges
System Total
Members’ Deposit Account $ 61,973,067 $ 18,958,249 $ 10,098,908 $ 604,689 $1,143,509 $ 949,007 $ 93,727,429 MDA Interest Reserve 3,040,839 950,754 641,196 (179,162) 111,184 83,710 $4,648,521 Employer Accumulation Account 1,192,979,604 191,288,717 114,890,626 (10,890,675) 3,108,610 (7,432,414) 1,483,944,468 Retirement Reserve 1,834,237,410 431,509,103 188,418,060 244,785,909 3,650,946 1,951,855 2,704,553,283 Deferred Annuity 195,653,912 57,639,356 25,816,765 25,458,447 726,274 0 305,294,754 DROP Reserve 96,394,953 9,122,130 4,924,128 3,833,170 0 0 114,274,381 Delinquent Receivable Reserve 65 8 0 0 0 0 73 Refund Overpayment Receivable Reserve 351 0 0 0 0 0 351 Outlawed Warrants 81,319 9,097 4,241 13,032 0 0 107,689 Partial Purchase of Service Reserve 23,623 507 0 3,312 0 0 27,442 Dec 31, 2004 Accrued Liability Reserve 0 0 0 0 0 21,921,785 21,921,785 Partial Cash Reserve 200 0 0 0 0 0 200
Total $3,384,385,343 $709,477,921 $344,793,924 $263,628,722 $8,740,523 $17,473,943 $4,728,500,376
2009 Reserve BalancesLocal Government Division
June 30, 2009 State Division CountyEmployers
MunicipalEmployers
School Employers
Non-StateEmployers
DistrictJudges
System Total
Members’ Deposit Account $ 44,027,739 $ 13,332,102 $ 7,359,428 $ 746,773 $ 966,992 $ 770,093 $ 67,203,127 MDA Interest Reserve 1,981,703 564,231 403,609 (89,442) 70,329 50,872 2,981,302 Employer Accumulation Account 1,137,326,071 192,411,929 104,270,538 6,461,873 2,951,713 (7,243,177) 1,436,178,947Retirement Reserve 1,632,081,009 375,961,486 166,898,781 227,145,584 2,574,765 3,030,849 2,407,692,474 Deferred Annuity 200,361,893 53,240,433 24,387,372 25,538,790 680,375 0 304,208,863 DROP Reserve 94,430,826 7,263,769 5,231,914 3,723,827 0 0 110,650,336 Delinquent Receivable Reserve 65 8 0 0 0 0 73 Refund Overpayment Receivable Reserve 351 0 0 0 0 0 351 Outlawed Warrants 81,319 9,097 4,241 13,032 0 0 107,689 Partial Purchase of Service Reserve 29,386 909 0 8,632 0 0 38,927 Dec 31, 2004 Accrued Liability Reserve 0 0 0 0 0 20,750,396 20,750,396 Partial Cash Reserve 200 0 0 0 0 0 200
Total $3,110,320,562 $642,783,964 $308,555,883 $263,549,069 $7,244,174 $17,359,033 $4,349,812,685

Financial Section
Arkansas Public Employees Retirement System 31
The historical trend information designed to provide information about the System’s progress made in accumulating sufficient assets to pay benefits when due is required supplementary information. Required supplementary information is included immediately following the notes to the financial statements.
Note: Years prior to 1995 are not shown because such information is not available in accordance with the parameters of GASB 25.@ After legislated changes in benefit provisions; # After changes in actuarial assumptions.* Please note that differences between columns designated (1) and (2) may not add to UAAL due to rounding.
ValuationDate
June 30
(1) ActuarialValue ofAssets
(2) ActuarialAccrued
Liability (AAL)
(3) Unfunded(Excess)
AAL (UAAL)(2) - (1)
(4) FundedRatio(1)/(2)
(5) Annual Covered Payroll
(Millions)
(6) UAAL (Excess)As Percentage
of Covered Payroll(3)/(5)
6/30/95 $2,248 $2,060 $ (188) 109% $ 835 (22.5)%6/30/96 2,522 2,291 (231) 110 889 (26.0)6/30/97 2,876 2,607 (269) 110 939 (28.6)6/30/98@# 3,297 2,921 (376) 113 975 (38.6)6/30/99@ 3,712 3,479 (233) 107 1,009 (23.1)6/30/00 4,121 3,803 (318) 108 1,050 (30.3)6/30/01@ 4,342 4,111 (231) 106 1,070 (21.6)6/30/02# 4,404 4,398 (6) 100 1,112 (0.5)6/30/03# 4,416 4,674 258 95 1,148 22.56/30/04 4,438 5,005 567 89 1,176 48.26/30/05 4,584 5,323 739 86 1,215 60.86/30/05@# 4,584 5,619 1,035 82 1,215 85.26/30/06 4,949 5,936 987 83 1,267 77.96/30/07@ 5,498 6,174 676 89 1,303 51.96/30/08# 5,866 6,543 677 90 1,380 49.16/30/09@ 5,413 6,938 1,525 78 1,434 106.36/30/10 5,409 7,304 1,895 74 1,523 124.4
GASBStatementsNo. 25 & No. 27APERSScheduleof FundingProgress
APERS District Judges
FiscalYear
AnnualRequired
ContributionPercentageContributed
FiscalYear
AnnualRequired
ContributionPercentageContributed
1995199619971998199920002001200220032004200520062007200820092010
$ 75,028,320 76,772,911 82,050,663 87,528,945 93,322,444 96,348,947 100,925,338 109,037,491 115,690,798 118,419,346 135,027,447 158,152,183163,223,695173,462,377159,232,361169,604,041
100%100100100100100100100100100100100100100100100
200520062007200820092010
**
$ 357,1821,859,1391,732,3681,525,1671,581,1001,915,640
102110 10611010293
%
* 2005 and 2006 information was taken from the report of the previous actuary and was not audited by GRS.
Schedule of Employer Contributions
(Dollars in Millions)
Required Supplementary Information

Financial Section
Arkansas Public Employees Retirement System32
For fees paid to investment managers, please see “Schedule of Investment Fees” shown on page 46 in the Investment Section of this report.Total Investment Expense includes international withholding taxes which are not included in the “Schedule of Investment Fees.”
6/30/10 6/30/09Gabriel, Roeder, Smith & Company $124,625 $169,000
Other 0 300
Total Payments for Professional Consultants $124,625 $169,300
6/30/10 6/30/09
Investment consultant fee $ 210,000 $ 200,000 Money manager fees 17,694,320 14,310,229Custodian bank fees 500,752 388,846International withholding taxes 383,275 98,488Securities lending expenses 10,358 6,582,250Organizational expense: Timber 0 100,311TOTAL INVESTMENT EXPENSE $18,798,705 $21,680,124
GASB StatementsNo. 25 and No. 27District Judges Schedule of Funding Progress
ValuationDate
June 30
(1)ActuarialValue ofAssets
(2)Entry AgeActuarialAccruedLiability(AAL)
(3)Unfunded(Excess)
AAL(UAAL)(2) - (1)
(4)FundedRatio(1)/(2)
(5)AnnualCoveredPayroll
(Millions)
(6)UAAL
(Excess) AsPercentageof Covered
Payroll(3)/(5)
12/31/04 $ 0 $ 0 $ 0 100% $1,841,022 0%6/30/05 7,569,919 24,134,114 16,564,195 31 3,222,495 5146/30/06 10,141,040 24,943,381 14,802,341 41 3,313,454 4476/30/07 12,582,548 24,387,433 11,804,885 52 3,366,861 3516/30/08 12,398,225 24,833,415 12,435,190 50 3,526,319 3536/30/08@ 12,398,225 24,797,303 12,399,078 50 3,526,319 352
6/30/09 10,004,394 25,671,893 15,667,499 39 3,368,169 4656/30/10 11,112,521 26,775,249 15,662,728 42 3,554,044 441
@ After changes in actuarial assumptions and methods.
Supporting Schedule - Schedule of Investment Expense
Supporting Schedule - Schedule of Payments For Professional Consultants
Required Supplementary Information

Financial Section
Arkansas Public Employees Retirement System 33
6/30/10 6/30/09PERSONNEL SERVICES:Salaries and wages $2,847,508 $2,542,877 Employee benefits 499,873 449,296 Post Employment Benefits 279,043 267,008 Insurance 346,320 289,800 Other 10,346 9,719 Total Personnel Services 3,983,090 3,558,700
COMMUNICATIONS:Postage 143,109 147,176 Telecommunications 46,190 38,950 Printing and advertising 58,394 39,020 Freight and Express 760 958 Subscriptions and publications 2,458 5,234 Total Communications 250,911 231,338
PURCHASES:Office Supplies 59,719 33,702 Equipment 5,776 45,188 Total Purchases 65,495 78,890
SERVICES AND CHARGES:Professional fees and services 209,650 169,300 Rent expense 611,126 510,794 Travel and conference fees 27,647 23,624 Taxes, licenses and permits 279 279 Repairing and servicing 90,953 119,039 Training fees 0 0 Insurance and surety bonds 5,035 55,141 Bank and federal service charges 33,246 33,367 Data processing charges 690,987 684,200 Claims commission expense 0 1,448 Total Services and Charges 1,668,923 1,597,192
DEPRECIATION EXPENSE 12,939 16,434
TOTAL ADMINISTRATION EXPENSES $5,981,358 $5,482,554
Supporting Schedule - Schedule of Administrative Expense

This Page Intentionally Left Blank

InvestmentsInvestments
Report on Investments
Outline of Investment Policies
Actual vs. Target Asset Allocation
Manager Distribution
Performance Comparisons: Fiscal Years 2006 through 2010 Current Year and Preceding 3 - Year & 5 - Year Rates of Return
Portfolio Characteristics
List of Ten Largest Assets Held
Schedule of Brokerage Commissions
Schedule of Investment Fees

This Page Intentionally Left Blank
Investment Section
Arkansas Public Employees Retirement System 37

Investment Section
Arkansas Public Employees Retirement System38

Investment Section
Arkansas Public Employees Retirement System 39
The investment objective shall be: (1) the protection of the APERS’ Fund (the “Fund”) so that such assets are preserved for providing benefits to participants and their beneficiaries; and (2) to maximize total return - either in the form of income or capital appreciation or both - consistent with prudent risk taking on the amounts available to provide such benefits. For this purpose, short-term fluctuations in value shall be considered secondary to long-term investment results. The long-term return objective for the Fund shall be to achieve a real rate of return of 3.5%. This is the return over the rate of inflation (as measured by the Consumer Price Index). This objective is not to be a goal from year to year, but is intended as a long-term guideline to those involved in investing the Fund’s assets. An additional overall investment objective will be to achieve a total fund return of at least the actuarial rate of 8%. The investments of the Fund shall be so diversified as to minimize the risk of large losses, unless under particular circumstances it is clearly prudent not to do so. Investments will be further diversified by hiring an appropriate number of managers whose investment styles are varied enough to provide a balance to the overall risk of the Fund.
The Board of Trustees shall review its asset allocation at least annually to determine if the asset allocation is consistent with the level of risk and volatility acceptable to the Fund.
Investment Objectives Review Of Investment Process
Asset Allocation
Asset Allocation
TargetLevel
Lower Limit
Upper Limit
• Equities 46% 41% 51%• International Equities 16% 11% 21%• Fixed Income 21% 16% 26%
• Global Energy 2% 0% 7%• Alternatives 15% 10% 20%
100%
Outline of Investment Policies
To avoid extreme exposure to investment risk, the following percentages represent the minimum and maximum portion at market of the portfolio that may be invested by types:
A. On a timely basis, but not less than twice a year, the Board will review actual investment results achieved by each manager (with a perspective toward a three to five-year time horizon or a peak-to-peak or trough-to-trough market cycle) to determine whether:
1. The investment managers performed in adherence to the investment philosophy and policy guidelines; and
2. The investment managers performed satisfactorily when compared with the objectives set and other similarly managed funds.
B. In addition to reviewing each investment manager’s results, the Board will re-evaluate, from time to time, its progress in achieving the total fund, equity, fixed-income and international equity segments objectives.
C. The periodic re-evaluation also will involve an evaluation of the continued appropriateness of:
1. The manager structure;
2. The allocation of assets among the managers; and
3. The investment objectives for the Fund’s assets.
D. The Board may appoint investment consultants to assist in the ongoing evaluation process. The consultants selected by the Board are expected to be familiar with the investment practices of other similar retirement plans and will be responsible for suggesting appropriate changes in the Fund’s investment program over time.

CAI Public Plan Sponsor Database
The graph to the left shows the Fund’s asset allocation as of June 30, 2010. The yellow column represents the Actual asset allocation; the blue column represent the Target asset allocation as outlined in the investment policy statement.
The chart to the right shows the average percentage of Actual asset allocations compared to percentage of asset allocations for the CAI Public Plan Sponsor Database.
Due to different asset allocation of Public Plans, percentages will not equal 100%.
Actual Asset vs. Target Asset AllocationInvestment Section
Arkansas Public Employees Retirement System40
The table below gives a further breakdown of the asset allocations, showing the difference in percentage and actual dollar amounts between the Actual and Target allocations.
* Total assets does not include cash at local bank and non-investment receivables.* Columns may not total due to rounding
Asset Class(At Fair Value)
$000sTotal
6/30/2010APERS
6/30/2010ASPRS
PercentActual
PercentTarget
PercentDifference
$000sDifference
Domestic Equity $2,302,676 $2,214,626 $ 88,050 46.90% 46.00% 0.90 % $45,118 International Equity 788,867 758,702 30,165 16.10 16.00% 0.10 % 3,629Fixed Income 1,141,596 1,097,944 43,652 23.30 21.00% 2.30 % 110,971Alt. Investments 569,340 547,570 21,770 11.60 15.00% (3.40)% (166,820)Cash 16,931 16,284 647 0.30 0.00% 0.30 % 16,931Global Energy 88,325 84,948 3,377 1.80 2.00% (0.20)% (9,829)
Total* $4,907,735 $4,720,073 $187,662 100.00% 100.00%
50.0%
45.0%
40.0%
35.0%
30.0%
25.0%
20.0%
15.0%
10.0%
5.0%
0.0%
46.9%
40.8%
16.1% 16.0%
23.3%
1.8%0.0%
1.4%0.3%
9.4%11.6%
30.8%
Actual Asset AllocationPublic Fund Sponsor Database
Domestic Equity
InternationalEquity
Domestic Fixed Income
AlternativeInvestments
Other GlobalEnergy
50.0%
45.0%
40.0%
35.0%
30.0%
25.0%
20.0%
15.0%
10.0%
5.0%
0.0%
46.9%46.0%
16.1% 16.0%
23.3%
1.8% 2.0%0.3% 0.0%
15.0%
11.6%
21.0%
Actual Asset AllocationTarget Asset Allocation
Domestic Equity
InternationalEquity
Domestic Fixed Income
AlternativeInvestments
Other GlobalEnergy

Investment Section
Arkansas Public Employees Retirement System 41
Manager Distribution
TotalMarket Value Percent 6/30/2010 6/30/2010
Asset Allocation ($ Thousands) Of Total APERS ASPRSDomestic Equity (2,302,676,284 - 46.92%)
MCM S&P Index Fund 514,154,055 10.48% $ 494,493,801 $ 19,660,254 CastleArk Management 234,203,108 4.77% $ 225,247,636 $ 8,955,472 Golden Capital Management 98,574,911 2.01% $ 94,805,598 $ 3,769,313 INTECH 163,943,791 3.34% $ 157,674,898 $ 6,268,893 Wellington Mgmt. Co. 212,210,281 4.32% $ 204,095,772 $ 8,114,509 Westwood Mgmt. 219,152,704 4.47% $ 210,772,730 $ 8,379,974 INVESCO 191,532,212 3.90% $ 184,208,392 $ 7,323,820 Lazard Asset Mgmt. 195,212,772 3.98% $ 187,748,214 $ 7,464,558 SSI Investment Management 211,816,988 4.32% $ 203,717,517 $ 8,099,471 CastleArk Mgmt - AR Energy Fnd. 43,497,426 0.89% $ 41,834,169 $ 1,663,257 UBS Global Asset Mgmt. 45,059,090 0.92% $ 43,336,118 $ 1,722,972 Horrell Capital Mgmt. 42,769,694 0.87% $ 41,134,264 $ 1,635,430 State Street Global Advisors 33,801,220 0.69% $ 32,508,727 $ 1,292,493 Stephens Inv. Mgmt. Group 96,440,999 1.97% $ 92,753,282 $ 3,687,717 Transition Account 307,033 0.01% $ 295,293 $ 11,740
International Equity (788,866,727 - 16.07%)Lazard Asset Mgmt. 153,037,400 3.12% $ 147,185,547 $ 5,851,853 Artisan Partners 139,458,801 2.84% $ 134,126,167 $ 5,332,634 UBS Global Asset Mgmt. 136,332,728 2.78% $ 131,119,629 $ 5,213,099 Manning & Napier 152,053,693 3.10% $ 146,239,455 $ 5,814,238 Pyramis Global Advisors 207,464,667 4.23% $ 199,531,621 $ 7,933,046 Tradewinds Global Inv 65,161 0.00% $ 62,669 $ 2,492 RiverSource 454,277 0.01% $ 436,906 $ 17,371
Fixed Income (1,141,595,602 - 23.26%)
MacKay Shields 771,266,546 15.72% $ 741,774,810 $ 29,491,736 Prudential Investments 367,418,382 7.49% $ 353,369,016 $ 14,049,366 Aberdeen Asset Mgmt. 2,910,673 0.06% $ 2,799,375 $ 111,298
Alternative Investments (569,340,181 - 11.60%)INVESCO Real Estate 174,010,995 3.55% $ 167,357,152 $ 6,653,843 Pinnacle Forest Investments 196,783,400 4.01% $ 189,258,785 $ 7,524,615 National Timber Asset Mgmt. 109,408,440 2.23% $ 105,224,874 $ 4,183,566 INVESCO REITS 89,137,347 1.82% $ 85,728,908 $ 3,408,439
Global Energy Fund (88,325,421 - 1.80%)CastleArk Management 88,325,421 1.80% $ 84,948,028 $ 3,377,393
Short-term Investment Fund 16,930,621 0.35% $ 16,283,227 $ 647,394
COMPOSITE FUND 4,907,734,835 100.00% $ 4,720,072,576 $ 187,662,259
*Columns may not total due to rounding

Investment Section
Arkansas Public Employees Retirement System42
Fiscal Years Ended June 30 6/30/10 6/30/09 6/30/08 6/30/07 6/30/07Total Fund:Arkansas Public Employees Retirement System 11.95% (20.89)% (4.45)% 18.01 % 12.24 %Callan Total Public Fund Median 12.57 (18.00) (4.65) 17.32 10.43Inflation (Consumer Price Index) 1.36 (1.98) 5.55 2.67 4.47Equities:Arkansas Public Employees Retirement System 15.69% (25.74)% (8.74)% 20.01 % 10.61 %Callan Total Equity Database Median 16.98 (26.11) (12.02) 20.09 11.63Standard & Poor's 500 Index 14.43 (26.21) (13.12) 20.59 8.63International Equities:Arkansas Public Employees Retirement System 7.04% (32.31)% (9.27)% 25.11 % 25.91 %Callan Total Non-US Equities Database Median 8.96 (30.89) (8.63) 27.82 27.80MSCI-EAFE Index 5.92 (31.35) (10.61) 27.00 26.56Fixed Income:Arkansas Public Employees Retirement System 15.19% 2.70 % 4.43 % 7.11 % 0.20 %Callan Total Fixed Income Database Median 11.04 5.11 5.90 6.16 0.30Barclays Capital Aggregate Index 9.50 6.05 7.12 6.12 (0.81)
Returns Reported Gross of Fees
Source: Callan Associates Inc. (Callan database contains returns of over 115 Public retirement funds).
AnnualizedFiscal Years Ended June 30 6/30/10 3-Year 5-YearTotal Fund:Arkansas Public Employees Retirement System 11.95% (5.42)% 2.31 %Callan Total Public Fund Median 12.57 (3.97) 2.84Inflation (Consumer Price Index) 1.36 1.60 2.38Equities:Arkansas Public Employees Retirement System 15.69% (7.79)% 0.80 %Callan Total Equity Database Median 16.98 (8.17) 0.76Standard & Poor's 500 Index 14.43 (9.81) (0.79)International Equities:Arkansas Public Employees Retirement System 7.04% (13.05)% 0.70 %Callan Total Non-US Equities Database Median 8.96 (11.24) 2.39MSCI-EAFE Index 5.92 (13.38) 0.88Fixed Income:Arkansas Public Employees Retirement System 15.19% 7.30 % 5.80 %Callan Total Fixed Income Database Median 11.04 7.55 5.77Barclays Capital Aggregate Index 9.50 7.55 5.54
Source: Callan Associates Inc. (Callan database contains returns of over 115 Public retirement funds).
Returns Reported Gross of Fees
Performance Comparison Current Year and Preceding 3-Year & 5-Year Rates of Return
Performance Comparisons For Fiscal Years Ended 6/30/06 through 6/30/10

Investment Section
Arkansas Public Employees Retirement System 43
6/30/10 6/30/09Selected Bond Characteristics:
Yield to Maturity (Market) 4.74% 6.70 %Current Yield 4.84 6.18 Average Coupon Rate 5.18 5.91 Average Maturity 6.06Yrs. 6.52 Yrs.
Quality Breakdown:AAA (Includes Govts. & Agencies) 30.50% 53.60 %AA 5.40 4.60 A 11.30 9.90 BAA 29.90 18.40 BA 9.80 4.60 B 6.10 4.70 CCC Below & NR 2.30 1.60 *Cash 4.70 2.60
Selected Stock Characteristics:Average P/E Ratio 14.57x 15.40 xEstimated Earnings Growth Rate (Next 5 Years) 11.07% 11.55 %Current Yield 1.90 1.87
* Includes Short Term Investment Fund
Portfolio Characteristics
Source: Callan Associates Inc.

Investment Section
Arkansas Public Employees Retirement System44
List of Ten Largest Assets Held
Domestic Fixed Income Holdings (By Market Value)
Par SecurityTotal Market
Value6/30/10APERS
6/30/10ASPRS
1) 6,133,333 U.S. Treasury Note 0.75% 11/30/2011 $ 6,156,333 $ 5,920,927 $ 235,406 2) 4,400,000 U.S. Treasury Note 2.50% 03/31/2015 4,559,324 4,384,984 174,340 3) 3,333,333 Fed Nat'l Mtg Assn Debs 4.625% 10/15/2014 3,718,767 3,576,569 142,198 4) 3,210,000 GNMA 30yr TBA 5.00% 08/15/2040 3,406,099 3,275,856 130,243 5) 1,803,333 Dow Chemical Co. 8.55% 05/15/2019 2,207,478 2,123,068 84,410 6) 1,833,333 Bank America Corp 5.42% 03/15/2017 1,826,550 1,756,706 69,844 7) 1,666,667 Federal Home Loan Mtg Corp 4.50% 01/15/2013 1,814,067 1,744,701 69,366 8) 1,666,667 U.S. Treasury Note 1.00% 08/31/2011 1,677,467 1,613,324 64,143 9) 1,501,028 Fed Nat'l Mtg. Assn. Pool # 0950701 6.50% 10/01/2037 1,646,298 1,583,347 62,951
10) 1,533,680 Fed Nat'l Mtg. Assn. Pool # 0257233 4.50% 06/01/2023 1,622,510 1,560,468 62,042 Total $28,634,893 $27,539,950 $1,094,943
Domestic Equity Holdings (By Market Value)
Par SecurityTotal Market
Value6/30/10APERS
6/30/10ASPRS
1) 168,900 International Business Machine $ 20,855,772 $ 20,058,288 $ 797,484 2) 1,430,800 Pfizer Inc 20,403,208 19,623,029 780,179 3) 80,600 Apple Inc 20,273,318 19,498,106 775,212 4) 848,726 Microsoft Corp 19,529,185 18,782,427 746,758 5) 309,179 Exxon Mobil Corp 17,644,846 16,970,141 674,705 6) 326,746 Hewlett-Packard Co 14,141,567 13,600,821 540,746 7) 224,673 Pepsico Inc 13,693,819 13,170,194 523,625 8) 277,715 Conocophillips 13,633,029 13,111,728 521,301 9) 520,600 Wells Fargo & Co 13,327,360 12,817,748 509,612
10) 547,165 AT&T Inc 13,235,921 12,729,805 506,116 Total $166,738,025 $160,362,286 $6,375,739
International Equity Holdings (By Market Value)
Par SecurityTotal Market
Value6/30/10APERS
6/30/10ASPRS
1) 191,363 Covidien Plc $ 7,688,965 $ 7,394,954 $ 294,011 2) 855,044 Experian Plc 7,496,296 7,209,652 286,644 3) 277,276 Unilever Plc 7,411,587 7,128,182 283,405 4) 257,900 Amdocs Ltd 6,924,615 6,659,831 264,784 5) 137,043 Novartis Ag 6,684,714 6,429,104 255,610 6) 131,123 Adecco SA 6,292,591 6,051,975 240,616 7) 793,550 Reed Elsevier Ord 5,924,278 5,697,745 226,533 8) 208,255 Signet Jewelers Limited 5,727,013 5,508,023 218,990 9) 7,058,982 Lloyds Banking Group Plc 5,671,226 5,454,369 216,857
10) 145,737 Accenture Plc Ireland 5,632,735 5,417,350 215,385 Total $65,454,020 $62,951,185 $2,502,835

Investment Section
Arkansas Public Employees Retirement System 45
Brokerage FirmNumber of
Shares TradedTotal
CommissionCommission
Per Share
6/30/10APERS
Commission
6/30/10ASPRS
Commission
Barclays Capital Inc. 435,681 $ 7,099,891 0.06 $ 6,828,405 $ 271,486 Goldman Sachs & Co. 414,442 8,677,562 0.05 8,345,749 331,813 ITG Inc. 308,618 7,591,491 0.04 7,301,207 290,284 Liquidnet Inc. 273,152 7,846,840 0.03 7,546,792 300,048 Credit Suisse First Boston 247,426 8,250,837 0.03 7,935,341 315,496 Morgan Stanley & Co. Inc. 237,059 4,031,891 0.06 3,877,719 154,172 Deutsche Bank Securities Inc. 230,863 5,176,705 0.04 4,978,758 197,947 Citigroup Global Markets Inc. 194,781 3,376,913 0.06 3,247,786 129,127 Instinet, LLC 187,873 7,325,644 0.03 7,045,526 280,118 Pickering Energy Partners 166,857 2,900,100 0.06 2,789,206 110,894 Simmons & Co., Inc. 165,685 2,898,174 0.06 2,787,353 110,821 Jefferies & Co., Inc. 153,238 6,477,681 0.02 6,229,987 247,694 J. P. Morgan Securities Inc. 139,513 2,784,969 0.05 2,678,477 106,492 Societe Generale Securities Corp. 139,148 1,792,630 0.08 1,724,083 68,547 Sanford C. Bernstein & Co., LLC 102,993 2,730,613 0.04 2,626,200 104,413 UBS Securities LLC 100,339 3,829,943 0.03 3,683,493 146,450 Merrill Lynch, Pierce, Fenner & Smith Inc. 88,611 3,250,499 0.03 3,126,206 124,293 William Blair & Co., LLC 88,261 1,774,322 0.05 1,706,475 67,847 RBC Capital Markets Corp. 67,456 1,717,230 0.04 1,651,566 65,664 Macquarie Securities (USA) INC 65,468 1,462,676 0.04 1,406,746 55,930 ISI Group Inc 65,205 1,189,511 0.05 1,144,026 45,485 Stifel, Nicolaus & Co., Inc. 61,777 1,164,938 0.05 1,120,393 44,545 Howard Weil Inc. 61,567 1,042,797 0.06 1,002,922 39,875 Baird, Robert W & Co. Inc. 49,402 1,097,873 0.04 1,055,892 41,981 BNY Convergex 47,059 2,705,373 0.02 2,601,925 103,448 Others (including 80 brokerage firms) 702,181 19,534,344 0.04 18,787,389 746,955 Total 4,794,654 $117,731,447 $113,229,625 $4,501,822
Schedule of Brokerage Commissions

Investment Section
Arkansas Public Employees Retirement System46
Total Basis Points
6,30/10APERS
6,30/10ASPRS
Equities Market Value Fee Market Value Fees Market Value Fees
SSI Investment Management $ 211,816,988 $ 854,290 40 $ 203,717,517 $ 821,624 $ 8,099,471 $ 32,666 INVESCO - Value 191,532,212 556,838 30 184,208,392 535,546 7,323,820 21,292 Lazard Asset Mgmt. - Value 195,212,772 626,207 30 187,748,214 602,262 7,464,558 23,945 Golden Capital Mgmt - Growth 98,574,911 231,892 22.5 94,805,598 223,025 3,769,313 8,867 Westwood Mgmt. - SMID Cap 219,152,704 1,337,298 25 210,772,730 1,286,162 8,379,974 51,136 J & W Seligman - Growth 0 357,956 30 0 344,268 0 13,688 MCM S&P 500 Index Fund 514,154,055 116,106 3.5 494,493,801 111,666 19,660,254 4,440 INTECH - Growth 163,943,791 932,357 47 157,674,898 896,705 6,268,893 35,652 CastleArk Mgmt. - Growth 234,203,108 862,633 35 225,247,636 829,648 8,955,472 32,985 Wellington Mgmt. Co. - Value 212,210,281 674,754 30 204,095,772 648,953 8,114,509 25,801 Stephens Investment Mgmt. - Growth 96,440,999 761,083 77 92,753,282 731,981 3,687,717 29,102 CastleArk Mgmt. - AR Energy Fund 43,497,426 595,210 125 41,834,169 572,450 1,663,257 22,760 State Street Global Advisors - 130/30 33,801,220 176,476 50 32,508,727 169,728 1,292,493 6,748 UBS Global Asset Mgmt. - GTAA 45,059,090 357,212 90 43,336,118 343,553 1,722,972 13,659 Horrell Capital Mgmt.-AR Index Fund 42,769,694 121,781 20 41,134,264 117,124 1,635,430 4,657 Lazard Asset Mgmt - Int'l Equity 153,037,400 549,635 65 147,185,547 528,618 5,851,853 21,017 Manning & Napier Advisors - Int'l Equity 152,053,693 885,832 55 146,239,455 851,960 5,814,238 33,872 Pyramis Global Advisors - Int'l Equity 207,464,667 455,435 20 199,531,621 438,020 7,933,046 17,415 Tradewinds Global Investors - Int'l Equity 0 266,525 55 0 256,333 0 10,191 UBS Global Asset Mgmt - Int'l Equity 136,332,728 773,572 50 131,119,629 743,992 5,213,099 29,580 Artisan Partners 139,458,801 389,107 80 134,126,167 374,229 5,332,634 14,879 MCM DV Int'l Stock Index Fund 0 4,900 0 4,713 0 187 Total Equity $3,090,716,540 $11,887,099 $2,972,533,536 $11,432,559 $118,183,004 $454,540
Global Energy
CastleArk Management $ 88,325,421 $ 523,274 100 $ 84,948,028 $ 503,265 $ 3,377,393 $ 20,009 Total Global Energy $ 88,325,421 $ 523,274 $ 84,948,028 $ 503,265 $ 3,377,393 $ 20,009
Fixed IncomeAberdeen Asset Mgmt. - Core Plus $ 0 $ 75,444 20 $ 0 $ 72,559 $ 0 $ 2,885 MacKay Shields - Core Plus I 374,279,420 735,905 20 359,967,702 707,765 14,311,719 28,140 MacKay Shields - Core Plus II 396,987,126 581,937 15 381,807,108 559,685 15,180,017 22,252 Prudential Investments - Core Plus 367,418,382 720,358 20 353,369,016 692,813 14,049,366 27,545 Total Fixed Income $1,138,684,928 $ 2,113,644 $1,095,143,825 $ 2,032,822 $ 43,541,103 $ 80,822
AlternativesPinnacle Forest Investments – Timberland $ 196,783,400 $ 1,566,219 90 $ 189,258,785 $ 1,506,330 $ 7,524,615 $ 59,889 INVESCO Real Estate-Core & Global REITS 263,148,342 1,604,084 65 253,086,060 1,542,747 10,062,282 61,337 Total Alternatives $ 459,931,742 $ 3,170,303 $ 442,344,844 $ 3,049,077 $ 17,586,898 $121,226
Other Investment ServicesBank of New York Mellon (Custodian) 500,752 $ 481,604 $ 19,148 Bank of New York Mellon (Securities Lending) 10,358 9,962 396Callan Associates (Consultant) 210,000 201,970 8,030 Total Other Services 721,110 693,536 27,574
Total Investment Service Fees $18,415,430 $17,711,259 $704,171
Schedule of Investment Fees

ActuarialActuarial
Actuary’s Certification Letter
Summary of Assumptions Used In Actuarial Valuations
Summary of Actuarial Methods and Assumptions
Active Member Valuation Data - Comparative Statements
Short Condition Test
Analysis of Financial Experience
Analysis of Financial Experience - Gains and Losses by Risk Area
Summary of Plan Provisions (Contributory and Non-Contributory)
Summary of Provisions - District Judges

This Page Intentionally Left Blank
Actuarial Section
Arkansas Public Employees Retirement System 49

Actuarial Section
Arkansas Public Employees Retirement System50

Actuarial Section
Arkansas Public Employees Retirement System 51
The investment return rate used in making the valuation was 8.00% per year, compounded annually (net after investment and administrative expenses).
This rate of return is not the assumed real rate of return. The real rate of return is the portion of investment return which is more than the wage inflation rate. Considering the assumed wage inflation rate of 4.00%, the 8.00% investment return rate translates to an assumed net real rate of return of 4.00%. This rate of assumption was first used for the June 30, 2002 valuation and for the District Judges division for the June 30, 2007 valuation.
Pay increase assumptions for individual active members are shown on page 53. Part of the assumption for each age
is for a merit and/or seniority increase, and the other 4.00% recognizes inflation. This assumption was first used for the June 30, 2008 valuation and for the District Judges division for the June 30, 2007 valuation.
Total active member payroll is assumed to increase 4.00% per year, which is the portion of the individual pay increase assumptions attributable to wage inflation. This assumption was first used for the June 30, 2002 valuation and for the District Judges division for the June 30, 2007 valuation.
The number of active members is assumed to continue at the present number.
The mortality table used to measure retired life mortality was the RP-2000 Combined Mortality Table projected to 2015, set forward 2 years for men. Related values are shown on page 52. This table was first used for the June 30, 2008 valuation.
The probabilities of withdrawal from service, death-in-service, and disability are shown for sample ages on page 53. These probabilities were first used for the June 30, 2008 valuation and for the District Judges division for the June 30, 2007 valuation.
The probabilities of retirement for members eligible to retire are shown for sample ages on page 54. These probabilities were first used for the June 30, 2008 valuation and for the District Judges division for the June 30, 2007 valuation.
The ultimate entry age normal actuarial cost method of the valuation was used in determining liabilities and normal cost (not including the District Judges division). The normal cost is based on the benefits and contribution rate applicable to new hires. While 5.0% of member contributions are assumed in developing the employer normal cost, until such time as all members become contributory, the System will not receive 5.0% of payroll for member contributions. To account for this difference, 5.0% of the present value of future salary for all non-contributory members has been added to the actuarial accrued liability. The individual entry-age actuarial cost method was used in determining liabilities and normal cost for the District Judges division. Differences in the past
between assumed experience and actual experience (actuarial gains and losses) become part of actuarial accrued liabilities.
Unfunded actuarial accrued liabilities are amortized to produce contribution amounts (principal and interest) which are level percent of payroll contributions. For the District Judges division, Old Plan Still Paying unfunded actuarial accrued liabilities are amortized as a level dollar contribution.
Recognizing the special circumstances of the General Assembly division, modifications of the above assumptions were made where appropriate.
Present assets (cash & investments) were valued on a market related basis in which differences between actual and assumed returns are phased-in over a four year period (including District Judges New Plan and Paid Off Old Plan). The funding value of assets may not deviate from the market value of assets by more than 25%. District Judges Still Paying Old Plan present assets (cash & investments) were valued on a market related basis.
The data about persons now covered and about present assets were furnished by the System’s administrative staff. Although examined for general reasonableness, the data was not audited by the Actuary. The actuarial valuation computations were made by or under the supervision of a Member of the American Academy of Actuaries (M.A.A.A.).
Non-Economic Assumptions
Economic Assumptions
Summary of Assumptions Used in Actuarial Valuations
Assumptions Adopted by Board of Trustees After Consulting with ActuaryJune 30, 2010 Valuation

Actuarial Section
Arkansas Public Employees Retirement System52
Single Life Retirement Values - Based on RP-2000 Combined Mortality Table projected to 2015 set forward 2 years for men
Actuarial Assumptions as of 6/30/10
SampleAttained
Ages
Present Value of$1.00 Monthly for
Life
Present Value of$1.00 Monthly for Life
Increasing 3% Annually
Future LifeExpectancy
(Years)Men Women Men Women Men Women
40 $145.15 $147.67 $206.27 $213.28 39.93 44.0545 141.08 144.37 196.01 204.36 35.15 39.1950 135.38 139.78 183.34 193.40 30.40 34.3855 127.66 133.53 168.05 180.10 25.75 29.64
60 117.86 125.50 150.47 164.62 21.30 25.0865 106.19 115.70 131.24 147.34 17.19 20.8070 92.55 104.31 110.57 128.75 13.42 16.8675 76.91 91.31 88.83 109.13 10.04 13.29
80 60.72 76.72 67.92 88.78 7.19 10.0985 45.92 61.21 49.94 68.73 5.01 7.35
The mortality table was set forward 10 years for disabilities.
SampleAttained
Ages
BenefitIncreasing
3.0%Yearly
Portion of Age60 Lives Still
AliveMen Women
60 $100.00 100% 100%65 116.00 96 9670 134.00 89 9175 155.00 79 8180 180.00 63 68
Valuation Date - 6/30/10 APERS District Judges
Actuarial Cost Method Ultimate entry age normal (state & local)Entry age normal (General Assembly)
Entry age normal
Amortization Method Level percent of payroll (state & local) Level dollar (New Plan & Paid Off Old Plan)Level dollar (General Assembly) Level dollar (Still paying Old Plan)
Remaining Amortization Period 30 years (state & local) 27 years (New Plan & Paid Off Old Plan)18 years (General Assembly) 25 years (Still paying Old Plan)
Asset Valuation Method 4-year smoothed market with 25% corridor 4-year smoothed market with 25% corridor(New Plan & Paid Off Old Plan)Market value (Still paying Old Plan)
Actuarial Assumptions: Investment Rate of Return 8.0% 8.0% Projected Salary Increases 4.7% - 10.6% 4.7% - 9.8% Wage Inflation Rate 4.0% 4.0% Cost-of-Living Adjustment 3.0% annual compounded increase 3.0% annual compounded increase on benefits
for service after January 1, 2005 Mortality Table RP-2000 Combined Mortality Table projected
to 2015, set forward 2 years for men.RP-2000 Combined Mortality Table projected to 2015, set forward 2 years for men.
Summary of Actuarial Methods and Assumptions

Actuarial Section
Arkansas Public Employees Retirement System 53
APERS Separations from Active Employment Before Service Retirement
Percent of Active Members Separating Within the Next Year
Pay Increase Assumptions For An Individual Employee
SampleAges
Years ofService
Withdrawal Death Disability Merit &Seniority
Base(Economy)
Increase Next YearMen Women Men Women Men Women
0 40.0% 40.0%1 25.0 25.02 20.0 20.03 15.0 15.04 12.0 12.0
20 5+ 10.0 10.0 0.01% 0.01% 0.01% 0.01% 6.60 % 4.00 % 10.60 %25 10.0 10.0 0.02 0.01 0.05 0.05 5.10 4.00 9.1030 8.8 8.8 0.03 0.01 0.08 0.08 3.20 4.00 7.2035 6.2 6.2 0.04 0.02 0.10 0.10 2.30 4.00 6.3040 4.4 4.4 0.05 0.03 0.15 0.15 1.90 4.00 5.9045 3.4 3.4 0.07 0.04 0.20 0.20 1.50 4.00 5.5050 2.7 2.7 0.10 0.06 0.40 0.40 1.10 4.00 5.1055 1.9 1.9 0.18 0.12 0.70 0.70 0.80 4.00 4.8060 1.2 1.2 0.35 0.23 1.00 1.00 0.70 4.00 4.70
State and Local Government Division
Percent of Active Members Separating Within the Next Year
Pay Increase Assumptions For An Individual Employee
SampleAges
Withdrawal Disability Merit &Seniority
Base(Economy)
Increase Next Year Men Women Men Women
20 2.0% 2.0 % 0.08 % 0.08 % 2.70 % 4.00 % 6.70 %25 2.0 2.0 0.08 0.08 2.60 4.00 6.6030 2.0 2.0 0.08 0.08 2.20 4.00 6.2035 2.0 2.0 0.08 0.08 1.90 4.00 5.9040 2.0 2.0 0.20 0.20 1.40 4.00 5.4045 2.0 2.0 0.26 0.26 1.20 4.00 5.2050 2.0 2.0 0.49 0.49 0.70 4.00 4.7055 2.0 2.0 0.89 0.89 0.70 4.00 4.7060 2.0 2.0 1.41 1.41 0.00 4.00 4.00
District Judge Separations from Active Employment Before Service Retirement
Pay increase rates are age-based only, and not service-based.
Summary of Actuarial Methods and Assumptions

Actuarial Section
Arkansas Public Employees Retirement System54
State and Local DivisionAge-Based Retirement Service-Based Retirement
Retirement Ages(With less than 28 years of service) Unreduced Reduced Years Retirement DROP
55-56 2% 28 15% 25%57-58 3 29 15 20
59 4 30-31 12 2060 5 32-35 12 1561 7 36-37 1062 20 38 10063 1864 15
65-67 25%68-84 20
85 100
Probabilities of Retirement for Members Eligible to Retire
For the state and local government division, a member was assumed eligible for unreduced retirement after attaining age 65 with 5 years of service, or 28 years regardless of age (both unreduced retirement and DROP). A member was assumed eligible for reduced retirement after attaining age 55 with 5 or more years of service.
For the General Assembly Division, a member may retire at age 50 with 20 or more years of service, age 60 with 16 years of service, or age 65 with eight or more years of service.
For District Judges, members may retire at age 50 with 20 or more years of service, age 60 with 16 or more years of service, or age 65 with 8 or more years of service.
Percent of Eligible Active Members Retiring Within Next Year
General Assembly DivisionAge-Based Retirement
Retirement Ages Percentages50-61 30%
62 5063-64 30
65 5066 30
67-79 2080 100
District Judges DivisionAge-Based Retirement
Retirement Ages Percentages50-54 10%55-56 1257-59 1460-61 1862-73 30
74 100
Summary of Actuarial Methods and Assumptions

Actuarial Section
Arkansas Public Employees Retirement System 55
N/A Data not available for this fiscal year.# After legislated changes in benefit provisions.
@ After changes in financial assumptions.& After changes in asset valuation method.
State Division
State and Local Government Division
Local Government Division(Combined County, Municipal, School & Other Non-State Employers)
ValuationDate
June 30
Active Membersin Valuation
Average PayChangein CPI
(Inflation)NumberAnnualPayroll Dollars % Change
1992 22,953 $468,310,059 $20,403 +5.3 % +3.11993#@ 23,201 495,874,973 21,373 +4.8 +3.01994 24,488 530,532,520 21,665 +1.4 +2.51995#& 25,392 566,317,776 22,303 +2.9 +3.01996 25,496 598,416,616 23,471 +5.2 +2.81997# 25,699 636,196,222 24,695 +5.2 +3.01998@ 25,776 657,941,805 25,525 +3.4 +2.31999 25,726 674,674,818 26,225 +2.7 +1.71999# 25,726 674,941,818 26,225 +2.7 +1.72000 25,869 696,187,512 26,912 +2.6 +3.7
9 Year Average +3.3 % +2.5
ValuationDate
June 30
Active Membersin Valuation
Average PayChangein CPI
(Inflation)NumberAnnualPayroll Dollars % Change
1998@ 17,150 $ N/A $18,385 +3.2% +2.31999 17,216 332,656,169 19,323 +0.0 +1.71999# 17,216 332,656,169 19,323 +5.1 +1.72000 17,132 352,354,160 20,567 +6.4 +3.7
4 Year Average +3.7% +1.9
ValuationDate
June 30
Active Membersin Valuation
Average PayChangein CPI
(Inflation)NumberAnnualPayroll Dollars % Change
2001 42,469 $1,069,021,325 $25,172 +3.2% +3.22002 42,143 1,110,424,974 26,349 +4.7 +1.12003 42,825 1,147,269,521 26,790 +1.7 +2.12004 42,772 1,175,040,470 27,472 +2.6 +3.02005 42,916 1,214,612,719 28,302 +3.1 +3.22006 43,430 1,266,726,823 29,167 +3.1 +4.12007 43,613 1,302,302,790 29,860 +2.4% +2.42008 44,340 1,379,509,276 31,112 +4.2 +5.62009 44,687 1,433,497,978 32,079 +3.1 -2.12010 45,380 1,522,479,258 33,550 +4.6 +1.2
Summary of Active Member Valuation Data - Comparative Statements

Actuarial Section
Arkansas Public Employees Retirement System56
N/A Data not available for this fiscal year.# After legislated changes in benefit provisions.@ After changes in financial assumptions.
Funding policy was to liquidate the Contingency Reserve over a period of years and then return to a normal cost contribution.
General Assembly Subdivision
ValuationDate
June 30
Active Membersin Valuation
Average PayChangein CPI
(Inflation)NumberAnnualPayroll Dollars % Change
1993#@ 127 $ 955,040 $ 7,520 +0.0% +3.01994 128 N/A 12,512 +6.4 +2.51995# 125 N/A 12,512 +0.0 +3.01996 124 1,553,000 12,524 +0.0 +2.81997# 125 1,565,500 12,524 +0.0 +3.01998@ 121 1,515,500 12,525 +0.0 +2.31999 122 1,526,500 12,512 -0.1 +1.72000 120 1,500,000 12,500 -0.1 +3.72001 87 1,087,500 12,500 +0.0 +3.22002 87 1,087,500 12,500 +0.0 +1.12003 54 675,000 12,500 +0.0 +2.12004 54 745,489 13,805 +10.4 +3.02005 22 310,534 14,115 +2.2 +3.22006 22 318,792 14,491 +2.7 +4.12007 17 277,420 16,319 +12.6 +2.42008 17 256,020 15,060 -7.7 +5.62009 15 230,415 15,361 2.0 - 2.12010 14 222,152 15,868 3.3 +1.2
Summary of Active Member Valuation Data - Comparative Statements

Actuarial Section
Arkansas Public Employees Retirement System 57
@ After changes in financial assumptions # After legislated changes in benefit provisions
The APERS funding objective is to meet long-term benefit promises through contributions that remain approximately level from year to year as a percent of member payroll.
If the contributions to the System are level in concept and soundly executed, the System will pay all promised benefits when due — the ultimate test of financial soundness. Testing for level contribution rates is the long term condition test.
A short condition test is one means of checking a system’s progress under its funding program. In a short condition test, the plan’s present assets (cash and investments) are compared with: 1) Active member contributions on deposit;
2) The liabilities for future benefits to present retired lives;
3) The liabilities for service already rendered by active members.
In a system that has been following the discipline of level percent of payroll financing, the liabilities for active member contributions on deposit (liability 1) and the liability for future benefits to present retired lives (liability 2) will be fully covered by present assets (except in unusual circumstances). In addition, the liabilities for service already rendered by active members (liability 3) will be partially covered by the remainder of present assets.
The larger the funded portion of liability 3, the stronger the condition of the system. Liability 3 being fully funded is uncommon.
The following schedule illustrates the history of liability 3 of the System and is indicative of the APERS objective of following the discipline of level percent of payroll financing.
Entry Age Accrued Liability
Val’nDate:
June 30
(1)Active
MemberContr.
(2)Retirees
andBenef.
(3)Active Members
(EmployerFin. Portion)
Valuation Assets
Portion of PresentValues Covered By
Present Assets(1) (2) (3) Total
($ in Millions)STATE AGENCIES DIVISION (Including subdivisions)1998 @ $17.2 $ 640.3 $1,395.9 $2,328.5 100% 100% 119% 113%1999 @# 16.9 784.0 1,634.2 2,637.1 100 100 112 1082000 15.8 747.5 1,865.7 2,943.3 100 100 117 112LOCAL GOVERNMENT EMPLOYERS1998 @ $ 8.8 $ 337.9 $ 501.1 $ 968.1 100% 100% 124% 114%1999 # 8.8 446.9 587.9 1,074.7 100 100 105 1032000 7.6 440.0 706.0 1,178.1 100 100 103 102STATE AGENCIES AND LOCAL GOVERNMENT EMPLOYERS2001 # $23.4 $1,305.0 $2,759.2 $4,335.5 100% 100% 109% 106%2002 @ 20.5 1,502.7 2,850.8 4,397.2 100 100 101 1012003 @ 20.5 1,624.7 3,004.7 4,408.3 100 100 92 952004 20.5 1,762.2 3,197.6 4,429.9 100 100 83 892005@ 15.5 1,878.2 3,701.7 4,576.1 100 100 72 822006 15.5 1,990.6 3,907.3 4,941.1 100 100 75 842007# 29.7 2,268.5 3,856.7 5,489.3 100 100 83 892008@ 45.8 2,463.9 4,014.9 5,858.1 100 100 83 902009 66.4 2,750.3 4,059.9 5,406.8 100 100 64 792009# 66.4 2,750.3 4,103.5 5,406.8 100 100 63 782010 92.8 2,928.7 4,266.1 5,403.5 100 100 56 74
Short Condition Test

Actuarial Section
Arkansas Public Employees Retirement System58
Actual experience will never (except by coincidence) coincide exactly with assumed experience.
It is hoped that gains and losses will cancel each other over a period of years, but sizable year to year fluctuations are common. Detail on the derivation of the experience gain (loss) is shown below.
* Unfunded actuarial accrued liability.
6/30/10APERS
6/30/10District Judges
State and Local
DivisionGeneral
Assembly Total
New Planand Paid Off
Old PlanStill Paying
Old Plan Total$ in Millions
( 1) UAAL* at beginning of year $1,513.4 $11.4 $1,524.8 $3,432,274 $12,235,225 $15,667,499
( 2) Normal cost from last valuation 102.0 0.0 102.0 653,435 0 653,435
( 3) Actual employer contributions 168.6 1.0 169.6 762,062 1,196,400 1,958,462
( 4) Interest accrual: [(1) + ½[(2) - (3)]]x .080 118.4 0.9 119.3 270,959 930,962 1,201,921
( 5) Expected UAAL before changes: (1) + (2) - (3) + (4) 1,565.2 11.3 1,576.5 3,612,653 11,969,787 15,582,440
( 6) Increase from benefit changes 0.0 0.0 0.0 0 0 0
( 7) Changes from revised actuarial assumptions and methods 0.0 0.0 0.0 0 0 0 ( 8) New entrant liabilities 36.0 0.0 36.0 (2,442) 2,442 0
( 9) Expected UAAL after changes: (5) + (6) + (7) + (8) 1,601.2 11.3 1,612.5 3,610,211 11,972,229 15,582,440
(10) Actual UAAL at end of year 1,884.1 10.9 1,895.0 4,154,984 11,507,744 15,662,728
(11) Gain/(loss): (9) - (10) $ (282.9) $ 0.4 $(282.5) $(544,733) $ 464,485 $ (80,288)
Analysis of Financial Experience

Actuarial Section
Arkansas Public Employees Retirement System 59
6/30/10Gain/(Loss) in Period - ($ in Millions)
State and Local Division
GeneralAssembly Total
% ofAccrued LiabilitiesType of Risk Area
ECONOMIC RISK AREASPay IncreasesIf there are smaller pay increases thanassumed, there is a gain. If greaterincreases, a loss. $(2.8) $0.0 $(2.8) 0.0 %
Investment ReturnIf there is greater investment returnthan assumed, there is a gain.If less return, a loss. (319.2) (0.5) (319.7) (4.4)%
NON-ECONOMIC RISK AREASNon-Casualty RetirementsIf members retire at older ages or withlower final average pays than assumed,there is a gain. If younger ages orhigher average pays, a loss. 7.9 0.0 7.9 0.1 %
Disability RetirementsIf there are fewer disabilities thanassumed, there is a gain. If more, a loss. 0.8 0.0 0.8 0.0 %
Death-in-Service BenefitsIf there are fewer claims than assumed,there is a gain. If more, a loss. (0.1) 0.0 (0.1) 0.0 %
WithdrawalIf more liabilities are released by otherseparations than assumed, there is a gain.If smaller releases, a loss. (9.0) 0.5 (8.5) (0.1) %
Total Active Member Actuarial Gains/(Losses) $(322.5) 0.0 (322.5) (4.4) %
Retired Life Mortality 17.0 0.0 17.0 0.2 %
OtherIncludes data adjustments at retirement,timing of financial transactions, retiredlife mortality, and miscellaneousunidentified sources. $ 22.6 $0.4 23.0 0.3 %
Total Actuarial Gains (Losses) $(282.9) $0.4 $(282.5) (3.9)%
Analysis of Financial Experience - Gain & Losses By Risk Area
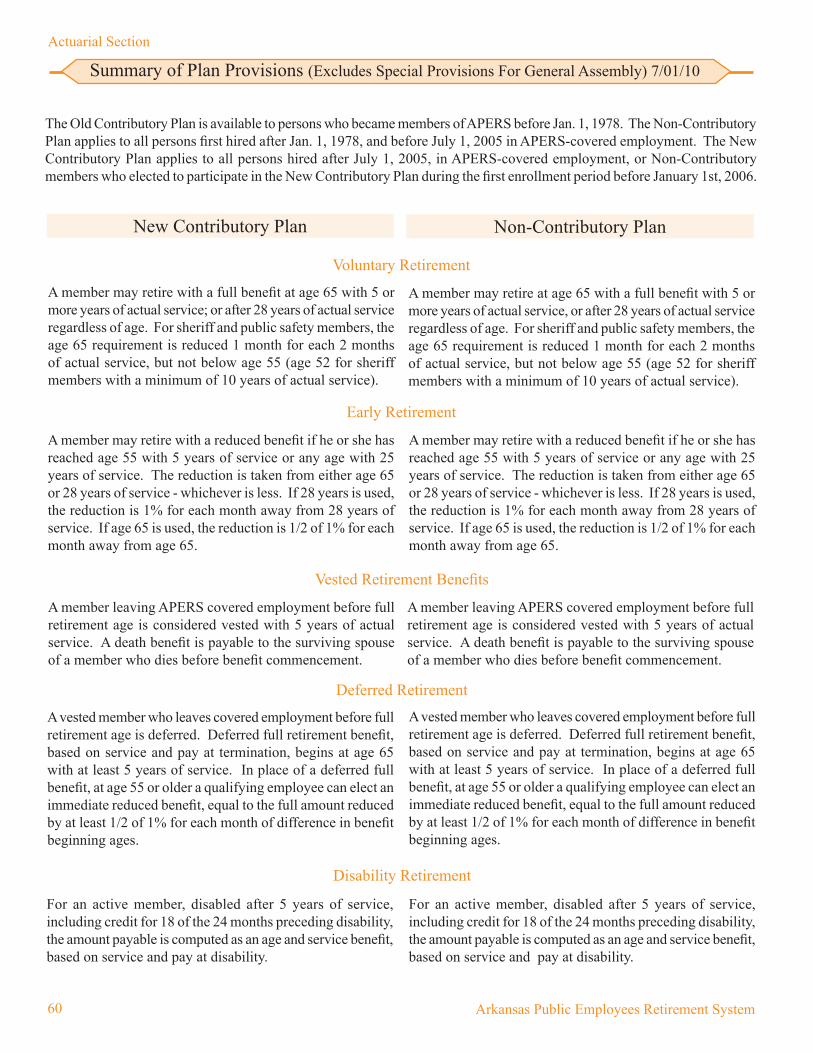
Actuarial Section
Arkansas Public Employees Retirement System60
The Old Contributory Plan is available to persons who became members of APERS before Jan. 1, 1978. The Non-Contributory Plan applies to all persons first hired after Jan. 1, 1978, and before July 1, 2005 in APERS-covered employment. The New Contributory Plan applies to all persons hired after July 1, 2005, in APERS-covered employment, or Non-Contributory members who elected to participate in the New Contributory Plan during the first enrollment period before January 1st, 2006.
For an active member, disabled after 5 years of service, including credit for 18 of the 24 months preceding disability, the amount payable is computed as an age and service benefit, based on service and pay at disability.
For an active member, disabled after 5 years of service, including credit for 18 of the 24 months preceding disability, the amount payable is computed as an age and service benefit, based on service and pay at disability.
A member may retire with a reduced benefit if he or she has reached age 55 with 5 years of service or any age with 25 years of service. The reduction is taken from either age 65 or 28 years of service - whichever is less. If 28 years is used, the reduction is 1% for each month away from 28 years of service. If age 65 is used, the reduction is 1/2 of 1% for each month away from age 65.
A member may retire with a reduced benefit if he or she has reached age 55 with 5 years of service or any age with 25 years of service. The reduction is taken from either age 65 or 28 years of service - whichever is less. If 28 years is used, the reduction is 1% for each month away from 28 years of service. If age 65 is used, the reduction is 1/2 of 1% for each month away from age 65.
A member leaving APERS covered employment before full retirement age is considered vested with 5 years of actual service. A death benefit is payable to the surviving spouse of a member who dies before benefit commencement.
A member leaving APERS covered employment before full retirement age is considered vested with 5 years of actual service. A death benefit is payable to the surviving spouse of a member who dies before benefit commencement.
Early Retirement
Vested Retirement Benefits
A vested member who leaves covered employment before full retirement age is deferred. Deferred full retirement benefit, based on service and pay at termination, begins at age 65 with at least 5 years of service. In place of a deferred full benefit, at age 55 or older a qualifying employee can elect an immediate reduced benefit, equal to the full amount reduced by at least 1/2 of 1% for each month of difference in benefit beginning ages.
A vested member who leaves covered employment before full retirement age is deferred. Deferred full retirement benefit, based on service and pay at termination, begins at age 65 with at least 5 years of service. In place of a deferred full benefit, at age 55 or older a qualifying employee can elect an immediate reduced benefit, equal to the full amount reduced by at least 1/2 of 1% for each month of difference in benefit beginning ages.
Deferred Retirement
Disability Retirement
A member may retire with a full benefit at age 65 with 5 or more years of actual service; or after 28 years of actual service regardless of age. For sheriff and public safety members, the age 65 requirement is reduced 1 month for each 2 months of actual service, but not below age 55 (age 52 for sheriff members with a minimum of 10 years of actual service).
A member may retire at age 65 with a full benefit with 5 or more years of actual service, or after 28 years of actual service regardless of age. For sheriff and public safety members, the age 65 requirement is reduced 1 month for each 2 months of actual service, but not below age 55 (age 52 for sheriff members with a minimum of 10 years of actual service).
Voluntary Retirement
New Contributory Plan Non-Contributory Plan
Summary of Plan Provisions (Excludes Special Provisions For General Assembly) 7/01/10

Actuarial Section
Arkansas Public Employees Retirement System 61
A member’s final average compensation is the average of the highest 3 fiscal years of covered compensation.
A member’s final average compensation is the average of the highest 3 fiscal years of covered compensation.
2.00% of FAC times years of credited service earned (2.03% for service prior to July 1, 2007), plus .5% of FAC times years of service over 28 years for service after July 1, 2009. The minimum monthly benefit is $150 minus any age and beneficiary option reductions.
The annuity benefit is calculated as 1.72% of FAC times years and months of credited service (1.75% for service prior to July 1, 2007), plus .5% of FAC times years of service over 28 years for service after July 1, 2009. If retirement is prior to age 62, an additional .33% of FAC times years of service will be paid until age 62. The portion of the APERS benefit based on service before 1978 cannot be less than the amount provided by contributory provisions in effect at the time of retirement. The minimum monthly benefit is $150 minus any age and beneficiary option reductions.
Full Age and Service Retirement Benefits
Once retired for twelve months, effective July 1 there will be a cost of living adjustment equal to 3% of the current benefit.
Once retired for twelve months, effective July 1 there will be a cost of living adjustment equal to 3% of the current benefit.
Benefit Increases After Retirement
If death occurs while in APERS covered employment, member’s accumulated contributions before 1978 are refundable. However, if a member has 5 years or more of service, monthly benefits are payable instead. The surviving spouse receives a benefit, payable immediately, computed as if member had retired and elected the Joint and 75% Survivor Option. Each dependent child receives benefit of 10% of compensation, subject to a maximum of 25% for all children. Dependent parent benefits are payable if neither spouse nor children benefits are payable.
If death occurs while in APERS-covered employment, member’s accumulated contributions are refundable. However, if a member has 5 years or more of service, monthly benefits are payable instead. The surviving spouse receives a benefit, payable immediately, computed as if member had retired and elected the Joint and 75% Survivor Option. Each dependent child receives benefit of 10% of compensation, subject to a 25% maximum for all children. Dependent parent benefits are payable if neither spouse nor children benefits are payable.
Death While in PERS - Covered Employment
Member contributions before 1978 are protected in the same manner as under the Contributory Plan. Should a member elect a straight life benefit and die within 12 months of the date of retirement, a benefit may be payable to the surviving spouse under certain circumstances. Retiring members can also elect an optional form of benefit, which provides beneficiary protection and is paid for by reducing the retired member’s benefit amount.
If death occurs before total monthly benefit payments equal member’s accumulated contributions, the difference may be refunded to the designated beneficiary. Should a member elect a straight life benefit and die within 12 months of the date of retirement, a benefit may be payable to the surviving spouse under certain circumstances. A retiring member can also elect an optional form of benefit, which provides beneficiary protection and is paid for by reducing the retired member’s benefit amount.
Death After Retirement
Final Average Compensation
New Contributory Plan Non-Contributory Plan
Summary of Plan Provisions - 7/01/10

Actuarial Section
Arkansas Public Employees Retirement System62
Members with 28 or more years of actual service in PERS or in combination with a reciprocal system are eligible to participate. Members, for a maximum of 84 months, may continue employment and have a percentage of their retirement benefits accumulate in a tax-deferred account. The current DROP percentages range from 63% for 28 years of service to 75% for 30+ years of service. DROP accounts earn interest of 6 percent on the balance and are paid to members upon retirement in a lump sum, as an additional monthly benefit, or rolled over into a qualified retirement plan.
Members with 28 or more years of actual service in PERS or in combination with a reciprocal system are eligible to participate. Members, for a maximum of 84 months, may continue employment and have a percentage of their retirement benefits accumulate in a tax-deferred account. The current DROP percentages range from 63% for 28 years of service to 75% for 30+ years of service. DROP accounts earn interest of 6 percent on the balance and are paid to members upon retirement in a lump sum, as an additional monthly benefit, or rolled over into a qualified retirement plan.
Members who have worked past the date they became eligible for an unreduced benefit, can participate in the Partial Annuity Withdrawal (PAW). To be eligible to participate, the member must be eligible for an unreduced benefit and not be participating in the Deferred Retirement Option Plan (DROP). Members may take a lump sum distribution of their retirement benefits for each month they work beyond the date of first eligibility for an unreduced benefit - up to a maximum of 60 months. The member’s lifetime annuity is then reduced by an actuarial factor tied to the age of the retiree. The election to participate in the PAW is made at retirement.
Members who have worked past the date they became eligible for an unreduced benefit, can participate in the Partial Annuity Withdrawal (PAW). To be eligible to participate, the member must be eligible for an unreduced benefit and not be participating in the Deferred Retirement Option Plan (DROP). Members may take a lump sum distribution of their retirement benefits for each month they work beyond the date of first eligibility for an unreduced benefit - up to a maximum of 60 months. The member’s lifetime annuity is then reduced by an actuarial factor tied to the age of the retiree. The election to participate in the PAW is made at retirement.
Deferred Retirement Option Plan (DROP)
Partial Annuity Withdrawl (PAW)
Member Contribution Rates
There are no employee contributions for service after January 1, 1978. If there is service before January 1, 1978, contributions for that period are refundable later in the same manner as under the Contributory Plan.
5% of covered compensation (pre-tax). Member contributions are refundable if APERS-covered employment terminates before a monthly benefit is payable. Members will earn annual interest on the contributions at a rate of 4% annually.
New Contributory Plan Non-Contributory Plan
Summary of Plan Provisions - 7/01/10

Actuarial Section
Arkansas Public Employees Retirement System 63
Voluntary Retirement With a full benefit, after either (a) age 50 with 20 years of eligibility service, (b) age 60 with 16 years of eligibility service, or (c) age 65 with 8 years of eligibility service.
Final Average Compensation (FAC) Average of the final three calendar years of employment.
Benefit Service Service performed on or after January 1, 2005.
Eligibility Service Benefit service plus service in Old Local District Judges Plan.
Full Age & Service Retirement Benefit 2.50% of FAC times actual service.
Benefit Increases After Retirement Annually, there will be a cost-of-living adjustment equal to 3% of the current benefit.
Member Contribution Rates Active members contribute 5% of their salaries. If a member leaves service before becoming eligible to retire, accumulated contributions may be refunded.
Vested Retirement Benefits 8 years of eligibility service. Deferred full retirement benefit, based on benefit service and pay at termination, begins when member would have been eligible for voluntary retirement.
Total and Permanent Disability An active member with 3 or more consecutive years of eligibility service who becomes totally and permanently disabled may be retired and receive a disability annuity computed in the same manner as an age and service annuity.
Death After Retirement If the member was eligible for normal retirement at the time of death, an eligible beneficiary will begin receiving a 50% joint and survivor pension computed in the same manner as a service retirement pension as if the member had retired the last day of his life.
Summary of Plan Provisions - District Judges

This page intentionally left blank.

StatisticalStatistical
Schedule of Revenues by Source
Schedule of Expenses by Type
Schedule of Benefit Expenses by Type
Schedule of Retired Members by Type of Benefit for APERS
Schedule of Average Benefit Payments for APERS
Statistical Graphs

This Page Intentionally Left Blank

Statistical Section
Arkansas Public Employees Retirement System 67
Note: Investment income includes investment gain calculated in accordance with GASB 25.
* Expenses are based on June 30 benefit amounts annualized.
1 Includes DROP and PAW distributions.
Year EndedJune 30
Age & Service Death InService
DisabilityRetireesRetirees Survivors
2006 178,052,748 5,700,516 4,670,760 10,925,0282007 206,975,784 2,598,444 577,224 14,215,1402008 224,223,624 2,639,616 534,252 15,937,1882009 248,677,584 2,733,372 507,672 17,426,1482010 265,728,720 2,797,848 440,964 18,793,560
Year EndingJune 30
MemberContributions
EmployerContributions
InvestmentIncome
TransfersAnd Other
Total
2006 $ 4,667,067 $158,152,183 $545,321,895 $10,630,255 $718,771,4002007 12,192,289 163,888,295 899,333,699 8,844,973 1,084,259,2552008 18,443,261 174,119,820 (283,602,698) 32,563,899 (58,475,718)2009 23,722,994 159,827,501 (1,173,730,924) 9,581,816 (980,598,613)2010 $30,334,716 $170,186,564 $500,632,900 $6,099,736 $707,253,916
Year EndingJune 30
BenefitPayments1
AdministrativeExpenses
Refunds Misc. Total
2006 219,711,792 4,272,313 62,133 0 224,046,2382007 244,137,717 4,747,840 632,790 0 249,518,347 2008 266,301,400 4,892,076 1,900,783 0 273,094,259 2009 299,896,780 5,482,554 2,661,289 0 308,040,6232010 $318,998,006 $5,981,358 $3,586,861 0 $328,566,225
Schedule of Revenues By Source
Schedule of Expenses By Type
Schedule of Benefit Expenses By Type*

Statistical Section
Arkansas Public Employees Retirement System68
6/30/10APERS
Type of Annuity Number Annual AnnuitiesAge & Service RetireesLife 16,120 203,495,292Option A-60 ( 5 years certain) 835 9,921,204Option A-120 (10 years certain) 1,565 17,247,864Option B-50 (joint and 50% survivor) 883 15,246,840Option B-75 (joint and 75% survivor) 1,319 18,453,396Option B-100 (joint and 100% survivor) 75 1,364,124Totals 20,797 265,728,720
Beneficiaries of Age & Service RetireesLife 122 980,160Option A-60 1 15,156Option A-120 5 31,992Option B-50 96 852,624Option B-75 62 702,252Option B-100 12 215,664Totals 298 2,797,848Total Age & Service Retirees & Beneficiaries 21,095 268,526,568
Disability RetireesLife 1,760 13,873,644Option A-60 117 897,072Option A-120 245 1,751,436Option B-50 125 954,660Option B-75 175 1,316,748Option B-100 0 0Totals 2,422 18,793,560
Beneficiaries of Disability RetireesLife 69 360,660Option A-60 1 17,772Option A-120 0 0Option B-50 11 58,836Option B-75 405 2,404,656Option B-100 0 0Totals 486 2,841,924Total Disability Retirees & Beneficiaries 2,908 21,635,484
Death-in-Service Beneficiaries 66 440,964
Total Retirees & Beneficiaries 24,069 290,603,016DROP Participants 1,811 51,603,024GRAND TOTAL 25,880 $342,206,040
Schedule of Retired Members By Type of Benefit

Statistical Section
Arkansas Public Employees Retirement System 69
6/30/10 Years of Credited Service
10-14 15-19 20-24 25-29 30+Retirement Effective Dates7/1/09 to 6/30/10Avg. Monthly Benefit $420.50 $704.05 $901.92 $1,576.77 $2,236.53Avg. Monthly Final Average Salary 2,169.32 2,623.70 2,581.40 3,266.19 3,737.84Number of Active Retirants 263 187 158 176 80
Retirement Effective Dates7/1/08 to 6/30/09Avg. Monthly Benefit $453.36 $710.10 959.21 $1,764.44 $2,003.49Avg. Monthly Final Average Salary 2,146.10 2,527.01 2,648.64 3,195.35 3,268.56Number of Active Retirants 264 225 190 324 150
Retirement Effective Dates7/1/07 to 6/30/08Avg. Monthly Benefit $455.20 $747.46 $881.99 $1,746.83 $2,178.09Avg. Monthly Final Average Salary 2,310.97 2,456.34 2,350.47 3,184.13 3,640.46Number of Active Retirants 208 174 161 292 88
Retirement Effective Dates7/1/06 to 6/30/07Avg. Monthly Benefit $470.91 $695.75 $1,021.95 $1,912.56 $2,659.66Avg. Monthly Final Average Salary 2,180.18 2,445.47 2,611.49 3,189.21 3,723.27Number of Active Retirants 236 198 171 291 130
Retirement Effective Dates7/1/05 to 6/30/06Avg. Monthly Benefit $441.85 $651.50 $866.08 $1,835.69 $2,176.02Avg. Monthly Final Average Salary 2,079.97 2,171.54 2,267.33 3,064.26 3,378.73Number of Active Retirants 208 199 147 346 90
Retirement Effective Dates7/1/05 to 6/30/10Avg. Monthly Benefit $447.84 $700.81 $929.65 $1,785.14 $2,254.12Avg. Monthly Final Average Salary 2,175.52 2,444.51 2,502.29 3,168.79 3,527.48Number of Active Retirants 1,179 983 827 1,429 538
Schedule of Average Benefit Payments For APERS
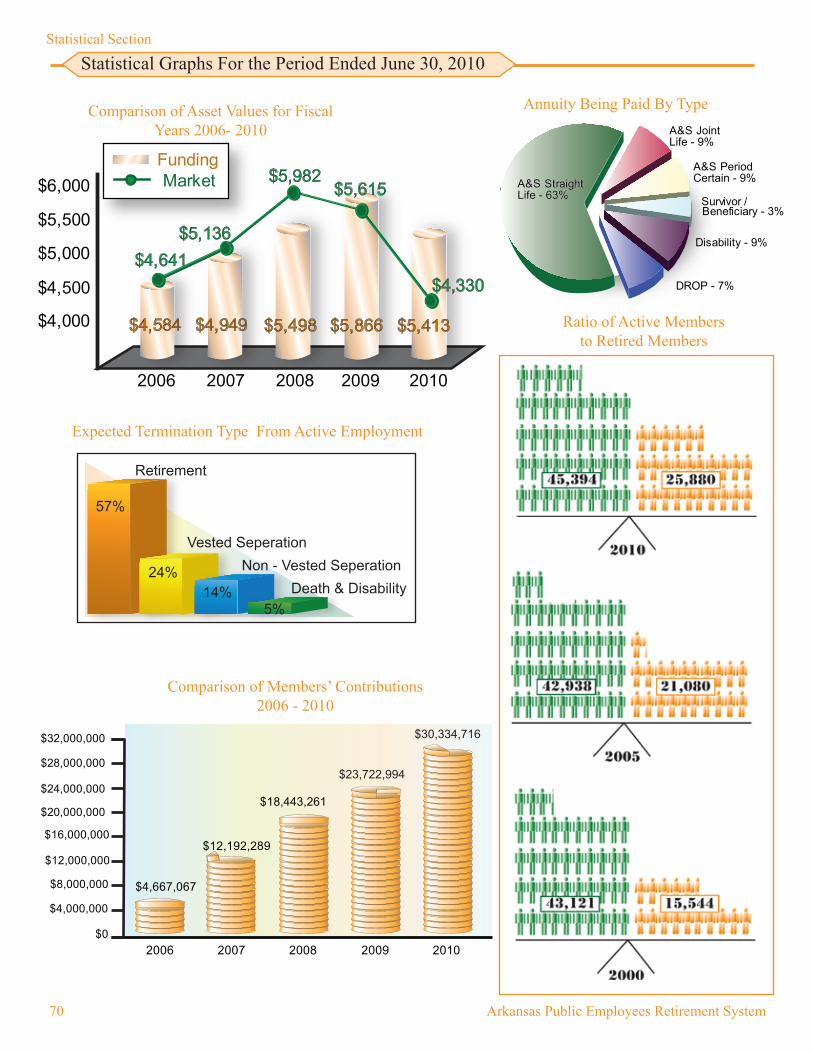
Statistical Graphs For the Period Ended June 30, 2010 Statistical Section
Arkansas Public Employees Retirement System70
Comparison of Asset Values for Fiscal Years 2006- 2010
Expected Termination Type From Active Employment
Comparison of Members’ Contributions 2006 - 2010
$0
$4,000,000
$8,000,000
$12,000,000
$16,000,000
2006 2007 2008 2009 2010
$20,000,000
$24,000,000
$28,000,000
$32,000,000
$12,192,289
$18,443,261
$4,667,067
$23,722,994
$30,334,716
Retirement
Non - Vested SeperationVested Seperation
Death & Disability
57%
24%14%
5%
Ratio of Active Members to Retired Members
A&S StraightLife - 63%A&S StraightLife - 63%
A&S JointLife - 9%
A&S PeriodCertain - 9%
Disability - 9%
DROP - 7%
Survivor /Beneficiary - 3%
Annuity Being Paid By Type
2006 2007 2008 2009 2010
MarketFunding
$4,500
$5,500
$4,000
$5,000
$6,000
$4,641
$5,982$5,615
$5,136
$4,330
$4,584 $4,949 $5,498 $5,866 $5,413

StatisticalAppendix
APERS & ASPRS Combined Statement of Plan Net Assets
APERS & ASPRS Combined Statement of Changes to Plan Net Assets
Schedule of Participating Employers

This Page Intentionally Left Blank

Appendix
Arkansas Public Employees Retirement System 73
6/30/10ASSETS TOTAL APERS ASPRSCash and Cash Equivalents $123,988,009 $ 119,233,185 $ 4, 754,824Securities Lending Collateral Investments in Cash Equivs. (Notes 3 & 5) Receivables:
Dec 2004 Actuarial Liability Receivable 11,949,695 11,949,695 0Contributions 2,223,459 2,214,443 9,016Investment Principal Receivable 28,377,532 27,293,510 1,084,022 Accrued Investment Income Receivable 15,469,410 14,878,479 590,931
Total Receivables 58,020,096 56,336,127 1,683,969 Investments At Fair Value (Notes 3, 4 & 5)
Government Securities:U.S. Government Securities 58,943,659 56,692,011 2,251,648 Futures 1,132,860 1,089,585 43,275 Government Agency Securities 207,978,701 200,033,915 7,944,786
Corporate Securities:Collateralized Obligations 188,524,591 181,322,952 7,201,639 Corporate Bonds 517,506,749 497,737,991 19,768,758 Convertible Bonds 180,825,380 173,917,850 6,907,530 Convertible Preferred Stock 36,491,161 35,097,199 1,393,962 Common Stock 1,633,344,212 1,570,950,462 62,393,750 Equity Index Funds 514,154,040 494,513,356 19,640,684 Equity Co-mingled 33,801,220 32,510,013 1,291,207 High Yield Income Fund 52,869,883 50,850,253 2,019,630
International Securities:Global Fixed Income Fund 3,993,085 3,840,549 152,536 Corporate Fixed Income 9,578,145 9,212,260 365,885 Equity Securities 292,731,498 281,549,155 11,182,343 Equity Pooled Fund Units 520,101,682 500,233,798 19,867,884 Emerging Markets 18,828,676 18,109,421 719,255 Forward Contracts 82,163 79,024 3,139
Real Estate 172,754,876 166,155,640 6,599,236 Timberland 306,191,839 294,495,311 11,696,528 Municipal Bonds 5,428,800 5,221,420 207,380 Commercial Loans 35,579,863 34,220,712 1,359,151
Total Investments 4,790,843,083 4,607,832,877 183,010,206 Securities Lending Collateral Investments, At Fair Value (Notes 3 & 5):
Corporate Bonds 189,424,582 182,188,563 7,236,019 Bank Obligations 135,444,724 130,270,736 5,173,988 Asset Backed Securities 40,290,601 38,751,500 1,539,101 Repurchase Agreements 83,222,193 80,043,105 3,179,088
Total Securities Lending Collateral Investments 448,382,100 431,253,904 17,128,196 Prepaids and Other Assets 129,340 129,340 0Fixed Assets, Net 71,899 71,899 0TOTAL ASSETS 5,421,434,527 5,214,857,332 206,577,195LIABILITIES
Accrued Expenses and Other Liabilities 6,804,599 6,687,309 117,290Investment Principal Payable 49,554,672 47,661,684 1,892,988Other Post Employment Benefits (Note on page 29) 754,059 754,059 0Securities Lending Liability 448,382,100 431,253,904 17,128,196
TOTAL LIABILITIES 505,495,430 486,356,956 19,138,474 NET ASSETS HELD IN TRUST FOR PENSION BENS. (Note 6) $4,915,939,097 $4,728,500,376 $187,438,721 (A schedule of Funding Progress is on page 31).
APERS & ASPRS - Combined Statement of Plan Net Assets
*Columns may not add due to rounding

Appendix
Arkansas Public Employees Retirement System74
6/30/10ADDITIONS TOTAL APERS ASPRS
ContributionsEmployer $ 176,443,471 $ 170,186,564 $ 6,256,907
Plan Members 30,334,716 30,334,716 0 Supplemental 14,290,550 0 14,290,550 Court 1,517,967 0 1,517,967 Driver’s License Reinstatement Fees 1,164,562 0 1,164,562
Total Contributions 223,751,266 200,521,280 23,229,986
Investment Income:Interest 64,808,426 62,331,626 2,476,800 Dividends 45,580,431 43,820,724 1,759,707 Investment Gain/Loss 425,050,678 410,511,458 14,539,220 Security Lending Income 2,050,050 2,050,050 0Real Estate Income (7,588) (7,588) 0Other 7,923 7,620 303
Total Investment Income 537,489,920 518,713,890 18,776,030 Less: Investment Expense 18,802,562 18,080,990 721,574
Net Investment Income 518,687,356 500,632,900 18,054,456
Other Sources:Miscellaneous Additions 7,515,718 (331,483) 7,847,201Transfer from Teachers Retirement System 6,355,482 6,355,482 0Miscellaneous Transfers from State Agencies 75,737 75,737 0
Total Other Additions 13,946,937 6,099,736 7,847,201TOTAL ADDITIONS 756,385,559 707,253,916 49,131,643
DEDUCTIONSBenefits 339,317,689 318,998,006 20,319,683 Refunds of Contributions 3,586,861 3,586,861 0Administrative Expenses 6,061,236 5,981,358 79,878 TOTAL DEDUCTIONS 348,965,786 328,566,225 20,399,561
NET INCREASE (DECREASE) 407,419,773 378,687,691 28,732,082
NET ASSETS (Note 6)Beginning of Year 4,508,519,324 4,349,812,685 158,706,639
End of Year $4,915,939,097 $4,728,500,376 $187,438,721
See Notes to Financial Statements
APERS & ASPRS - Combined Statement of Changes In Plan Net Assets
*Columns may not add due to rounding

Appendix
Arkansas Public Employees Retirement System 75
(Continued)
State AgenciesAdministrative Office of the CourtsArkansas Child Abuse & Neglect Prevention BoardArkansas Crime Information CenterArkansas Department Of AgricultureArkansas Economic Development CommissionArkansas Fair Housing CommissionArkansas Public Defender CommissionArkansas State Athletic CommissionArkansas Dept. Of Environmental QualityArkansas Appraisers Licensing/CertificationArkansas County Conservation DistrictArkansas Ethics CommissionArkansas HeritageArkansas Minority Health CommissionArkansas Northeastern CollegeArkansas Sentencing CommissionArkansas State Board Of OptometryArkansas State Library Arkansas State UniversityArkansas State University - BeebeArkansas State University-Mountain HomeArkansas Tech UniversityArkansas Tobacco Control BoardArkansas Tobacco Settlement CommissionArkansas Towing & Recovery BoardAshley County Conservation DistrictAssessment Coordination DepartmentArkansas State University-NewportAttorney GeneralAuctioneers Licensing BoardAuditor Of StateBaxter County Conservation DistrictBoard of Examiners - Speech/Language Pathology & AudiologyBenton County Conservation DistrictBlack River Technical College Board Of AccountancyBoard Of ArchitectsBoard Of Barber ExaminersBoard Of Chiropractic ExaminersBoard Of Collection AgenciesBoard Of Dental ExaminersBoard Of Dispensing OpticiansBoard Of Embalmers And Funeral DirectorsBoard Of Examiners In CounselingBoard Of NursingBoard Of PharmacyBoard Of Physical TherapyBoard Of Registration for Professional GeologistsBoard Of Registration For Professional Engineers & Professional SurveyorsBoone County Conservation DistrictBuffalo Conservation DistrictBuilding AuthorityBurial Association Board
Calhoun County Conservation DistrictCapitol Zoning District CommissionCarroll County Conservation DistrictChicot County Conservation District Claims CommissionClark County Conservation DistrictClay County Conservation DistrictCleburne County Conservation DistrictCleveland County Conservation DistrictCommissioner of State LandsConstitutional OfficersContractors Licensing BoardConway County Conservation DistrictCossatot Community College - University of ArkansasCossatot Conservation DistrictCourt Of AppealsCourt ReportersCraighead County Conservation DistrictCrawford County Conservation DistrictCrittenden County Conservation DistrictCrooked Creek Conservation DistrictCross County Conservation DistrictDallas County Conservation DistrictDepartment Of AeronauticsDepartment Of Community CorrectionDepartment Of CorrectionsDepartment Of Emergency ManagementDepartment Of Finance & AdministrationDepartment Of HealthDepartment Of Higher EducationDepartment Of Human ServicesDepartment Of Information SystemsDepartment Of LaborDepartment Of Workforce ServicesDeputy Prosecuting AttorneyDesha County Conservation DistrictDevelopment Finance AuthorityDietetic Licensing BoardDisability Determination For Social Security AdministrationDistrict Judge Pilot (APERS Employees)Division Of Legislative AuditDrew County Conservation DistrictDrug Court Juvenile Probation & Intake OfficeDrug Task Force - 1st Judicial DistrictDrug Task Force - 3rd Judicial DistrictDrug Task Force - 5th Judicial DistrictDrug Task Force - 13th Judicial DistrictDrug Task Force - 14th Judicial DistrictDrug Task Force - 15th Judicial DistrictDrug Task Force - 18th Judicial DistrictDrug Task Force - 21st Judicial DistrictDrug Task Force - BatesvilleDrug Task Force - MonticelloDrug Task Force - South CentralEast Arkansas Community College
Educational Television CommissionExaminers In PsychologyFaulkner County Conservation DistrictFire Protection Licensing BoardForestry CommissionFranklin County Conservation DistrictFulton County Conservation District Game & Fish CommissionGame & Fish Commission - Wildlife OfficersGarland County Conservation DistrictGeneral Assembly - HouseGeneral Assembly - SenateGeographic Information Office Geological CommissionGovernor's OfficeGreene County Conservation DistrictHealth Services Permit Agency Hempstead County Soil ConservationHenderson State UniversityHistory CommissionHot Spring County Conservation DistrictHouse Speaker’s OfficeIndependence County Conservation DistrictInsurance DepartmentIzard County Conservation DistrictJackson County Conservation DistrictJefferson County Conservation DistrictJohnson County Conservation DistrictJudicial Discipline/Disability CommissionLafayette County Conservation DistrictLaw Enforcement StandardsLawrence County Conservation DistrictLee County Conservation DistrictLegislative CouncilLieutenant GovernorLincoln County Conservation DistrictLiquified Petroleum Gas DivisionLittle River Conservation DistrictLivestock & Poultry CommissionLogan County Conservation DistrictMadison County Conservation DistrictManufactured Home CommissionMartin Luther King Jr. CommissionMedical BoardMiller County Conservation DistrictMine Creek Conservation DistrictMississippi County Conservation DistrictMonroe County Conservation DistrictMontgomery County Conservation DistrictMotor Vehicle CommissionNational Park Community CollegeNevada County Conservation DistrictNewton County Conservation DistrictNorth Arkansas CollegeNorthwest Arkansas Community CollegeOffice Of Rural AdvocacyOil & Gas CommissionOuachita County Conservation District
Schedule of Participating Employers As Of June 30, 2010

Appendix
Arkansas Public Employees Retirement System76
(Continued)
Arkansas River Valley Regional LibraryArkansasAshleyAssociation Of CountiesBaxterBentonBooneBradleyCalhounCarrollChicotClarkClayClay County-Western DistrictCleburneClevelandColumbiaConwayCraigheadCrawfordCrittendenCrossDallasDeshaDrewEast Central Arkansas Regional LibraryFaulknerFranklinFultonGarlandGrantGrassy Lake-Tyronza DrainageGreeneHempsteadHot SpringHowardIndependenceIzardJacksonJeffersonJohnsonLafayetteLawrenceLeeLincolnLittle RiverLoganLonokeMadisonMarionMillerMississippiMonroeMontgomeryNevadaNewtonOuachitaPerryPhillipsPikePoinsett
County EmployersOzarka Technical CollegeParks & TourismPhillips Community College - University of ArkansasPhillips County Conservation DistrictPike County Conservation DistrictPoinsett County Conservation DistrictPope County Conservation DistrictPost Prison Transfer BoardPoteau River Conservation DistrictPrairie County Conservation DistrictProfessional Bail Bondsman Licensing BoardProsecuting AttorneyProsecutor CoordinatorPublic Employees Retirement SystemPublic Service CommissionPulaski Technical CollegeRandolph County Conservation DistrictReal Estate CommissionRich Mountain Community CollegeRich Mountain Conservation DistrictSchool For The BlindSchool For The DeafScience & Technology AuthoritySebastian County Conservation DistrictSecretary Of StateSecurities DepartmentSenate ClerkSharp County Conservation DistrictSocial Work Licensing BoardSoil & Water ConservationSouth Arkansas Community CollegeSoutheast Arkansas Technical CollegeSouthern Arkansas UniversitySouthern Arkansas University TechSpinal Cord CommissionSt. Francis County Conservation DistrictState Bank DepartmentState Board Of Election CommissionersState Capitol PoliceState Crime LabState Military DepartmentState Plant BoardState Police (Non-Trooper)State Police (Troopers - Tier 1)State Police (Troopers - Tier 2)State TreasurerStone County Conservation DistrictStudent Loan AuthoritySupreme CourtTrial Court Administrative AssistantsUniversity of Arkansas Community College at HopeUniversity of Arkansas Community College at MorriltonUnion County Conservation DistrictUniversity of Arkansas Community College at BatesvilleUniversity Of Arkansas - FayettevilleUniversity Of Arkansas - Little RockUniversity Of Arkansas - Medical Sciences
State Agencies (Continued)
University Of Arkansas At MonticelloUniversity Of Arkansas-Fort SmithUniversity Of Central ArkansasVan Buren County Conservation DistrictVeterans AffairsVeterans Child WelfareVeterinary Medical Examining BoardVocational/Technical Educational Division of RehabilitationWar Memorial StadiumWashington County Conservation DistrictWaterways CommissionWhite County Conservation DistrictWoodruff County Conservation DistrictWorker's Compensation CommissionYell County Conservation District

Appendix
Arkansas Public Employees Retirement System 77
(Continued)
PolkPopePrairiePulaskiRandolphRandolph County Nursing HomeSaline Saline County LibraryScottSearcySebastianSevierSharpSt. FrancisStoneUnionVan BurenWashingtonWhite White County Public LibraryWhite River Regional LibraryWoodruffYell Yell County Library
County Employers (Continued)
AlmaAlma Water & Sewer DepartmentArkadelphiaArkansas CityArkansas Municipal LeagueAsh FlatAshdownAugustaAustinBatesvilleBatesville Water WorksBeebeBentonvilleBethel HeightsBiscoeBonoBradford Water & Sewer SystemBrinkleyBrinkley Municipal Water/SewerBryantCabotCaddo ValleyCalico RockCamden Water & UtilitiesCammack VillageCarlisleCave CityCave SpringsCentral Arkansas WaterCharlestonCherry ValleyClarksvilleClintonClinton Water & SewerCorningCotterCrossettCrossett Public LibraryCrossett Water CommissionDes ArcDeWittDierksDoverEl Dorado Water WorksElm SpringsEmersonEnglandEudoraFarmingtonFlippinFordyceFordyce Water & SewerForemanForrest CityForrest City Water UtilitiesFort Smith Public LibraryFountain HillFultonGassvilleGoshenGravette
Municipal Agencies
Green ForestGum Springs Water DepartmentHackettHamburgHamptonHardyHarrisburgHarrisburg Water & Gas DivisionHarrisonHaskellHazenHeber SpringsHelena-West HelenaHolly GroveHopeHope Water & LightHoratioHot SpringsHot Springs Convention & Visitors BureauHuntingtonHuntsvilleHuntsville Water & SewerHuttigJacksonvilleJacksonville Wastewater UtilityJacksonville Water CommissionJasperJunction CityKiblerLamarLavacaLepantoLewisvilleLincolnLittle Rock Wastewater UtilityLockesburgLowellMagnoliaMalvernMalvern WaterworksMammoth SpringMarked TreeMarshallMarvellMcGehee Water & Sewer SystemMcRaeMelbourneMenaMena Water & SewerMonetteMonticelloMorriltonMount IdaMountain HomeMountain PineMountain ViewMt. Pleasant Water DepartmentNashvilleNorth Little Rock Advertising & Promotion CommissionOla

Appendix
Arkansas Public Employees Retirement System78
(Continued)
PangburnParagouldParisPerryvillePiggottPiggott Light & Water SystemPlumervillePrairie GrovePrescottPyattQuitmanRavendenRisonRogersRogers Water UtilitiesRussellvilleSalemSearcyShannon HillsSheridanShirleySmackoverStampsStar CityStar City Water & SewerStuttgartStuttgart & North Arkansas County LibrarySummitTown of HighfillVan BurenVan Buren Municipal UtilitiesVilonia Waterworks AssociationViolaWaldronWardWarrenWarren Water & SewerWest ForkWestern GroveWilmarWynneWynne Municipal Water UtilitiesYellville
Municipal Agencies (Continued) School EmployersAlma Alpena Arkadelphia Ashdown Atkins Augusta Bald Knob Barton-LexaBatesville Bauxite Beebe BentonBentonville Bergman Berryville Bismarck Blytheville Booneville Bradford Bradley Brinkley BrooklandBryantCabot Calico Rock Cedarville Clarendon Clarksville Clinton Concord Conway Corning Cotter Cross CountyCrossett Cutter Morning Star Dardanelle De Queen Deer/Mt. Judea Dermott Special Des ArcDewitt Dollarway Dover Drew Central Dumas Earle El Dorado England Fairview Farmington Fayetteville Flippin Fordyce Foreman Forrest City Fouke Ft. Smith Genoa Central Gentry Gosnell
Green Forest Greenwood Gurdon Public Hamburg HarrisburgHarrison Hartford Hazen Heber Springs Hector Helena-West Helena Hermitage Highland Hope Horatio Hot Springs Hoxie Huntsville Izard County ConsolidatedJackson County Jasper Jonesboro Junction City Lafayette County Lake Hamilton Lakeside Lamar Lavaca Lead Hill Lee County Lincoln Consolidated Little Rock Lonoke Magazine Magnolia Malvern Mansfield Marion Marked Tree Marvell McCrory McGehee Mena Midland Monticello Mountain Home Mountain View Mountainburg Mt. Vernon-Enola Murfreesboro Nashville Nettleton Newark NewportNorth Little RockNorfork Osceola OuachitaOzark Palestine-Wheatley Paragould

Appendix
Arkansas Public Employees Retirement System 79
(Continued)
Pea Ridge Piggott Pine Bluff Pocahontas Pottsville Prescott Pulaski County Riverview Rogers Russellville South Conway County South Mississippi County Searcy County Sheridan Shirley Siloam Springs Sloan-Hendrix Smackover South Central Service CooperativeSouthside Springdale Star City Stephens Stuttgart Texarkana Trumann Turrell Twin Rivers Valley Springs Valley View Van Buren Van-CoveVilonia West Memphis School CafeteriasWaldron Warren Watson Chapel West Side Westside ConsolidatedWhite Hall Wickes Wynne Yellville-Summit
School Employers (Continued)ADJRS PilotArkansas CountyAshdown Ashley CountyBaxter CountyBenton County West (Decatur)BerryvilleBeebeBiscoeBoonevilleBradley CountyBrinkleyCabotCalhoun CountyCamdenCharlestonCherokee VillageChicot CountyClarksvilleConwayCraighead CountyCrossettDallas CountyDeQueenDermottDevalls BluffDewittDumasEast CamdenElkinsEureka SpringsFayettevilleFordyceFranklin CountyGrant CountyHamburgHamptonHazenHelena/West HelenaHot SpringsHoxieHuntsvilleIzard CountyJacksonvilleLake VillageLawrence CountyLee CountyLittle RockLogan CountyMadison CountyMagnoliaMalvernMarionMountain HomeNevada CountyNewportNewton CountyOuachita CountyOzarkPike CountyPhillips County
District JudgesPine BluffPoinsett CountyPrairie GrovePrescottRandolph CountyRisonSharp CountySheridanSherwoodSiloam SpringsSpringdaleStuttgartWalnut RidgeWardWest ForkWest MemphisWoodruff CountyWrightsvilleYell County
Benton County WestBerryvilleBoonevilleCamdenClarendonConwayDeQueenDermottDevalls BluffDewittDumasEast CamdenElkinsEureka SpringsFayettevilleFt. SmithHoxieLake VillageLittle RockLonokeMarionMaumelleMcCroryMcGeheeNewportNorth Little RockOsceolaOzarkPerry CountyPine BluffSherwoodSiloam SpringsSpringdaleTexarkanaTrumannTyronza
District Court Employers*
* Employer doesn’t participate in APERS with the exception of the District Court Judge and Court Clerk.

Appendix
Arkansas Public Employees Retirement System80
Number of Participating Employers
As of 6/30/10State Agencies 243County Agencies 85Municipal Agencies 164School Employers 166District Judges 64District Court Employers* 39
Other Non-State Agencies 26Total 787
Benton County Solid Waste DistrictBlytheville – Gosnell Regional AirportBoone County Airport Boston Mountain Solid Waste Clark County Country Water FacilitiesHot Spring County Solid Waste AuthorityJames Fork Regional Water DistrictKimzey Regional Water DistrictMarion County Regional AirportMilltown-Washburn Water UsersMontgomery County Reg Water AuthorityNevada County Prescott Solid Waste Mgmt.North Ark. Regional Solid Waste ManagementNorth Garland Co. Regional Water DistrictParagould Housing AuthorityParon-Owensville Water AuthorityPulaski Area Geographic Information System (PAGIS)Pulaski County Regional Solid Waste Management DistrictRiverSouth Rural Water DistrictSaline County Regional Waste Management DistrictSardis Water AssociationSE White County Water AuthoritySW Boone County Water AssociationSW White County Water AssociationUpper SW Arkansas Solid Waste Management DistrictWashington Water Authority
District Court Employers*
* Employer doesn’t participate in APERS with the exception of the District Court Judge and Court Clerk.
Walnut RidgeWest MemphisWrightsville
Other Non-State Employers

Arkansas Public Employees Retirement System124 West Capitol Avenue, Suite 400
Little Rock, AR 72201682-7800 or 1-800-682-7377
www.APERS.org