Arizona Public School Districts’ Dollars Spent in the … of School Audits Arizona Public School...
50
Division of School Audits Arizona Public School Districts’ Dollars Spent in the Classroom Report to the Arizona Legislature March 2002 Debra K. Davenport Auditor General OFFICE OF THE AUDITOR GENERAL What’s Inside? Introduction and Background 1 A Statewide Perspective 7 District-by-District Perspective 15
Transcript of Arizona Public School Districts’ Dollars Spent in the … of School Audits Arizona Public School...

Division of School Audits
Arizona Public SchoolDistricts’ Dollars Spent
in the Classroom
Report to the Arizona LegislatureMarch 2002
Debra K. DavenportAuditor General
OFFICE OF THE AUDITOR GENERAL
What’s Inside?
Introduction and Background 1A Statewide Perspective 7District-by-District Perspective 15

The Auditor General is appointed by the Joint Legislative Audit Committee, a bipartisan committee composed of five senators and five representatives. Her mission is to provide independent and impar-tial information and specific recommendations to improve the operations of state and local government entities. To this end, she provides financial audits and accounting services to the state and political subdivisions and performance audits of state agencies and the programs they administer.
The Joint Legislative Audit Committee
Representative Roberta L. Voss, Chair Senator Ken Bennett, Vice Chair
Representative Robert Blendu Senator Herb Guenther Representative Gabrielle Giffords Senator Dean Martin Representative Barbara Leff Senator Peter Rios Representative James Sedillo Senator Tom Smith Representative James Weiers (ex-officio) Senator Randall Gnant (ex-officio)
Audit Staff
Sharron E. Walker, Director and Contact Person
Ross Ehrick, Manager
Team Members
Jason Blake Bridget Harper Tara Lennon Michael Quinlan
Joanne Prakapas Wendy Simeon
Copies of the Auditor General’s reports are free. You may request them by contacting us at:
Office of the Auditor General 2910 N. 44th Street, Suite 410
Phoenix, AZ 85018 (602) 553-0333
Additionally, many of our reports can be found in electronic format at:
www.auditorgen.state.az.us

2910 NORTH 44th STREET • SUITE 410 • PHOENIX, ARIZONA 85018 • (602) 553 -0333 • FAX (602) 553-0051
DEBRA K. DAVENPORT, CPA AUDITOR GENERAL
STATE OF ARIZONA OFFICE OF THE
AUDITOR GENERAL
WILLIAM THOMSON DEPUTY AUDITOR GENERAL
March 1, 2002
Members of the Arizona Legislature The Honorable Jane Dee Hull, Governor I am pleased to present our report, Arizona Public School Districts’ Dollars Spent in the Classroom, prepared in response to the requirement in A.R.S. §41-1279.03 to determine the percentage of every dollar Arizona school districts spend in the classroom. I am also including a copy of the Report Highlights to provide a quick summary for your convenience. The National Center for Education Statistics (NCES) has established a definition for dollars used for instruction, which is a nationally recognized benchmark. The most recently published national average of 61.7 percent was based on fiscal year 1999 data. Our analysis of fiscal year 2001 district accounting data found that Arizona’s statewide average is 57.7 percent of each dollar being spent in the classroom. Most districts were near this average, with almost two-thirds of the districts within 5 percent of the state average. Factors associated with higher classroom spending included larger student populations, higher average teacher salaries, and higher teacher experience index ratings. Higher food service, transportation, and administrative costs were associated with lower classroom dollar spending. This report provides the classroom dollar percentage for each school district and its comparative ranking to the state average and to other districts of the same size. Thus, the report also establishes a baseline for future comparisons of districts’ classroom dollar expenditures. My staff and I will be pleased to discuss or clarify items in the report. This report will be released to the public on March 4, 2002. Sincerely, Debra K. Davenport Auditor General Enclosure

iThe Office of the Auditor General has conducted an analysis ofArizona school districts’ percentage of dollars spent in the class-room. This analysis was conducted pursuant to A.R.S. §41-1279.03, which requires the Auditor General to monitor the per-centage of each dollar spent in the classroom and conduct a per-formance audit of each school district once every 5 years.
Historically, the U.S. Department of Education’s NationalCenter for Education Statistics (NCES) has found that Arizonaspends a lower percentage of dollars on classroom instructionthan the national average, and less than most other states. Thisreport establishes a baseline for monitoring the percentage ofdollars spent in the classroom and includes an analysis of com-mon factors related to this percentage.
To provide a performance measure that can be compared toother states’ statistics, the national average, and Arizona’s pastperformance, Auditor General staff used the NCES definition ofdollars spent on instruction as the definition of “dollars spent inthe classroom.” The NCES definition was applied to fiscal year2001 school district Annual Financial Reports obtained from theArizona Department of Education and/or fiscal year 2001 sum-mary accounting data obtained from the school districts.
Dollars in the Classroom:A Statewide Perspective(See pages 7 through 13)
In fiscal year 2001, Arizona school districts spent an average of57.7 percent of their dollars in the classroom. Most districts werenear this average, with nearly two-thirds of all districts within 5percent of the state average.
Several key factors appear to make these percentages increaseor decrease. In general, districts with larger student populationshad higher percentages of dollars spent in the classroom. Inaddition, the percentage of dollars spent in the classroom
OFFICE OF THE AUDITOR GENERAL i
SUMMARY
Arizona spends a lowerpercentage of dollars inthe classroom than thenational average, andless than most otherstates.
Arizona school districtsspent 57.7 percent offiscal year 2001 dollarsin the classroom.
Classroom dollar per-centages increase withdistrict size, teachersalaries, and teacherexperience levels.

increases with higher average teacher salaries and teacher expe-rience levels.
Higher expenditures for certain noninstructional costs, such asfood service, transportation, and administration, were associat-ed with lower classroom dollar percentages. For example, dis-tricts with the lowest classroom dollar percentages spent, onaverage, more than three times more on food service and trans-portation per pupil than districts with the highest classroomdollar percentages. In addition, districts that have higheramounts of federal and state program expenditures tended tohave lower classroom dollar percentages. Federal and state pro-gram dollars are generally designated for specific purposes.Some of these programs, such as job training or family literacy,may increase education-related expenditures, but not increaseclassroom dollars.
Several other factors had no significant relationship to the per-centage of dollars spent in the classroom. These included deseg-regation expenditures per pupil, budget overrides, and districttype.
Dollars in the Classroom:A District-by-District Perspective(See pages 15 through 24)
Auditor General staff determined individual district classroomdollar percentages by applying the NCES definition to fiscalyear 2001 Annual Financial Reports and accounting data. Thisreport provides information on individual district percentages:
listed alphabetically;
ranked, grouped, and summarized by district size; and
ranked from highest to lowest percentage with comparisonsto the state average.
Summary
OFFICE OF THE AUDITOR GENERALii
Food service, trans-portation, and adminis-trative costs mayreduce the percentageof dollars in the class-room.

Future Statewide Analysis
Because of the statutory requirement to determine and monitorthe percentage of dollars spent in the classroom each year, thisreport was prepared to provide baseline information for futurecomparisons. This baseline, prior to the infusion of Proposition301 monies, will help the public and legislators measureArizona’s statewide and school districts’ progress towardincreasing the percentage of dollars spent in the classroom. Inaddition, future performance audits of school districts will befocused on helping to identify ways to re-direct dollars into theclassroom.
Summary
OFFICE OF THE AUDITOR GENERAL iii
i
OFFICE OF THE AUDITOR GENERALiv
(This Page Intentionally Left Blank)

OFFICE OF THE AUDITOR GENERAL v
vPageIntroduction and Background . . . . . . . . . . . 1
Chapter 1: Dollars in the Classroom:A Statewide Perspective . . . . . . . . . . . . . 7
Arizona Spends 57.7 Percent ofDollars in the Classroom . . . . . . . . . . . . . . . . . . . . . 7
Factors Associated withHigher Classroom Spending . . . . . . . . . . . . . . . . . . 9
Factors Associated withLower Classroom Spending . . . . . . . . . . . . . . . . . . 10
Factors That Do NotAppear to Affect ClassroomDollar Percentages . . . . . . . . . . . . . . . . . . . . . . . . . . 12
Chapter 2: Dollars in the Classroom:A District-by-District Perspective . . . . . 15
Appendix A . . . . . . . . . . . . . . . . . . . . . . . . . . a-i
Appendix B . . . . . . . . . . . . . . . . . . . . . . . . . . b-i
Tables
Table 1 Classroom Dollars Definition . . . . . . . . . . . 4
Table 2 Classroom Dollar PercentageBy District SizeFiscal Year 2001 . . . . . . . . . . . . . . . . . . . . . . . 9
Table 3 Alphabetical Listing of DistrictsWith Percentage of DollarsSpent in the ClassroomFiscal Year 2001 . . . . . . . . . . . . . . . . . . . . . . . 16
TABLE OF CONTENTS

Page
Tables (concl’d)
Table 4 Ranked Listing of Districts by Percentage ofDollars Spent in the Classroom,Grouped by SizeFiscal Year 2001 . . . . . . . . . . . . . . . . . . . . . . . 19
Table 5 Districts Ranked by Percentage ofDollars Spent in the ClassroomFiscal Year 2001 . . . . . . . . . . . . . . . . . . . . . . . 22
Table 6 Districts Grouped by Comparison toState AverageFiscal Year 2001 . . . . . . . . . . . . . . . . . . . . . . . a-i
Table 7 Classroom Dollar Percentage Groupsand Their Average AdministrativeCost PercentagesFiscal Year 2001 . . . . . . . . . . . . . . . . . . . . . . . a-v
Table 8 District Types and Their Average ClassroomDollar PercentagesFiscal Year 2001 . . . . . . . . . . . . . . . . . . . . . . . a-x
Table 9 Classroom Dollars PercentagesRegression CoefficientsFiscal Year 2001 . . . . . . . . . . . . . . . . . . . . . . . a-xi
Figures
Figure 1 Percentage of Each Dollar Spent on InstructionAs Reported by NCESFiscal Years 1995 through 1999 . . . . . . . . . . 2
Figure 2 Current Education Expenditures by TypeFiscal Year 2001 . . . . . . . . . . . . . . . . . . . . . . . 8
Table of Contents
OFFICE OF THE AUDITOR GENERALvi
TABLE OF CONTENTS (cont’d)

Table of Contents
OFFICE OF THE AUDITOR GENERAL vii
vTABLE OF CONTENTS (concl’d)
PageFigures (concl’d)
Figure 3 Average Attending ADM by GroupFY 2001 . . . . . . . . . . . . . . . . . . . . . . . . a-ii
Figure 4 Average Certified Teacher Salariesby GroupFY 2001 . . . . . . . . . . . . . . . . . . . . . . . . a-iii
Figure 5 Average Teacher Experience IndexScore by GroupFY 2001 . . . . . . . . . . . . . . . . . . . . . . . . a-iv
Figure 6 Average Food Service Costper Pupil by GroupFY 2001 . . . . . . . . . . . . . . . . . . . . . . . . a-vi
Figure 7 Average Transportation Costper Pupil by GroupFY 2001 . . . . . . . . . . . . . . . . . . . . . . . . a-vi
Figure 8 Average Transportation and Food ServiceCosts per Pupil by GroupFY 2001 . . . . . . . . . . . . . . . . . . . . . . . . a-vii
Figure 9 Average Federal and State ProgramExpenditures per Pupil by GroupFY 2001 . . . . . . . . . . . . . . . . . . . . . . . . a-viii
Figure 10 Per-Pupil Desegregation Expenditures andCorresponding Classroom DollarPercentagesFY 2001 . . . . . . . . . . . . . . . . . . . . . . . . a-ix

OFFICE OF THE AUDITOR GENERALviii
(This Page Intentionally Left Blank)

In November 2000, Arizona voters approved Proposition 301,increasing the State’s sales tax from 5 percent to 5.6 percent for20 years, beginning June 1, 2001. Revenues generated by the taxprovide increased funding to Arizona universities; communitycollege districts; school districts; state schools for deaf, blind,and committed youth; and charter schools. The enabling legis-lation for Proposition 301 included a requirement that the Officeof the Auditor General conduct performance audits of schooldistricts and determine the percentage of every dollar spent inthe classroom (classroom dollar percentage).
This report examines factors that affect the classroom dollar per-centage on a statewide basis and by district. A separate report,Arizona Public School Districts’ Planned Uses of Proposition 301Monies, analyzes districts’ fiscal year 2002 plans for spending theClassroom Site Fund portion of Proposition 301 monies. Futurereports will include performance audits of the State’s school dis-tricts.
Arizona HistoricallyBelow National Average
In March 2001, the U.S. Department of Education’s NationalCenter for Education Statistics (NCES) reported that for fiscalyear 1999, the most recent year for which national data wasavailable, Arizona districts spent 60.1 percent of their currentoperating dollars on instruction compared to the national aver-age of 61.7 percent.1 Based on fiscal year 2001 data, however, thestate average is now 57.7 percent.
As shown in Figure 1 (see page 2), Arizona has historically beenbelow the national average for spending on instruction.
OFFICE OF THE AUDITOR GENERAL 1
1INTRODUCTION AND BACKGROUND
1 National Center for Education Statistics web page [http://nces.ed.gov/]and its annually published report, Digest of Education Statistics.

Introduction and Background
OFFICE OF THE AUDITOR GENERAL2
2 Students FIRST (Fair and Immediate Resources for Students Today) leg-islation was passed in July 1998, which created the School Facilities Boardand a new capital financing system for Arizona school districts.
Until the NCES-reported fiscal year 1999 increase, Arizona’sstatewide classroom dollar percentage has been approximately4 percent below the national average. The increase in 1999 mayreflect an actual increase in classroom expenditures, or it may bedue to other significant changes during that year. In fiscal year1999, the school district Uniform Chart of Accounts was revisedto more closely follow the NCES account structure. As a result,the reported expenditures may not be comparable to prioryears. Also, fiscal year 1999 was the first year of Students FIRSTfunding, which provides state funding for districts’ capitalneeds to construct and improve facilities.2 This new capitalfunding may have resulted in more dollars being available forinstruction purposes.
50
55
60
65
Perc
enta
ge
1995 1996 1997 1998 1999
Fiscal Years
Arizona statewide classroom dollar percentageNational average classroom dollar percentage
Figure 1
Percentage of Each Dollar Spent on InstructionAs Reported by NCES
Fiscal Years 1995 through 1999
Source: National Center for Education Statistics Web page[http://nces.ed.gov/] and its annually published report, Digest ofEducation Statistics.

OFFICE OF THE AUDITOR GENERAL 3
3Definition of DollarsSpent in the Classroom
NCES has collected school district revenue and expendituredata from all states and published comparative statistics aboutdollars spent on instruction since 1989. To provide a perform-ance measure that can be compared to other states’ statistics, thenational average, and Arizona’s past performance, the NCESdefinition of dollars spent on instruction is being used as thedefinition of “dollars spent in the classroom.” This definition isdescribed in Table 1 (see page 4).
Scope and Methodology
To analyze the most current expenditure data available, audi-tors obtained fiscal year 2001 district Annual Financial Reports(AFRs) from the Arizona Department of Education (ADE)and/or fiscal year 2001 summary accounting data from all ofthe State’s 233 school districts. The AFRs and the summaryaccounting data were not audited to the underlying districtrecords. Rather, auditors performed an analytical review of theAFR and summary accounting data and questioned school dis-trict officials about significant anomalies or variances. Data cor-rections were made for the errors that were identified throughthis review process and the classroom dollar percentages werecalculated.
To perform further analysis, other related information wasobtained from ADE, such as Teacher Experience Index data andAverage Daily Membership counts. These other types of datawere also reviewed for reasonableness, but the various sourcerecords were not audited.
The classroom dollar percentages and characteristics, such asdistrict size, were analyzed for districts individually and ingroups. After using statistical and regression analyses to identi-fy factors that significantly affected individual district percent-ages, these factors were analyzed for their relationship togrouped district percentages. For example, after finding thatfood costs per pupil were significantly related to individual dis-trict percentages, auditors examined this factor’s relationship todistricts grouped by classroom dollar percentages. Table 6 in
Introduction and Background

OFFICE OF THE AUDITOR GENERAL4
Introduction and Background
What are "dollars spent in the classroom?"
The NCES includes only current expenditures in the following categories:Classroom Personnel Teachers Teachers' aides Substitute teachers Graders, and Guest lecturers/visiting faculty
Instructional Aids Textbooks Workbooks Films Software, and Kits
General instructional supplies Paper Pencils Crayons, and like items
Activities Field trips (excluding transportation, hotel, and food costs) Athletics, and Co-curricular activities (choir, band, etc.)
Tuition Paid to out-of-state districts and private institutions
What expenditures are excluded from "dollars spent in the classroom"?
Plant Operation and Maintenance Salaries, benefits, and other costs for heating/cooling, equipment repair, groundskeeping and securityAdministration Superintendents, principals, business managers, and staff working in accounting, payroll, purchasing, warehousing, and printing
Student Support Services Counselors, audiologists, psychologists, speech pathologists, and nurses
Instructional Support Services Librarians, teacher training, and curriculum development
Food Service Salaries, benefits, and other costs for preparing and serving meals and snacks
Transportation Salaries, benefits, and other costs for transporting students to and from school and school activities
3
Table 1
Classroom Dollars Definition
The NCES defines current expenditures as those incurred for the day-to-day operation of schools. They include all expenditures except those associated with repaying debt, capital outlays (for example, purchases of land, buildings, and equipment), and programs outside the scope of preschool to grade 12 (for example, adult education and community services).
Source: Auditor General staff analysis of the National Center for Education Statistics' National Public Education Financial Survey Instruction Booklet.
3

OFFICE OF THE AUDITOR GENERAL 5
5
Appendix A (see page a-i), shows the distribution of districtsgrouped by classroom dollar percentage.
When calculating the state average and individual district class-room dollar percentages, transporting districts (11) were exclud-ed from all analysis. As described in Appendix B, these districtstransport all of their students to other districts and, therefore, donot have classroom expenditures. When analyzing factors thatmay affect the percentages, accommodation districts (11) and jointtechnological education districts (2) were also excluded. These twodistrict types are unique in operation and few in number, andthereby distort the analysis of factors generally affecting otherdistrict types. Therefore, 209 districts were analyzed for factorsaffecting the percentage of dollars spent in the classroom.
Acknowledgments
The Auditor General and staff would like to thank theSuperintendent of Public Instruction, the staff of the ArizonaDepartment of Education, and the staff of the Arizona publicschool districts for their cooperation and assistance.
Introduction and Background

OFFICE OF THE AUDITOR GENERAL 6
(This Page Intentionally Left Blank)

OFFICE OF THE AUDITOR GENERAL 7
7In fiscal year 2001, Arizona school districts spent an average of57.7 cents of each dollar in their classrooms. Some factors, suchas increases in district size, are associated with a higher per-centage of dollars in the classroom. Other factors, such as high-er food service costs, are associated with lower percentages. Stillother factors, such as desegregation programs, which provideadditional funding to some school districts, do not appear toaffect the percentage. The following sections, along with the fig-ures and tables in Appendix A, describe these relationships.
Arizona Spends 57.7 Percent of Dollarsin the Classroom
Although the percentage of dollars spent in the classroom canvary significantly among districts, the most current data showsthat the statewide average is 57.7 percent. The remaining dollarsare spent on costs for support services, such as administration,maintenance, and transportation.
Dollars Spent in the Classroom—Using fiscal year 2001Annual Financial Reports and district summary accountingdata, the statewide average and each district’s classroom dollarpercentage were calculated. On a statewide basis, school dis-tricts spend 57.7 cents of each current operating dollar in theclassroom. Individual district percentages ranged from 32 per-cent to 89 percent spent in the classroom, and are listed in Table5 in the District Analysis section of this report (see pages 22through 24).
However, this range, although large, is somewhat misleading.Most districts’ classroom dollar percentages are close to the stateaverage. Nearly two-thirds of the districts’ percentage of class-room dollars are within 5 percent of the state average of 57.7percent. Only 37 districts spend less than half of their dollars inthe classroom. Further, the districts with very high or very lowpercentages of classroom dollars are generally very small dis-
CHAPTER 1 DOLLARS IN THE CLASSROOM:A STATEWIDE PERSPECTIVE

Chapter 1
OFFICE OF THE AUDITOR GENERAL8
tricts with fewer than 150 students. These very small districtstend to either have very few non-classroom expenditures, suchas food service, or, because of their small size, spend a higherproportion of their expenditures on such services because thecosts are spread across so few students. For example, a smalldistrict that does not provide food service can put a higher per-centage of its dollars in the classroom. However, a small districtthat provides food service has to incur the costs of operating acafeteria, even though few students are served.
Dollars Not Spent in the Classroom—Statewide, about 42percent of districts’ current operating dollars are not spent in theclassroom. As shown in the following figure, administrativecosts are nearly 11 percent of this amount; however, basic oper-ating costs, including food service, transportation, plant opera-tion and maintenance, and student and instruction support,comprise the largest share.
Source: Auditor General staff analysis of fiscal year 2001 data provided by individual school districts andthe Arizona Department of Education.
Figure 2
Current Education Expenditures by TypeFiscal Year 2001
C las s ro o mIns t ruc t io n
57.7%
A dm inis t rat io n10.8%
F o o d Serv ic e4.8%
Ins t ruc t io n Suppo rt4.2%
P lant Operat io n andM aint enanc e
12.5%
St udent Suppo rtServ ic es
6.4%T rans po rt at io n
3.6%
Ot her42.3%

Chapter 1
OFFICE OF THE AUDITOR GENERAL9
Factors Associated withHigher Classroom Spending
Auditors found three factors that are positively related to thepercentage of dollars spent in the classroom: the number of stu-dents in a district, teacher salaries, and the teacher experienceindex. As these factors increase, the percentage of dollars spentin the classroom increases.
District Size—Generally, the more students a district has, thehigher the percentage of dollars it spends in the classroom. Thismay occur because larger districts can spread noninstructional,fixed-type costs over more students and still have additionaldollars left to devote to the classroom.
As the following table shows, the classroom dollar percentageincreases as the number of students in a district increases in allbut the super-large category. The percentage for this category isjust slightly less than that of the large districts.4
Table 2
Classroom Dollar Percentage By District Size Fiscal Year 2001
District Size
Number of Students
Number of Districts
Average Percentage
Small Fewer than 600 87 54.5% Medium 600 to 5,000 86 55.2 Large 5,001 to 40,000 34 58.2 Super-large More than 40,000 2 57.9 Source: Auditor General staff analysis of data provided by individual school districts and the
Arizona Department of Education.
4 Because the super-large category includes only two districts, it is difficult to deter-mine whether the percentage of dollars spent in the classroom would still be lowerthan that of large districts if there were more districts in the super-large category.

Average Teacher Salary and Teacher Experience Index—
Average teacher salaries—Generally, the percentage of dollarsspent in the classroom increases with average teacher salaries.This relationship is logical, as salaries represent 76 percent ofclassroom instruction dollars. Districts with the highest class-room dollar percentages pay teachers an average of $3,571 moreper teacher than districts with the lowest percentages.
Teacher Experience Index (TEI)—Having a higher TeacherExperience Index score also seems to relate to a higher class-room dollar percentage. The TEI is a comparison of a district’saverage to the statewide average for certified teachers’ years ofexperience. The State’s 2001 average was 8.8 years of teacherexperience.
The TEI affects a district’s budget capacity, so it has a direct rela-tionship to the amount of fundingavailable to the district for classroomexpenditures. For each year that a dis-trict average is above the statewideteacher experience average, the districtreceives a 2.25 percent increase to itsbase support level.
Factors Associated withLower Classroom Spending
Four factors are negatively related to the percentage of dollarsspent in the classroom. As administrative costs, food servicecosts, transportation costs, and expenditures for certain stateand federal programs increase, the percentage of dollars spentin the classroom decreases.
Administrative Costs—In November 2000, the Office of theAuditor General issued a study of certain school districts’administrative costs. The Joint Legislative BudgetCommittee staff had identified these districts as having par-ticularly high or low administrative costs per pupil. For thecurrent analysis, each district’s fiscal year 2001 classroomdollar percentage was compared to the results of the previ-ous study, which was based on fiscal year 1999 data.
Chapter 1
OFFICE OF THE AUDITOR GENERAL 10
1
When two similardistricts were com-pared (medium-sized, unified dis-tricts in ApacheCounty), the districtwith the significantlyhigher classroom dol-lar percentage alsopaid its teachers anaverage of 10 percentmore.
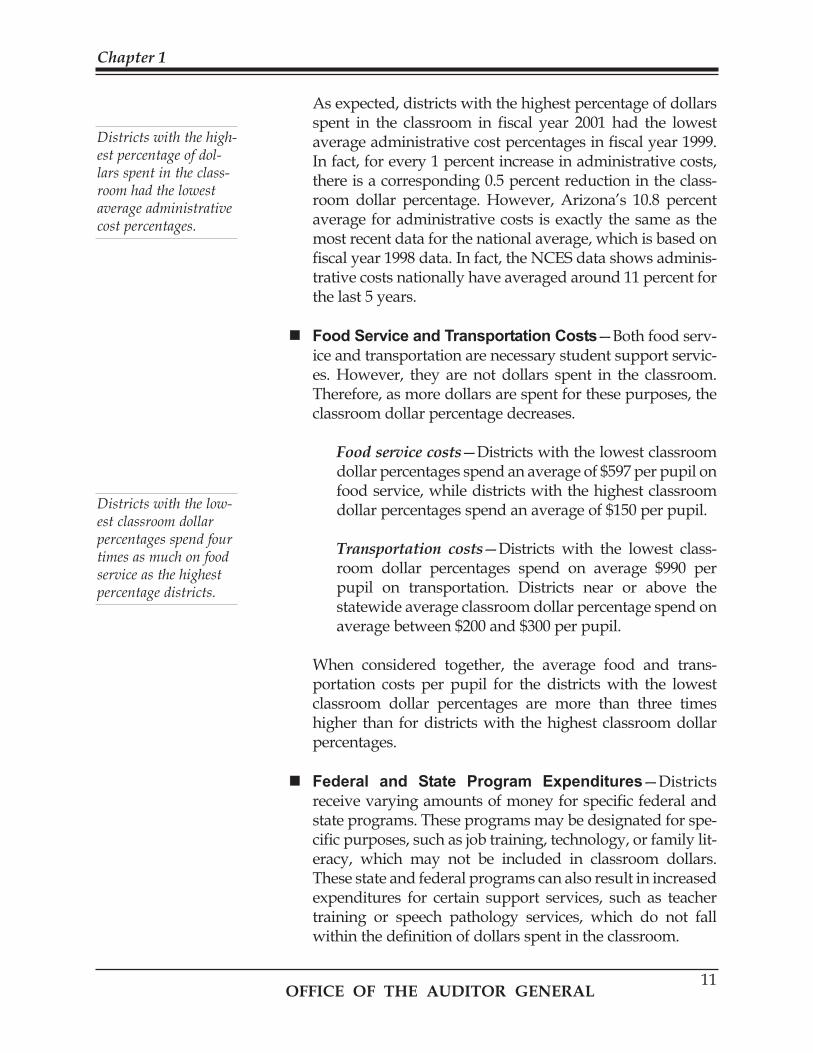
As expected, districts with the highest percentage of dollarsspent in the classroom in fiscal year 2001 had the lowestaverage administrative cost percentages in fiscal year 1999.In fact, for every 1 percent increase in administrative costs,there is a corresponding 0.5 percent reduction in the class-room dollar percentage. However, Arizona’s 10.8 percentaverage for administrative costs is exactly the same as themost recent data for the national average, which is based onfiscal year 1998 data. In fact, the NCES data shows adminis-trative costs nationally have averaged around 11 percent forthe last 5 years.
Food Service and Transportation Costs—Both food serv-ice and transportation are necessary student support servic-es. However, they are not dollars spent in the classroom.Therefore, as more dollars are spent for these purposes, theclassroom dollar percentage decreases.
Food service costs—Districts with the lowest classroomdollar percentages spend an average of $597 per pupil onfood service, while districts with the highest classroomdollar percentages spend an average of $150 per pupil.
Transportation costs—Districts with the lowest class-room dollar percentages spend on average $990 perpupil on transportation. Districts near or above thestatewide average classroom dollar percentage spend onaverage between $200 and $300 per pupil.
When considered together, the average food and trans-portation costs per pupil for the districts with the lowestclassroom dollar percentages are more than three timeshigher than for districts with the highest classroom dollarpercentages.
Federal and State Program Expenditures—Districtsreceive varying amounts of money for specific federal andstate programs. These programs may be designated for spe-cific purposes, such as job training, technology, or family lit-eracy, which may not be included in classroom dollars.These state and federal programs can also result in increasedexpenditures for certain support services, such as teachertraining or speech pathology services, which do not fallwithin the definition of dollars spent in the classroom.
Chapter 1
OFFICE OF THE AUDITOR GENERAL11
Districts with the high-est percentage of dol-lars spent in the class-room had the lowestaverage administrativecost percentages.
Districts with the low-est classroom dollarpercentages spend fourtimes as much on foodservice as the highestpercentage districts.

In general, as a district’s per-pupil expenditures for federaland state programs increase, theclassroom dollar percentageactually decreases. Districtswith the highest percentage ofdollars spent in the classroomalso have the lowest averageper-pupil federal and state pro-gram expenditures. These dis-tricts spent an average of $314per pupil on federal and stateprograms, while districts withthe lowest classroom dollar per-centages spent an average of$1,102 per pupil, or more thanthree and one-half times higher.
Factors That Do NotAppear to Affect ClassroomDollar Percentages
Three factors, including two that provide districts additionalfunding, do not appear to affect the percentage of dollars spentin the classroom. These factors are the district type, desegrega-tion expenditures, and budget overrides.
District Type—The average classroom dollar percentagesdiffered among the various types of school districts; howev-er, these variances were not statistically significant. (SeeAppendix B for a description of the seven types of schooldistricts.) Within each district type category, such as unifiedschool districts, the classroom dollar percentage variedwidely. For example, the classroom dollar percentages forunified school districts varied from 39.9 to 64 percent.Therefore, changes in the classroom dollar percentages aremore likely being affected by factors other than district type.
Desegregation Expenditures—Districts with desegrega-tion expenditures do not have higher classroom dollar per-centages than those without desegregation expenditures.These districts are allowed to budget their desegregationexpenditures outside the budget limits that would other-wise apply. This results in the districts receiving additional
Chapter 1
OFFICE OF THE AUDITOR GENERAL 12
1When auditors com-pared two similar dis-tricts (small elementarydistricts in Santa CruzCounty), the districtwith the lower class-room dollar percentagehad almost three timesthe federal and state pro-gram expenditures asthe district with thehigher classroom dollarpercentage.

revenue to pay for their desegregation programs. This addi-tional revenue appears to be flowing into the classroom atthe same rate as other monies.
The 19 districts with desegregation expenditures average57.6 percent of each dollar being spent in the classroom,while the statewide average is 57.7 percent. Twelve of thosedistricts had a classroom dollar percentage below the stateaverage. In fact, the district with the highest per-pupil deseg-regation expenditures, over $1,850 per pupil, had the lowestclassroom dollar percentage of these districts.
Budget Overrides—State law allows a district to increaseits budget by up to an additional 10 percent of its revenuecontrol limit with approval of the district’s voters. In addi-tion, an elementary or unified district can get a special over-ride to fund academic achievement programs in kinder-garten through grade three.
The additional money made available to districts throughbudget overrides does not appear to increase the percentageof dollars spent in the classroom. The average classroomdollar percentage of the 104 districts that received budgetoverrides was approximately the same as the average class-room dollar percentage of the 105 districts that did not haveoverrides. Thus, the additional money received throughbudget overrides appears to be flowing into the classroom atthe same rate as other monies.
Chapter 1
OFFICE OF THE AUDITOR GENERAL13

OFFICE OF THE AUDITOR GENERAL 14
(This Page Intentionally Left Blank)

OFFICE OF THE AUDITOR GENERAL15
Using fiscal year 2001 Annual Financial Reports and summaryaccounting data from school districts, each district’s classroomdollar percentage was calculated and is presented in the follow-ing tables.
Table 3 (see pages 16 through 18) presents an alphabeticallisting of all districts’ classroom dollar percentages, exclud-ing the 11 transporting districts that do not provide class-room instruction.
Table 4 (see pages 19 through 21) shows the districts rankedby size and classroom dollar percentage.
Table 5 (see pages 22 through 24) shows the districts aboveand below the state average.
In addition to excluding the transporting districts, Tables 4 and5 also exclude the 11 accommodation districts and 2 joint tech-nological education districts. These two district types are uniquein operation and few in number, and thereby distort the analy-sis of factors generally affecting other district types.
CHAPTER 2 DOLLARS IN THE CLASSROOM:A DISTRICT-BY-DISTRICT
PERSPECTIVE

OFFICE OF THE AUDITOR GENERAL16
Chapter 2
Agua Fria Union High School District No. 216 55.7%Aguila Elementary School District No. 63 59.9%Ajo Unified School District No. 15 60.2%
Alhambra Elementary School District No. 68 60.8%
Alpine Elementary School District No. 7 55.3%
Altar Valley Elementary School District No. 51 52.0%
Amphitheater Unified School District No. 10 57.6%
Antelope Union High School District No. 50 51.0%
Apache Elementary School District No. 42 64.9%
Apache Junction Unified School District No. 43 53.8%
Arlington Elementary School District No. 47 52.4%
Ash Creek Elementary School District No. 53 45.5%
Ash Fork Joint Unified School District No. 31 53.1%
Avondale Elementary School District No. 44 60.1%
Bagdad Unified School District No. 20 57.5%
Balsz Elementary School District No. 31 55.7%
Beaver Creek Elementary School District No. 26 59.4%
Benson Unified School District No. 9 49.5%
Bicentennial Union High School District No. 76 41.6%
Bisbee Unified School District No. 2 52.7%
Blue Elementary School District No. 22 88.7%
Blue Ridge Unified School District No. 32 60.7%
Bonita Elementary School District No. 16 58.6%
Bouse Elementary School District No. 26 59.8%
Bowie Unified School District No. 14 52.8%
Buckeye Elementary School District No. 33 53.9%
Buckeye Union High School District No. 201 48.3%
Bullhead City Elementary School District No. 15 64.1%Camp Verde Unified School District No. 28 55.2%Canon Elementary School District No. 50 47.9%
Cartwright Elementary School District No. 83 66.4%
Casa Grande Elementary School District No. 4 57.5%
Casa Grande Union High School District No. 82 54.4%
Catalina Foothills Unified School District No. 16 58.7%Cave Creek Unified School District No. 93 54.8%Cedar Unified School District No. 25 45.4%Chandler Unified School District No. 80 60.7%
Chinle Unified School District No. 24 47.7%
Chino Valley Unified School District No. 51 60.5%
Chloride Elementary School District No. 11 44.8%
Clarkdale-Jerome Elementary School District No. 3 56.7%
Table 3
Alphabetical Listing of DistrictsWith Percentage of Dollars
Spent in the ClassroomFiscal Year 2001
Clifton Unified School District No. 3 54.1%
Cochise Elementary School District No. 26 60.2%
Colorado City Unified School District No. 14 39.9%
Colorado River Union High School District No. 2 52.1%
Concho Elementary School District No. 6 55.2%
Continental Elementary School District No. 39 57.0%
Coolidge Unified School District No. 21 53.3%
Cottonwood-Oak Creek Elem. School District No. 6 53.8%
Crane Elementary School District No. 13 56.8%
Creighton Elementary School District No. 14 56.8%
Crown King Elementary School District No. 41 63.9%
Deer Valley Unified School District No. 97 60.1%
Double Adobe Elementary School District No. 45 66.0%
Douglas Unified School District No. 27 62.2%
Duncan Unified School District No. 2 57.5%Dysart Unified School District No. 89 50.8%East Valley Institute of Technology No. 401 44.9%
Elfrida Elementary School District No. 12 52.0%
Eloy Elementary School District No. 11 56.9%Esperanza Accommodation District No. 99 49.8%Flagstaff Unified School District No. 1 61.3%Florence Unified School District No. 1 54.6%Flowing Wells Unified School District No. 8 57.8%
Fountain Hills Unified School District No. 98 56.4%
Fowler Elementary School District No. 45 56.9%
Fredonia-Moccasin Unified School District No. 6 60.2%Ft. Huachuca Accommodation School No. 00 56.5%Ft. Thomas Unified School District No. 7 54.0%
Gadsden Elementary School District No. 32 58.6%
Ganado Unified School District No. 20 46.7%
Gila Bend Unified School District No. 24 49.4%Gilbert Unified School District No. 41 63.4%Glendale Elementary School District No. 40 62.9%
Glendale Union High School District No. 205 57.3%Globe Unified School District No. 1 54.1% Graham County Special Services District No. 99 42.1% Grand Canyon Unified School District No. 4 53.1%Greenlee Alternative School District No. 00 75.7%Greenlee County Accommodation District No. 99 97.1%Hackberry Elementary School District No. 3 47.0%Hayden/Winkelman Unified School District No. 41 53.3%
Percentage PercentageDistrict District
(Continued)

OFFICE OF THE AUDITOR GENERAL17
Chapter 2
Table 3
Alphabetical Listing of DistrictsWith Percentage of Dollars
Spent in the ClassroomFiscal Year 2001
Heber-Overgaard Unified School District No. 6 50.2%Higley Unified School District No. 60 60.2%
Hillside Elementary School District No. 35 50.1%
Holbrook Unified School District No. 3 57.3%
Humboldt Unified School District No. 22 57.5%
Hyder Elementary School District No. 16 49.8%
Indian Oasis-Baboquivari Unified School Dist. No. 40 49.7%
Isaac Elementary School District No. 5 56.3%
J. O. Combs Elementary School District No. 44 50.5%
Joseph City Unified School District No. 2 48.8%
Kayenta Unified School District No. 27 55.1%
Kingman Elementary School District No. 4 57.2%
Kirkland Elementary School District No. 23 65.9%
Kyrene Elementary School District No. 28 60.2%
Lake Havasu Unified School District No. 1 60.3%
Laveen Elementary School District No. 59 53.8%Liberty Elementary School District No. 25 60.0%Litchfield Elementary School District No. 79 57.9%
Littlefield Elementary School District No. 9 52.5%
Littleton Elementary School District No. 65 56.8%
Madison Elementary School District No. 38 54.3%
Maine Consolidated Elementary School District No. 10 46.2%
Mammoth-San Manuel Unified School District No. 8 57.9%Marana Unified School District No. 6 52.9%Maricopa County Regional District No. 509 43.3%
Maricopa Unified School District No. 20 59.1%Mary C. O’Brien Accommodation School Dist. No. 90 45.1%Mayer Unified School District No. 43 55.1%
McNary Elementary School District No. 23 61.9%
McNeal Elementary School District No. 55 76.6%
Mesa Unified School District No. 4 61.9%
Miami Unified School District No. 40 52.0%
Mingus Union High School District No. 4 59.8%
Mobile Elementary School District No. 86 31.8%
Mohave Union High School District No. 30 57.2%
Mohave Valley Elementary School District No. 16 54.8%
Mohawk Valley Elementary School District No. 17 56.1%
Morenci Unified School District No. 18 54.9%
Morristown Elementary School District No. 75 49.5%Murphy Elementary School District No. 21 47.4%
Naco Elementary School District No. 23 64.2%
Nadaburg Elementary School District No. 81 53.3%
Nogales Unified School District No. 1 56.5%Northern Arizona Vocational Institute of Technology 83.9%Oracle Elementary School District No. 2 49.2%
Osborn Elementary School District No. 8 53.2%
Owens-Whitney Elementary School District No. 6 52.0%
Page Unified School District No. 8 56.5%
Palo Verde Elementary School District No. 49 52.3%
Paloma Elementary School District No. 94 43.1%
Palominas Elementary School District No. 49 55.4%Paradise Valley Unified School District No. 69 64.0%Parker Unified School District No. 27 55.3%
Patagonia Elementary School District No. 6 57.3%
Patagonia Union High School District No. 20 39.8%
Payson Unified School District No. 10 57.8%
Peach Springs Unified School District No. 8 57.2%
Pearce Elementary School District No. 22 56.9%
Pendergast Elementary School District No. 92 58.9%
Peoria Unified School District No. 11 61.9%
Phoenix Elementary School District No. 1 54.8%
Phoenix Union High School District No. 210 52.5%Picacho Elementary School District No. 33 55.0%
Pima Accommodation District No. 00 56.3%
Pima Unified School District No. 6 59.9%
Pine Strawberry Elementary School District No. 12 51.5%Pinon Unified School District No. 4 44.9%Pomerene Elementary School District No. 64 56.9%
Prescott Unified School District No. 1 61.3%
Quartzsite Elementary School District No. 4 47.3%
Queen Creek Unified School District No. 95 50.5%Rainbow Accommodation School District No. 99 60.7%Ray Unified School District No. 3 55.0%
Red Mesa Unified School District No. 27 43.6%
Red Rock Elementary School District No. 5 58.5%
Riverside Elementary School District No. 2 48.5%
Roosevelt Elementary School District No. 66 55.9%
Round Valley Unified School District No. 10 58.3%
Ruth Fisher Elementary School District No.90 52.6%
Sacaton Elementary School District No. 18 45.5%
PercentageDistrict PercentageDistrict
(Continued)

OFFICE OF THE AUDITOR GENERAL18
Chapter 2
Safford Unified School District No. 1 58.3%Sahuarita Unified School District No. 30 50.3%Salome Consolidated Elementary School Dist. No. 30 48.9%
San Carlos Unified School District No. 20 48.7%
San Fernando Elementary School District No. 80 45.5%San Simon Unified School District No. 18 52.2%Sanders Unified School District No. 18 41.3%
Santa Cruz Elementary School District No. 28 68.6%
Santa Cruz Valley Unified School District No. 35 58.2%
Santa Cruz Valley Union High School District No. 840 54.7%
Scottsdale Unified School District No. 48 58.6%
Sedona-Oak Creek Joint Unified School District No. 9 49.0%
Seligman Unified School District No. 40 56.8%
Sentinel Elementary School District No. 71 42.6%
Show Low Unified School District No. 10 57.9%
Sierra Vista Unified School District No. 68 53.4%
Skull Valley Elementary School District No. 15 53.3%
Snowflake Unified School District No. 5 61.1%
Solomon Elementary School District No. 5 49.0%
Somerton Elementary School District No. 11 50.4%
Sonoita Elementary School District No. 25 65.5%
St. David Unified School District No. 21 49.1%
St. Johns Unified School District No. 1 53.3%
Stanfield Elementary School District No. 24 56.0%
Sunnyside Unified School District No. 12 56.0%
Superior Unified School District No. 15 53.7%
Tanque Verde Unified School District No. 13 60.5%
Tempe Elementary School District No. 3 55.7%
Tempe Union High School District No. 213 58.0%
Thatcher Unified School District No. 4 58.8%
Tolleson Elementary School District No. 17 54.9%
Tolleson Union High School District No. 214 54.7%
Toltec Elementary School District No. 22 61.0%
Tombstone Unified School District No. 1 57.6%
Tonto Basin Elementary School District No. 33 59.3%
Topock Elementary School District No. 12 62.3%
Tuba City Unified School District No. 15 47.4%Tucson Unified School District No. 1 53.9%
Union Elementary School District No. 62 51.5%
Vail Unified School District No. 20 57.4%Valentine Elementary School District No. 22 72.3%Valley Union High School District No. 22 53.2%
Vernon Elementary School District No. 9 45.6%
Washington Elementary School District No. 6 64.0%
Wellton Elementary School District No. 24 61.3%
Wenden Elementary School District No. 19 50.0%
Whiteriver Unified School District No. 20 54.9%Wickenburg Unified School District No. 9 56.1%Willcox Unified School District No. 13 58.2%
Williams Unified School District No. 2 60.2%
Wilson Elementary School District No. 7 58.7%
Window Rock Unified School District No. 8 54.1%
Winslow Unified School District No. 1 55.1%
Yarnell Elementary School District No. 52 56.4%Yavapai Accommodation District No. 99 67.0%Young Elementary School District No. 5 61.7%Yucca Elementary School District No. 13 67.8%Yuma County Accommodation District No. 99 27.1%Yuma Elementary School District No. 1 56.4%Yuma Union High School District No. 70 56.8%
Table 3
Alphabetical Listing of DistrictsWith Percentage of Dollars
Spent in the ClassroomFiscal Year 2001
PercentageDistrict PercentageDistrict
Source: Auditor General staff analysis of data provided by individual school districts and the Arizona Department ofEducation.

OFFICE OF THE AUDITOR GENERAL 19
Chapter 2
Table 4
Ranked Listing of Districts by Percentage ofDollars Spent in the Classroom, Grouped by Size
Fiscal Year 2001
Super Large (over 40,000 students)Average = 57.9%
Mesa Unified School District No. 4 61.9%
Tucson Unified School District No. 1 53.9%
Large (5,001 to 40,000 students)Average = 58.2%
Cartwright Elementary School District No. 83 66.4%
Paradise Valley Unified School District No. 69 64.0%
Washington Elementary School District No. 6 64.0%
Gilbert Unified School District No. 41 63.4%
Glendale Elementary School District No. 40 62.9%
Peoria Unified School District No. 11 61.9%
Flagstaff Unified School District No. 1 61.3%
Alhambra Elementary School District No. 68 60.8%
Chandler Unified School District No. 80 60.7%
Lake Havasu Unified School District No. 1 60.3%
Kyrene Elementary School District No. 28 60.2%
Deer Valley Unified School District No. 97 60.1%
Pendergast Elementary School District No. 92 58.9%
Scottsdale Unified School District No. 48 58.6%
Tempe Union High School District No. 213 58.0%
Flowing Wells Unified School District No. 8 57.8%
Amphitheater Unified School District No. 10 57.6%
Humboldt Unified School District No. 22 57.5%
Casa Grande Elementary School District No. 4 57.5%
Glendale Union High School District No. 205 57.3%
Yuma Union High School District No. 70 56.8%
Creighton Elementary School District No. 14 56.8%
Nogales Unified School District No. 1 56.5%
Yuma Elementary School District No. 1 56.4%
Isaac Elementary School District No. 5 56.3%
Sunnyside Unified School District No. 12 56.0%
Roosevelt Elementary School District No. 66 55.9%
Tempe Elementary School District No. 3 55.7%
Phoenix Elementary School District No. 1 54.8%
Apache Junction Unified School District No. 43 53.8%
Sierra Vista Unified School District No. 68 53.4%
Marana Unified School District No. 6 52.9%
Phoenix Union High School District No. 210 52.5%Dysart Unified School District No. 89 50.8%
Medium (600 to 5,000 students)Average = 55.2%
Bullhead City Elementary School District No. 15 64.1%
Douglas Unified School District No. 27 62.2%
Prescott Unified School District No. 1 61.3%
Snowflake Unified School District No. 5 61.1%
Toltec Elementary School District No. 22 61.0%
Blue Ridge Unified School District No. 32 60.7%
Tanque Verde Unified School District No. 13 60.5%
Chino Valley Unified School District No. 51 60.5%
Williams Unified School District No. 2 60.2%
Higley Unified School District No. 60 60.2%
Avondale Elementary School District No. 44 60.1%
Liberty Elementary School District No. 25 60.0%
Pima Unified School District No. 6 59.9%
Mingus Union High School District No. 4 59.8%
Maricopa Unified School District No. 20 59.1%
Thatcher Unified School District No. 4 58.8%
Wilson Elementary School District No. 7 58.7%
Catalina Foothills Unified School District No. 16 58.7%
Gadsden Elementary School District No. 32 58.6%
Round Valley Unified School District No. 10 58.3%
Safford Unified School District No. 1 58.3%
Santa Cruz Valley Unified School District No. 35 58.2%
Willcox Unified School District No. 13 58.2%
Mammoth-San Manuel Unified School District No. 8 57.9%
Show Low Unified School District No. 10 57.9%
Litchfield Elementary School District No. 79 57.9%
Payson Unified School District No. 10 57.8%
Tombstone Unified School District No. 1 57.6%
Vail Unified School District No. 20 57.4%
Holbrook Unified School District No. 3 57.3%
Kingman Elementary School District No. 4 57.2%
Mohave Union High School District No. 30 57.2%
Fowler Elementary School District No. 45 56.9%
Eloy Elementary School District No. 11 56.9%
Crane Elementary School District No. 13 56.8%
Littleton Elementary School District No. 65 56.8%
Page Unified School District No. 8 56.5%
Fountain Hills Unified School District No. 98 56.4%Wickenburg Unified School District No. 9 56.1%Stanfield Elementary School District No. 24 56.0%
(Continued)

OFFICE OF THE AUDITOR GENERAL 20
Chapter 2
Table 4
Ranked Listing of Districts by Percentage ofDollars Spent in the Classroom, Grouped by Size
Fiscal Year 2001
Balsz Elementary School District No. 31 55.7%
Agua Fria Union High School District No. 216 55.7%
Palominas Elementary School District No. 49 55.4%
Parker Unified School District No. 27 55.3%
Camp Verde Unified School District No. 28 55.2%
Kayenta Unified School District No. 27 55.1%
Winslow Unified School District No. 1 55.1%
Ray Unified School District No. 3 55.0%
Tolleson Elementary School District No. 17 54.9%
Whiteriver Unified School District No. 20 54.9%
Morenci Unified School District No. 18 54.9%
Mohave Valley Elementary School District No. 16 54.8%
Cave Creek Unified School District No. 93 54.8%
Tolleson Union High School District No. 214 54.7%
Florence Unified School District No. 1 54.6%
Casa Grande Union High School District No. 82 54.4%
Madison Elementary School District No. 38 54.3%
Globe Unified School District No. 1 54.1%
Window Rock Unified School District No. 8 54.1%
Ft. Thomas Unified School District No. 7 54.0%
Buckeye Elementary School District No. 33 53.9%
Cottonwood-Oak Creek Elem. School District No. 6 53.8%
Laveen Elementary School District No. 59 53.8%
Superior Unified School District No. 15 53.7%
St. Johns Unified School District No. 1 53.3%
Coolidge Unified School District No. 21 53.3%
Osborn Elementary School District No. 8 53.2%
Bisbee Unified School District No. 2 52.7%
Colorado River Union High School District No. 2 52.1%
Altar Valley Elementary School District No. 51 52.0%
Miami Unified School District No. 40 52.0%
Queen Creek Unified School District No. 95 50.5%
Somerton Elementary School District No. 11 50.4%
Sahuarita Unified School District No. 30 50.3%
Indian Oasis-Baboquivari Unified S. D. No. 40 49.7%
Benson Unified School District No. 9 49.5%
Sedona-Oak Creek Joint Unified S. D. No. 9 49.0%San Carlos Unified School District No. 20 48.7%Buckeye Union High School District No. 201 48.3%
Chinle Unified School District No. 24 47.7%
Murphy Elementary School District No. 21 47.4%
Tuba City Unified School District No. 15 47.4%
Ganado Unified School District No. 20 46.7%
Pinon Unified School District No. 4 44.9%
Red Mesa Unified School District No. 27 43.6%Sanders Unified School District No. 18 41.3%
Small (less than 600 students)Average = 54.5%
Blue Elementary School District No. 22 88.7%
McNeal Elementary School District No. 55 76.6%
Valentine Elementary School District No. 22 72.3%
Santa Cruz Elementary School District No. 28 68.6%
Yucca Elementary School District No. 13 67.8%
Double Adobe Elementary School District No. 45 66.0%
Kirkland Elementary School District No. 23 65.9%
Sonoita Elementary School District No. 25 65.5%
Apache Elementary School District No. 42 64.9%
Naco Elementary School District No. 23 64.2%
Crown King Elementary School District No. 41 63.9%
Topock Elementary School District No. 12 62.3%
McNary Elementary School District No. 23 61.9%
Young Elementary School District No. 5 61.7%
Wellton Elementary School District No. 24 61.3%
Ajo Unified School District No. 15 60.2%
Fredonia-Moccasin Unified School District No. 6 60.2%
Cochise Elementary School District No. 26 60.2%
Aguila Elementary School District No. 63 59.9%
Bouse Elementary School District No. 26 59.8%
Beaver Creek Elementary School District No. 26 59.4%
Tonto Basin Elementary School District No. 33 59.3%
Bonita Elementary School District No. 16 58.6%
Red Rock Elementary School District No. 5 58.5%
Bagdad Unified School District No. 20 57.5%
Duncan Unified School District No. 2 57.5%
Patagonia Elementary School District No. 6 57.3%
Peach Springs Unified School District No. 8 57.2%
Continental Elementary School District No. 39 57.0%
Pearce Elementary School District No. 22 56.9%
Pomerene Elementary School District No. 64 56.9%
Seligman Unified School District No. 40 56.8%
Clarkdale-Jerome Elementary School District No. 3 56.7%
Yarnell Elementary School District No. 52 56.4%
Mohawk Valley Elementary School District No. 17 56.1%
Alpine Elementary School District No. 7 55.3%
Concho Elementary School District No. 6 55.2%
Medium (continued) Medium (concluded)
(Continued)

OFFICE OF THE AUDITOR GENERAL 21
Chapter 2
Table 4
Ranked Listing of Districts by Percentage ofDollars Spent in the Classroom, Grouped by Size
Fiscal Year 2001
Mayer Unified School District No. 43 55.1%
Picacho Elementary School District No. 33 55.0%
Santa Cruz Valley Union H. S. District No. 840 54.7%
Clifton Unified School District No. 3 54.1%
Skull Valley Elementary School District No. 15 53.3%
Nadaburg Elementary School District No. 81 53.3%
Hayden/Winkelman Unified School District No. 41 53.3%
Valley Union High School District No. 22 53.2%
Grand Canyon Unified School District No. 4 53.1%
Ash Fork Joint Unified School District No. 31 53.1%
Bowie Unified School District No. 14 52.8%
Ruth Fisher Elementary School District No.90 52.6%
Littlefield Elementary School District No. 9 52.5%
Arlington Elementary School District No. 47 52.4%
Palo Verde Elementary School District No. 49 52.3%
San Simon Unified School District No. 18 52.2%
Owens-Whitney Elementary School District No. 6 52.0%
Elfrida Elementary School District No. 12 52.0%Pine Strawberry Elementary School District No. 12 51.5%Union Elementary School District No. 62 51.5%
Antelope Union High School District No. 50 51.0%
J. O. Combs Elementary School District No. 44 50.5%
Heber-Overgaard Unified School District No. 6 50.2%
Hillside Elementary School District No. 35 50.1%
Wenden Elementary School District No. 19 50.0%
Small (continued) Small (concluded)
Hyder Elementary School District No. 16 49.8%
Morristown Elementary School District No. 75 49.5%
Gila Bend Unified School District No. 24 49.4%
Oracle Elementary School District No. 2 49.2%
St. David Unified School District No. 21 49.1%
Solomon Elementary School District No. 5 49.0%Salome Consolidated Elem. School District No. 30 48.9%Joseph City Unified School District No. 2 48.8%
Riverside Elementary School District No. 2 48.5%
Canon Elementary School District No. 50 47.9%
Quartzsite Elementary School District No. 4 47.3%
Hackberry Elementary School District No. 3 47.0%
Maine Consolidated Elem. School District No. 10 46.2%
Vernon Elementary School District No. 9 45.6%
Sacaton Elementary School District No. 18 45.5%
San Fernando Elementary School District No. 80 45.5%
Ash Creek Elementary School District No. 53 45.5%
Cedar Unified School District No. 25 45.4%
Chloride Elementary School District No. 11 44.8%
Paloma Elementary School District No. 94 43.1%
Sentinel Elementary School District No. 71 42.6%
Bicentennial Union High School District No. 76 41.6%
Colorado City Unified School District No. 14 39.9%
Patagonia Union High School District No. 20 39.8%
Mobile Elementary School District No. 86 31.8%
Source: Auditor General staff analysis of data provided by individual school districts and the Arizona Department ofEducation.
OFFICE OF THE AUDITOR GENERAL22
Chapter 2
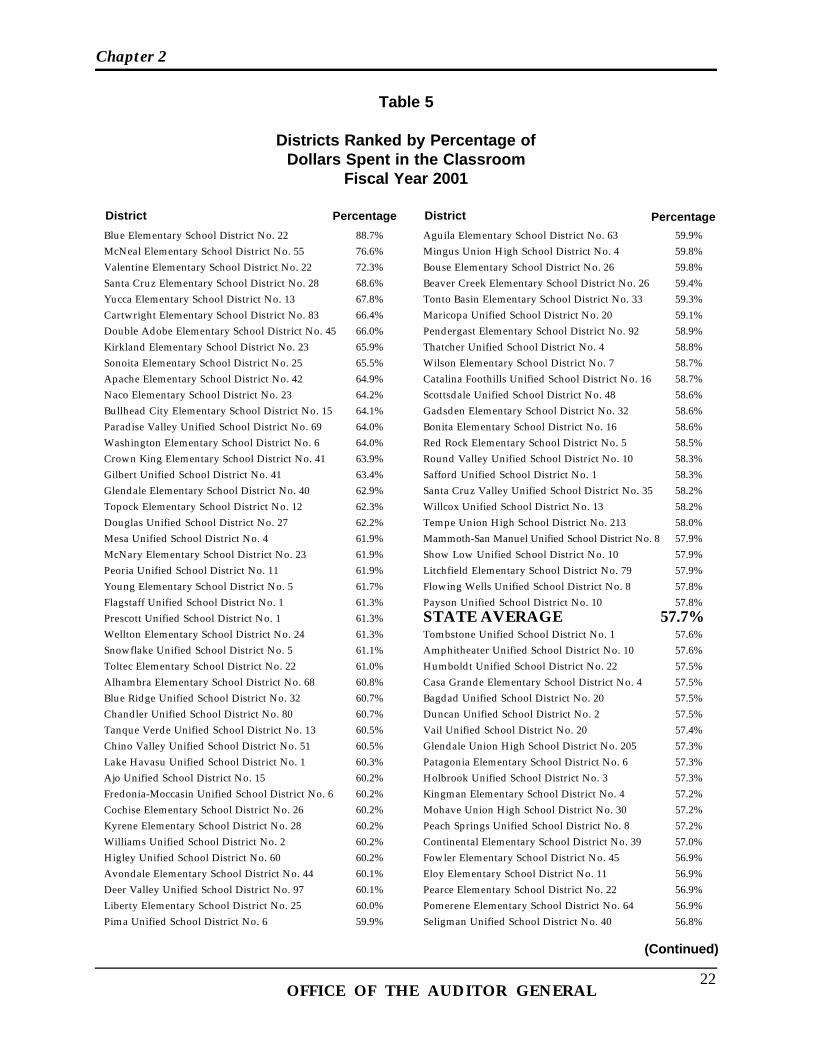
Table 5
Districts Ranked by Percentage ofDollars Spent in the Classroom
Fiscal Year 2001
District DistrictPercentage PercentageBlue Elementary School District No. 22 88.7%McNeal Elementary School District No. 55 76.6%Valentine Elementary School District No. 22 72.3%Santa Cruz Elementary School District No. 28 68.6%Yucca Elementary School District No. 13 67.8%Cartwright Elementary School District No. 83 66.4%Double Adobe Elementary School District No. 45 66.0%Kirkland Elementary School District No. 23 65.9%Sonoita Elementary School District No. 25 65.5%Apache Elementary School District No. 42 64.9%Naco Elementary School District No. 23 64.2%Bullhead City Elementary School District No. 15 64.1%Paradise Valley Unified School District No. 69 64.0%Washington Elementary School District No. 6 64.0%Crown King Elementary School District No. 41 63.9%Gilbert Unified School District No. 41 63.4%Glendale Elementary School District No. 40 62.9%Topock Elementary School District No. 12 62.3%Douglas Unified School District No. 27 62.2%Mesa Unified School District No. 4 61.9%McNary Elementary School District No. 23 61.9%Peoria Unified School District No. 11 61.9%Young Elementary School District No. 5 61.7%Flagstaff Unified School District No. 1 61.3%Prescott Unified School District No. 1 61.3%Wellton Elementary School District No. 24 61.3%Snowflake Unified School District No. 5 61.1%Toltec Elementary School District No. 22 61.0%Alhambra Elementary School District No. 68 60.8%Blue Ridge Unified School District No. 32 60.7%Chandler Unified School District No. 80 60.7%Tanque Verde Unified School District No. 13 60.5%Chino Valley Unified School District No. 51 60.5%Lake Havasu Unified School District No. 1 60.3%Ajo Unified School District No. 15 60.2%Fredonia-Moccasin Unified School District No. 6 60.2%Cochise Elementary School District No. 26 60.2%Kyrene Elementary School District No. 28 60.2%Williams Unified School District No. 2 60.2%Higley Unified School District No. 60 60.2%Avondale Elementary School District No. 44 60.1%Deer Valley Unified School District No. 97 60.1%Liberty Elementary School District No. 25 60.0%Pima Unified School District No. 6 59.9%
Aguila Elementary School District No. 63 59.9%Mingus Union High School District No. 4 59.8%Bouse Elementary School District No. 26 59.8%Beaver Creek Elementary School District No. 26 59.4%Tonto Basin Elementary School District No. 33 59.3%Maricopa Unified School District No. 20 59.1%Pendergast Elementary School District No. 92 58.9%Thatcher Unified School District No. 4 58.8%Wilson Elementary School District No. 7 58.7%Catalina Foothills Unified School District No. 16 58.7%Scottsdale Unified School District No. 48 58.6%Gadsden Elementary School District No. 32 58.6%Bonita Elementary School District No. 16 58.6%Red Rock Elementary School District No. 5 58.5%Round Valley Unified School District No. 10 58.3%Safford Unified School District No. 1 58.3%Santa Cruz Valley Unified School District No. 35 58.2%Willcox Unified School District No. 13 58.2%Tempe Union High School District No. 213 58.0%Mammoth-San Manuel Unified School District No. 8 57.9%Show Low Unified School District No. 10 57.9%Litchfield Elementary School District No. 79 57.9%Flowing Wells Unified School District No. 8 57.8%Payson Unified School District No. 10 57.8%STATE AVERAGE 57.7%Tombstone Unified School District No. 1 57.6%Amphitheater Unified School District No. 10 57.6%Humboldt Unified School District No. 22 57.5%Casa Grande Elementary School District No. 4 57.5%Bagdad Unified School District No. 20 57.5%Duncan Unified School District No. 2 57.5%Vail Unified School District No. 20 57.4%Glendale Union High School District No. 205 57.3%Patagonia Elementary School District No. 6 57.3%Holbrook Unified School District No. 3 57.3%Kingman Elementary School District No. 4 57.2%Mohave Union High School District No. 30 57.2%Peach Springs Unified School District No. 8 57.2%Continental Elementary School District No. 39 57.0%Fowler Elementary School District No. 45 56.9%Eloy Elementary School District No. 11 56.9%Pearce Elementary School District No. 22 56.9%Pomerene Elementary School District No. 64 56.9%Seligman Unified School District No. 40 56.8%
(Continued)

OFFICE OF THE AUDITOR GENERAL23
Chapter 2
Table 5
Districts Ranked by Percentage ofDollars Spent in the Classroom
Fiscal Year 2001
District DistrictPercentage Percentage
Crane Elementary School District No. 13 56.8%Littleton Elementary School District No. 65 56.8%Yuma Union High School District No. 70 56.8%Creighton Elementary School District No. 14 56.8%Clarkdale-Jerome Elementary School District No. 3 56.7%Nogales Unified School District No. 1 56.5%Page Unified School District No. 8 56.5%Yuma Elementary School District No. 1 56.4%Yarnell Elementary School District No. 52 56.4%Fountain Hills Unified School District No. 98 56.4%Isaac Elementary School District No. 5 56.3%Wickenburg Unified School District No. 9 56.1%Mohawk Valley Elementary School District No. 17 56.1%Stanfield Elementary School District No. 24 56.0%Sunnyside Unified School District No. 12 56.0%Roosevelt Elementary School District No. 66 55.9%Balsz Elementary School District No. 31 55.7%Tempe Elementary School District No. 3 55.7%Agua Fria Union High School District No. 216 55.7%Palominas Elementary School District No. 49 55.4%Alpine Elementary School District No. 7 55.3%Parker Unified School District No. 27 55.3%Camp Verde Unified School District No. 28 55.2%Concho Elementary School District No. 6 55.2%Kayenta Unified School District No. 27 55.1%Mayer Unified School District No. 43 55.1%Winslow Unified School District No. 1 55.1%Ray Unified School District No. 3 55.0%Picacho Elementary School District No. 33 55.0%Tolleson Elementary School District No. 17 54.9%Whiteriver Unified School District No. 20 54.9%Morenci Unified School District No. 18 54.9%Mohave Valley Elementary School District No. 16 54.8%Cave Creek Unified School District No. 93 54.8%Phoenix Elementary School District No. 1 54.8%Santa Cruz Valley Union High School District No. 840 54.7%Tolleson Union High School District No. 214 54.7%Florence Unified School District No. 1 54.6%Casa Grande Union High School District No. 82 54.4%Madison Elementary School District No. 38 54.3%Globe Unified School District No. 1 54.1%Window Rock Unified School District No. 8 54.1%Clifton Unified School District No. 3 54.1%Ft. Thomas Unified School District No. 7 54.0%
Buckeye Elementary School District No. 33 53.9%Tucson Unified School District No. 1 53.9%Apache Junction Unified School District No. 43 53.8%Cottonwood-Oak Creek Elem. School District No. 6 53.8%Laveen Elementary School District No. 59 53.8%Superior Unified School District No. 15 53.7%Sierra Vista Unified School District No. 68 53.4%St. Johns Unified School District No. 1 53.3%Coolidge Unified School District No. 21 53.3%Skull Valley Elementary School District No. 15 53.3%Nadaburg Elementary School District No. 81 53.3%Hayden/Winkelman Unified School District No. 41 53.3%Osborn Elementary School District No. 8 53.2%Valley Union High School District No. 22 53.2%Grand Canyon Unified School District No. 4 53.1%Ash Fork Joint Unified School District No. 31 53.1%Marana Unified School District No. 6 52.9%Bowie Unified School District No. 14 52.8%Bisbee Unified School District No. 2 52.7%Ruth Fisher Elementary School District No. 90 52.6%Phoenix Union High School District No. 210 52.5%Littlefield Elementary School District No. 9 52.5%Arlington Elementary School District No. 47 52.4%Palo Verde Elementary School District No. 49 52.3%San Simon Unified School District No. 18 52.2%Colorado River Union High School District No. 2 52.1%Owens-Whitney Elementary School District No. 6 52.0%Altar Valley Elementary School District No. 51 52.0%Elfrida Elementary School District No. 12 52.0%Miami Unified School District No. 40 52.0%Pine Strawberry Elementary School District No. 12 51.5%Union Elementary School District No. 62 51.5%Antelope Union High School District No. 50 51.0%Dysart Unified School District No. 89 50.8%Queen Creek Unified School District No. 95 50.5%J. O. Combs Elementary School District No. 44 50.5%Somerton Elementary School District No. 11 50.4%Sahuarita Unified School District No. 30 50.3%Heber-Overgaard Unified School District No. 6 50.2%Hillside Elementary School District No. 35 50.1%Wenden Elementary School District No. 19 50.0%Hyder Elementary School District No. 16 49.8%Indian Oasis-Baboquivari Unified School District No. 40 49.7%Morristown Elementary School District No. 75 49.5%
(Continued)

OFFICE OF THE AUDITOR GENERAL24
Chapter 2
Table 5
Districts Ranked by Percentage ofDollars Spent in the Classroom
Fiscal Year 2001
District Percentage
Benson Unified School District No. 9 49.5%Gila Bend Unified School District No. 24 49.4%Oracle Elementary School District No. 2 49.2%St. David Unified School District No. 21 49.1%Solomon Elementary School District No. 5 49.0%Sedona-Oak Creek Joint Unified School District No. 9 49.0%Salome Consolidated Elementary School District No. 30 48.9%Joseph City Unified School District No. 2 48.8%San Carlos Unified School District No. 20 48.7%Riverside Elementary School District No. 2 48.5%Buckeye Union High School District No. 201 48.3%Canon Elementary School District No. 50 47.9%Chinle Unified School District No. 24 47.7%Murphy Elementary School District No. 21 47.4%Tuba City Unified School District No. 15 47.4%Quartzsite Elementary School District No. 4 47.3%Hackberry Elementary School District No. 3 47.0%Ganado Unified School District No. 20 46.7%Maine Consolidated Elementary School District No. 10 46.2%Vernon Elementary School District No. 9 45.6%Sacaton Elementary School District No. 18 45.5%San Fernando Elementary School District No. 80 45.5%Ash Creek Elementary School District No. 53 45.5%Cedar Unified School District No. 25 45.4%Pinon Unified School District No. 4 44.9%Chloride Elementary School District No. 11 44.8%Red Mesa Unified School District No. 27 43.6%Paloma Elementary School District No. 94 43.1%Sentinel Elementary School District No. 71 42.6%Bicentennial Union High School District No. 76 41.6%Sanders Unified School District No. 18 41.3%Colorado City Unified School District No. 14 39.9%Patagonia Union High School District No. 20 39.8%Mobile Elementary School District No. 86 31.8%
Source: Auditor General staff analysis of data provided by individual school districts and the Arizona Department ofEducation.

OFFICE OF THE AUDITOR GENERAL a-i
aAfter reviewing current education finance studies by privateresearch institutes, state agencies, and the National Center forEducation Statistics, and after speaking with representatives ofthe Arizona Department of Education and Arizona school dis-tricts, Auditor General staff developed a list of factors that couldinfluence districts’ classroom dollar percentages. Throughanalysis of districts’ fiscal year 2001 Annual Financial Reports,summary accounting data, and other related data, such asattending average daily membership, auditors determined thatthese factors may have a positive, a negative, or no relationshipto classroom dollars.
To facilitate the analysis, auditors ranked districts by their class-room dollar percentages and grouped them based on theamount by which their percentages were above or below thecalculated state average. These groupings are shown in Table 6below. The remaining tables and charts in this appendix reflectthe results of the analysis of the various factors.
APPENDIX A
Table 6
Districts Grouped by Comparison to State Average
Fiscal Year 2001
Group
Comparison
Range
Number of
Districts
Group
Average 6 More than 5% above >62.7% 17 67.6% 5 2.1% to 5% above 59.8 to 62.7 30 60.7 4 2% above to 2% below 55.7 to 59.7 59 57.4 3 2.1% to 5% below 52.7 to 55.6 44 54.2 2 5.1% to 10% below 47.7 to 52.6 38 50.4 1 More than 10% below <47.7 21 44.0
Source: Auditor General analysis of school districts’ Annual Financial Reports and summary
accounting data.

OFFICE OF THE AUDITOR GENERALa-ii
Appendix A
The attending Average Daily Membership (ADM) counts inFigure 3 below are the averages for each group, not the countsfor the individual districts. Group 6 contains both large andvery small districts, with average attending ADMs rangingfrom 2 to 33,600.
As shown in Figure 3, the districts with higher classroom dollarpercentages also tend to have a high average number of stu-dents (higher average attending ADM).

OFFICE OF THE AUDITOR GENERAL a-iii
aSalaries represent about 76 percent of districts’ classroominstruction dollars. As Figure 4 shows, districts with the highestclassroom dollar percentages (Group 6) also pay significantlyhigher average teacher salaries. In fact, for every $1,000 paid toteachers annually, there is a corresponding 0.3 percent increasein the classroom dollar percentage.
Appendix A

The Teacher Experience Index (TEI) calculates how the averageyears of experience of a district’s certified teachers compare tothe State’s average years of experience. For 2001, the state aver-age was 8.8 years; an index of 1.0 indicates a district’s teachersaverage the same number of years of experience as the stateaverage. Districts receive a 2.25 percent base support levelincrease in their funding for each year their TEI is above thestate average. Group 6, those districts with the highest class-room dollar percentages, is the only group that had an averageTEI higher than 1.0. As shown in Figure 5, as the average TEIdeclines, so does the percentage of dollars spent in the class-room.
OFFICE OF THE AUDITOR GENERALa-iv
Appendix A

As summarized in Table 7, the 17 districts in Group 6, those dis-tricts with the highest classroom dollar percentages, also hadthe lowest average administrative cost percentages in theAuditor General’s 1999 administrative cost study. Conversely,districts in Group 1, with the lowest classroom dollar percent-ages, had the highest average administrative cost percentages.
Figures 6 through 8 (see page a-vi), demonstrate the negativerelationship of dollars spent on food service and transportationto districts’ classroom dollar percentages. That is, districts withthe lowest classroom dollar percentages tend to have higheraverage food service and transportation costs per pupil.
OFFICE OF THE AUDITOR GENERAL a-v
a
Appendix A
Table 7
Classroom Dollar Percentage Groups and Their Average Administrative Cost Percentages
Fiscal Year 2001
Group
Average Classroom
Dollar Percentage
Average Fiscal Year 1999
Administrative Cost Percentage
Number of Districts in
Group 6 67.6% 10.0% 17 5 60.7 13.2 30 4 57.4 13.5 59 3 54.2 13.6 44 2 50.4 15.3 38 1 44.0 17.7 21 Source: Auditor General staff analysis of fiscal year 2001 data provided by individual school districts
and the Arizona Department of Education and the Office of the Auditor General’s November 2000 Special Study, Factors Impacting School District Administrative Costs.

OFFICE OF THE AUDITOR GENERALa-vi
Appendix A
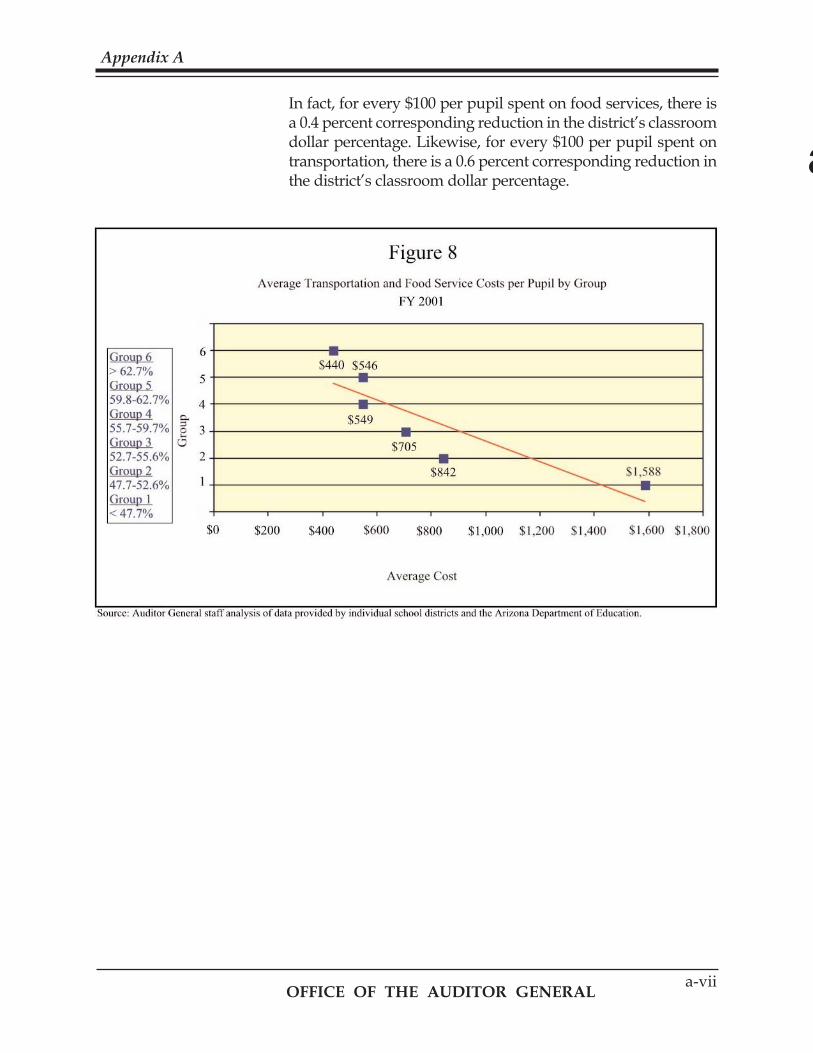
In fact, for every $100 per pupil spent on food services, there isa 0.4 percent corresponding reduction in the district’s classroomdollar percentage. Likewise, for every $100 per pupil spent ontransportation, there is a 0.6 percent corresponding reduction inthe district’s classroom dollar percentage.
OFFICE OF THE AUDITOR GENERAL a-vii
a
Appendix A

OFFICE OF THE AUDITOR GENERALa-viii
Figure 9 depicts the negative relationship that federal and stateprogram dollars have to classroom dollars. Group 1, those dis-tricts averaging more than 10 percent below the statewide per-centage, tend to have a higher amount of federal and state pro-gram expenditures per pupil. In fact, for every $100 per-pupilfederal and state program expenditure, there is a corresponding0.5 percent reduction in the district’s classroom dollar percent-age. This may occur due to the districts having more federal andstate programs that are for purposes other than classroominstruction. Examples of federal and state programs include theWorkforce Investment Act and Adult Basic Education pro-grams.
Appendix A

As Figure 10 shows, a district’s per-pupil desegregation expen-ditures do not appear to influence the district’s classroom dollarpercentage. The 19 districts with desegregation expendituresvary greatly in the amount spent per pupil, yet their classroomdollar percentages remain relatively close to the State’s average.
OFFICE OF THE AUDITOR GENERAL a-ix
a
Appendix A
OFFICE OF THE AUDITOR GENERALa-x
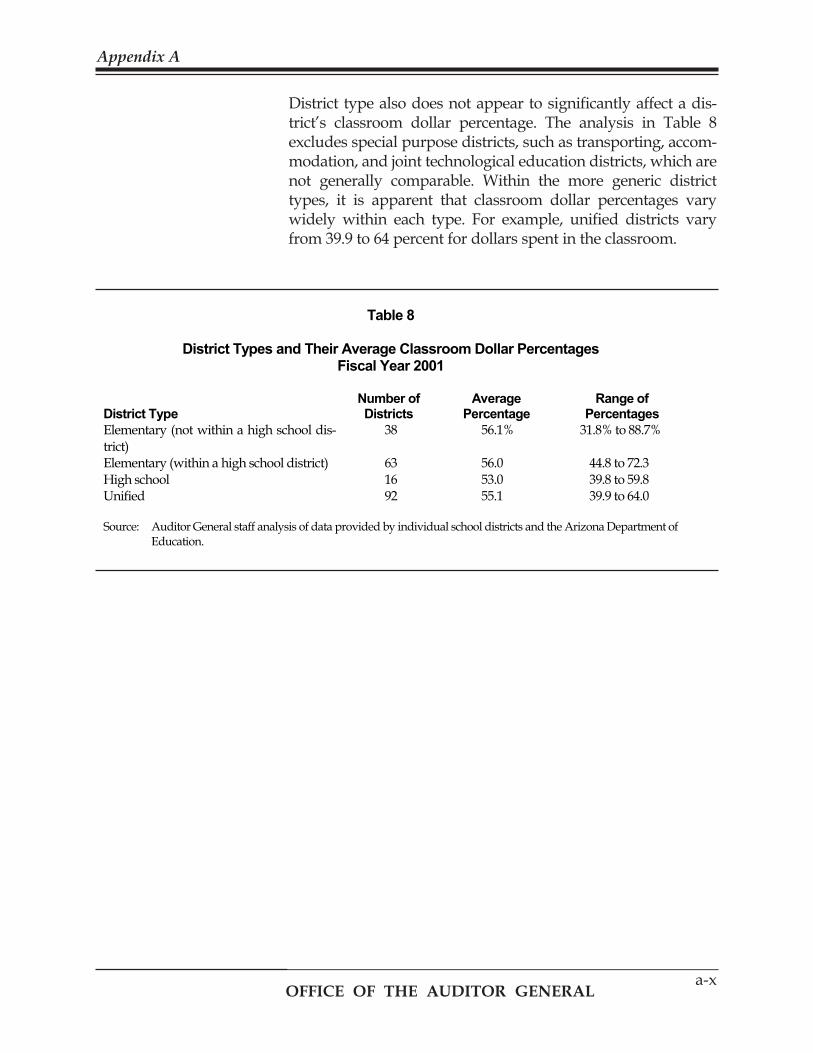
District type also does not appear to significantly affect a dis-trict’s classroom dollar percentage. The analysis in Table 8excludes special purpose districts, such as transporting, accom-modation, and joint technological education districts, which arenot generally comparable. Within the more generic districttypes, it is apparent that classroom dollar percentages varywidely within each type. For example, unified districts varyfrom 39.9 to 64 percent for dollars spent in the classroom.
Appendix A
Table 8
District Types and Their Average Classroom Dollar Percentages
Fiscal Year 2001
District Type
Number of Districts
Average Percentage
Range of Percentages
Elementary (not within a high school dis-trict)
38 56.1% 31.8% to 88.7%
Elementary (within a high school district) 63 56.0 44.8 to 72.3 High school 16 53.0 39.8 to 59.8 Unified 92 55.1 39.9 to 64.0 Source: Auditor General staff analysis of data provided by individual school districts and the Arizona Department of
Education.
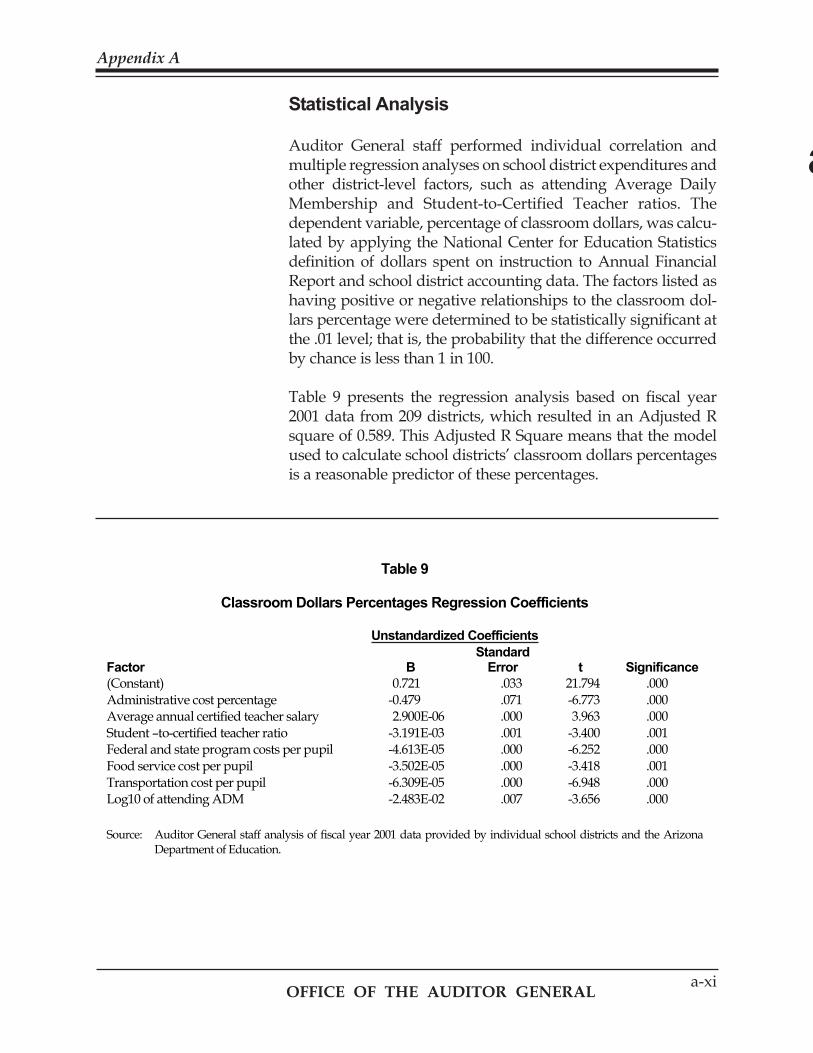
Statistical Analysis
Auditor General staff performed individual correlation andmultiple regression analyses on school district expenditures andother district-level factors, such as attending Average DailyMembership and Student-to-Certified Teacher ratios. Thedependent variable, percentage of classroom dollars, was calcu-lated by applying the National Center for Education Statisticsdefinition of dollars spent on instruction to Annual FinancialReport and school district accounting data. The factors listed ashaving positive or negative relationships to the classroom dol-lars percentage were determined to be statistically significant atthe .01 level; that is, the probability that the difference occurredby chance is less than 1 in 100.
Table 9 presents the regression analysis based on fiscal year2001 data from 209 districts, which resulted in an Adjusted Rsquare of 0.589. This Adjusted R Square means that the modelused to calculate school districts’ classroom dollars percentagesis a reasonable predictor of these percentages.
Appendix A
OFFICE OF THE AUDITOR GENERAL a-xi
a
Table 9
Classroom Dollars Percentages Regression Coefficients
Unstandardized Coefficients Factor
B
Standard Error
t
Significance
(Constant) 0.721 .033 21.794 .000 Administrative cost percentage -0.479 .071 -6.773 .000 Average annual certified teacher salary 2.900E-06 .000 3.963 .000 Student –to-certified teacher ratio -3.191E-03 .001 -3.400 .001 Federal and state program costs per pupil -4.613E-05 .000 -6.252 .000 Food service cost per pupil -3.502E-05 .000 -3.418 .001 Transportation cost per pupil -6.309E-05 .000 -6.948 .000 Log10 of attending ADM -2.483E-02 .007 -3.656 .000 Source: Auditor General staff analysis of fiscal year 2001 data provided by individual school districts and the Arizona
Department of Education.

OFFICE OF THE AUDITOR GENERALa-xii
(This Page Intentionally Left Blank)

OFFICE OF THE AUDITOR GENERAL b-i
aSchool District Types
Elementary district, not within a high school district—Not located within the boundaries of a high school district, offers instruction for preschool children with disabilities and kindergarten through grade 8. Elementary district, within a high school district—Located within the boundaries of a high school district, offers instruction for preschool children with disabilities and kindergarten through grade 8. Union high school district—Offers instruction for grades 9 through 12. Unified school district—Offers instruction for preschool children with disabilities and kindergarten through grade 12. Accommodation district—Operated by the county to serve a military reservation or territory that is not within the boundaries of a school district or a school that provides services to homeless children or alternative education programs. Joint technological education district—Formed by other school districts to provide technology and vocational education. Transporting district—Transports students from their district to schools within other districts for instruction.
APPENDIX B

(This Page Intentionally Left Blank)
OFFICE OF THE AUDITOR GENERAL

Mission
The mission of the Office of the Auditor General is to independently provide the Legislature, government decision-makers, and the public with impartial, relevant information, specific recommendations, and technical assistance to improve state and local government operations.
Division of School Audits
Director Sharron E. Walker, CPA, CFE
Managers Natalie Coombs
Ross Ehrick, CPA Ann Orrico
Seniors Staff Ken Alexander, CPA Kate Black
Jason Blake, CPA Kristin Borns Leslie Coca Vicki Hunter
Bridget Harper Joanne Prakapas, CIA Tara Lennon Revea Schmidt
Michael Quinlan, CPA Wendy Simeon David Winans, CPA