Oppression of Minority Shareholders- Protecting Minority Rights

Arizona Minority Student Progress Report
2016The Transformation Continues
Milem Salazar Bryan
sixth edition

Dr. David CamachoNorthern Arizona University
Susan Carlson, ChairCarlson & Affiliates
Panfilo Contreras Private Education Consultant
Dr. Mark S. DenkeArizona Board of Regents
Dr. Alfredo G. De Los Santos Jr.Founding Member
Dr. René X. DiazAZ Hispanic School Admin. Association
Dr. Dolores Duran-CerdaPima Community College
Joseph GarcíaArizona State University
Tannya GaxiolaThe University of Arizona
Mary HaluskaArizona Department of Education
Fred LockhartArizona Private School Association
Everardo Martinez-Inzunza Arizona Western College
Jacob MooreArizona State University
Dr. Ray OstosMaricopa Community College District
Dr. Rebecca TsosieArizona State University
Magdalena VerdugoChicanos Por La Causa, Inc.
Dr. Angie WilliamsUniversity of Phoenix
COMMISSION STAFF
Dr. April OsbornExecutive Director
Julie VoOffice and Program Manager
PREPARED BY
Dr. Jeffrey F. MilemKarina G. SalazarW. Patrick Bryan
The University of ArizonaCenter for the Study of Higher Education
AmepacArizona Minority Education Policy Analysis Center
INTRODUCTION
REPORT OVERVIEW ........................................................4
READING THE REPORT .................................................. 5
EXECUTIVE SUMMARY
INTRODUCTION .............................................................. 6
ARIZONA DEMOGRAPHICS......................................... 6
P-12 EDUCATION ............................................................. 6
COLLEGE AND CAREER READINESS .......................... 7
POSTSECONDARY EDUCATION .................................82014 Undergraduate Enrollments ......................................8Pell Grant Recipients .............................................................8Community College Transfer Rates ...................................8Remedial Education ...............................................................82013 Undergraduate Degrees .............................................82013 Undergraduate Degree Trends .................................82014 Graduate and Professional Enrollments ................82014 Graduate and Professional Enrollment Trends .....9
POLICY RECOMMENDATIONS
PRE-K-12 EDUCATION ................................................. 10
POSTSECONDARY EDUCATION ................................ 11
LIMITATIONS AND OTHER NEEDED STUDIES ...... 11
CONCLUSION .................................................................. 11
WHO IS ARIZONA?
ARIZONA DEMOGRAPHICS
RACIAL/ETHNIC DISTRIBUTION ...............................12
AGE DISTRIBUTION .......................................................12
EDUCATIONAL ATTAINMENT ...................................12
INCOME .............................................................................13
HAVE WE MADE ANY PROGRESS?
P-12 EDUCATION
P-12 ENROLLMENTS ...................................................... 16
DROPOUTS ..................................................................... 19
GRADUATION RATES ................................................... 19
ENGLISH LANGUAGE LEARNERS (ELL) ..................22
SPECIAL EDUCATION ...................................................22
FREE OR REDUCED LUNCH ........................................25
AIMS TEST SCORES .....................................................25
COLLEGE ACCESS
ARIZONA UNIVERSITY ELIGIBILITY .......................32
STANDARDIZED TESTING .........................................34THE SAT IN ARIZONA....................................................... 35
Arizona Minority Student Progress Report 2016The Transformation Continues
THE ACT IN ARIZONA ......................................................................................35
ADVANCED PLACEMENT ..................................................................... 40
DUAL ENROLLMENT ............................................................................. 40
POSTSECONDARY EDUCATION
2014 ALL POSTSECONDARY ENROLLMENTS .................................42
2014 UNDERGRADUATE ENROLLMENTS ..........................................42
UNDERGRADUATE ENROLLMENT TRENDS BY SECTOR ..............45Public Two-Year Institutions ............................................................................45For-Profit Two-Year Colleges ........................................................................... 46Public Four-Year Institutions............................................................................ 46Not-For-Profit Four-Year Institutions ........................................................... 46For-Profit Four-Year Institutions ..................................................................... 46Arizona Resident and Out-of-State Enrollments by Sector ..................... 46Pell Grant Recipient Enrollment Trends ....................................................... 46Remedial Education in Community Colleges .............................................. 50Arizona Community College Transfer Rates ............................................... 50
2014 UNDERGRADUATE DEGREES ...................................................... 52Associate’s Degrees ...........................................................................................52Bachelor’s Degrees .............................................................................................52
UNDERGRADUATE DEGREE TRENDS .................................................. 52Associate’s Degrees ..........................................................................................53Bachelor’s Degrees .............................................................................................53
ARIZONA UNIVERSITY SYSTEM
SIX-YEAR GRADUATION RATES ............................................................ 55
2014 GRADUATE & PROFESSIONAL ENROLLMENTS .................... 57
GRADUATE & PROFESSIONAL ENROLLMENT TRENDS ................59Public Four-Year Institutions.............................................................................59Private Not-For-Profit Four-Year Institutions ............................................. 60Private For-Profit Four-Year Institutions .........................................................61
2013 GRADUATE & PROFESSIONAL DEGREES ..................................61Master’s Degrees ................................................................................................61Doctoral Degrees .................................................................................................61Professional Degrees .........................................................................................63
GRADUATE & PROFESSIONAL DEGREE TRENDS ............................63Master’s Degrees ................................................................................................65Doctoral Degrees ................................................................................................65Professional Degrees ..........................................................................................65Medical Degrees (Allopathic Medicine) .......................................................65Medical Degrees (Osteopathic Medicine) ...................................................65Pharmacy Degrees ..............................................................................................65Law Degrees .........................................................................................................65
CONCLUSION ............................................................................................. 67
REFERENCES ................................................................................................ 67
APPENDICES & COUNTY ADDENDUM
Tables and additional data for Arizona’s 14 counties are available at
highered.az.gov/amepac.

The Arizona Minority Education Policy Analysis Center (AMEPAC) is a policy center of the Arizona Commission for Postsecondary Education. Through studies, AMEPAC’s mission is to stimulate constructive statewide discussion and debate about improving Arizona minority students’ early awareness, access, and achievement throughout the educational attainment process. Our vision is that all Arizona students succeed in higher education as a result of quality research that shapes policy on critical issues.
AMEPAC is proud to provide policymakers, educators, and the public with this 6th edition of the Minority Student Progress Report titled The Transformation Continues: Minority Student Progress Report 2016. The report provides a current “snapshot” of the educational achievement of minority students in Arizona, from pre-k through postsecondary education. In addition, trend analyses of key educational indicators are also provided to give readers a sense of how the status of minority education in Arizona has changed over time.
In helping readers understand how best to use the findings described in this report, it is important to clarify that the study does not provide an analysis of why minority educational disparities remain. The focus of the report is to provide comprehensive and accurate baseline and trend data which identify and reveal the type, extent, and significance of educational attainment disparities during the time periods reported. In some cases the data are provided for a single year, but in other cases data are provided for up to a 20 year period. The most current data available were used to provide information for this report; however, these years vary throughout the report due to the most current information available through state and national databases. The data sources are listed at the end of the report and are noted in each of the figures and data tables. We encourage readers to use the report’s findings to stimulate important discussions that lead to policy solutions in a dynamic and ever changing environment. This report will be most useful to leaders who recognize and appreciate the complexity of these issues, and who value the critical role that education plays in improving the lives and well-being of all Arizonans.
REPORT OVERVIEWThis 6th edition of the report is presented in four major sections. Section one provides a summary of key demographic data drawn from the U.S. Census about the state of Arizona. Section two draws upon data from the Arizona Department of Education (ADE) to provide summaries of key educational indicators. This section includes trend analyses of student enrollments in Arizona schools by racial/ethnic background. In addition, we present data regarding the number and proportion of students who are English Language Learners (ELL), enrolled in special education, and who receive free or reduced lunch. We also show data summarizing pass rates on Arizona’s Instrument to Measure Standards (AIMS) tests.
Section three draws upon data from the Arizona Board of Regents (ABOR), the College Board, the American College Testing (ACT) service, and the community college districts in the state to provide information regarding the extent to which Arizona students are “college ready.”
The fourth section draws upon data from the United States Department of Education’s Integrated Postsecondary Education Data System (IPEDS) to summarize 20-year trends in enrollments
INTRODUCTION
4 ARIZONA MINORITY STUDENT PROGRESS REPORT
PHOTO BY KARINA PUGA

REPORT OVERVIEW 5
and completions for all postsecondary institutions in Arizona. Moreover, these trend data are provided for undergraduate, graduate, and professional students enrolled in postsecondary institutions in Arizona.
READING THE REPORTAs readers review the report, it is important to understand the conventions used throughout its many charts and graphs. In the interest of conserving space, providing clarity, and maintaining consistency, a code has been employed throughout the report for presenting race/ethnicity categories. The report uses the same color for each category (although the same color may be used for unrelated categories) and employs a shorthand legend. At right is a key for understanding the legend and color scheme. It is important to note the importance of language and terminology when discussing matters of race and ethnicity. The terminology used in this report follows the guidelines established by the White House Office of Management and Budget before 1997.
These categories, while implemented within the U.S. Census starting in 2000, were not fully implemented in the Department of Education reporting structure until 2010. For this reason, many educational institutions do not have data for the newest race categories from the 1997 standards: “Native Hawaiian / Pacific Islander” or “Multiracial” until after 2010. In an effort to standardize terms throughout this report, which includes data from before 1997 and after 2010 (trend data presented in this report often start as early as 1994 and end as late as 2014), the decision to use pre-1997 categories was made. This means that those individuals who would be classified as “Native Hawaiian / Pacific Islander” or “Asian” in the post- 1997 categories will be classified as “Asian Pacific Islander” in this report because that is how the data were reported prior to 2010 when many of the OMB’s 1997 guidelines were fully implemented. Data for individuals who are classified as “Multiracial” are only provided post-2009, in most cases, because these data were not collected until that year.
AMEPAC realizes that there are many ways in which individuals may choose to identify their racial or ethnic heritage, and the decision to use these terms is not meant to reflect any ideological or political preference. This report relies completely on data provided from numerous institutions, and as such is limited to the reporting categories they use.
AI American Indian
AP Asian / Pacific Islander
B Black
NR Non-Resident Alien(International Student)
Race / Ethnicity Category Codes
W White
UK Unknown Race
M Multiracial
AZ Arizona
H Hispanic
EXECUTIVE SUMMARY
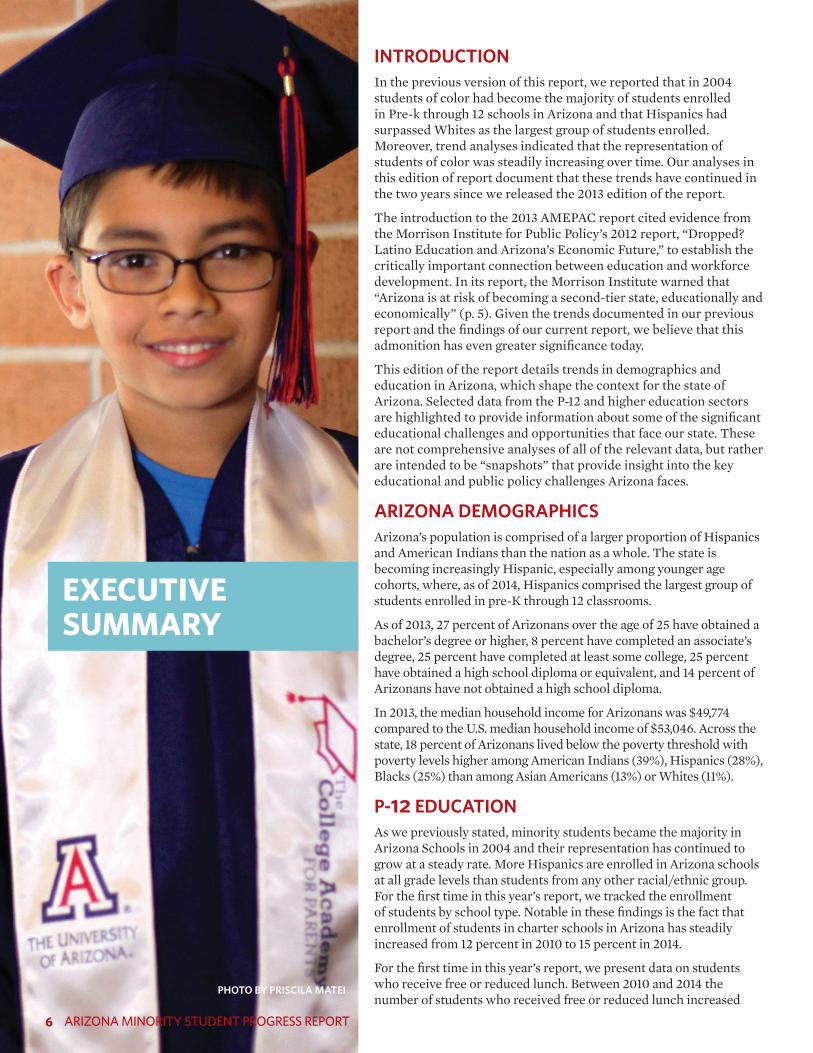
INTRODUCTIONIn the previous version of this report, we reported that in 2004 students of color had become the majority of students enrolled in Pre-k through 12 schools in Arizona and that Hispanics had surpassed Whites as the largest group of students enrolled. Moreover, trend analyses indicated that the representation of students of color was steadily increasing over time. Our analyses in this edition of report document that these trends have continued in the two years since we released the 2013 edition of the report.
The introduction to the 2013 AMEPAC report cited evidence from the Morrison Institute for Public Policy’s 2012 report, “Dropped? Latino Education and Arizona’s Economic Future,” to establish the critically important connection between education and workforce development. In its report, the Morrison Institute warned that “Arizona is at risk of becoming a second-tier state, educationally and economically” (p. 5). Given the trends documented in our previous report and the findings of our current report, we believe that this admonition has even greater significance today.
This edition of the report details trends in demographics and education in Arizona, which shape the context for the state of Arizona. Selected data from the P-12 and higher education sectors are highlighted to provide information about some of the significant educational challenges and opportunities that face our state. These are not comprehensive analyses of all of the relevant data, but rather are intended to be “snapshots” that provide insight into the key educational and public policy challenges Arizona faces.
ARIZONA DEMOGRAPHICSArizona’s population is comprised of a larger proportion of Hispanics and American Indians than the nation as a whole. The state is becoming increasingly Hispanic, especially among younger age cohorts, where, as of 2014, Hispanics comprised the largest group of students enrolled in pre-K through 12 classrooms.
As of 2013, 27 percent of Arizonans over the age of 25 have obtained a bachelor’s degree or higher, 8 percent have completed an associate’s degree, 25 percent have completed at least some college, 25 percent have obtained a high school diploma or equivalent, and 14 percent of Arizonans have not obtained a high school diploma.
In 2013, the median household income for Arizonans was $49,774 compared to the U.S. median household income of $53,046. Across the state, 18 percent of Arizonans lived below the poverty threshold with poverty levels higher among American Indians (39%), Hispanics (28%), Blacks (25%) than among Asian Americans (13%) or Whites (11%).
P-12 EDUCATIONAs we previously stated, minority students became the majority in Arizona Schools in 2004 and their representation has continued to grow at a steady rate. More Hispanics are enrolled in Arizona schools at all grade levels than students from any other racial/ethnic group. For the first time in this year’s report, we tracked the enrollment of students by school type. Notable in these findings is the fact that enrollment of students in charter schools in Arizona has steadily increased from 12 percent in 2010 to 15 percent in 2014.
For the first time in this year’s report, we present data on students who receive free or reduced lunch. Between 2010 and 2014 the number of students who received free or reduced lunch increased
6 ARIZONA MINORITY STUDENT PROGRESS REPORT
PHOTO BY PRISCILA MATEI

EXECUTIVE SUMMARY 7
dramatically by 12 percent. Nearly three quarters (72%) of American Indian students receive free or reduced lunch followed by Hispanic students (66%), Black students (62%), White students (42%), and Asian Pacific Islander students (26%).
School dropout rates have remained constant over the past few years. The highest dropout rates in 2014 were among American Indian students (7%), Hispanic students (4.1%), Black students (4%), Whites (2.5%), and Asian Pacific Americans (less than 1%). Since 2008, three quarters of Arizona students graduate from high school within four years of entering high school. While more than 8 in 10 Asian Pacific Americans (85%) and Whites (83%) graduate within four years, about 7 in 10 Blacks (70%) and Hispanics (69%) and 6 in 10 (61%) American Indian students graduate within four years of entering high school.
English Language Learners in Arizona have decreased dramatically over the last ten years, from 161,136 in 2004 to 66,275 in 2014, due to changes in the AZELLA (Arizona English Language Learner Assessment) proficiency test allowing for ELL students to be classified as proficient even when the student was not. Recent trends show similar decreases (from 76,325 in 2010 to 66,275 in 2014). As would be expected given their large representation in Arizona schools, the majority of ELL students are Hispanics.
The number of Arizona students enrolled in special education increased by 3 percent between 2010 and 2014. As in previous years, Black and American Indian students are more likely to be enrolled in special education than are students from other racial/ethnic groups while Asian Pacific American students are least likely to be in special education.
As noted in the 2013 report, AIMS test scores show persistent discrepancies in pass rates between Asian Pacific American, and Whites (who pass at higher rates) and American Indians, Blacks, and Hispanics (who pass at much lower rates). There has been no improvement in pass rates on the mathematics and science portions of the AIMS tests. In fact, only 4 in 10 high school students pass the AIMS science test and just over 6 in 10 students pass the AIMS mathematics test. As in the past, the consequences of not passing the AIMS test for students are severe—making it virtually impossible for them to enroll in courses that they need to become eligible for admission to one of the state’ public universities because they must enroll in classes that prepare them to retake the AIMS test in order to meet high school graduation requirements.
COLLEGE AND CAREER READINESSAccess to postsecondary education is a function of admissions requirements and the preparation that students receive. Trend data reveal little improvement in eligibility rates between 2009 and 2014 as university eligibility rates for students across Arizona
remain very low. Students in urban areas of the state are more likely than students from other areas in the state to meet ABOR eligibility requirements; yet, only half of students in Maricopa and Pima counties are eligible for admission to a state university. Fewer than four in ten students from other counties in the state are university eligible. There are clear gaps in university eligibility by racial/ethnic groups as White and Asian Pacific American students show much higher eligibility rates than do American Indian, Black and Hispanic students. Most students in Arizona, six in ten, do not demonstrate the necessary proficiency in mathematics. Moreover, four in ten students show deficiencies in the science and language requirements.
Standardized tests, advanced placement (AP) courses, and dual enrollment courses play a significant role in college access in Arizona. Similar to findings from the 2013 report, there is less disparity in the proportion of students from different racial/ethnic groups who took the ACT than those who took the SAT. While Whites comprise 40 percent of Arizonans between 15 and 17 years of age, they make up 57 percent of SAT takers and 38 Percent of ACT takers in the state. The number of students who took the ACT increased by 6,000 students between 2011 and 2014.
Mean SAT scores for all Arizona students dropped between 2011 and 2014. There is a significant gap between mean SAT scores of White and Asian Pacific American students compared to American Indian, Black, and Hispanic students in the state. Mean ACT scores have remained stable since 2010. Asian Pacific American and White students tend to score significantly higher than American Indian, Black and Hispanic students in the state.
Nearly 8 in 10 Arizona students fail to meet College Readiness Benchmark Scores established by the ACT in all four subject areas (English, Reading, Mathematics, and Science). While 39 in 100 Asian Pacific American students and 35 in 100 White students meet the Benchmarks in all four subject areas, only 9 in 100 Hispanic students, 7 in 100 Black students, and 4 in 100 American Indian students meet all four benchmarks.
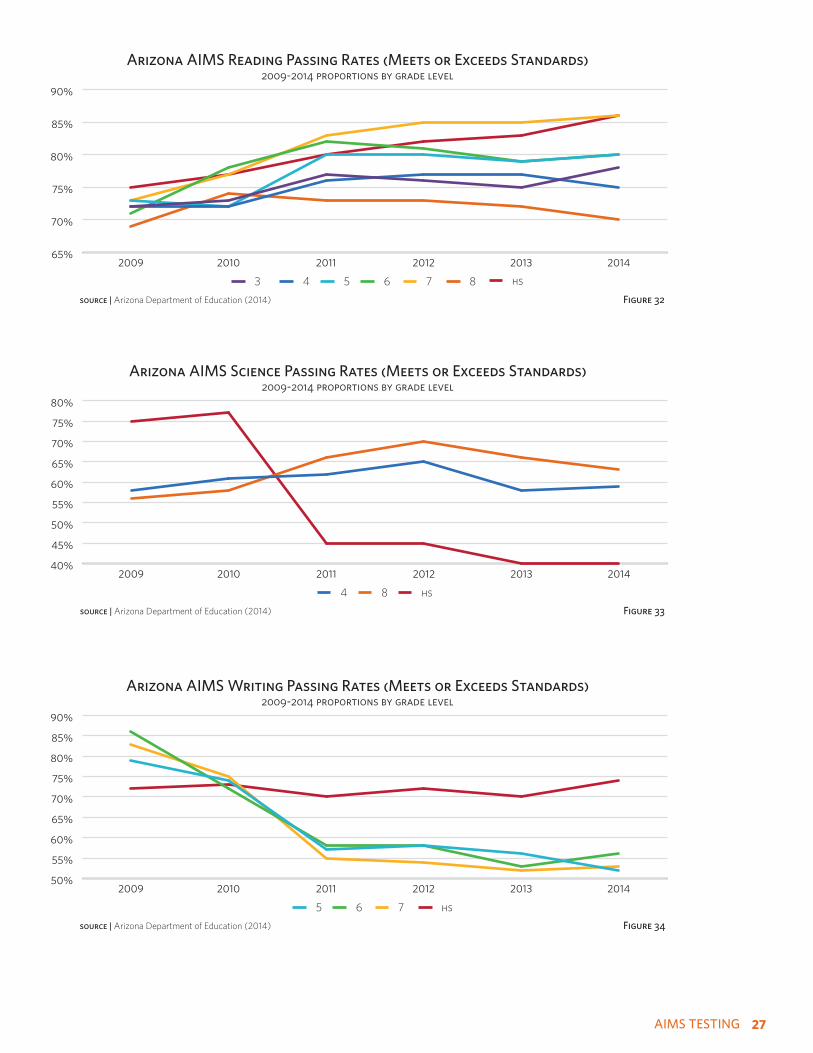
Significantly more students took Advanced Placement (AP) courses in Arizona in 2014 (57,161) than they did in 2011 (42,982). White students were more than twice as likely to enroll in AP courses as Hispanics were to enroll. Asian Pacific American students (7 in 10) and White students (6 in 10) were much more likely to obtain a score of 3 or higher on their AP tests than were American Indian (3 in 10), Black (4 in 10), and Hispanic students (4 in 10). In 2014, 22,888 high school students enrolled in dual enrollment courses through a community college in the state. About 7 in 10 of these students did so in the Maricopa Community College District. About three quarters of the dual enrollment courses taken were academically focused while one quarter were vocationally focused.
8 ARIZONA MINORITY STUDENT PROGRESS REPORT
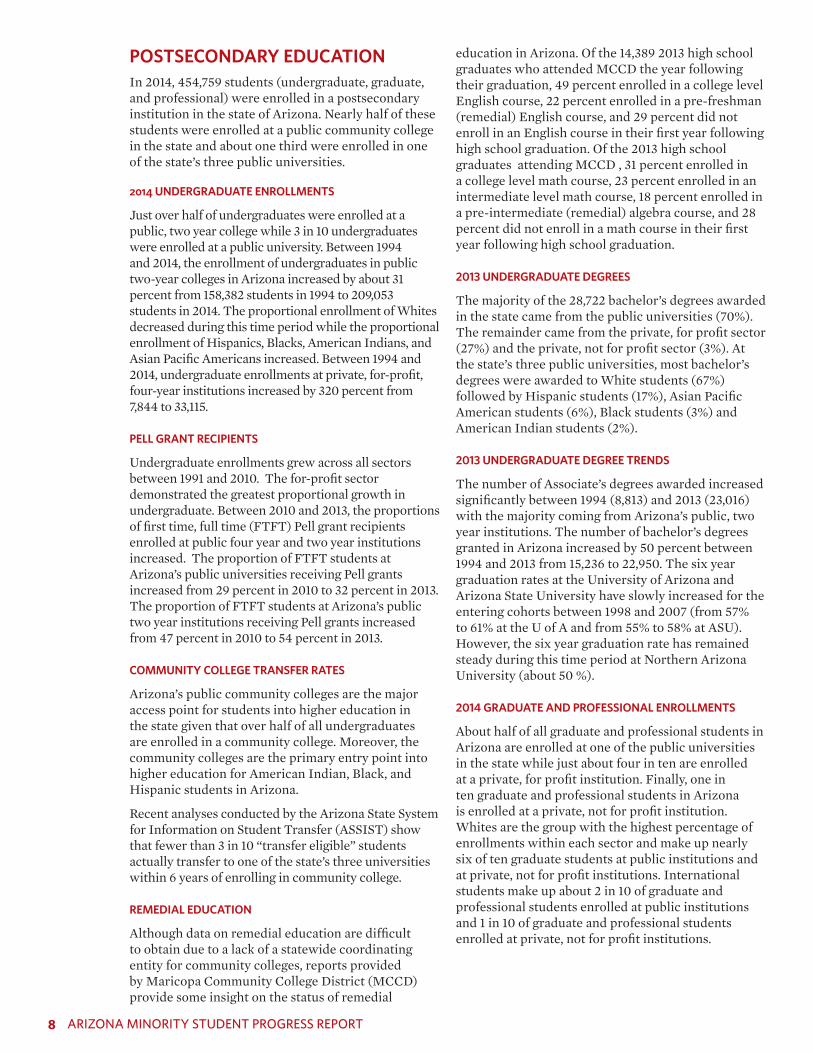
POSTSECONDARY EDUCATIONIn 2014, 454,759 students (undergraduate, graduate, and professional) were enrolled in a postsecondary institution in the state of Arizona. Nearly half of these students were enrolled at a public community college in the state and about one third were enrolled in one of the state’s three public universities.
2014 UNDERGRADUATE ENROLLMENTS
Just over half of undergraduates were enrolled at a public, two year college while 3 in 10 undergraduates were enrolled at a public university. Between 1994 and 2014, the enrollment of undergraduates in public two-year colleges in Arizona increased by about 31 percent from 158,382 students in 1994 to 209,053 students in 2014. The proportional enrollment of Whites decreased during this time period while the proportional enrollment of Hispanics, Blacks, American Indians, and Asian Pacific Americans increased. Between 1994 and 2014, undergraduate enrollments at private, for-profit, four-year institutions increased by 320 percent from 7,844 to 33,115.
PELL GRANT RECIPIENTS
Undergraduate enrollments grew across all sectors between 1991 and 2010. The for-profit sector demonstrated the greatest proportional growth in undergraduate. Between 2010 and 2013, the proportions of first time, full time (FTFT) Pell grant recipients enrolled at public four year and two year institutions increased. The proportion of FTFT students at Arizona’s public universities receiving Pell grants increased from 29 percent in 2010 to 32 percent in 2013. The proportion of FTFT students at Arizona’s public two year institutions receiving Pell grants increased from 47 percent in 2010 to 54 percent in 2013.
COMMUNITY COLLEGE TRANSFER RATES
Arizona’s public community colleges are the major access point for students into higher education in the state given that over half of all undergraduates are enrolled in a community college. Moreover, the community colleges are the primary entry point into higher education for American Indian, Black, and Hispanic students in Arizona.
Recent analyses conducted by the Arizona State System for Information on Student Transfer (ASSIST) show that fewer than 3 in 10 “transfer eligible” students actually transfer to one of the state’s three universities within 6 years of enrolling in community college.
REMEDIAL EDUCATION
Although data on remedial education are difficult to obtain due to a lack of a statewide coordinating entity for community colleges, reports provided by Maricopa Community College District (MCCD) provide some insight on the status of remedial
education in Arizona. Of the 14,389 2013 high school graduates who attended MCCD the year following their graduation, 49 percent enrolled in a college level English course, 22 percent enrolled in a pre-freshman (remedial) English course, and 29 percent did not enroll in an English course in their first year following high school graduation. Of the 2013 high school graduates attending MCCD , 31 percent enrolled in a college level math course, 23 percent enrolled in an intermediate level math course, 18 percent enrolled in a pre-intermediate (remedial) algebra course, and 28 percent did not enroll in a math course in their first year following high school graduation.
2013 UNDERGRADUATE DEGREES
The majority of the 28,722 bachelor’s degrees awarded in the state came from the public universities (70%). The remainder came from the private, for profit sector (27%) and the private, not for profit sector (3%). At the state’s three public universities, most bachelor’s degrees were awarded to White students (67%) followed by Hispanic students (17%), Asian Pacific American students (6%), Black students (3%) and American Indian students (2%).
2013 UNDERGRADUATE DEGREE TRENDS
The number of Associate’s degrees awarded increased significantly between 1994 (8,813) and 2013 (23,016) with the majority coming from Arizona’s public, two year institutions. The number of bachelor’s degrees granted in Arizona increased by 50 percent between 1994 and 2013 from 15,236 to 22,950. The six year graduation rates at the University of Arizona and Arizona State University have slowly increased for the entering cohorts between 1998 and 2007 (from 57% to 61% at the U of A and from 55% to 58% at ASU). However, the six year graduation rate has remained steady during this time period at Northern Arizona University (about 50 %).
2014 GRADUATE AND PROFESSIONAL ENROLLMENTS
About half of all graduate and professional students in Arizona are enrolled at one of the public universities in the state while just about four in ten are enrolled at a private, for profit institution. Finally, one in ten graduate and professional students in Arizona is enrolled at a private, not for profit institution. Whites are the group with the highest percentage of enrollments within each sector and make up nearly six of ten graduate students at public institutions and at private, not for profit institutions. International students make up about 2 in 10 of graduate and professional students enrolled at public institutions and 1 in 10 of graduate and professional students enrolled at private, not for profit institutions.

EXECUTIVE SUMMARY 9
GRADUATE AND PROFESSIONAL ENROLLMENT TRENDS
The growth in enrollment of graduate and professional students in the public four-year institutions increased by 11 percent, from 25,112 in 1994 to 28,031 in 2014.Small and steady increases in the proportional representation of students of color at the state’s public institutions are evident between 1994 and 2014—with Hispanics increasing from 7 percent to 11 percent, Asian Pacific Islanders increasing from 3 percent to 5 percent, Blacks increasing from 2 percent to 3 percent, and American Indians increasing from 1 percent to 2 percent. At private, for-profit, four-year institutions in Arizona, graduate and professional enrollments increased by more than 200 percent from 4,565 in 1994 to 15,548 in 2014.
2013 GRADUATE AND PROFESIONAL DEGREES
During 2013, fewer than half of the 12,466 master’s degrees awarded in Arizona came from public institutions. About 43 percent were awarded by private for profit institutions and 10 percent were awarded by private, not for profit institutions. The proportion of degrees awarded to Hispanic, African American, and Native American students decreases significantly when compared to their representation among bachelor’s and associate’s degree recipients. At the public institutions, about 6 in 10 master’s degrees were awarded to white students, 18 percent to international students, about 10 percent to Hispanics, 4 percent to Asian Americans, 3 percent to Blacks, and 2 percent to Native Americans. Arizona postsecondary institutions awarded 1,172 doctoral degrees in 2013.. The majority of these degrees were granted by the three Arizona public universities (65 percent). Private, for profit institutions awarded 34 percent of the doctoral degrees granted in 2013 while the private not for profits awarded about 1 percent of doctoral degrees. Institutions in the state of Arizona produced 1,667 professional degrees (allopathic medicine, osteopathic medicine, naturopathic medicine, pharmacy, law) in 2013. More than 4 in 10 of these degrees were awarded by the private, not for profit sector, another 4 in 10 were awarded by the state’s three public universities, and about 2 in 10 by the private for profit institutions.
GRADUATE AND PROFESSIONAL DEGREE TRENDS
The number of master’s degrees awarded in Arizona increased by about 50 percent between 1994 (6,292 master’s degrees awarded) and 2013 (9,298 master’s degree). The number of doctoral degrees awarded in Arizona between 1994 and 2013 increased by 100 percent from 754 to 1,519. While Blacks received only 1 percent of doctoral degrees in 1995, they received 1 in 10 (10%) in 2013. The proportion of doctoral degrees awarded to Hispanics was very low relative to their representation in the state’s population as only 5 percent of doctoral degrees awarded in 1995 and
6 percent were awarded to Hispanics in 2013. Asian Pacific Americans received about 6 percent of doctoral degrees in 1995 and 5 percent in 2013. The proportion of doctoral degrees awarded to American Indians was especially low at at 0.4 percent in both 1994 and 2013.
The percentages of Black (0% in 1995 and 2% 2013), Hispanic (6% in 1995 and 8% in 2013), and Native American students (0% in 1995 and 1% in 2013) who received degrees in allopathic medicine remained quite low between 1995 and 2013. The number of pharmacy degrees awarded in Arizona increased between 1995 and 2013 from 51 to 244. The percentages of degrees awarded to Blacks (2% in 1995 and 3% in 2013), Hispanics (6% in 1995 and 7% in 2013) and Native American (2% 1995 and 0% in 2013) students have remained low during this twenty year period.
The number of law degrees awarded by Arizona institutions increased by more than 100 percent from 281 in 1995 to 630 in 2013. About 68 percent of law degrees were awarded to white students in 1995, decreasing to 65 percent in 2013. The proportion of law degrees awarded to Hispanics in Arizona also decreased from 15 percent in 1995 to 9 percent in 2013. While decreases were also evident in the proportion of Asian Pacific Islanders (from 6% in 1995 to 5% in 2013) and Blacks (from 7% in 1995 to 5% in 2013), the proportion of Native American students earning law degrees remained stable from 1995 to 2013 (3%).
10 ARIZONA MINORITY STUDENT PROGRESS REPORT
Policy Recommendations
The 2016 AMEPAC Minority Student Progress Report is the 6th edition of this report created to provide an examination of the educational achievement of minority students in Arizona. These findings of educational attainment for Arizona’s student population have given us a sense of where we are and where we have been.
The data summarized in this report continue to demonstrate a troubling trend of a growing minority population with a major education attainment gap which results from a lack of access to important educational resources. A deeply troubling finding is that the educational achievement gap for minority (now majority) and low-income students in both urban and rural schools has not been erased.
This pipeline, which provides the workforce of Arizona’s future, is losing too many students in the process. This has become a grave concern for the future economic health of our families and Arizona as a competitive economic power.
Foundational to minority student success, a large percentage of whom live in poverty is an infrastructure that ensures that we not only can track and analyze trends, but also put in place the strategies needed to give the best opportunity possible for academic growth and achievement to create a diverse and capable workforce. Therefore, it is imperative that we continue to gather relevant data, question our current education funding strategies, and explore ways to forge our collective efforts to solve the problems we face.
Based on the data presented in this report, we have taken a pragmatic approach and provided policy recommendations with a goal to close the achievement gap for minority (now majority) students. The recommendations provided in this report are based on various platforms for comparisons and analysis. We have relied on the help of experts in diverse fields to analyze and prioritize these recommended actions.
We encourage you to review and consider the recommendations from AMEPAC’s 2013 Minority Student Progress Report: Arizona in Transformation before reading this report. We hope you will be able to use the rich data in this report to develop your own conclusions and recommendations for addressing the issues we highlight. We recognize that there are other policy stakeholders, agencies, and organizations in our state looking at our educational challenges as we move deeper into the 21st century. It is our hope that we can create a common vision with these partners
and collaborate to provide all students in Arizona an equal opportunity to succeed in pre-K-12 education, higher education, and the workforce.
PRE-K-12 EDUCATION
Ensure All Students Achieve a High School Diploma
• Modify high stakes requirements to include alternate pathways to a diploma.
• Provide resources to support all students’ achievement of graduation requirements. While the graduation requirement for four years of math appears to be a barrier, employers and postsecondary educators alike, tell us that all students must have adequate math to be successful in postsecondary endeavors. Therefore, we must maintain high expectations for all Arizona students, and together with resources, provide what is needed to ensure their success.
Improve English Language Learners’ Academic Success
The current approach leaves too many behind. There are other research-based approaches proven successful with ELL students.
• Analyze and strengthen entrance requirements to ELL services. Ensure that exit requirements enable proficiency in academic English for ELL students.
• Explore alternative approaches to structured English immersion. The 4-hour block limits ELL students from graduating because students do not have the time and facility with the language to take the coursework required for graduation.
Ensure Poverty Does Not Dictate the Level of Student Success
• Identify and/or refocus dedicated state-level funding streams to expand projects proven successful and increase the participation and success of lower socioeconomic students.
Ensure that Every Student Receiving a Diploma Is College and Career Ready and Is Prepared to Transition into Postsecondary Credit-bearing Courses or the Workforce
• Provide all students the opportunity for AP and dual enrollment; with appropriately trained teachers.
• Ensure access to and funding of technology to provide access to rural communities.

EXECUTIVE SUMMARY 11
• Provide all students no cost/low cost classes for ACT/SAT test prep.
• Ensure that all students have exposure to Career and Technical Education (CTE) opportunities, including access to counselors trained in CTE and all postsecondary options.
POSTSECONDARY EDUCATION
Improve Transition by Decreasing the Number of Students Who Do Not Qualify for College-level Credit-bearing Courses
• Establish a K-12/Postsecondary education task force to explore current and future programs to reduce the need for remediation.
Restore and Create Student Financial Aid Programs that Support Increasing Underrepresented Populations in All Levels of Higher Education
• Restore state postsecondary scholarships and grants that provide incentives to accelerate graduation, thereby reducing loan debt and time-to-degree for first-generation and low income students, many of whom are students of color.
Increase the Number of Community College Students Successfully Transferring into a 4-Year Institution
The data indicate a tremendous opportunity to increase enrollments and transition community college students into colleges or universities for completion of a 4-year degree.
• Ensure that all students receive counseling and support in the areas of financial literacy, career options, and proper course of study.
• Ensure that all students entering a remedial or developmental education community college educational pathway with intentions to transfer to a four year institution have access to the academic support structures necessary to succeed.
Support the Community College System in its Role as the First Point of Enrollment in the Postsecondary System for Most Students in Low-Income Families
• Provide state funding for all community colleges.
Recruit and Retain Home-Grown Graduate Students in Arizona
• Provide incentives to postsecondary institutions to attract and retain Arizona students receiving graduate degrees and certificates to enhance the professional workforce in Arizona.
LIMITATIONS AND OTHER NEEDED STUDIESLack of a statewide longitudinal data system: Effective tracking, monitoring and reporting on student progress and promising practices are hampered without such a system. Creating a longitudinal, statewide data system has been a key focus of policy makers within the past decade. Millions of dollars and countless hours of time have been spent discussing, promoting and planning for such a system. It continues to be unfinished work.
Lack of common definition: One of the limitations in the data is remedial or developmental education in community colleges. Based on the data, the primary point of entry into postsecondary education is community college for a significant number of minority students graduating from high school. Rather than qualifying for university credit-bearing coursework, too many must enroll in remedial or developmental education tracks. Because definitions of remedial students vary from one institution to another, it is difficult to track like data on students across the state and we are unable to provide a clear state-wide picture of this student population. Therefore, AMEPAC will consider the topic of students in community college remedial or developmental education as a subject for further study in our next research.
Data on education funding: While the data in this report detail trends in demographics and education in Arizona, one also cannot ignore the importance of education funding to provide resources needed for serving the student population. Other reports dealing specifically with education funding and equity are germane to this issue and must be considered as funding affects everything from teacher recruitment, retention, and training to adequate resources for children and families in poverty.
CONCLUSIONData on educational attainment show that students who graduate from postsecondary institutions with professional certifications and/or degrees tend to be the most economically successful. It is also these graduates who contribute the most to Arizona’s economy. Minority students, now the majority of students in Arizona schools, are crucial to ongoing economic prosperity of our state because of the critical human capital that they provide. A highly qualified workforce is the best resource our state can offer for economic development.
In the 2013 report, we affirmed the warning from the Morrison Institute’s Dropped report from 2012 that “Arizona is at risk of becoming a second-tier state, educationally and economically.” Now, today, in 2016, Arizonans have an opportunity choice. We can resign ourselves to becoming that second-tier state or we can choose opportunity by collaborating with others to implement these recommendations in order to close the achievement gap.

Arizona Demographics1
RACIAL/ETHNIC DISTRIBUTIONAccording to the U.S. Census Bureau, Arizona had a total population of 6,479,703 residents in 2013 (see Figure 1), of which 49.7 percent were male and 50.3 percent were female. Nearly 60 percent of Arizonans identified as White, 30 percent as Hispanic, 4 percent as Black, 4 percent as American Indian, 3 percent as Asian Pacific Islander, and 2 percent as Multiracial. Of those who identified as Hispanic, 70 percent were native born and 30 percent were foreign born.
Nationally, with a population of 311,536,594, the United States was 63 percent White, 17 percent Hispanic, 12 percent Black, 5 percent Asian Pacific Islander, 2 percent Multiracial, and 1 percent American Indian (see Figure 2).
While Arizona has a smaller proportion of White, Black, and Asian Pacific Islanders when compared to the rest of nation, it has nearly twice the proportion of Hispanics and four times the proportion of American Indians. Arizona’s location on the southwestern border with Mexico, and the fact that more than one quarter of the state’s geography is designated as reservation land contribute to the growing demographics—as does the rich history of both groups in the region.
AGE DISTRIBUTIONIn 2013, more than one third of Arizonans were below the age of 24 (See Figure 3). Another 39 percent were between the ages of 25-54 and the remainder were 55 and older (26%). The Arizona data closely reflect the age distribution of the population nationally (See Figure 4).
When age is disaggregated by race (see Figure 5), the population is increasingly more Hispanic in the younger age categories, and more than 80 percent White in the 65 and older categories. These trends are evident in the P-12 data as well, as Hispanics make up the largest racial/ethnic group in elementary and secondary education enrollments.
EDUCATIONAL ATTAINMENTJust over one quarter (27%) Arizonans over the age of 25 have obtained a bachelor’s degree or higher, compared to 29 percent of the national population (See Figure 6). About 8 percent of Arizonans have completed an associate’s degree, 26 percent have completed at least some college, 25 percent have obtained a high school diploma or equivalent, and 14 percent have less than a high school diploma. Figure 7 shows that Asian Americans are more likely to have obtained a bachelor’s degree than any other group (27%), followed by those who identify as White (21%), Multiracial (16%), Black (13%), Hispanic (7.3%), and American Indian (6.7%).
More than half of Arizonans who identify as Hispanic or American Indian have completed a high school diploma or less, 63 percent and 57 percent respectively.
Arizona women are more likely than men to obtain high school diplomas and associates degrees. Men are more likely to obtain Bachelor’s and graduate degrees.
1 The data used for this section were collected from the U.S. Census Bureau, 2009-
2013 5-Year American Community Survey. Five year estimates are generated with four
years of data from the American Community Survey and the 2010 census.
WHO IS ARIZONA?
12 ARIZONA MINORITY STUDENT PROGRESS REPORT

ARIZONA DEMOGRAPHICS 13
INCOMEThe 2013 median household income for all Arizonans was $49,774, somewhat lower than the U.S. median household income of $53,046. During this same year, 18 percent of Arizonans were classified as living below the poverty threshold , while the rate was 15 percent for the entire United States. Figure 8 shows that when disaggregated by race/ethnicity, American Indians in Arizona faced the highest poverty rates (39%), followed by Hispanics (28%), Blacks (25%), Multiracial (20%), Asian Americans (13%) and Whites (11%). The poverty rate for Arizona women was two percentage points higher than men at 19 percent and 17 percent, respectively.
ARIZONA POSTSECONDARY INSTITUTIONSThe following are postsecondary institutions located in Arizona as reported to the Integrated Postsecondary Education Data System (IPEDS):
PUB
LIC
4
-YEA
RS Arizona State University
Diné College Northern Arizona University The University of Arizona
NO
T-FO
R-P
RO
FIT
4-Y
EAR
S American Indian College Arizona Christian University College America Embry-Riddle Aeronautical University Frank Lloyd Wright School Of Architecture International Baptist College And Seminary Midwestern University Ottawa University Phoenix Seminary Prescott College Southwest College Of Naturopathic Medicine Thunderbird School Of Global Management
FOR
-PR
OFI
T 4
-YEA
RS Anthem College
Argosy University Arizona College Arizona School Of Acupuncture And Oriental Medicine Arizona Summit Law School Brookline College Brown Mackie College Carrington College Chamberlain College Of Nursing Collins College DeVry University Everest College Grand Canyon University ITT Technical Institute Le Cordon Bleu College Of Culinary Arts National Paralegal College Northcentral University Phoenix Institute Of Herbal Medicine & Acupuncture Southwest University Of Visual Arts The Art Institute Of Phoenix The Art Institute Of Tucson University Of Advancing Technology University Of Phoenix Western International University
M
W
H
B
AP
AI
6,479,703
2013 Arizona Populationby race/ethnicity
figure 1source | U.S.Census Bureau (2013)
57%
30%4%
4%3%
2%
311,536,594
2013 U.S. Populationby race/ethnicity
figure 2source | U.S.Census Bureau (2013)
UK
W
H
B
AP
AI
M63%
17%12%
5%
2%1%
2013 Arizona Populationby age
figure 3source | U.S.Census Bureau (2013)
<5
5-9
10-14
15-19
20-24
25-34
35-4
4
45-54
55-59
60-64
65-74
75-8485+
7%
13%
6%
8%2%
2013 U.S. Populationby age
figure 4source | U.S.Census Bureau (2013)
<5
5-9
10-14
15-19
20-24
25-34
35-4
4
45-54
55-59
60-64
65-7475-84
85+
7%
13%
6%
2%

14 ARIZONA MINORITY STUDENT PROGRESS REPORT
2013 Arizona Age Distribution by race/ethnicity
source | U.S. Census Bureau (2013)
AI B AP H W UK NR MFigure 5
0%
20%
40%
60%
80%
85+75-8465-7455-6445-5435-4430-3425-2920-2418-1915-1710-145-9<5
ARIZONA POSTSECONDARY INSTITUTIONS (CONTINUED)
PUB
LIC
2-Y
EAR
S Arizona Western College Central Arizona College Chandler-Gilbert Community College Cochise College Coconino Community College Eastern Arizona College Estrella Mountain Community College Gateway Community College Glendale Community College Mesa Community College Mohave Community College Northland Pioneer College Paradise Valley Community College Phoenix College Pima Community College Rio Salado College Scottsdale Community College South Mountain Community College Tohono O’odham Community College Yavapai College
FOR
-PR
OFI
T 2
-YEA
RS Arizona College
Brookline College Carrington College Fortis College Golf Academy Of America Kaplan College Pima Medical Institute Refrigeration School Inc Sanford-Brown College Sessions College For Professional Design Southwest Institute Of Healing Arts The Bryman School Of Arizona Universal Technical Institute Of Arizona

ARIZONA DEMOGRAPHICS 15
2013 Arizona and U.S. Educational Attainment for people 25 years or older
source | U.S. Census Bureau (2013)
< hs diploma hs diploma or equivalent some college associate’s degreebachelor’s degree graduate or professional degree
figure 6
0%
5%
10%
15%
20%
25%
30%
united statesarizona
2013 Arizona and U.S. Educational Attainment for People 25 Years or Olderwithin race/ethnicity
source | U.S. Census Bureau (2013) figure 7
0%
5%
10%
15%
20%
25%
30%
35%
multiracialblackasianamerican indianwhitehispanic< hs diploma hs diploma or equivalent some college associate’s degree
bachelor’s degree graduate or professional degree
2013 Poverty Rates in Arizona and United Statesby race/ethnicity & gender
source | U.S. Census Bureau (2013) figure 8
0%
5%
10%
15%
20%
25%
30%
35%
40%
whitehispanicmultiracial native hawaiian & pacific islander
asianamerican indianblackfemalemale
arizona united states

HAVE WE MADE ANY PROGRESS?
P-12 Education1
P-12 ENROLLMENTS
KEY FINDING
» Minority students became the majority in Arizona Schools in 2004 and their representation continues to grow at a steady rate. More Hispanics are enrolled in Arizona schools than students from any other racial/ethnic group.
Arizona Pre-Kindergarten to High School schools have transformed dramatically over the last 10 years with a continuous increase in the enrollment of students from different racial/ethnic backgrounds. In 2004, racial/ethnic minority students became the majority of all students in Arizona schools and their representation has steadily increased since that time (see Figure 9). While 51 percent of students enrolled in Arizona schools were White in 2002, their representation decreased to 40 percent in 2014 (see Figure 10). Hispanic students have become the largest racial/ethnic group in the proportional enrollments of primary and secondary students. In fact, in 2015 Hispanics make up 44 percent of all P-12 Arizona students. Gender representation remained constant from 2012 to 2014, with 51 percent male and 49 percent female students (see Figure 11).
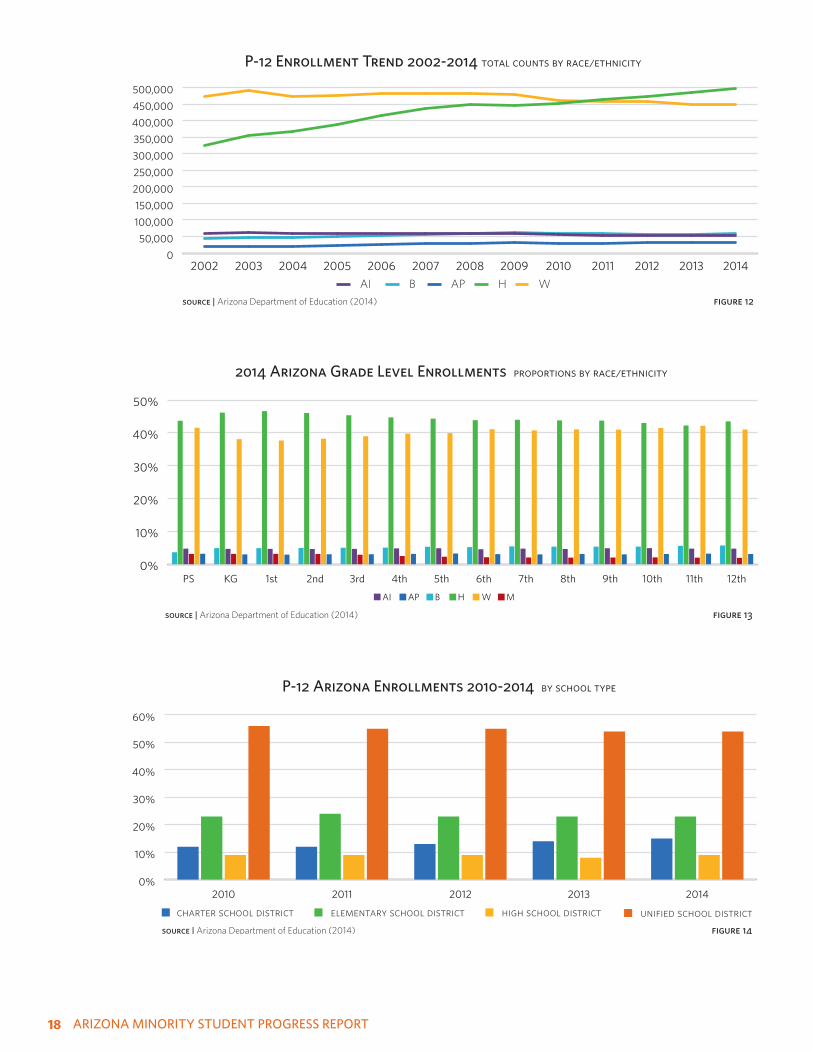
Between 2002 and 2014, Pre K-12 enrollments in the state of Arizona increased by about 21 percent from 922,280 to 1,116,143 (see Figure 12). The number of White student enrollments decreased by 5.4 percent from 473,257 in 2002 to 447,601 in 2014. American Indian student enrollments decreased by 12.5 percent from 60,405 to 52815 during this same timeframe. While the numbers of Asian Pacific American and Black students in Arizona schools are much lower compared to Whites and Hispanics, they showed high percentage gains in the number of students enrolled between 2002 and 2014 (61.1% for Asian Pacific Americans and 33.5% for Blacks). Hispanics showed the largest numerical gain in enrollments between 2002 (325,700) and 2014 (496,058), an increase of 52.3 percent.
Figure 13 summarizes the enrollments by grade level and racial/ethnic background of students in Arizona schools in 2014. This figure shows that Hispanics and Whites make up the majority of enrollments in Pre-K through 12 classes in Arizona. Moreover, while Whites have equal proportional representation in grade 11, Hispanics are the largest proportion of students in all other grades. The proportional enrollment of American Indian, Black and Asian Pacific American students are relatively stable across each grade level.
Arizona enrollments by school type are shown in Figure 14. While unified school districts account for more than half of Arizona’s 2014 P-12 student enrollments (54%), the figure shows a continuous increase in the proportion of students attending charter schools. While the numbers of students enrolled in charter schools are much lower compared to those enrolled in unified and elementary school districts, they showed high percentage gains in the number of students enrolled between 2010 and 2014. Charter School enrollment grew from 123,694
1 | The P-12 data used in this section were provided by the Arizona Deparment
of Education. In order to ensure anonymity of the students counted, the data were
aggregated at the county level.
16 ARIZONA MINORITY STUDENT PROGRESS REPORT

P-12 ENROLLMENT TRENDS 17
P-12 Enrollment Trend 2002-2014 by minority status
source | Arizona Department of Education (2014)
White Total Minorityfigure 9
0%
10%
20%
30%
40%
50%
60%
2014201320122011201020092008200720062005200420032002
P-12 Enrollment Trend 2002-2014 proportions by race/ethnicity
source | Arizona Department of Education (2014) figure 10
0%
10%
20%
30%
40%
50%
60%
2014201320122011201020092008200720062005200420032002
AI B AP H W
P-12 Enrollment Trend 2004-2014 proportions by gender
source | Arizona Department of Education (2014) figure 11
0%
10%
20%
30%
40%
50%
20142013201220112010200920082007200620052004
male female
18 ARIZONA MINORITY STUDENT PROGRESS REPORT
P-12 Enrollment Trend 2002-2014 total counts by race/ethnicity
source | Arizona Department of Education (2014) figure 12
0
50,000
100,000
150,000
200,000
250,000
300,000
350,000
400,000
450,000
500,000
2014201320122011201020092008200720062005200420032002
AI B AP H W
P-12 Arizona Enrollments 2010-2014 by school type
source | Arizona Department of Education (2014) figure 14
0%
10%
20%
30%
40%
50%
60%
20142013201220112010
charter school district elementary school district high school district unified school district
2014 Arizona Grade Level Enrollments proportions by race/ethnicity
source | Arizona Department of Education (2014) figure 13
0%
10%
20%
30%
40%
50%
12th11th10th9th8th7th6th5th4th3rd2nd1st KGPS
WHBAPAI M

ARIZONA DROPOUTS 19
Arizona Dropouts 2008-2014 total counts by race/ethnicity
source | Arizona Department of Education (2014)
AI B AP H W M
Figure 15
0
2000
4000
6000
8000
10000
2014201320122011201020092008
students in 2010 to 163,673 students in 2014, an increase of 32 percent. This gain in the number of students enrolled increased charter school participation as a percentage all P-12 Arizona enrollments from 12 percent in 2010 to 15 percent in 2014.
DROPOUTS2
KEY FINDING
» School dropout rates have remained constant over the past few years. The highest dropout rates in 2014 were among American Indian students (7%), Hispanic students (4.1%), Black students (4%), Whites (2.5%), and Asian Pacific Americans (less than 1%).
The number of students dropping out of Arizona schools remained relatively constant from 2008-2009 (see Figure 15). However, between 2010 and 2011, we saw a dramatic increase in the number of dropouts (from 14,655 to 18,606). Figure 16 shows a steady increase in the representation of Hispanic students among P-12 dropouts, with Hispanics representing more than half of all Arizona dropouts in 2014 (52%). Moreover, when we consider the proportion of enrolled students from different racial/ethnic groups who drop out of Arizona schools, we see some signs for concern (see Figure 17). The proportion of dropouts was highest for American Indians (6.7 percent in 2008 and 7.0 percent in 2014) followed by Hispanics (3.6%and 4.1%), Blacks (3.0% and 4.0%), Whites (2.0% and 2.5%), and Asian Pacific Americans
2 | Dropout rates are reported for grades seven through twelve, and are based on a calendar year that runs from the first day of summer recess through the last day of school. A school’s total en-rollment is used as the population figure against which dropouts are subsequently counted. Dropouts are defined by the Arizona State Department of Education as students who are enrolled in school at any time during the school year, but are not enrolled at the end of the school year and did not transfer, graduate, or die.
(0.9% and 0.9%). The difference between male and female students illustrated in Figure 18 shows little to no change in the proportion of dropouts by gender from 2008 to 2014 with male students dropping out of school at slightly higher rates than female students.
GRADUATION RATES
KEY FINDING
» Since 2008, three quarters of Arizona students graduate from high school within four years of entering high school. While more than 8 in 10 Asian Pacific Americans (85%) and Whites (83%) graduate within four years, about 7 in 10 Blacks (70%) and Hispanics (69%) and 6 in 10 (61%) American Indian students graduate within four years of entering high school.
Arizona graduation rates have remained relatively constant from 2008-2013, with 75 percent of students in the class of 2013 graduating within 4-years of entering high school (see Figure 19). However, between 2011 and 2013, we see a small decrease in graduation rates amongst all racial/ethnic groups (see Figure 20). With the highest graduation rates, more than 8 in 10 (85%) Asian high school students and White students (83%) in the class of 2013 graduated in 4-years; followed by Blacks (70%) and Hispanics (69%). American Indian students had the lowest graduation rates amongst all racial/ethnic groups, with only 6 in 10 (61%) graduating in 4-years. Figure 21 illustrates a constant graduation gap between female and male students in Arizona from 2008-2013. About 8 in 10 (80%) female high school students in the class of 2013 graduated in 4-years, 9 percentage points higher than the rate (71%) among their male counterparts. This gap has remained at about 8 percentage points since 2008.

20 ARIZONA MINORITY STUDENT PROGRESS REPORT
Arizona Dropout Rates 2008-2014 proportions of enrolled students by gender
source | Arizona Department of Education (2014)
Male Female
Figure 18
0%
1%
2%
3%
4%
5%
2014201320122011201020092008
Arizona Dropouts 2008-2014 proportions by race/ethnicity
source | Arizona Department of Education (2014)
AI B AP H W M
Figure 16
0%
10%
20%
30%
40%
50%
60%
2014201320122011201020092008
Arizona Dropout Rates 2008-2014 proportions of enrolled students by race/ethnicity
source | Arizona Department of Education (2014)
AI B AP H W AZ
Figure 17
0%
1%
2%
3%
4%
5%
6%
7%
8%
2014201320122011201020092008

ARIZONA GRADUATION RATES 21
Arizona High School Graduation Rates by gender
source | Arizona Department of Education (2014)
Male Female
Figure 21
65%
70%
75%
80%
85%
201320122011201020092008
Arizona High School Graduation Rates2008-2013
source | Arizona Department of Education (2014) figure 19
60%
65%
70%
75%
80%
201320122011201020092008
arizona
Arizona High School Graduation Rates 2008-2013 by race/ethnicity
source | Arizona Department of Education (2014)
AI B AP H W
Figure 20
60%
65%
70%
75%
80%
85%
90%
201320122011201020092008

22 ARIZONA MINORITY STUDENT PROGRESS REPORT
ENGLISH LANGUAGE LEARNERS (ELL)
KEY FINDING
» English Language Learners in Arizona have decreased dramatically over the last ten years, from 161,136 in 2004 to 66,275 in 2014, due to changes in the AZELLA (Arizona English Language Learner Assessment) proficiency test allowing for ELL students to be classified as proficient even when the student was not.
» Recent trends show similar decreases (from 76,325 in 2010 to 66,275 in 2014). As would be expected given their large representation in Arizona schools, the majority of ELL students are Hispanics.
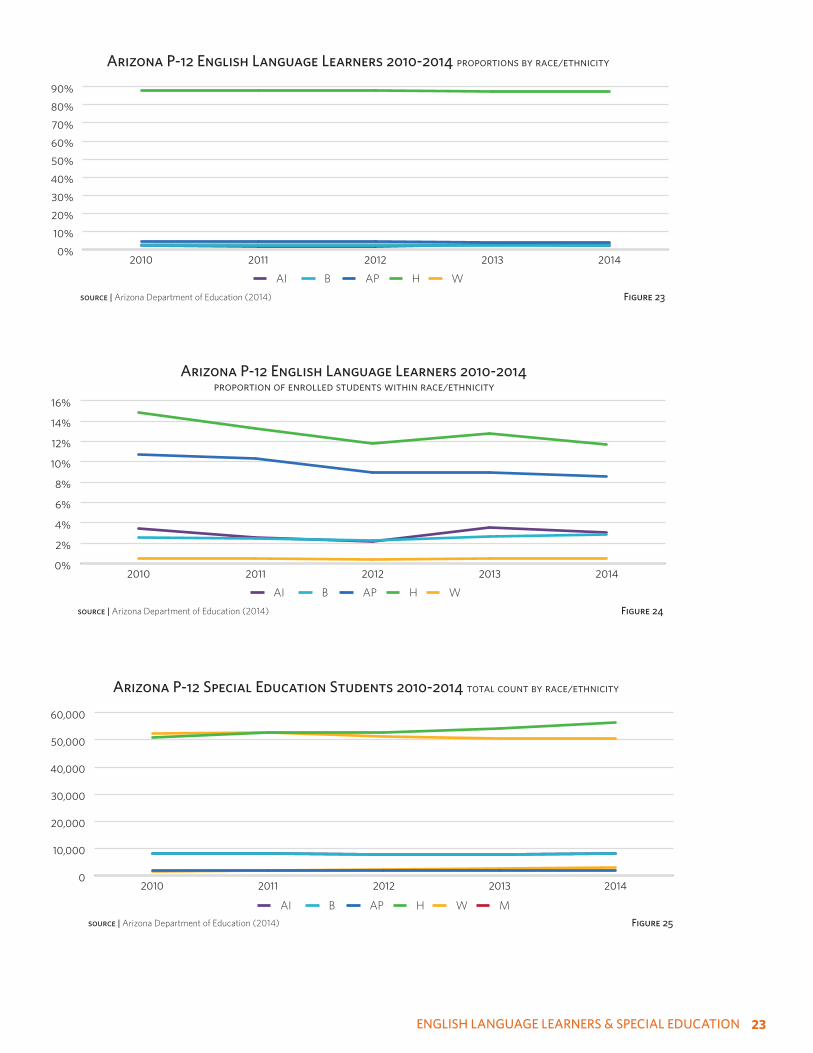
English Language Learners in Arizona have decreased dramatically over the last ten years, from 161,136 to 66,275 in 2014, due to changes in the AZELLA (Arizona English Language Learner Assessment) proficiency test allowing for ELL students to be classified as proficient even when the student was not. Recent trends show similar decreases with the number of English Language Learners (ELL’s) in Arizona decreasing from 76,325 to 66,275 from 2010 to 2014 (see Figure 22). The majority of this decrease was accounted for by a 14 percent decrease in the number of ELL’s who were Hispanic (from 67,208 to 57,874) and a 17 percent decrease in the number of ELL’s who were Asian Pacific Islander (from 3,215 in 2010 to 2,670 in 2014).
Figure 23 summarizes the proportion of ELL students by racial/ethnic background, and as we would expect, we see that Hispanics are the large majority of ELL’s
(88 percent in 2010 and 87 percent in 2014). Another important way to consider the data regarding ELL students is to examine the proportion of students within each racial/ethnic group who are ELL’s. Given the decrease in the number of ELL students in the state described above, we would expect to see a drop in the proportion of students who are ELL in most racial/ethnic groups. Figure 24 summarizes these data. As we would expect, there is a drop between 2010 and 2014 in the proportion of Hispanic (from 15% to 12%) and Asian Pacific Islander students (from 11% to 9%) who were classified as ELL. While we see a slight increase in the proportion of White students who were classified as ELL (0% to 1%), we see no change in the proportion of Black and American student classified as ELL (both of which remained at 3%).
SPECIAL EDUCATION
KEY FINDING
» The number of Arizona students enrolled in special education increased by 3 percent between 2010 and 2014. As in previous years, Black and American Indian students are more likely to be enrolled in special education than are students from other racial/ethnic groups while Asian Pacific American students are least likely to be in special education.
The absolute number of Arizona students enrolled in special education classes increased by 3 percent from 123,210 in 2010 to 127,510 in 2014 (see Figure 25). Hispanic students have become the largest
Arizona P-12 English Language Learners 2010-2014 total count by race/ethnicity
source | Arizona Department of Education (2014)
AI B AP H W
Figure 22
0
10,000
20,000
30,000
40,000
50,000
60,000
70,000
20142013201220112010
ENGLISH LANGUAGE LEARNERS & SPECIAL EDUCATION 23
Arizona P-12 Special Education Students 2010-2014 total count by race/ethnicity
source | Arizona Department of Education (2014) Figure 25
0
10,000
20,000
30,000
40,000
50,000
60,000
20142013201220112010
AI B AP H W M
Arizona P-12 English Language Learners 2010-2014 proportions by race/ethnicity
source | Arizona Department of Education (2014)
AI B AP H W
Figure 23
0%
10%
20%
30%
40%
50%
60%
70%
80%
90%
20142013201220112010
Arizona P-12 English Language Learners 2010-2014 proportion of enrolled students within race/ethnicity
source | Arizona Department of Education (2014)
AI B AP H W
Figure 24
0%
2%
4%
6%
8%
10%
12%
14%
16%
20142013201220112010
24 ARIZONA MINORITY STUDENT PROGRESS REPORT
Arizona P-12 Students Receiving Free or Reduced Lunch 2010-2014 total count by race/ethnicity
source | Arizona Department of Education (2014) Figure 28
0
50,000
100,000
150,000
200,000
250,000
300,000
350,000
20142013201220112010
AI B AP H W M
Arizona P-12 Special Education Students 2010-2014 proportions by race/ethnicity
source | Arizona Department of Education (2014) Figure 26
0%
10%
20%
30%
40%
50%
20142013201220112010
AI B AP H W M
Arizona P-12 Special Education Students 2010-2014 proportion of enrolled students within race/ethnicity
source | Arizona Department of Education (2014) Figure 27
0%
2%
4%
6%
8%
10%
12%
14%
16%
20142013201220112010
AI B AP H W M
FREE & REDUCED LUNCH 25
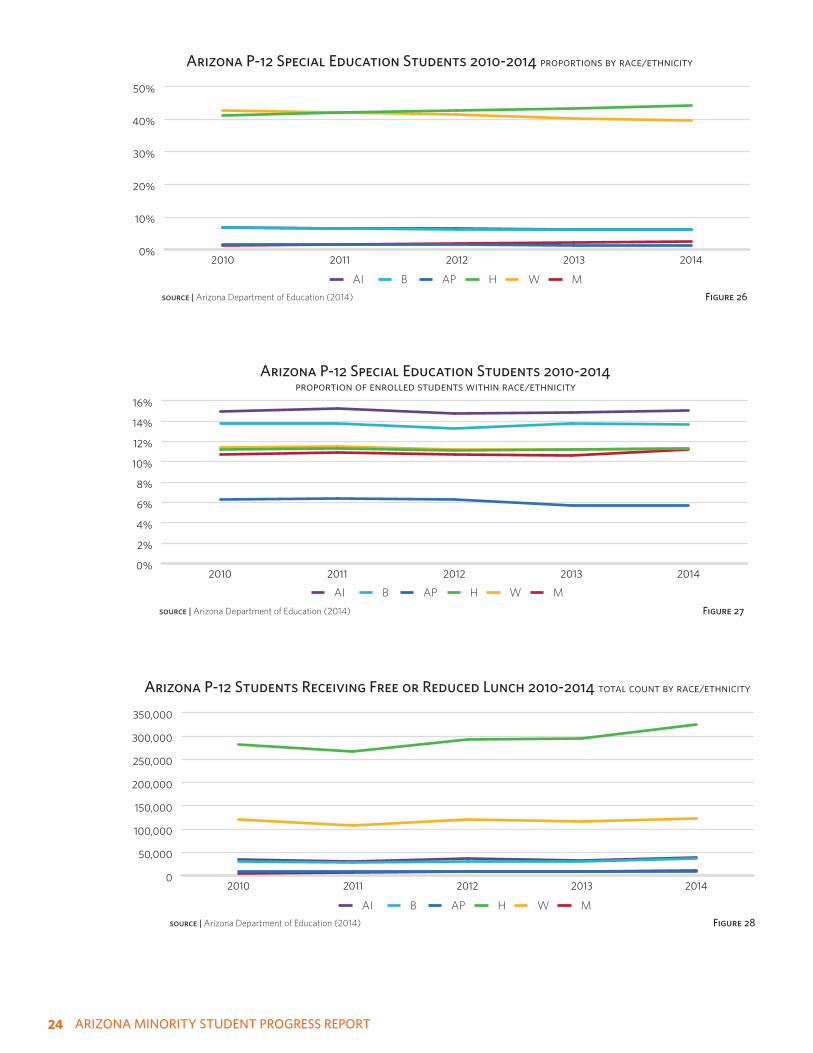
racial/ethnic group in the proportional enrollments of students enrolled in special education, surpassing White students beginning in 2011 (see Figure 26). Figure 27 illustrates that the proportional representation of enrolled students within race/ethnicity remained the same during this 5 year period. American Indian and Black students were most likely to be enrolled in special education classes during this time period as 15 percent of all American Indian students and 14 percent of Black students were enrolled in these classes from 2010-2014.
FREE OR REDUCED LUNCH3
KEY FINDING
» For the first time in this year’s report, we present data on students who receive free or reduced lunch. Between 2010 and 2014 the number of students who received free or reduced lunch increased dramatically by 12 percent. Nearly three quarters (72%) of American Indian students receive free or reduced lunch followed by Hispanic students (66%), Black students (62%), White students (42%), and Asian Pacific Islander students (26%).
Between 2010 and 2014, the number of students receiving free or reduced lunch in Arizona increased by 12 percent from 482,197 to 540,960 (see Figure 28). Figure 29 summarizes the proportion of students receiving free or reduced lunch by racial/ethnic background. With Hispanic and White students making up the majority of total P-12 enrollments in Arizona, as we would expect they also make up the largest proportions of students receiving free or reduced lunch across this 5 year period. Another important way to consider the data is to examine the proportion of students within each racial/ethnic group who are receiving free or reduced lunch. Figure 30 summarizes these data. About 72 percent of American Indian students in Arizona received free or reduced lunch in 2014, followed by Hispanic students (66%), Black students (62%), Multiracial students (42%), White students (27%), and Asian Pacific Islander students (26%).
3 | According to the U.S. Department of Agriculture’s National School Lunch Program, children from families with incomes at or below 130 percent of the poverty level are eligible for free meals. Those with incomes between 130 percent and 185 percent of the poverty level are eligible for reduced price meals. For the 2013-2014 academic year, 130 percent of the poverty level was $30,615 for a family of four; 185 percent is $43,568 for a family of four.
AIMS TEST SCORES
KEY FINDINGS
» As noted in the 2013 report, AIMS test scores show persistent discrepancies in pass rates between Asian Pacific American, and Whites (who pass at higher rates) and American Indians, Blacks, and Hispanics (who pass at much lower rates).
» There has been no improvement in pass rates on the mathematics and science portions of the AIMS tests. In fact, only 4 in 10 high school students pass the AIMS science test and just over 6 in 10 students pass the AIMS mathematics test.
» As in the past, the consequences of not passing the AIMS test for students are severe—making it virtually impossible for them to enroll in courses that they need to become eligible for admission to one of the state’ public universities because they must enroll in classes that prepare them to retake the AIMS test in order to meet high school graduation requirements.
Before 2015 Arizona public school students in grades 3 through 8 and in grade 10 were required to take Arizona’s Instrument to Measure Standards (AIMS) tests. AIMS tests assess students in four content areas: writing, reading, mathematics, and science. The reading and mathematics tests are administered in all grades. The writing test is administered in grades 5, 6, 7, and 10. The science test is administered in grades 4, 8, and 10 .
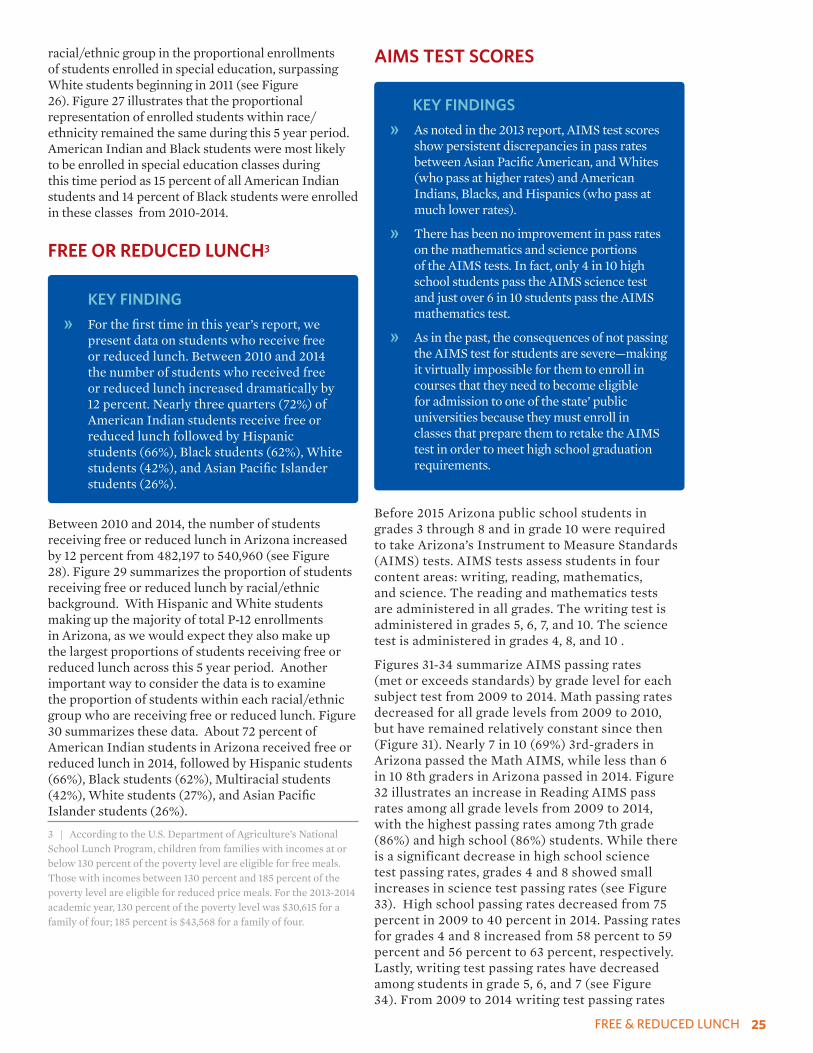
Figures 31-34 summarize AIMS passing rates (met or exceeds standards) by grade level for each subject test from 2009 to 2014. Math passing rates decreased for all grade levels from 2009 to 2010, but have remained relatively constant since then (Figure 31). Nearly 7 in 10 (69%) 3rd-graders in Arizona passed the Math AIMS, while less than 6 in 10 8th graders in Arizona passed in 2014. Figure 32 illustrates an increase in Reading AIMS pass rates among all grade levels from 2009 to 2014, with the highest passing rates among 7th grade (86%) and high school (86%) students. While there is a significant decrease in high school science test passing rates, grades 4 and 8 showed small increases in science test passing rates (see Figure 33). High school passing rates decreased from 75 percent in 2009 to 40 percent in 2014. Passing rates for grades 4 and 8 increased from 58 percent to 59 percent and 56 percent to 63 percent, respectively. Lastly, writing test passing rates have decreased among students in grade 5, 6, and 7 (see Figure 34). From 2009 to 2014 writing test passing rates

26 ARIZONA MINORITY STUDENT PROGRESS REPORT
Arizona AIMS Math Passing Rates (Meets or Exceeds Standards)2009-2014 proportions by grade level
source | Arizona Department of Education (2014) Figure 31
55%
60%
65%
70%
75%
80%
201420132012201120102009
3 4 5 6 7 8 hs
Arizona P-12 Students Receiving Free or Reduced Lunch 2010-2014 proportions by race/ethnicity
source | Arizona Department of Education (2014) Figure 29
0%
10%
20%
30%
40%
50%
60%
20142013201220112010
AI B AP H W M
Arizona P-12 Students Receiving Free or Reduced Lunch 2010-2014 proportion of enrolled students within race/ethnicity
source | Arizona Department of Education (2014) Figure 30
20%
30%
40%
50%
60%
70%
20142013201220112010
AI B AP H W M
AIMS TESTING 27
Arizona AIMS Reading Passing Rates (Meets or Exceeds Standards)2009-2014 proportions by grade level
source | Arizona Department of Education (2014) Figure 32
65%
70%
75%
80%
85%
90%
201420132012201120102009
3 4 5 6 7 8 hs
Arizona AIMS Science Passing Rates (Meets or Exceeds Standards)2009-2014 proportions by grade level
source | Arizona Department of Education (2014) Figure 33
40%
45%
50%
55%
60%
65%
70%
75%
80%
201420132012201120102009
4 8 hs
Arizona AIMS Writing Passing Rates (Meets or Exceeds Standards)2009-2014 proportions by grade level
source | Arizona Department of Education (2014) Figure 34
50%
55%
60%
65%
70%
75%
80%
85%
90%
201420132012201120102009
5 6 7 hs

28 ARIZONA MINORITY STUDENT PROGRESS REPORT
decreased from 79 percent to 52 percent for grade 5, 86 percent to 56 percent for grade 6, and 83 percent to 53 percent for grade 7.
In order to graduate from an Arizona public high school prior to 2015, a student was required to meet the AIMS high school graduation requirement by passing the writing, reading, and mathematics content areas of the AIMS high school test. Figure 35 summarizes the grades for students on the AIMS high school mathematics test in 2014. As can be seen in this figure, Asian Pacific Americans and Whites were much more likely than students from other racial/ethnic groups to meet or exceed expectations on the mathematics tests. Trends in pass rates for the mathematics test by racial/ethnic group are summarized in Figure 36. Consistent with
data in the previous figure, Asian Pacific American (86 percent passing in 2009 and 84 percent in 2014) and White students (81 percent passing in 2009 and 75 percent in 2014) show the highest proportions of passing the AIMS mathematics test. About half of Hispanic students (59 percent in 2009 and 54 percent in 2014) and Black students (57 percent in 2009 and 49 percent in 2014) and less than half of American Indian students (49 percent in 2009 and 43 percent in 2014) received grades of passing. Additionally, female students show slightly higher proportions of passing the AIMS high school mathematics test during this same 6 year period.
Data summarizing achievement on the AIMS Reading high school test in 2014 are presented in Figure 37. In the aggregate, students across all
2014 AIMS High School Math Scores proportions within race/ethnicity & gender
source | Arizona Department of Education (2014) figure 35
0%
5%
10%
15%
20%
25%
30%
35%
40%
45%
50%
femalemalewhitehispanicasianamerican indianblackarizona
exceeds meets approaches falls far below
AIMS High School Math Passing Rates (Meets or Exceeds) 2009-2014 proportions by race/ethnicity and gender
source | Arizona Department of Education (2014)
AI B AP H W Male
Figure 36
30
40
50
60
70
80
90
201420132012201120102009
Female

AIMS TESTING 29
2014 AIMS High School Reading Scores proportions within race/ethnicity & gender
source | Arizona Department of Education (2014) figure 37
0%
10%
20%
30%
40%
50%
60%
70%
femalemalewhitehispanicasianamerican indianblackarizona
exceeds meets approaches falls far below
AIMS High School Reading Passing Rates (Meets or Exceeds) 2009-2014 proportions by race/ethnicity and gender
source | Arizona Department of Education (2014) Figure 38
50
60
70
80
90
100
201420132012201120102009
AI B AP H W Male Female
groups showed a higher pass rate for the Reading test than they did for the mathematics test. Once again, Whites and Asian Pacific Americans had the highest exceed rates on (20 percent and 28 percent, respectively) and the highest meet rates (72 percent and 71 percent, respectively) on the reading test. Figure 38 summarizes the trend data regarding pass rates on the AIMS Reading test and shows an upward trend in passing rates for students from all racial/ethnic groups between 2009 and 2014. Whites (87 percent in 2009 and 92 percent in 2014) and Asian Pacific Americans (84 percent in 2009 and 91 percent in 2014) had the highest proportions of passing during this 6 year period. While Blacks (66 percent in 2009 and 79 percent in 2014), Hispanics (63 percent and 81 percent respectively), and American Indians (53 percent and 74 percent
respectively) all showed significant progress in pass rates between 2009 and 2014, their pass rates were still much lower than those of Whites and Asians. Similar to the math high school test during this same period, female students passed the reading test at slightly higher rates than male students.
Across all AIMS high school subject tests, Figure 39 illustrates lower pass rates on the science test for all student groups in 2014. While more than half of Asian Pacific American (61%) and White (57%) students passed the science test in 2014, approximately one quarter of Black (29%), Hispanic (27%), and American Indian (21%) students passed. The 6 year data for AIMS Science tests show a slight upward trend in pass rates for students from all racial/ethnic groups (see Figure 40). Asian Pacific American and White students had the

30 ARIZONA MINORITY STUDENT PROGRESS REPORT
2014 AIMS High School Science Scores proportions within race/ethnicity & gender
source | Arizona Department of Education (2014) figure 39
0%
10%
20%
30%
40%
50%
60%
femalemalewhitehispanicasianamerican indianblack arizona
exceeds meets approaches falls far below
AIMS High School Science Passing Rates (Meets or Exceeds) 2009-2014 proportions by race/ethnicity and gender
source | Arizona Department of Education (2014) Figure 40
10
20
30
40
50
60
201420132012201120102009
AI B AP H W Male Female
greatest gains in passing rates between 2009 and 2014 (Asian Pacific Americans 50 percent and 61 percent respectively and Whites 51 percent and 57 percent respectively). American Indian (15 percent in 2009 and 21 percent in 2014), Black (23 percent and 29 percent respectively), and Hispanics (22 percent and 27 percent respectively) also showed about a 6 percentage point gain in passing rates during this time period. Unlike passing rates by gender trends in mathematics and reading subject tests, male high school students tended to pass the science test at a higher rate than their female peers during this 6 year period.
The 2014 pass rates for the AIMS Writing test also show a pattern similar to that described for each of the other AIMS tests described above (see Figure 41). Asian Pacific Americans (85%) and
Whites (84%) had the highest pass rates followed by Hispanics (68%), Blacks (66%), and American Indians (55%). The data summarized in Figure 42 show some change in AIMS Writing test scores for White, Hispanic, and American Indian high school students. Asian Pacific Americans and Blacks showed no change from 2009 to 2014 (85 percent and 66 percent respectively). Whites (82% to 84%), Hispanics (63% to 68%), and American Indians (51% to 55%) all were more likely to pass the AIMS writing test in 2014 than they were in 2009. The writing test showed a much larger passing rate gap between female and male students, with female high school students passing the AIMS writing an average of 12 percentage points higher than their male peers during this 6 year period.

AIMS TESTING 31
2014 AIMS High School Writing Scores proportions within race/ethnicity & gender
source | Arizona Department of Education (2014) figure 41
0%
10%
20%
30%
40%
50%
60%
70%
80%
femalemalewhitehispanicasianamerican indianblackarizona
exceeds meets approaches falls far below
AIMS High School Writing Passing Rates (Meets or Exceeds) 2009-2014 proportions by race/ethnicity and gender
source | Arizona Department of Education (2014) Figure 42
40
50
60
70
80
90
201420132012201120102009
AI B AP H W Male Female

ARIZONA UNIVERSITY ELIGIBILITY
KEY FINDINGS
» Trend data reveal little improvement in eligibility rates between 2009 and 2014, and university eligibility rates for students across Arizona remain very low.
» Students in urban areas of the state are more likely than students from other areas in the state to meet ABOR eligibility requirements; yet, only half of students in Maricopa and Pima counties are eligible for admission to a state university. Fewer than four in ten students from other counties in the state are university eligible.
» There are clear gaps in university eligibility by racial/ethnic groups as White and Asian Pacific American students show much higher eligibility rates than do American Indian, Black and Hispanic students.
» Most students in Arizona, six in ten, do not demonstrate the necessary proficiency in mathematics. Moreover, four in ten students show deficiencies in the science and language requirements.
In Arizona, high school students who wish to attend one of the state’s three public universities (The University of Arizona, Arizona State University, and Northern Arizona University) must complete the “sweet sixteen” core courses which include: four years of English, four years of mathematics, three years of lab sciences, two years of social sciences (social studies), two years of the same foreign language, and one year of fine art. Students must successfully complete each of the sweet sixteen courses with at least a grade of “C” in order for the course to count, and they typically must have a 3.0 overall, unweighted, grade point average.
Figure 43 shows the Arizona Board of Regents (ABOR) eligibility rates for high school graduates in the two major urban areas in the state—Maricopa and Pima counties—compared to the eligibility rates for students from all other regions in the state. Two key findings are apparent here. First, the university eligibility rates for students from across the state are quite low. Second, students in the urban areas of Arizona are more likely than other students in the state to
2014 Arizona University Eligibilityby region
source | Arizona Board of Regents (2014) figure 43
0%
10%
20%
30%
40%
50%
Arizona Other CountiesPimaMaricopa
COLLEGE ACCESS
32 ARIZONA MINORITY STUDENT PROGRESS REPORT
photo by Karina Puga

UNIVERSITY ELIGIBILITY 33
2014 Arizona University Eligibilityby race/ethnicity within gender
source | Arizona Board of Regents (2014) figure 44
20%
30%
40%
50%
60%
70%
malefemale
WHBAPAI
Total Competency Area Attainmentby subject
source | Arizona Board of Regents (2014) figure 45
0%
10%
20%
30%
40%
50%
60%
70%
80%
90%
100%
fine artsocial science
languagesciencemathenglish
no deficiency one deficiency did not meet requirement
2014 Arizona University Eligibility by race/ethnicity within subject area
source | Arizona Board of Regents (2014) figure 46
20%
30%
40%
50%
60%
70%
80%
90%
100%
fine artssocial sciencelanguagesciencemathenglish
WHBAPAI AZ
2014 Arizona Eligibility proportions within race/ethnicity by year
source | Arizona Board of Regents (2014) figure 47
0%
10%
20%
30%
40%
50%
60%
70%
arizonablackasianamerican indianwhitehispanic
2002 2006 2009 2014

34 ARIZONA MINORITY STUDENT PROGRESS REPORT
meet the ABOR eligibility requirements. Even with this significant advantage, only half of high school graduates from Pima (51%) and Maricopa counties (50%) are eligible for admission to one of the state’s public universities. Overall, less than half (47%) of Arizona high school graduates are eligible.
In a comparison of eligibility rates broken out by racial/ethnic group and gender (see Figure 44), we see that females in every group show higher eligibility rates than their male counterparts. Across the state of Arizona, clear gaps in eligibility by racial/ethnic groups are evident as Black, American Indian, and Hispanic students show significant lower rates of eligibility than White or Asian American students show.
Figure 45 summarizes the extent to which high school graduates in Arizona meet the ABOR eligibility requirements for different subject areas. Students demonstrate the highest levels of proficiency in social science and the arts. Conversely, the majority of students in Arizona do not demonstrate the necessary proficiency in mathematics where only 41 percent of students completed the four years of mathematics that are required. Just over 6 in 10 Arizona high school graduates fulfill the science and language requirements necessary for ABOR eligibility. The fact that many districts do not require any foreign language for students to meet their graduation requirements may account for the 29 percent of Arizona high school graduates who did not meet this requirement.
Students from all racial/ethnic groups demonstrate the lowest levels of completion regarding the mathematics requirements (see Figure 46). This may be due, in part to the fact that some districts require only three years of mathematics to fulfill their graduation requirements. In addition, even for those districts that require four years of math to meet graduation requirements, the courses that they determine meet their graduation requirements may not meet the ABOR requirements for mathematics (i.e. Algebra I, II, Geometry, Pre-Calculus). In contrast, the social science/social studies requirements for many districts in Arizona are higher than what is required by ABOR for university eligibility.
Figure 47 summarizes the proportion of Arizona students by racial/ethnic background who met the ABOR eligibility requirements in four different years (2002, 2006, 2009, and 2014). We can see an upward trend in the eligibility rates between 2006 and 2009 for Black and American Indian students which is a positive sign considering that they have the lowest rates of eligibility among students from different racial/ethnic backgrounds in the state. However, eligibility rates had little to no change from 2009 to 2014 for all racial/ethnic groups.
STANDARDIZED TESTING
KEY FINDINGS
» Similar to findings from the 2013 report, there is less disparity in the proportion of students from different racial/ethnic groups who took the ACT than those who took the SAT. While Whites comprise 40 percent of Arizonans between 15 and 17 years of age, they make up 57 percent of SAT takers and 38 Percent of ACT takers in the state.
» The number of students who took the ACT increased by 6,000 students between 2011 and 2014.
» Mean SAT scores for all students dropped between 2011 and 2014. There is a significant gap between mean SAT scores of White and Asian Pacific American students compared to American Indian, Black, and Hispanic students in the state.
» Mean ACT scores have remained stable since 2010. Asian Pacific American and White students tend to score significantly higher than American Indian, Black and Hispanic students in the state.
» Nearly 8 in 10 Arizona students fail to meet College Readiness Benchmark Scores established by the ACT in all four subject areas (English, Reading, Mathematics, and Science). While 39 in 100 Asian Pacific American students and 35 in 100 White students meet the Benchmarks in all four subject areas, only 9 in 100 Hispanic students, 7 in 100 Black students, and 4 in 100 American Indian students meet all four benchmarks.
Figure 48 shows the racial/ethnic breakdown of Arizonans between the ages of 15 and 17 years old. The chart indicates that 37 percent of this age group is Hispanic, 5 percent is Black, and 5 percent is American Indian. Figures 49 and 50 show the proportion of Arizona students from different racial/ethnic groups who took the SAT and ACT in 2014. Comparing Figure 49 to Figure 50, there is closer parity regarding the proportion of Arizona students from different racial backgrounds who took the ACT than with the proportion who took the SAT. In examining the number of students who took the ACT, the number of test takers increased by 6,000 from 2011 to 2014.

STANDARDIZED TESTING 35
THE SAT IN ARIZONA
Figure 51 shows the trends in mean SAT scores for male and female students from Arizona on the critical reading and mathematics sections of the SAT every year between 1972 and 2014. There three noticeable trends in these data. First, the mean scores for male students exceed those for female students on both sections of the test. Second, the biggest gap between male and female scores is on the mathematics section of the test. Lastly, critical reading scores for both male and female students are showing a downward trend since 2006.
SAT participation for White students increased by 2,624 students over the last 10 years (see Figure 52), while Hispanic students increased by 3,145. Despite this, there is a gap of 7,451 students between the number of White students who take the SAT and the number of Hispanics, who make up the second highest group of SAT test takers. Although the data indicate an upward trend in the number of White and Hispanic students taking the SAT, there has been little change in the numbers of Asian Pacific Americans, Black, and American Indian students who take the SAT.
There is a significant gap in mean composite SAT scores (see Figure 53) between White and Asian Pacific American students and Hispanic, Black, and American Indian students in Arizona. Despite increases in some trend lines in these scores, the size of this gap persists from 2005 to 2014.
Figure 54 shows the mean composite SAT scores for Arizona students disaggregated by racial/ethnic background and by gender. Males tend to have higher mean SAT composite scores than do women among all racial/ethnic groups.
THE ACT IN ARIZONA
Between 2010 and 2014, there was a 46 percent increase (23,303 to 33,999) in Arizona students who took the ACT (see Figure 50). Figure 55 illustrates how much of this growth is attributable to the increase in the number of Hispanic student test takers, who more than doubled from 2010 to 2014 (6,653 to 13,345). All other racial/ethnic groups also saw an increase in the number of ACT test takers, with the exception of a 6 percent decrease in the number of American Indian students who took the ACT. The increase of ACT test-takers in Arizona may be due to Governor Jan Brewer’s support for having Arizona juniors at selected high schools take the ACT using the College Access Challenge Grant funds. Moreover, Helios Education Foundation became a sponsor in 2009 and has continued funding the program for fourteen districts for 7 years. The program is called the Arizona ACT District Choice State Testing Program (DCST) and its goals included supporting the college readiness of Arizona students.
There was little to no change in mean composite ACT scores between 2010 and 2014. Figure 56 shows slight increases in mean scores among Multiracial students and students whose race/ethnicity is unknown. Asian Pacific American and White students consistently have mean scores around 23, while Black, Hispanic, and American Indian students have mean scores around 17.
ACT College Readiness Benchmarks provide another way to evaluate student achievement. For each subject area, each benchmark score indicates a 50 percent chance of obtaining a B or higher, or a 75 percent chance of obtaining a C or higher in a corresponding college course. In 2014, the benchmark scores for each subject area were as follows: English 18, Mathematics 22, Reading 22, and Science 23. Figures 15-19 depict the percentage of students that met or fell below the benchmark scores, predicting whether or not students are ready for college level courses.
Figure 57 shows the percentage of Arizona students who met all four ACT college readiness benchmarks (English, Mathematics, Reading, and Science) in 2014 disaggregated by racial/ethnic background. Excluding Asian Pacific Americans (39%) and White (35%) students, approximately 8 out 10 Arizona students fell short of meeting all four college readiness benchmarks. As Figures 16-19 illustrate, the disparity between Hispanic, Black, and American Indian students and Asian Pacific American and White Students is evident across all four subject benchmarks. However, it is most pronounced in Mathematics and Science.
Overall, a little more than half of Arizona students met the ACT English college readiness benchmark in 2014 (see Figure 58). When disaggregated by racial/ethnic background, approximately 3 in 10 Black (33%), fewer than 4 in 10 Hispanic (38%), and less than 3 in 10 American Indian (26%) students met the English college readiness benchmark. Meanwhile, nearly 8 in 10 White students (need percentages here) and about 7 in 10 Asian Pacific American (70%) and Multiracial (67%) students met the English college readiness benchmark.
Fewer than 4 in 10 Arizona students met the ACT reading college readiness benchmark in 2014 (see Figure 59). Disaggregated by racial/ethnic background, about 2 in 10 Black (20%) and Hispanic (22%) students and a little more than 1 in 10 American Indian (14%) students met the reading benchmark. About half of Multiracial students (47%), Asian Pacific American students (51%), and White students (56%) met the college readiness benchmark for reading.
In 2014, fewer than 4 in 10 Arizona students met the ACT college readiness benchmark for mathematics (See Figure 60). When disaggregated by racial/ethnic background, approximately 2 in 10 Black (19%) and Hispanic (22%) students and about 1 in 10 American Indian students (14%) met the mathematics benchmark. Meanwhile, nearly half of Multiracial students (44%) and about 6 in 10 White (56%) and

36 ARIZONA MINORITY STUDENT PROGRESS REPORT
153,180
Arizona 15-17 Year-oldsby race/ethnicity
figure 48source | U.S.Census Bureau (2013)
40%
37%
7%
2%5%
5%
4%
22,624
Arizona SAT Takersby race/ethnicity
figure 49source | College Board (2014)
57%
24%2%5%
8%
2%
33,999
Arizona ACT Takersby race/ethnicity
figure 50source | ACT (2014)
38%
39%
UK
W
H
B
AP
AI
M
7%
4%
4%
Arizona Mean SAT Scores (1972-2014)by gender and subject
source | College Board (2014) Figure 51
460
470
480
490
500
510
520
530
540
2014
2013
2012
2011
2010
200
9
200
8
200
7
200
6
200
5
200
4
200
3
200
2
200
1
200
0
199
9
199
8
1997
199
6
199
5
1994
199
3
1992
199
1
199
0
198
9
198
8
1987
198
6
198
5
198
4
198
3
198
2
198
1
198
0
1979
1978
1977
1976
1975
1974
1973
1972
female math male math female reading male reading
Arizona SAT Participation 2005-2014 total count by race/ethnicity
source | College Board (2014) Figure 52
0
5,000
10,000
15,000
20,000
25,000
2014201320122011201020092008200720062005
AI B AP H W M UK

STANDARDIZED TESTING 37
Arizona Mean Composite SAT Scores 2005-2014 by race/ethnicity
source | College Board (2014) Figure 53
900
950
1000
1050
1100
1150
2014201320122011201020092008200720062005
AI B AP H W M UK
2014 Mean SAT Composite Scores by race/ethnicity & gender
source | College Board (2014) figure 54
900
950
1000
1050
1100
1150
unknownmultiracialwhitehispanicblackasianamerican indian
male female arizona
Arizona ACT Participation 2010-2014 total count by race/ethnicity
source | ACT (2014) Figure 55
0
5,000
10,000
15,000
20,000
25,000
30,000
35,000
20142013201220112010
AI B AP H W M UK

38 ARIZONA MINORITY STUDENT PROGRESS REPORT
Arizona Mean Composite ACT Scores 2010-2014 by race/ethnicity
source | ACT (2014) Figure 56
16
17
18
19
20
21
22
23
20142013201220112010
AI B AP H W M UK
2014 Arizona ACT College Readiness Benchmark Scores in all Four Subjectsproportion within race/ethnicity
source | ACT (2014) figure 57
0%
10%
20%
30%
40%
50%
60%
70%
80%
90%
100%
multiracialasianhispanicwhiteamerican indianblackall arizona
ready not ready
2014 Arizona ACT College Readiness Benchmark Scores in Englishproportion within race/ethnicity
source | ACT (2014) figure 58
0%
10%
20%
30%
40%
50%
60%
70%
80%
90%
100%
multiracialasianhispanicwhiteamerican indianblackall arizona
ready not ready

ACT COLLEGE READINESS MEASURES 39
2014 Arizona ACT College Readiness Benchmark Scores in Readingproportion within race/ethnicity
source | ACT (2014) figure 59
0%
10%
20%
30%
40%
50%
60%
70%
80%
90%
100%
multiracialasianhispanicwhiteamerican indianblackall arizona
ready not ready
2014 Arizona ACT College Readiness Benchmark Scores in Mathproportion within race/ethnicity
source | ACT (2014) figure 60
0%
10%
20%
30%
40%
50%
60%
70%
80%
90%
100%
multiracialasianhispanicwhiteamerican indianblackall arizona
ready not ready
2014 Arizona ACT College Readiness Benchmark Scores in Scienceproportion within race/ethnicity
source | ACT (2014) figure 61
0%
10%
20%
30%
40%
50%
60%
70%
80%
90%
100%
multiracialasianhispanicwhiteamerican indianblackall arizona
ready not ready

40 ARIZONA MINORITY STUDENT PROGRESS REPORT
Asian Pacific American (67%) students met the mathematics benchmark.
Less than 3 in 10 Arizona students met the ACT science college readiness benchmark in 2014 (See Figure 61). Disaggregated by racial/ethnic background, fewer than 2 in 10 Hispanic students (15%) and about 1 in 10 Black (12%) and American Indian (10%) students met the science benchmark. While nearly 4 in 10 Multiracial students (36%) met the benchmark, just less than half of Asian Pacific Americans (49%) and White (46%) students did.
ADVANCED PLACEMENT
KEY FINDINGS
» Significantly more students took Advanced Placement (AP) courses in Arizona in 2014 (57,161) than they did in 2011 (42,982). White students were more than twice as likely to enroll in AP courses as Hispanics were to enroll. Asian Pacific American students (7 in 10) and White students (6 in 10) were much more likely to obtain a score of 3 or higher on their AP tests than were American Indian (3 in 10), Black (4 in 10), and Hispanic students (4 in 10).
In 2014, Arizona students completed a total of 57,161 Advanced Placement (AP) exams (See Figure 62). White students were the largest racial/ethnic group to take exams (29,388), followed by Hispanic students (14,976). In order to qualify for college credit, students must typically earn a score of at least 3 on AP exams. Figure 63 shows dramatic differences in “pass” rates on AP exams among racial/ethnic groups. While more than half of White, Multiracial, and Asian Pacific American students are likely to pass their AP exams, less than half of Black, American Indian, and Hispanic students are likely to pass. Although more female students took AP exams (31,803) than males (25,358), a greater proportion of males scored a 3 or higher than did female students across all racial/ethnic groups (See Figure 63).
DUAL ENROLLMENT
KEY FINDINGS
» In 2014, 22,888 high school students enrolled in dual enrollment courses through a community college in the state. About 7 in 10 of these students did so in the Maricopa Community College District.
» About three quarters of the dual enrollment courses taken were academically focused while one quarter were vocationally focused.
» Among students enrolled in these classes in 2014, about 6 in 10 were White and 2 in 10 were Hispanic.
Another important option for some Arizona students to obtain college credit while in high school is through dual enrollment classes offered at community colleges. These classes, taught by community college faculty in students’ high schools, are another way (in addition to Advanced Placement courses) for students to complete college course work while they are still in high school. Moreover, students only need to successfully complete these courses in order for the credit to be transferred to a public institution in Arizona, unlike AP courses that require students to “pass” an AP exam after completing the course
Approximate 22,888 high school students in 2014 participated in dual enrollment through an Arizona community college (see Figure 64). About 7 in 10 of these students (72%) did so through colleges in the Maricopa Community College District. Dual enrollment participation can include academic or vocational courses through participating community colleges. About 76% of dual enrollment participants completed an academic course while 24% completed a vocational course.
Figure 64 shows that whites made up nearly 6 in 10 students (57%) who took dual enrollment classes in Arizona. Hispanics represented about 21 percent of dual enrollment students, followed by students whose racial/ethnic identity was unknown (11%), Asian Americans (5%), American Indians (3%), African American (2%), and Multiracial students(1%). There are at least two factors that are likely to contribute to the racial/ethnic distribution of dual enrollment students. The first is dual enrollment funding, which requires students to pay for each class prior to taking the class. The second is that classes take place within the high school. Both of these may be underlying factors because data showing the top high schools participating in dual enrollment suggest that access to (including understanding of ) dual enrollment is strongly related to socioeconomic status.
When dual enrollment is broken up by academic and vocational courses disaggregated by race/ethnicity, the proportion of students by in each type of course closely reflects the overall distribution of dual enrollments (see Figure 65) with a slightly higher representation of White students completing academic versus vocational courses.
ADVANCED PLACEMENT AND DUAL ENROLLMENT 41
2013 Arizona Dual Enrollments by race/ethnicity within subject type
source | AZ Community Colleges (2014) figure 65
0%
10%
20%
30%
40%
50%
60%
70%
vocationalacademic
WHBAPAI AZ
57,161
2014 Arizona Advanced Placement Examsby race/ethnicity
figure 62source | College Board (2014)
52%
26%
UK
W
H
B
AP
AI
M
3%
13%
22,888
2013 Arizona Dual Enrollmentby race/ethnicity
figure 64source | AZ Community Colleges (2014)
57%
21%
UK
W
H
B
AP
AI
M
5%
11%
2014 Arizona Advanced Placement Scores at 3 or Higher by gender within race/ethnicity
source | College Board (2014) figure 63
0%
10%
20%
30%
40%
50%
60%
70%
80%
unknownmultiracialwhitehispanicblackasianamerican indian
male female arizona

POSTSECONDARY EDUCATION
2014 ALL POSTSECONDARY ENROLLMENTS
In 2014, 454,759 students (undergraduate, graduate and professional) were enrolled in postsecondary institutions in the State of Arizona. Figure 66 presents the data about the proportion of students enrolled at different types of institutions in Arizona. The largest number of students, 209,053 (46%) were enrolled in public two year colleges in the state. An additional 145,409 students (32%) were enrolled in public four year institutions. About 17 percent (78,649 students) were enrolled at private, for profit four year institutions, 3 percent (12,066 students) at private for profit two year institutions and 2 percent (9,582 students) at private, not for profit four year institutions.
2014 UNDERGRADUATE ENROLLMENTS
Based upon the data presented in Figure 67, just over half (53%) of undergraduates were enrolled in public two-year colleges in Arizona in 2014. Less than one third of undergraduates (30%) were enrolled at a public four year institution in the state while 13 percent were enrolled in private, for profit four-year institutions. About 3 percent of undergraduates were enrolled at private for profit two year institutions and only 1 percent was enrolled at private, not for profit four-year institutions in Arizona.
The racial and ethnic diversity of undergraduate students varied greatly within each of these postsecondary contexts. Figure 68 presents the undergraduate enrollment data for students by racial/ethnic background within different sectors of postsecondary institutions in Arizona. These data provide us with a snapshot of how students from different racial/ethnic backgrounds are represented at different types of institutions in Arizona. White students had the largest representation at each type of institution, ranging from about 43 percent of the enrollments at private for profit four year institutions to a high of 57 percent of students at public four year universities. The enrollment of Hispanics ranged from a low of 12 percent at private, not for profit four year colleges to a high of 28 percent of students at public two year colleges. Hispanics made up 20 percent of enrollments at private for profit four year institutions. The enrollment of Native American students ranged from a low of 2 percent at private for profit four year colleges to a high of 6 percent at private, not for profit four year institutions. Only 3 percent of students enrolled at four year public institutions in Arizona are Native American. Asian Pacific Islanders make up a small percentage of undergraduate students in the state and are most represented at the state’s public universities (5%) and private, not for profit four year institutions.
POSTSECONDARY EDUCATION
42 ARIZONA MINORITY STUDENT PROGRESS REPORT

2014 UNDERGRADUATE ENROLLMENTS 43
source | U.S. Department of Education, National Center for Education Statistics (2014)
figure 67
454,759
All Arizona Enrollmentsby sector (2014)
32%
46%
17%
396,360
All Arizona Undergraduate Enrollmentsby sector (2014)
30%
53%
13%
3%
figure 66
private for-profit 2-year
public 2-year
private for-profit 4-year
private not-for-profit 4-year
public 4-year
3%
2014 Arizona Undergraduate Enrollmentsby race/ethnicity within sector
source | U. S. Department of Education, National Center for Education Statistics (2014) figure 68
0%
10%
20%
30%
40%
50%
60%
70%
80%
90%
100%
For-Profit 2-yearPublic 2-yearFor-Profit 4-yearNot-For-Profit 4-yearPublic 4-year
WHBAPAI NRUKM
2014 Arizona Undergraduate Enrollmentsby sector within race/ethnicity
source | U. S. Department of Education, National Center for Education Statistics (2014) figure 69
0%
10%
20%
30%
40%
50%
60%
70%
80%
90%
100%
non-residentalien
unknownrace
asian/pacific islander
multiracialhispanicamerican indian
blackwhite
private for-profit 2-yearpublic 2-yearprivate for-profit 4-yearprivate not-for-profit 4-yearpublic 4-year

44 ARIZONA MINORITY STUDENT PROGRESS REPORT
2014 Arizona Undergraduate Enrollments by gender within sector
source | U.S. Department of Education, National Center for Educaton Statistics (2014) figure 70
0%
10%
20%
30%
40%
50%
60%
70%
All ArizonaPrivate for-profit2-year
Public2-year
Private for-profit4-year
Private not-for-profit4-year
Public4-year
male female
2014 Arizona Undergraduate Enrollments by time status within sector
source | U.S. Department of Education, National Center for Educaton Statistics (2014) figure 71
0%10%20%30%40%50%60%70%80%90%
100%
Arizona TotalPrivate for-profit2-year
Public2-year
Private for-profit4-year
Private not-for-profit4-year
Public4-year
full time part time
2014 Arizona Undergraduate Enrollmentsby race/ethnicity within time status
source | U. S. Department of Education, National Center for Education Statistics (2014) figure 72
0%
10%
20%
30%
40%
50%
60%
70%
80%
90%
100%
Part-Time Full-Time
WHBAPAI NRUKM

UNDERGRADUATE ENROLLMENT TRENDS 45
Another way to look at educational opportunity and access in Arizona is to examine where students, within different racial/ethnic groups enroll in postsecondary education at institutions within the state. Figure 69 provides a summary of these data. Among Native American students in Arizona, the majority (57%) are enrolled in public two year colleges while an additional 26 percent of Native Students are enrolled in one of the state’s public institutions. About half of Asian Americans (48%) are enrolled in public two year colleges while four in ten (41%) are enrolled in Arizona’s public institutions. Just about half of African American students (49%) are also enrolled at two year public colleges while more than one quarter (28 percent) are enrolled in private, for profit four year institutions in Arizona and 20 percent are enrolled at one of Arizona’s public institutions. For Hispanic students, more than 6 in 10 (61%) are enrolled in public two year colleges and one quarter (25%) are enrolled in an Arizona public university. Only 11 percent of Hispanics in Arizona enrolled at a private, for profit four year institution.
Figures 70 and 71 summarize Arizona undergraduate enrollments by gender and time status within sectors. The representation of women is larger within every sector except for private non-for-profit four year institutions and private for-profit two year institutions, where their male counterparts make up 58 percent and 53 percent of students enrolled, respectively. Women make up 52 percent of Arizona undergraduates enrolled in public four year institutions, 66 percent in private for-profit four year institutions, 56% percent in public two year institutions, and 55 percent of all Arizona undergraduate students in all sectors. More than half of undergraduate students in Arizona are enrolled full-time (See Figure 71) and are the majority group within all sectors except public two year institutions. More than two thirds (70%) of students enrolled in public two year institutions are enrolled part-time.
Figure 72 presents undergraduate enrollment data for students by racial/ethnic background within time status. The figure illustrates that proportional representation by racial/ethnic background for undergraduate full-time and part-time status is similar to overall enrollment trends.
Figure 73 presents an effort to understand how many undergraduate students in Arizona are completing their degree online. Due to a rapid growth in online program enrollment, Arizona’s three public 4-year universities now report an exclusively online program enrollment metric to the Arizona Board of Regents. Figure 73 shows that nearly 19,000 students enrolled exclusively in online courses through an online degree program in one of Arizona’s 4-year universities in 2014. Including both graduate and undergraduate students, more than half (61%) of these online students are White, followed by Hispanic (17%).
UNDERGRADUATE ENROLLMENT TRENDS While the description of data on enrollments in 2014 provided above is helpful in providing us with a snapshot of the status of educational equity in Arizona, these data are subject to variation in any given year. In order to get a better picture of the status of equity in postsecondary enrollments and the degree to which we are making progress toward greater educational equity, it is helpful to examine these data over an extended time frame. We did this by gathering and summarizing data on enrollments at the national and statewide level over a twenty-year period between 1994 and 2014.
UNDERGRADUATE ENROLLMENT TRENDS BY SECTOR
PUBLIC TWO-YEAR INSTITUTIONS
Between 1994 and 2014, the enrollment of undergraduates in public two-year colleges in Arizona increased by about 31 percent from 158,382 students in 1994 to 209,053 students in 2014. Figure 74 summarizes the data for all undergraduates enrolled in public two-year colleges in Arizona between 1994 and 2014. While more than two thirds of students enrolled in public two-year colleges were white in 1994 (70%), their proportional representation decreased to 48 percent in 2014. However, we see that the proportional representation of students of color increased during the twenty-year period with Hispanics increasing from 15 percent to 28 percent, Blacks increasing from 3 percent to 6 percent, Asian Pacific Americans increasing from 2 percent to 3 percent. American Indian students were the only racial/ethnic group whose representation in public two-year colleges decreased, from 5 percent to 4 percent. The representation of women was quite stable during this time (55.8% in 1994 and 55.9% in 2014). The majority (70%) of students enrolled in
M
W
H
B
AP
AI
18,960
2014 Online Enrollmentsarizona universities by race/ethnicity
figure 73source | Arizona Universities (2014)
63%
17%
6%
4%
NR
46 ARIZONA MINORITY STUDENT PROGRESS REPORT
public two-year colleges in Arizona in 2014 were part-time students (See Figure 71).
FOR-PROFIT TWO-YEAR COLLEGES
While the overall enrollment numbers are low at for-profit two-year colleges in Arizona, we see a lot of fluctuation over the past 20 years. Twenty-year trends in enrollments by racial/ethnic background for students attending private, for-profit, two-year colleges are summarized in Figure 75. Proportional enrollments for whites (55% in 1994 and 51% in 2014) and Blacks (5% in 1994 and 6% in 2014) remained relatively stable during this time period. The biggest proportional increase in enrollments between 1994 and 2014 occurred among Hispanic students (15% and 24% respectively). The proportional representation of American Indians (3% in 1991 and 5% in 2014) and Asian Pacific Americans (1% and 3%) remained small, but nearly doubled in this time period. While the gap between men and women was reduced between 1994 and 2014 in the private, for-profit, two-year sector, men had higher levels of representation (65 % in 1994 and 53% in 2014) than did women. Most likely due to requirements regarding eligibility for federal financial aid, the vast majority of students (98%) enrolled at private, for-profit, two-year colleges are full-time students (See Figure 71).
PUBLIC FOUR-YEAR INSTITUTIONS
Growth in enrollments at Arizona’s public four-year institutions grew by approximately 63 percent between 1994 and 2014 from 71,904 to 117,378. Figure 76 shows data for Arizona public four-year university enrollment by racial/ethnic groups. The largest proportional growth in enrollments was among Hispanics (from 10% to 21%) followed by Multiracial students (from 0% to 4%), Blacks (from 2% to 4%) and Asian Pacific Americans (from 4% to 5%). The proportional representation among White students at public four-year institutions decreased from 76 percent in 1994 to 57 percent in 2014. The proportion of American Indian students enrolled in public four-year institutions remained relatively stable between 1994 and 2014 (3 percent). During the 20-year period, 1994 was the last year that more men (52%) than women (48%) were enrolled at Arizona’s public four-year institutions. Women made up 52 percent of enrollments in 2014. The majority (85%) of students enrolled in Arizona’s public four-year institutions in 2014 were enrolled full-time (See Figure 71).
PRIVATE NOT-FOR-PROFIT FOUR-YEAR INSTITUTIONS
Undergraduate enrollments at private four-year institutions in Arizona remained stable between 1994 (4,683) and 2014 (4,193). While Figure 77 shows a decrease in the proportional representation of whites during this twenty year period (72 % to 54%), Hispanics (from 7% to 12%), Asian Pacific Americans (2% to 5%), and American Indians (from 5% to 6%) all increased their proportional representation during
this twenty-year period. This is accounted for by the large increase in the proportion of students who declined to provide information on their racial/ethnic background between 1994 (2%) and 2010 (10%) The proportional representation of women decreased between 1994 (63%) and 2014 (51%). The majority (81%) of students enrolled in Arizona’s private, not-for-profit four-year institutions in 2014 were enrolled full-time (See Figure 71).
PRIVATE FOR-PROFIT FOUR-YEAR INSTITUTIONS
Between 1994 and 2014, undergraduate enrollments at private, for-profit, four-year institutions increased by 320 percent from 7,844 to 33,115. Figure 78 illustrates the racial/ethnic makeup of these enrollments. The largest proportional growth was among students who did not report their racial/ethnic background (from 2% in 1994 to 13% 2014), making it difficult to report accurate trends in enrollments by race/ethnicity. While whites represented 7 of 10 enrollments in this sector in 1994, they were just over 4 of 10 by 2014 (42%). The proportion of Black enrollments increased dramatically between 1994 and 2014 (from 5% to 15%), as well as the enrollments of Hispanics (12% and 20%). The proportional enrollment of American Indians remained at 3 percent from 1994 to 2014, while the representation of Asian Pacific Americans decreased during this twenty-year period (from 4% to 2%). Women undergraduates represented 65 percent of enrollments in the private, for-profit sector in both 1994 and 2014. Among undergraduates enrolled in for-profit, four-year colleges, approximately 87 percent are registered as full-time students (See Figure 71).
ARIZONA RESIDENT AND OUT-OF-STATE STUDENT ENROLLMENTS BY SECTOR
Figure 79 shows enrollments of first-time, full-time (FTFT) undergraduate Arizona resident students within sector from 2008 to 2014. The majority of FTFT students enrolled in Arizona’s public 2-year institutions are Arizona residents, increasing from 77 percent in 2008 to 93 percent in 2014. Across this 7 year time period, about 1 in 10 of FTFT students in the private sectors of Arizona were Arizona residents. While the proportional enrollment of Arizona FTFT residents increased from 56 percent in 2008 to 69 percent in 2010, their representation has steadily declined since to 58 percent in 2014.
PELL GRANT RECIPIENTS ENROLLMENT TRENDS
Figure 80 shows a four year trend of FTFT undergraduate students receiving Federal Pell grants within sector between 2010-2013. Between 2010 and 2013, the proportions of FTFT Pell grant recipients enrollments at public four year and two year institutions increased. The proportion of FTFT students at Arizona’s public universities receiving Pell grants increased from 29 percent in 2010 to 32 percent in 2013. The proportion of FTFT students at Arizona’s public two year institutions receiving Pell grants
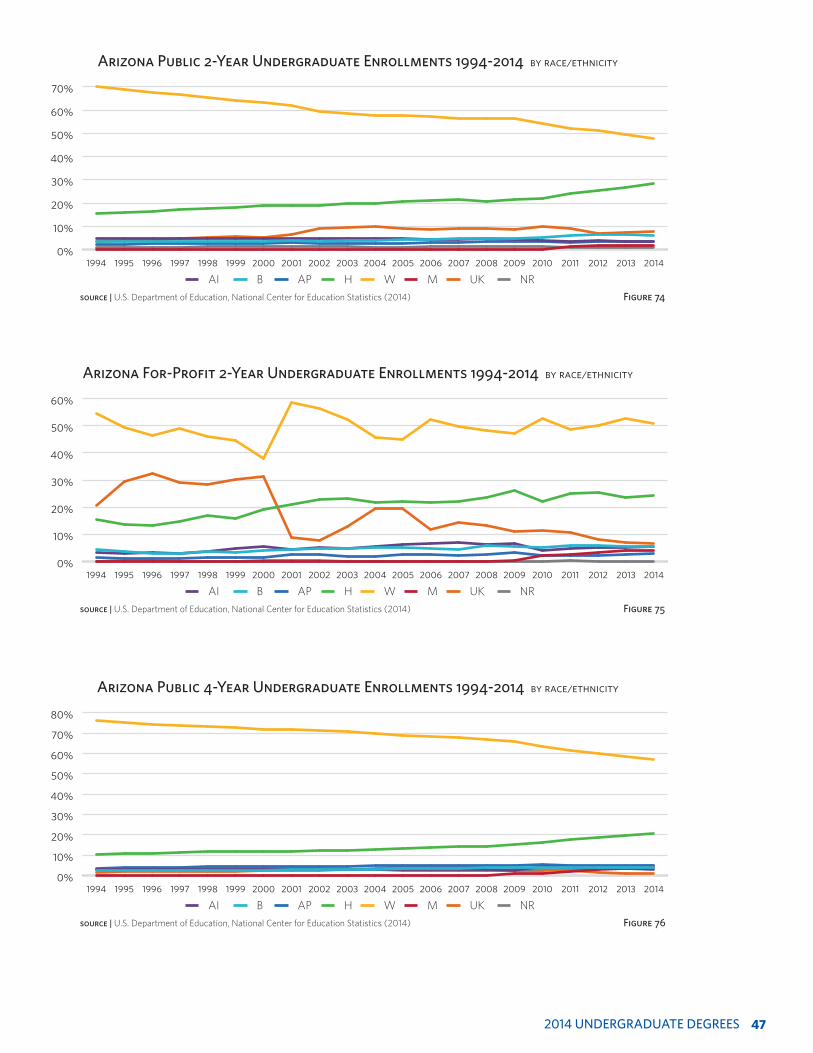
2014 UNDERGRADUATE DEGREES 47
Arizona Public 2-Year Undergraduate Enrollments 1994-2014 by race/ethnicity
source | U.S. Department of Education, National Center for Education Statistics (2014) Figure 74
0%
10%
20%
30%
40%
50%
60%
70%
201420132012201120102009200820072006200520042003200220012000199919981997199619951994
AI B AP H W M UK NR
Arizona For-Profit 2-Year Undergraduate Enrollments 1994-2014 by race/ethnicity
source | U.S. Department of Education, National Center for Education Statistics (2014) Figure 75
0%
10%
20%
30%
40%
50%
60%
201420132012201120102009200820072006200520042003200220012000199919981997199619951994
AI B AP H W M UK NR
Arizona Public 4-Year Undergraduate Enrollments 1994-2014 by race/ethnicity
source | U.S. Department of Education, National Center for Education Statistics (2014) Figure 76
0%
10%
20%
30%
40%
50%
60%
70%
80%
201420132012201120102009200820072006200520042003200220012000199919981997199619951994
AI B AP H W M UK NR
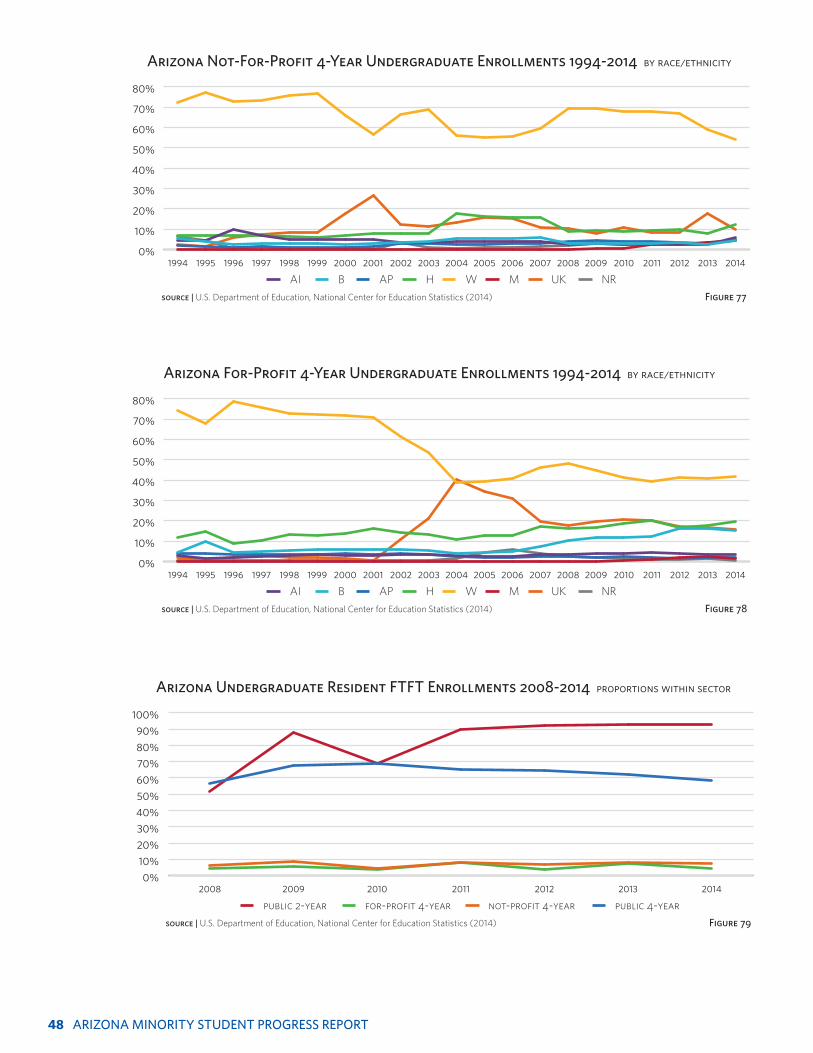
48 ARIZONA MINORITY STUDENT PROGRESS REPORT
Arizona Not-For-Profit 4-Year Undergraduate Enrollments 1994-2014 by race/ethnicity
source | U.S. Department of Education, National Center for Education Statistics (2014) Figure 77
0%
10%
20%
30%
40%
50%
60%
70%
80%
201420132012201120102009200820072006200520042003200220012000199919981997199619951994
AI B AP H W M UK NR
Arizona For-Profit 4-Year Undergraduate Enrollments 1994-2014 by race/ethnicity
source | U.S. Department of Education, National Center for Education Statistics (2014) Figure 78
0%
10%
20%
30%
40%
50%
60%
70%
80%
201420132012201120102009200820072006200520042003200220012000199919981997199619951994
AI B AP H W M UK NR
Arizona Undergraduate Resident FTFT Enrollments 2008-2014 proportions within sector
source | U.S. Department of Education, National Center for Education Statistics (2014) Figure 79
0%
10%
20%
30%
40%
50%
60%
70%
80%
90%
100%
2014201320122011201020092008
public 2-year for-profit 4-year not-profit 4-year public 4-year

UNDERGRADUATE DEGREE TRENDS 49
Arizona Undergraduates Receiving Pell Grants 2009-2013 proportions by sector
source | U.S. Department of Education, National Center for Education Statistics (2014) Figure 80
30%
40%
50%
60%
70%
80%
2013201220112010
public 2-year for-profit 4-year not-profit 4-year public 4-yearfor-profit 2-year
Arizona Undergraduate Mean Pell Grant Awarded by sector 2009-2013
source | U.S. Department of Education, National Center for Education Statistics (2014) figure 81
0
500
1000
1500
2000
2500
3000
3500
4000
4500
2013201220112010
private for-profit 2-yearpublic 2-yearprivate for-profit 4-yearprivate not-for-profit 4-yearpublic 4-year
Arizona Community College Cumulative Transfer Rates to Arizona Public Universities2006-2010 cohorts
source | Arizona State System for Information on Student Transfer (2015) figure 82
0
5000
10000
15000
20000
25000
20102009200820072006
after 6 yearsafter 5 yearsafter 4 yearsafter 3 years total transfer cohort

50 ARIZONA MINORITY STUDENT PROGRESS REPORT
increased from 47 percent in 2010 to 54 percent in 2013. The private sector experienced a decline in the proportion of FTFT students receiving Pell grants. The proportion of FTFT students receiving Pell grants at Arizona’s private not-for-profit four year institutions decreased from 34 percent in 2010 to 29 percent in 2013. The proportion for private for-profit two year institutions decreased from 64 percent to 58 percent. Lastly, although the private for-profit 4 year sector is still the sector with the largest proportion of FTFT students receiving Pell grants, their proportions also decreased from 80 percent in 2010 to 73 percent in 2013. Figure 81 shows the mean dollar amount of Pell grants within sector. While Pell grant recipients enrolled in private for-profit two year institutions received, on average, the largest amount of Pell grants in 2010 and 2011, Pell grant recipients enrolled in one of Arizona’s public universities have received the largest amount in Pell aid, on average, since then.
REMEDIAL EDUCATION IN COMMUNITY COLLEGES
KEY FINDINGS
» Data on remedial education are difficult to obtain due to a lack of a statewide coordinating entity for community colleges. However, reports provided by Maricopa Community College District (MCCD) provide some insight on the status of remedial education in Arizona. In their first year enrolled at MCCD, a large number of students do not enroll in English or mathematics courses necessary for transfer to one of the state’s universities. Of those who do enroll, a significant number enroll in remedial courses.
Although data on remedial education in community colleges are difficult to obtain due to a lack of a statewide coordinating entity for community colleges, reports provided by Maricopa Community College District (MCCD) provide some insight on the status of remedial education in Arizona. Of the 14,389 2013 high school graduates who attended MCCD the year following their graduation, nearly half (49%) enrolled in a college level English course, 22 percent enrolled in a pre-freshman (remedial) English course, and 29 percent did not enroll in an English course in their first year following high school graduation. Regarding enrollments in mathematics courses, of the 2013 high school graduates attending MCCD , almost one third (31%) enrolled in a college level math course, 23 percent enrolled in an intermediate level math course, 18 percent enrolled in a pre-intermediate (remedial) algebra course, and 28 percent did not enroll in a math course in their first year following high school graduation. Hence, a significant number of MCCD students do not enroll in English or mathematics
courses necessary for transfer to one of the state’s universities. Of those who do enroll, a significant number enroll in remedial courses.
ARIZONA COMMUNITY COLLEGE TRANSFER RATES
KEY FINDINGS
» Arizona’s public community colleges are the major access point for students into higher education in the state given that over half of all undergraduates are enrolled in a community college. Moreover, the community colleges are the primary entry point into higher education for American Indian, Black, and Hispanic students in Arizona.
» Recent analyses conducted by the Arizona State System for Information on Student Transfer (ASSIST) show that fewer than 3 in 10 “transfer eligible” students actually transfer to one of the state’s three universities within 6 years of enrolling in community college.
Arizona’s public community colleges are the major access point for students into higher education in the state given that over half of all undergraduates are enrolled in a community college (see Figure 67). Moreover, the community colleges are the primary entry point into higher education for American Indian, Black, and Hispanic students in Arizona. Hence, it is important to determine the proportion of Arizona’s students who start at a community college and are able to successfully transfer to one the states three public universities. Calculating transfer rates are challenging because students who attend community colleges are there for a variety of reasons and because of this, not all students who are enrolled intend to transfer and obtain a bachelor’s degree. Recent analyses conducted by the Arizona State System for Information on Student Transfer (ASSIST) provide helpful data about the rate at which students transfer to public universities in the state. In this study, ASSIST followed groups of students for six years and calculated the proportion of students who had exhibited “transfer behavior” and had transferred to an Arizona public university.
The findings of the ASSIST study are presented in Figures 82 and 83 and summarize data regarding the proportion of community college students who entered community college between 2006 and 2010 who were able to successfully transfer to one of the three Arizona public universities. While Figure 82 shows that the total number of students who exhibited “transfer behavior” in each cohort rose steadily between 2006 to 2010 (from 17,598 in 2006 to 24,138 in 2010), the proportion of students within

UNDERGRADUATE DEGREES 51
Arizona Community College Cumulative Transfer Rates to Arizona Public Universities by time to transfer within cohort years
source | Arizona State System for Information on Student Transfer (2015) figure 83
0
5
10
15
20
25
30
2010-112009-102008-092007-082006-07
after 6 yearsafter 5 yearsafter 4 yearsafter 3 years
23,991
2013 Arizona Associate’s Degreesby sector
figure 84source | U.S. Department of Education, National Center for Education Statistics (2014)
72%
17%11%
for-profit 2-year
public 2-year
for-profit 4-year
not-for-profit 4-year
public 4-year
28,722
2013 Arizona Bachelor’s Degreesby sector
figure 86source | U.S. Department of Education, National Center for Education Statistics (2014)
70%
3%
27%
for-profit 4-year
not-for-profit 4-year
public 4-year
2013 Arizona Associate’s Degreesby race/ethnicity within sector
source | U. S. Department of Education, National Center for Education Statistics (2014) figure 85
0%
10%
20%
30%
40%
50%
60%
70%
80%
90%
100%
For-profit2-year
Public2-year
For-profit4-year
Not-for-profit
4-year
Public4-year
W
H
B
AP
AI
NR
UK
M
2013 Arizona Bachelor’s Degreesby race/ethnicity within sector
source | U. S. Department of Education, National Center for Education Statistics (2014) figure 87
0%
10%
20%
30%
40%
50%
60%
70%
80%
90%
100%
For-profit4-year
Not-for-profit
4-year
Public4-year
W
H
B
AP
AI
NR
UK
M
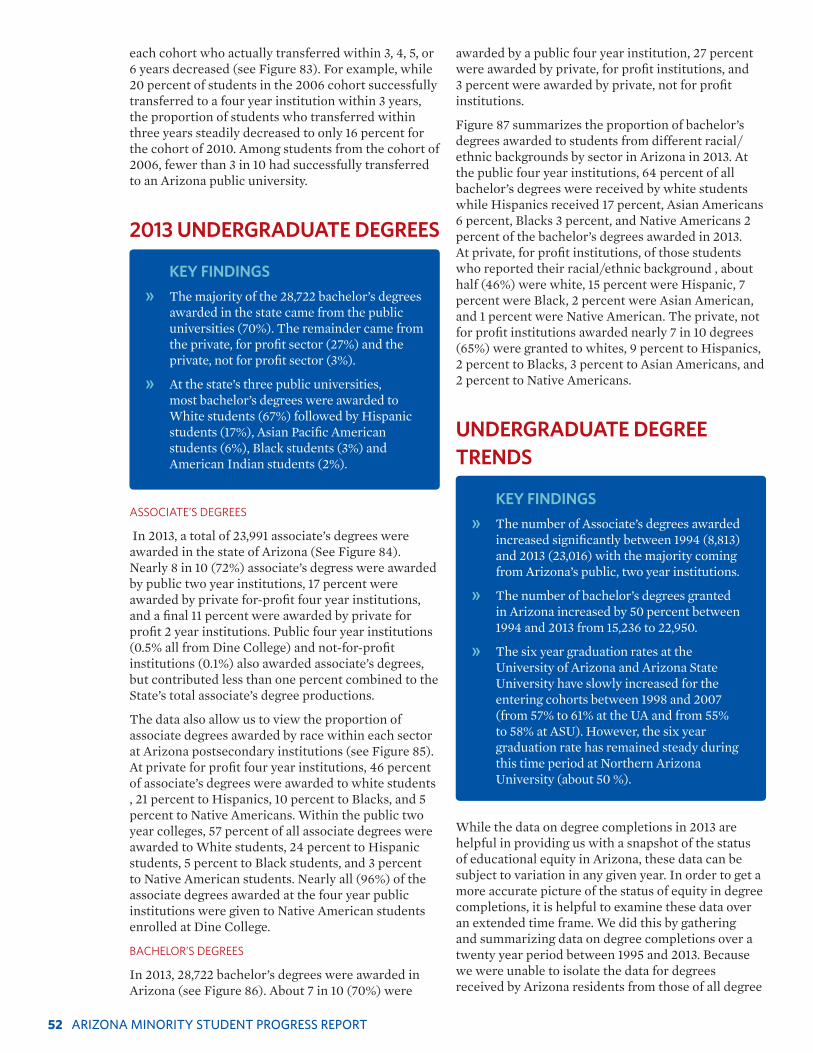
52 ARIZONA MINORITY STUDENT PROGRESS REPORT
each cohort who actually transferred within 3, 4, 5, or 6 years decreased (see Figure 83). For example, while 20 percent of students in the 2006 cohort successfully transferred to a four year institution within 3 years, the proportion of students who transferred within three years steadily decreased to only 16 percent for the cohort of 2010. Among students from the cohort of 2006, fewer than 3 in 10 had successfully transferred to an Arizona public university.
2013 UNDERGRADUATE DEGREES
KEY FINDINGS
» The majority of the 28,722 bachelor’s degrees awarded in the state came from the public universities (70%). The remainder came from the private, for profit sector (27%) and the private, not for profit sector (3%).
» At the state’s three public universities, most bachelor’s degrees were awarded to White students (67%) followed by Hispanic students (17%), Asian Pacific American students (6%), Black students (3%) and American Indian students (2%).
ASSOCIATE’S DEGREES
In 2013, a total of 23,991 associate’s degrees were awarded in the state of Arizona (See Figure 84). Nearly 8 in 10 (72%) associate’s degress were awarded by public two year institutions, 17 percent were awarded by private for-profit four year institutions, and a final 11 percent were awarded by private for profit 2 year institutions. Public four year institutions (0.5% all from Dine College) and not-for-profit institutions (0.1%) also awarded associate’s degrees, but contributed less than one percent combined to the State’s total associate’s degree productions.
The data also allow us to view the proportion of associate degrees awarded by race within each sector at Arizona postsecondary institutions (see Figure 85). At private for profit four year institutions, 46 percent of associate’s degrees were awarded to white students , 21 percent to Hispanics, 10 percent to Blacks, and 5 percent to Native Americans. Within the public two year colleges, 57 percent of all associate degrees were awarded to White students, 24 percent to Hispanic students, 5 percent to Black students, and 3 percent to Native American students. Nearly all (96%) of the associate degrees awarded at the four year public institutions were given to Native American students enrolled at Dine College.
BACHELOR’S DEGREES
In 2013, 28,722 bachelor’s degrees were awarded in Arizona (see Figure 86). About 7 in 10 (70%) were
awarded by a public four year institution, 27 percent were awarded by private, for profit institutions, and 3 percent were awarded by private, not for profit institutions.
Figure 87 summarizes the proportion of bachelor’s degrees awarded to students from different racial/ethnic backgrounds by sector in Arizona in 2013. At the public four year institutions, 64 percent of all bachelor’s degrees were received by white students while Hispanics received 17 percent, Asian Americans 6 percent, Blacks 3 percent, and Native Americans 2 percent of the bachelor’s degrees awarded in 2013. At private, for profit institutions, of those students who reported their racial/ethnic background , about half (46%) were white, 15 percent were Hispanic, 7 percent were Black, 2 percent were Asian American, and 1 percent were Native American. The private, not for profit institutions awarded nearly 7 in 10 degrees (65%) were granted to whites, 9 percent to Hispanics, 2 percent to Blacks, 3 percent to Asian Americans, and 2 percent to Native Americans.
UNDERGRADUATE DEGREE TRENDS
KEY FINDINGS
» The number of Associate’s degrees awarded increased significantly between 1994 (8,813) and 2013 (23,016) with the majority coming from Arizona’s public, two year institutions.
» The number of bachelor’s degrees granted in Arizona increased by 50 percent between 1994 and 2013 from 15,236 to 22,950.
» The six year graduation rates at the University of Arizona and Arizona State University have slowly increased for the entering cohorts between 1998 and 2007 (from 57% to 61% at the UA and from 55% to 58% at ASU). However, the six year graduation rate has remained steady during this time period at Northern Arizona University (about 50 %).
While the data on degree completions in 2013 are helpful in providing us with a snapshot of the status of educational equity in Arizona, these data can be subject to variation in any given year. In order to get a more accurate picture of the status of equity in degree completions, it is helpful to examine these data over an extended time frame. We did this by gathering and summarizing data on degree completions over a twenty year period between 1995 and 2013. Because we were unable to isolate the data for degrees received by Arizona residents from those of all degree

UNDERGRADUATE DEGREES 53
Arizona Associate’s Degrees 1994-2013 by race/ethnicity
source | U.S. Department of Education, National Center for Education Statistics (2014) Figure 88
0%
10%
20%
30%
40%
50%
60%
70%
20132012201120102009200820072006200520042003200220012000199919981997199619951994
AI B AP H W M UK NR
Arizona Bachelor’s Degrees 1994-2013 by race/ethnicity
source | U.S. Department of Education, National Center for Education Statistics (2014) Figure 89
0%
10%
20%
30%
40%
50%
60%
70%
80%
20132012201120102009200820072006200520042003200220012000199919981997199619951994
AI B AP H W M UK NR
recipients at the for-profit four year institutions during this 20 year period, degree completion data for The University of Phoenix Online Campus , Grand Canyon University, and Western International University were excluded from these trend analyses. This was necessary because the overwhelming majority of degrees conferred by these institutions go to students who are not in Arizona.
ASSOCIATE’S DEGREES
Between 1994 and 2013, the growth in associate’s degree granted in Arizona increased by more than 100 percent from 8,813 associate’s degrees in 1994 to 23,016 in 2013. The proportion of degrees awarded to white students during that time period decreased from 72 percent in 1994 to 56 percent in 2013 (see
Figure 88). The proportion of associate’s degrees awarded to Hispanics increased from 15 percent in 1994 to 23 percent in 2013, showing a steady increase throughout the time period. The proportion of Black students receiving associate’s degrees between 1994 and 2013 has slowly increased from 4 percent to 6 percent. The proportion of associate’s degrees awarded to American Indian students began at 5 percent in 1994, peaked at 7 percent in 2002, and has since dropped back to 4 percent in 2013. The proportion of Asian Pacific Americans receiving associate’s degrees remained relatively flat during this time period (3%).
BACHELOR’S DEGREES
The number of bachelor’s degrees granted in Arizona

54 ARIZONA MINORITY STUDENT PROGRESS REPORT
Arizona Universities’ Six-Year Graduation Rates 1998-2007by university
source | U.S. Department of Education, National Center for Education Statistics (2014) Figure 90
0%
10%
20%
30%
40%
50%
60%
70%
80%
2007200620052004200320022001200019991998
UA ASU NAU
Proportion of Students Graduating within Six Years arizona state university cohorts entering 1998-2007 by race/ethnicity
source | U.S. Department of Education, National Center for Education Statistics (2014) Figure 91
0%
10%
20%
30%
40%
50%
60%
70%
80%
90%
100%
2007200620052004200320022001200019991998
AI B AP H W M UK NR
Proportion of Students Graduating within Six Years the university of arizona cohorts entering 1998-2007 by race/ethnicity
source | U.S. Department of Education, National Center for Education Statistics (2014) Figure 92
0%
10%
20%
30%
40%
50%
60%
70%
80%
90%
100%
2007200620052004200320022001200019991998
AI B AP H W M UK NR

ARIZONA UNIVERSITY SYSTEM SIX-YEAR GRADUATION RATES 55
increased by 50 percent between 1994 and 2013 from 15,236 to 22,950. Figure 89 summarizes trends in the proportion of bachelor’s degrees granted by race/ethnicity during this time period. Given the growth in the proportion of students of color in Arizona, it is not surprising that the proportion of Whites receiving bachelor’s degrees in Arizona decreased from 79 percent in 1994 to 63 percent in 2013. The proportion of bachelor’s degrees awarded to Hispanics nearly doubled from 8 percent in 1994 to 16 percent in 2013. The proportion of Blacks and Asian Pacific Americans receiving bachelor’s degrees increased from 1994 to 2013, from 2 percent to 4 percent and from 3 percent to 5 percent, respectively. Finally, the proportion of bachelor’s degrees awarded to American Indian students remained very low during this time period (2%).
ARIZONA UNIVERSITY SYSTEM SIX-YEAR GRADUATION RATESSix-year graduation rates are calculated by dividing the total number of graduates after six years by the total number of entering students for each cohort. Figure 90 compares six-year graduation rates for each of Arizona’s three public universities—The University of Arizona (UA), Arizona State University (ASU), and Northern Arizona University (NAU)—for entering cohorts of 1998 to 2007. UA’s six-year graduation rate increased from 57 percent for 1998 cohort to 61 percent for the 2007 cohort. While ASU has also seen an increase in their six-year graduation rates from 55 percent to 58 percent for the same year cohorts, NAU’s six-year graduation rate decreased slightly from 50 percent for the 1998 cohort to 49 percent for the 2013 cohort.
When reviewed by race and ethnicity, the proportion of students who graduated within six-years remained relatively the same across all the institutions for the 1998 through 2007 cohorts (See Figures 91-93).
At ASU (Figure 91), the racial/ethnic proportion of six-year graduation rates was comprised of whites at 74 percent for the 1998 cohort and 69 percent for the 2007 cohort, followed by Hispanics (10% for 1998 and 14% for 2007), Asian Pacific Americans (6% for 1998 and 7% for 2007), Nonresident Aliens (4% in 1998 and 2% in 2007), Unknowns (3% for 1998 and 3% for 2007), Blacks ( 3% for 1998 and 3% for 2007), and American Indians (1% in 1998 and 1% in 2007).
At UA (Figure 92), Whites comprised 77 percent for the 1998 cohort and 69 percent for the 2007 cohort, followed by Hispanics (10% for 1998 and 15% for 2007), Asian Pacific Americans (6% for 1998 and 7% for 2007), Nonresident Aliens (3% in 1998 and 2% in 2007), Blacks ( 2% for 1998 and 3% for 2007), Unknowns (1% for 1998 and 2% for 2007), and American Indians (1% in 1998 and 2% in 2007).
At NAU (Figure 93), Whites comprised 84 percent for the 1998 cohort and 79 percent for the 2007 cohort, followed by Hispanics (7% for 1998 and 9% for 2007), American Indians (3% in 1998 and 2% in 2007), Asian Pacific Americans (2% for 1998 and 3% for 2007), Blacks ( 2% for 1998 and 3% for 2007), Unknowns (1% for 1998 and 2% for 2007), and Nonresident Aliens (1% in 1998 and 1% in 2007).
Another way to examine graduation rates is within race/ethnicity (See Figures 94-96). Entering first-time freshmen are tracked for six years to arrive at their six-year graduation rate.
At ASU (Figure 94), Asian Pacific American students consistently have the highest six-year graduation rate within their cohort (60% for the 1998 cohort and 64% for the 2007 cohort). The six-year graduation rate for White students was 56 percent in 1998 and 62 percent in 2007. For Black students it was 47 percent for the 1998 cohort and 42 percent for the 2007 cohort, for Hispanic students it was 51 percent for the 1998 cohort and 51 percent for the 2007 cohort, and for American Indians only about one quarter of students graduated within this six-year window (24% for the 1998 cohort and 33% for the 2007 cohort).
Figure 95 shows that Asian Pacific American students at UA consistently have the highest six-year graduation rate within their cohort as about two thirds of Asian Pacific American students graduate within 6 year (60% for the 1998 cohort and 67% for the 2007 cohort). The six-year graduation rate for White students was 60 percent in 1998 and 64 percent in 2007. For Black students it was 41 percent for the 1998 cohort and 47 percent for the 2007 cohort, for Hispanic students it was 47 percent for the 1998 cohort and 57 percent for the 2007 cohort, and for American Indians it was 36 percent for the 1998 cohort and 44 percent for the 2007 cohort.
At NAU (Figure 96), White students have the highest six-year graduation rate within their cohort (52% for the 1998 cohort and 52% for the 2007 cohort). The six-year graduation rate for Asian Pacific American students was 47 percent in 1998 and 43 percent in 2007. Black students graduated at a very high rate in 1998, 59 percent, but have fluctuated the most of any racial ethnic group throughout the 10 year period as they graduated at a 41 percent rate in 2007. The six-year graduation rate for Hispanic students was 43 percent for the 1998 cohort and 40 percent for the 2007 cohort. One third of American Indian students graduated within this six-year window in 1998(33%) and the rate declined to 29 percent for the 2007 cohort.
Figure 97 illustrates six-year graduation rates for cohorts entering in 1998 through 2007 in all U.S. four-year public institutions within race/ethnicity. Similarly to Arizona’s public universities, Asian Pacific American students consistently have the highest six-year graduation rates nationally, although they

56 ARIZONA MINORITY STUDENT PROGRESS REPORT
Proportion of Students Graduating within Six Years northern arizona university cohorts entering 1998-2007 by race/ethnicity
source | U.S. Department of Education, National Center for Education Statistics (2014) Figure 93
0%
10%
20%
30%
40%
50%
60%
70%
80%
90%
100%
2007200620052004200320022001200019991998
AI B AP H W M UK NR
Six-Year Graduation Rates for Cohorts Entering 1998-2007arizona state university within race ethnicity
source | U.S. Department of Education, National Center for Education Statistics (2014) Figure 94
0%
10%
20%
30%
40%
50%
60%
70%
80%
2007200620052004200320022001200019991998
AI B AP H W UK NR
Six-Year Graduation Rates for Cohorts Entering 1998-2007the university of arizona within race ethnicity
source | U.S. Department of Education, National Center for Education Statistics (2014) Figure 95
0%
10%
20%
30%
40%
50%
60%
70%
80%
2007200620052004200320022001200019991998
AI B AP H W UK NR

GRADUATE AND PROFESSIONAL ENROLLMENTS 57
Six-Year Graduation Rates for Cohorts Entering 1998-2007arizona state university within race ethnicity
source | U.S. Department of Education, National Center for Education Statistics (2014) Figure 96
0%
10%
20%
30%
40%
50%
60%
70%
80%
2007200620052004200320022001200019991998
AI B AP H W
Six-Year Graduation Rates for Cohorts Entering 1998-2007u.s. 4-year public institutions within race ethnicity
source | U.S. Department of Education, National Center for Education Statistics (2014) Figure 97
0%
10%
20%
30%
40%
50%
60%
70%
80%
2007200620052004200320022001200019991998
AI B AP H W
graduate at slightly lower rates in Arizona’s public institutions than the national rate for Asian Pacific American students in public universities. Similar to national trends, White students follow Asian Pacific American students with the second highest rates. While Hispanic students at UA graduate within six years at slightly higher rates than the national rate for Hispanic students in public universities, Hispanic students at ASU and NAU graduate at slightly lower rates. Both Black and American Indian students in Arizona public four-year institutions also graduate within six-years at slightly lower rates compared to national rates.
2014 GRADUATE AND PROFESSIONAL ENROLLMENTS
KEY FINDINGS
» About half of all graduate and professional students in Arizona are enrolled at one of the public universities in the state while just about four in ten are enrolled at a private, for profit institution. Finally, one in ten graduate and professional students in Arizona is enrolled at a private, not for profit institution
» Whites are the group with the highest percentage of enrollments within each sector

58 ARIZONA MINORITY STUDENT PROGRESS REPORT
2014 Arizona Graduate & Professional Enrollmentsby race/ethnicity within sector
source | U. S. Department of Education, National Center for Education Statistics (2014) figure 100
0%
10%
20%
30%
40%
50%
60%
70%
80%
90%
100%
NR Alien UnknownAsian/PIMultiracialHispanicAmerican IndianBlackWhite
for-profit 4-yearnot-for-profit 4-yearpublic 4-year
Arizona Public 4-Year Graduate/Professional Enrollments 1994-2014by race/ethnicity
source | U.S. Department of Education, National Center for Education Statistics (2014) Figure 101
0%
10%
20%
30%
40%
50%
60%
70%
80%
201420132012201120102009200820072006200520042003200220012000199919981997199619951994
AI B AP H W M UK NR
Arizona Graduate & Professional Enrollmentsby race/ethnicity within sector
source | U. S. Department of Education, National Center for Education Statistics (2014) figure 99
0%
10%
20%
30%
40%
50%
60%
70%
80%
90%
100%
For-Profit4-year
Not-For-Profit4-year
Public4-year
W
H
B
AP
AI
NR
UK
M
58,399
2014 Arizona Graduate & Professional Enrollmentsby sector
figure 98source | U.S. Department of Education, National Center for Education Statistics (2014)
48%
9%
43%
for-profit4-year
not-for-profit 4-year
public 4-year

GRADUATE AND PROFESSIONAL ENROLLMENT TRENDS 59
and make up nearly six of ten graduate students at public institutions and at private, not for profit institutions.
» International students make up about 2 in 10 of graduate and professional students enrolled at public institutions and 1 in 10 of graduate and professional students enrolled at private, not for profit institutions.
Figure 98 summarizes the data on graduate and professional school enrollments in Arizona by sector. About half (48%) of all graduate and professional students in Arizona are enrolled at one of the public universities in the state while just about four in ten (43%) are enrolled at a private, for profit institution. Finally, one in ten (9%) graduate and professional students in Arizona is enrolled at a private, not for profit institution.
The data on graduate and professional enrollments by racial/ethnic background and sector show that whites are the group with the highest percentage of enrollments within each sector and make up nearly six of ten graduate students at public institutions and at private, not for profit institutions (See Figure 99). Given the nature of graduate and professional education, institutions tend to draw a significant portion of their graduate students from other countries. We see evidence of this in Figure 99 as international students make up about 18 percent of graduate and professional students at public institutions and 12 percent at private, not for profit institutions. Hispanic students comprise about one in ten graduate and professional students at public universities (11%) and private for profit institutions (9%), but are only about 6 percent of enrollments at the private not for profit institutions . Native American students represent only 2 percent of the graduate and professional enrollments in the public institutions and are less than 1 percent at the private institutions in the state. Asian American students represent 5 percent of graduate and professional enrollments at the public institutions, 5 percent of graduate and professional enrollments at the private, not for profits, and 3 percent of enrollments at the private for profits.
Figure 100 summarizes the data regarding which sector students from different racial/ethnic groups are enrolled in for graduate and professional school. Among Native American students, more than 7 in 10 (74%) are enrolled in one of the state’s public institutions while 22 percent are enrolled at a private, for profit institution and 4 percent are enrolled at a private, not for profit institution. A similar pattern is seen among Hispanic students where about 7 in 10 (70%) are enrolled at a public institution, 23 percent are enrolled in a private, for profit institution, and
7 percent are enrolled at a private, not for profit school. However, a very different pattern is evident for Black students where more than three quarters (79%) are enrolled at private, for profits and less than one quarter (18%) are enrolled at public institutions. White students are enrolled predominantly at public institutions (62%) while about one quarter is enrolled at private for profits (25%) and about 13 percent at private not for profits. Among Asian American students, over half (55%) are enrolled at public institutions and more than one quarter (28%) are at private not for profits. Nearly 9 in 10 international graduate and professional students are enrolled in public institutions, 11 percent are at private not for profits and about 1 percent are enrolled at the private for profit institutions.
GRADUATE AND PROFESSIONAL ENROLLMENT TRENDS
KEY FINDINGS
» The growth in enrollment of graduate and professional students in the public four-year institutions increased by 11 percent, from 25,112 in 1994 to 28,031 in 2014.
» Small and steady increases in the proportional representation of students of color at the state’s public institutions are evident between 1994 and 2014—with Hispanics increasing from 7 percent to 11 percent, Asian Pacific Islanders increasing from 3 percent to 5 percent, Blacks increasing from 2 percent to 3 percent, and American Indians increasing from 1 percent to 2 percent.
» At private, for-profit, four-year institutions in Arizona, graduate and professional enrollments increased by more than 200 percent from 4,565 in 1994 to 15,548 in 2014.
PUBLIC FOUR-YEAR INSTITUTIONS
In Arizona, the growth in enrollment of graduate and professional students in the public four-year institutions increased by 11 percent, growing from 25,112 in 1994 to 28,031 in 2014. While white students were approximately three quarters of the enrollment of graduate and professional students in 1994 (74%), their proportional representation decreased to 55 percent in 2014 (See Figure 101). The second largest group was comprised of international students (12% in 1994 and 18% in 2014). Small and steady increases in the proportional representation of students of color are evident between 1994 and 2014—with Hispanics increasing from 7 percent to 11 percent, Asian Pacific

60 ARIZONA MINORITY STUDENT PROGRESS REPORT
Arizona Not-For-Profit 4-Year Graduate/Professional Enrollments 1994-2014 by race/ethnicity
source | U.S. Department of Education, National Center for Education Statistics (2014) Figure 102
0%
10%
20%
30%
40%
50%
60%
70%
80%
201420132012201120102009200820072006200520042003200220012000199919981997199619951994
AI B AP H W M UK NR
Arizona For-Profit 4-Year Graduate/Professional Enrollments 1994-2014 by race/ethnicity
source | U.S. Department of Education, National Center for Education Statistics (2014) Figure 103
0%
10%
20%
30%
40%
50%
60%
70%
80%
90%
201420132012201120102009200820072006200520042003200220012000199919981997199619951994
AI B AP H W M UK NR
Islanders increasing from 3 percent to 5 percent, Blacks increasing from 2 percent to 3 percent, and American Indians increasing from 1 percent to 2 percent. Women maintained a steady advantage over men in enrollments during this time period (52% in 1994 and 53% in 2014).
PRIVATE NOT-FOR-PROFIT FOUR-YEAR INSTITUTIONS
In Arizona between 1994 and 2014, the number of graduate and professional school enrollments at private four-year institutions increased by 45 percent from 3,553 to 5,389. As can be seen in Figure 102, the proportion of White students decreased from 70 percent to 60 percent between 1994 and 2014. International students made up 8 percent of graduate and professional enrollments at private four-year
institutions in Arizona in 1994, increased to 27 percent in 1998 and then began to steadily decline until they reached 12 percent in 2014. The proportion of Hispanics enrolled in private four-year institutions increased from 4 percent in 1994 to 6 percent in 2014. The proportional enrollment of Asian Pacific Americans increased steadily (4%in 1994 to 12% in 2014) while the proportional enrollment of Blacks increased decreased (8% in 1994 and 3% in 2014) at private four-years. The representation of American Indians remained low during this twenty-year period (1% in both 1994 and 2014). Enrollments of men and women fluctuated between 1991 and 2010 with women being the majority at 51 percent in 1994 and men the majority in 2014 at 53 percent.
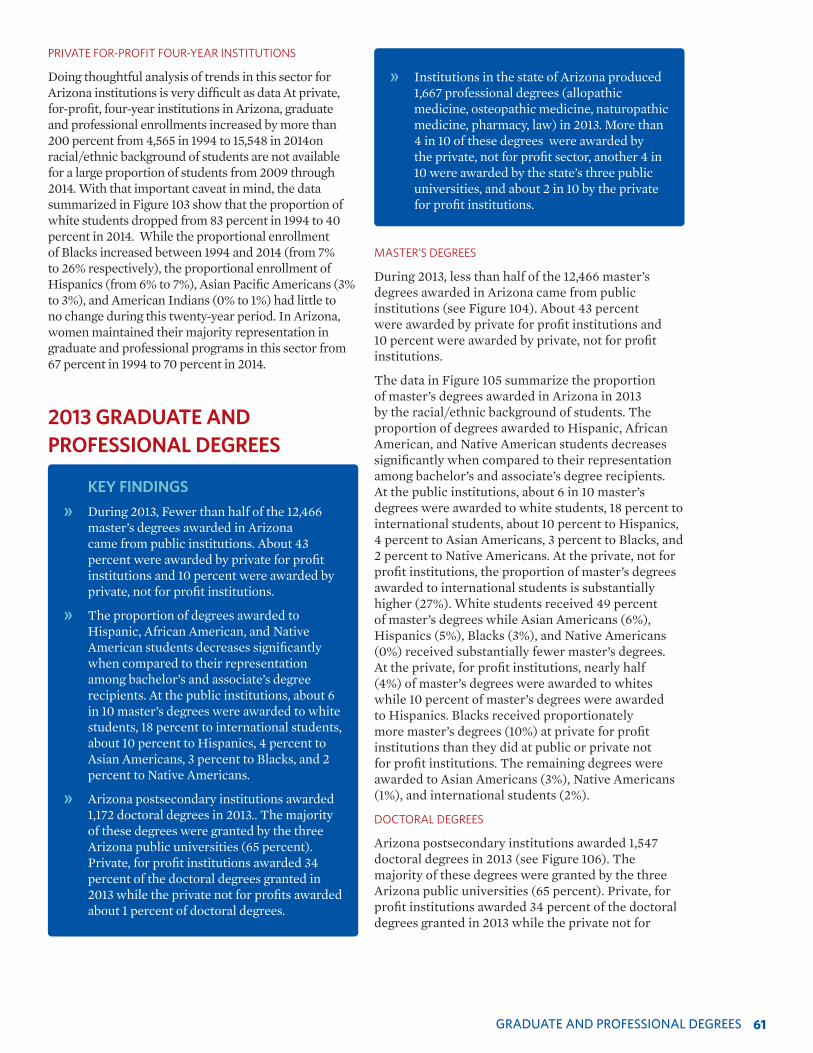
GRADUATE AND PROFESSIONAL DEGREES 61
PRIVATE FOR-PROFIT FOUR-YEAR INSTITUTIONS
Doing thoughtful analysis of trends in this sector for Arizona institutions is very difficult as data At private, for-profit, four-year institutions in Arizona, graduate and professional enrollments increased by more than 200 percent from 4,565 in 1994 to 15,548 in 2014on racial/ethnic background of students are not available for a large proportion of students from 2009 through 2014. With that important caveat in mind, the data summarized in Figure 103 show that the proportion of white students dropped from 83 percent in 1994 to 40 percent in 2014. While the proportional enrollment of Blacks increased between 1994 and 2014 (from 7% to 26% respectively), the proportional enrollment of Hispanics (from 6% to 7%), Asian Pacific Americans (3% to 3%), and American Indians (0% to 1%) had little to no change during this twenty-year period. In Arizona, women maintained their majority representation in graduate and professional programs in this sector from 67 percent in 1994 to 70 percent in 2014.
2013 GRADUATE AND PROFESSIONAL DEGREES
KEY FINDINGS
» During 2013, Fewer than half of the 12,466 master’s degrees awarded in Arizona came from public institutions. About 43 percent were awarded by private for profit institutions and 10 percent were awarded by private, not for profit institutions.
» The proportion of degrees awarded to Hispanic, African American, and Native American students decreases significantly when compared to their representation among bachelor’s and associate’s degree recipients. At the public institutions, about 6 in 10 master’s degrees were awarded to white students, 18 percent to international students, about 10 percent to Hispanics, 4 percent to Asian Americans, 3 percent to Blacks, and 2 percent to Native Americans.
» Arizona postsecondary institutions awarded 1,172 doctoral degrees in 2013.. The majority of these degrees were granted by the three Arizona public universities (65 percent). Private, for profit institutions awarded 34 percent of the doctoral degrees granted in 2013 while the private not for profits awarded about 1 percent of doctoral degrees.
» Institutions in the state of Arizona produced 1,667 professional degrees (allopathic medicine, osteopathic medicine, naturopathic medicine, pharmacy, law) in 2013. More than 4 in 10 of these degrees were awarded by the private, not for profit sector, another 4 in 10 were awarded by the state’s three public universities, and about 2 in 10 by the private for profit institutions.
MASTER’S DEGREES
During 2013, less than half of the 12,466 master’s degrees awarded in Arizona came from public institutions (see Figure 104). About 43 percent were awarded by private for profit institutions and 10 percent were awarded by private, not for profit institutions.
The data in Figure 105 summarize the proportion of master’s degrees awarded in Arizona in 2013 by the racial/ethnic background of students. The proportion of degrees awarded to Hispanic, African American, and Native American students decreases significantly when compared to their representation among bachelor’s and associate’s degree recipients. At the public institutions, about 6 in 10 master’s degrees were awarded to white students, 18 percent to international students, about 10 percent to Hispanics, 4 percent to Asian Americans, 3 percent to Blacks, and 2 percent to Native Americans. At the private, not for profit institutions, the proportion of master’s degrees awarded to international students is substantially higher (27%). White students received 49 percent of master’s degrees while Asian Americans (6%), Hispanics (5%), Blacks (3%), and Native Americans (0%) received substantially fewer master’s degrees. At the private, for profit institutions, nearly half (4%) of master’s degrees were awarded to whites while 10 percent of master’s degrees were awarded to Hispanics. Blacks received proportionately more master’s degrees (10%) at private for profit institutions than they did at public or private not for profit institutions. The remaining degrees were awarded to Asian Americans (3%), Native Americans (1%), and international students (2%).
DOCTORAL DEGREES
Arizona postsecondary institutions awarded 1,547 doctoral degrees in 2013 (see Figure 106). The majority of these degrees were granted by the three Arizona public universities (65 percent). Private, for profit institutions awarded 34 percent of the doctoral degrees granted in 2013 while the private not for
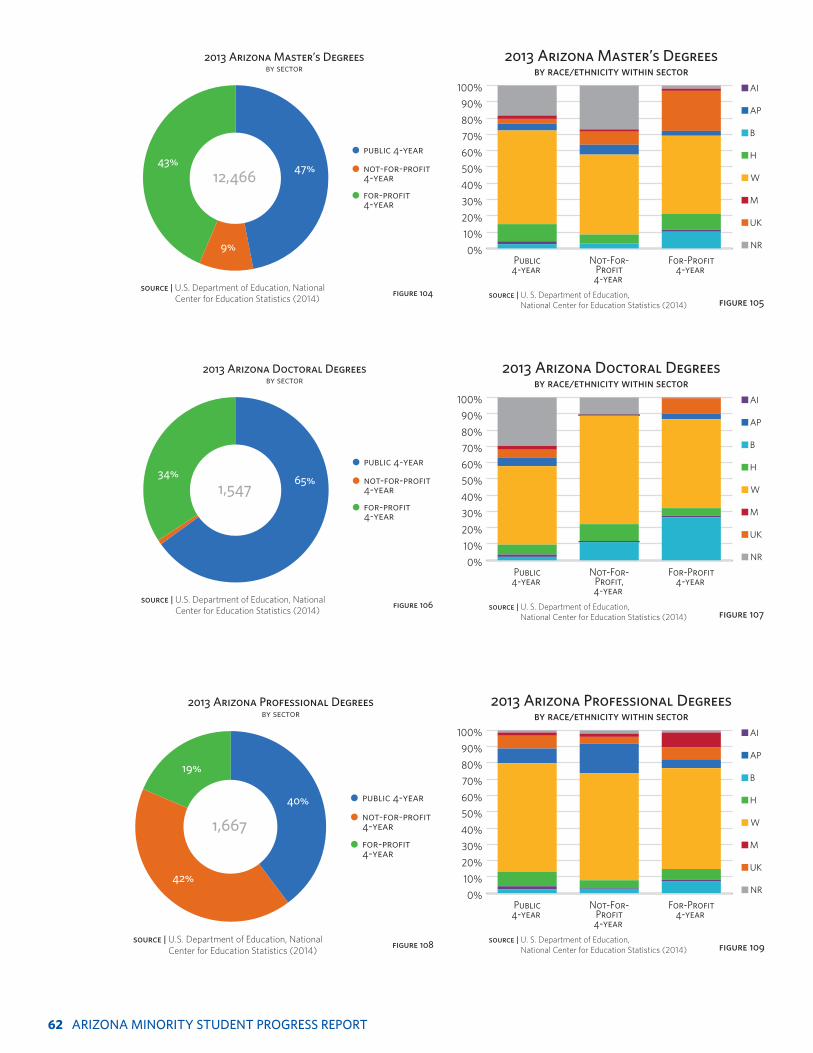
62 ARIZONA MINORITY STUDENT PROGRESS REPORT
2013 Arizona Master’s Degreesby race/ethnicity within sector
source | U. S. Department of Education, National Center for Education Statistics (2014) figure 105
0%
10%
20%
30%
40%
50%
60%
70%
80%
90%
100%
For-Profit4-year
Not-For-Profit4-year
Public4-year
W
H
B
AP
AI
NR
UK
M
2013 Arizona Doctoral Degreesby race/ethnicity within sector
source | U. S. Department of Education, National Center for Education Statistics (2014) figure 107
0%
10%
20%
30%
40%
50%
60%
70%
80%
90%
100%
For-Profit4-year
Not-For-Profit,4-year
Public4-year
W
H
B
AP
AI
NR
UK
M
2013 Arizona Professional Degreesby race/ethnicity within sector
source | U. S. Department of Education, National Center for Education Statistics (2014) figure 109
0%
10%
20%
30%
40%
50%
60%
70%
80%
90%
100%
For-Profit4-year
Not-For-Profit4-year
Public4-year
W
H
B
AP
AI
NR
UK
M
1,667
2013 Arizona Professional Degreesby sector
figure 108source | U.S. Department of Education, National Center for Education Statistics (2014)
40%
19%
42%
for-profit4-year
not-for-profit 4-year
public 4-year
12,466
2013 Arizona Master’s Degreesby sector
figure 104source | U.S. Department of Education, National Center for Education Statistics (2014)
47%
9%
43%
for-profit4-year
not-for-profit 4-year
public 4-year
1,547
2013 Arizona Doctoral Degreesby sector
figure 106source | U.S. Department of Education, National Center for Education Statistics (2014)
65%34%
for-profit4-year
not-for-profit 4-year
public 4-year
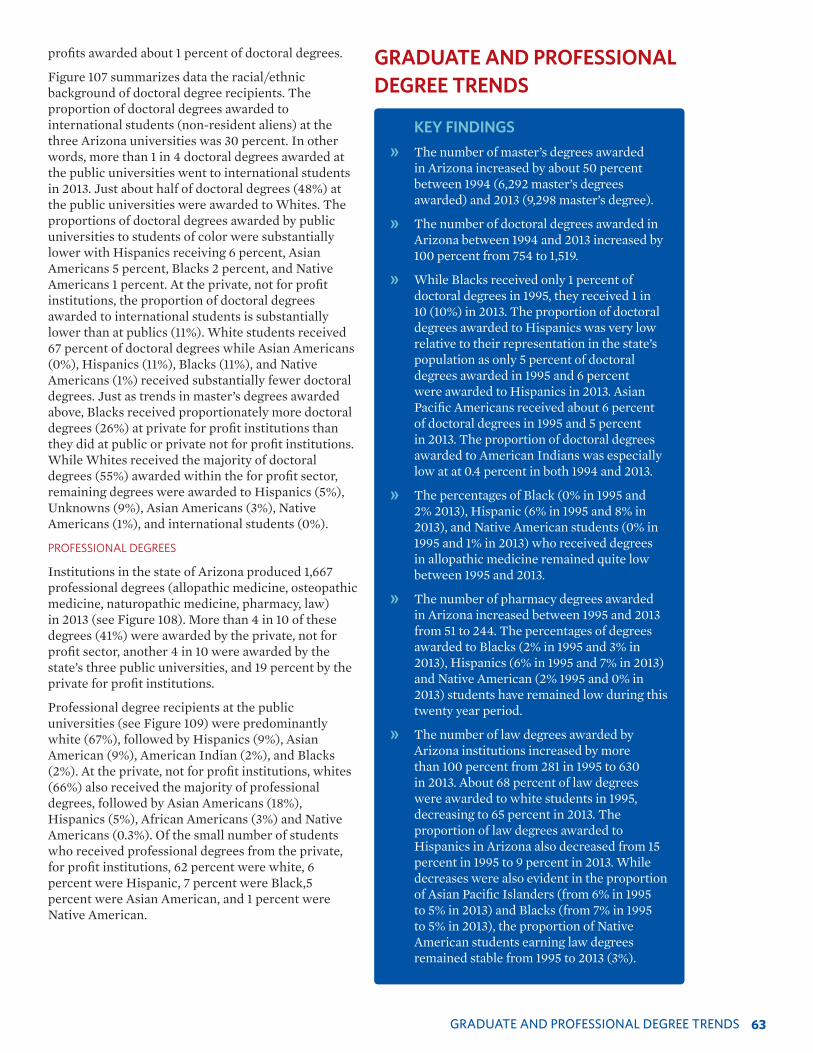
GRADUATE AND PROFESSIONAL DEGREE TRENDS 63
profits awarded about 1 percent of doctoral degrees.
Figure 107 summarizes data the racial/ethnic background of doctoral degree recipients. The proportion of doctoral degrees awarded to international students (non-resident aliens) at the three Arizona universities was 30 percent. In other words, more than 1 in 4 doctoral degrees awarded at the public universities went to international students in 2013. Just about half of doctoral degrees (48%) at the public universities were awarded to Whites. The proportions of doctoral degrees awarded by public universities to students of color were substantially lower with Hispanics receiving 6 percent, Asian Americans 5 percent, Blacks 2 percent, and Native Americans 1 percent. At the private, not for profit institutions, the proportion of doctoral degrees awarded to international students is substantially lower than at publics (11%). White students received 67 percent of doctoral degrees while Asian Americans (0%), Hispanics (11%), Blacks (11%), and Native Americans (1%) received substantially fewer doctoral degrees. Just as trends in master’s degrees awarded above, Blacks received proportionately more doctoral degrees (26%) at private for profit institutions than they did at public or private not for profit institutions. While Whites received the majority of doctoral degrees (55%) awarded within the for profit sector, remaining degrees were awarded to Hispanics (5%), Unknowns (9%), Asian Americans (3%), Native Americans (1%), and international students (0%).
PROFESSIONAL DEGREES
Institutions in the state of Arizona produced 1,667 professional degrees (allopathic medicine, osteopathic medicine, naturopathic medicine, pharmacy, law) in 2013 (see Figure 108). More than 4 in 10 of these degrees (41%) were awarded by the private, not for profit sector, another 4 in 10 were awarded by the state’s three public universities, and 19 percent by the private for profit institutions.
Professional degree recipients at the public universities (see Figure 109) were predominantly white (67%), followed by Hispanics (9%), Asian American (9%), American Indian (2%), and Blacks (2%). At the private, not for profit institutions, whites (66%) also received the majority of professional degrees, followed by Asian Americans (18%), Hispanics (5%), African Americans (3%) and Native Americans (0.3%). Of the small number of students who received professional degrees from the private, for profit institutions, 62 percent were white, 6 percent were Hispanic, 7 percent were Black,5 percent were Asian American, and 1 percent were Native American.
GRADUATE AND PROFESSIONAL DEGREE TRENDS
KEY FINDINGS
» The number of master’s degrees awarded in Arizona increased by about 50 percent between 1994 (6,292 master’s degrees awarded) and 2013 (9,298 master’s degree).
» The number of doctoral degrees awarded in Arizona between 1994 and 2013 increased by 100 percent from 754 to 1,519.
» While Blacks received only 1 percent of doctoral degrees in 1995, they received 1 in 10 (10%) in 2013. The proportion of doctoral degrees awarded to Hispanics was very low relative to their representation in the state’s population as only 5 percent of doctoral degrees awarded in 1995 and 6 percent were awarded to Hispanics in 2013. Asian Pacific Americans received about 6 percent of doctoral degrees in 1995 and 5 percent in 2013. The proportion of doctoral degrees awarded to American Indians was especially low at at 0.4 percent in both 1994 and 2013.
» The percentages of Black (0% in 1995 and 2% 2013), Hispanic (6% in 1995 and 8% in 2013), and Native American students (0% in 1995 and 1% in 2013) who received degrees in allopathic medicine remained quite low between 1995 and 2013.
» The number of pharmacy degrees awarded in Arizona increased between 1995 and 2013 from 51 to 244. The percentages of degrees awarded to Blacks (2% in 1995 and 3% in 2013), Hispanics (6% in 1995 and 7% in 2013) and Native American (2% 1995 and 0% in 2013) students have remained low during this twenty year period.
» The number of law degrees awarded by Arizona institutions increased by more than 100 percent from 281 in 1995 to 630 in 2013. About 68 percent of law degrees were awarded to white students in 1995, decreasing to 65 percent in 2013. The proportion of law degrees awarded to Hispanics in Arizona also decreased from 15 percent in 1995 to 9 percent in 2013. While decreases were also evident in the proportion of Asian Pacific Islanders (from 6% in 1995 to 5% in 2013) and Blacks (from 7% in 1995 to 5% in 2013), the proportion of Native American students earning law degrees remained stable from 1995 to 2013 (3%).

64 ARIZONA MINORITY STUDENT PROGRESS REPORT
Arizona Master’s Degrees 1994-2013 by race/ethnicity
source | U.S. Department of Education, National Center for Education Statistics (2014) Figure 110
0%
10%
20%
30%
40%
50%
60%
70%
20132012201120102009200820072006200520042003200220012000199919981997199619951994
AI B AP H W M UK NR
Arizona Doctoral Degrees 1994-2013 by race/ethnicity
source | U.S. Department of Education, National Center for Education Statistics (2014) Figure 111
0%
10%
20%
30%
40%
50%
60%
70%
20132012201120102009200820072006200520042003200220012000199919981997199619951994
AI B AP H W M UK NR
Arizona Allopathic Medicine Degrees 1994-2013 by race/ethnicity
source | U.S. Department of Education, National Center for Education Statistics (2014) Figure 112
0%
10%
20%
30%
40%
50%
60%
70%
80%
20132012201120102009200820072006200520042003200220012000199919981997199619951994
AI B AP H W M UK NR
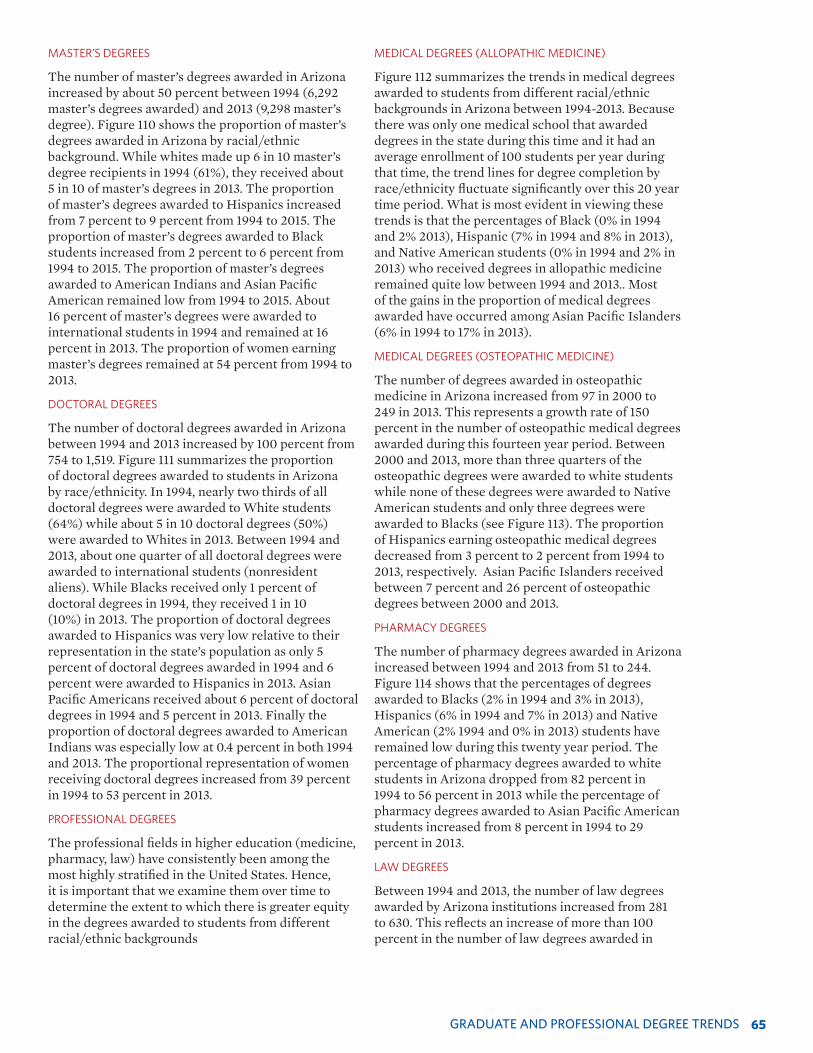
GRADUATE AND PROFESSIONAL DEGREE TRENDS 65
MASTER’S DEGREES
The number of master’s degrees awarded in Arizona increased by about 50 percent between 1994 (6,292 master’s degrees awarded) and 2013 (9,298 master’s degree). Figure 110 shows the proportion of master’s degrees awarded in Arizona by racial/ethnic background. While whites made up 6 in 10 master’s degree recipients in 1994 (61%), they received about 5 in 10 of master’s degrees in 2013. The proportion of master’s degrees awarded to Hispanics increased from 7 percent to 9 percent from 1994 to 2015. The proportion of master’s degrees awarded to Black students increased from 2 percent to 6 percent from 1994 to 2015. The proportion of master’s degrees awarded to American Indians and Asian Pacific American remained low from 1994 to 2015. About 16 percent of master’s degrees were awarded to international students in 1994 and remained at 16 percent in 2013. The proportion of women earning master’s degrees remained at 54 percent from 1994 to 2013.
DOCTORAL DEGREES
The number of doctoral degrees awarded in Arizona between 1994 and 2013 increased by 100 percent from 754 to 1,519. Figure 111 summarizes the proportion of doctoral degrees awarded to students in Arizona by race/ethnicity. In 1994, nearly two thirds of all doctoral degrees were awarded to White students (64%) while about 5 in 10 doctoral degrees (50%) were awarded to Whites in 2013. Between 1994 and 2013, about one quarter of all doctoral degrees were awarded to international students (nonresident aliens). While Blacks received only 1 percent of doctoral degrees in 1994, they received 1 in 10 (10%) in 2013. The proportion of doctoral degrees awarded to Hispanics was very low relative to their representation in the state’s population as only 5 percent of doctoral degrees awarded in 1994 and 6 percent were awarded to Hispanics in 2013. Asian Pacific Americans received about 6 percent of doctoral degrees in 1994 and 5 percent in 2013. Finally the proportion of doctoral degrees awarded to American Indians was especially low at 0.4 percent in both 1994 and 2013. The proportional representation of women receiving doctoral degrees increased from 39 percent in 1994 to 53 percent in 2013.
PROFESSIONAL DEGREES
The professional fields in higher education (medicine, pharmacy, law) have consistently been among the most highly stratified in the United States. Hence, it is important that we examine them over time to determine the extent to which there is greater equity in the degrees awarded to students from different racial/ethnic backgrounds
MEDICAL DEGREES (ALLOPATHIC MEDICINE)
Figure 112 summarizes the trends in medical degrees awarded to students from different racial/ethnic backgrounds in Arizona between 1994-2013. Because there was only one medical school that awarded degrees in the state during this time and it had an average enrollment of 100 students per year during that time, the trend lines for degree completion by race/ethnicity fluctuate significantly over this 20 year time period. What is most evident in viewing these trends is that the percentages of Black (0% in 1994 and 2% 2013), Hispanic (7% in 1994 and 8% in 2013), and Native American students (0% in 1994 and 2% in 2013) who received degrees in allopathic medicine remained quite low between 1994 and 2013.. Most of the gains in the proportion of medical degrees awarded have occurred among Asian Pacific Islanders (6% in 1994 to 17% in 2013).
MEDICAL DEGREES (OSTEOPATHIC MEDICINE)
The number of degrees awarded in osteopathic medicine in Arizona increased from 97 in 2000 to 249 in 2013. This represents a growth rate of 150 percent in the number of osteopathic medical degrees awarded during this fourteen year period. Between 2000 and 2013, more than three quarters of the osteopathic degrees were awarded to white students while none of these degrees were awarded to Native American students and only three degrees were awarded to Blacks (see Figure 113). The proportion of Hispanics earning osteopathic medical degrees decreased from 3 percent to 2 percent from 1994 to 2013, respectively. Asian Pacific Islanders received between 7 percent and 26 percent of osteopathic degrees between 2000 and 2013.
PHARMACY DEGREES
The number of pharmacy degrees awarded in Arizona increased between 1994 and 2013 from 51 to 244. Figure 114 shows that the percentages of degrees awarded to Blacks (2% in 1994 and 3% in 2013), Hispanics (6% in 1994 and 7% in 2013) and Native American (2% 1994 and 0% in 2013) students have remained low during this twenty year period. The percentage of pharmacy degrees awarded to white students in Arizona dropped from 82 percent in 1994 to 56 percent in 2013 while the percentage of pharmacy degrees awarded to Asian Pacific American students increased from 8 percent in 1994 to 29 percent in 2013.
LAW DEGREES
Between 1994 and 2013, the number of law degrees awarded by Arizona institutions increased from 281 to 630. This reflects an increase of more than 100 percent in the number of law degrees awarded in

66 ARIZONA MINORITY STUDENT PROGRESS REPORT
Arizona Pharmacy Degrees 1994-2013 by race/ethnicity
source | U.S. Department of Education, National Center for Education Statistics (2014) Figure 114
0%
10%
20%
30%
40%
50%
60%
70%
80%
20132012201120102009200820072006200520042003200220012000199919981997199619951994
AI B AP H W M UK NR
Arizona Law Degrees 1994-2013 by race/ethnicity
source | U.S. Department of Education, National Center for Education Statistics (2014) Figure 115
0%
10%
20%
30%
40%
50%
60%
70%
80%
20132012201120102009200820072006200520042003200220012000199919981997199619951994
AI B AP H W M UK NR
Arizona Osteopathic Medicine Degrees 2000-2013 by race/ethnicity
source | U.S. Department of Education, National Center for Education Statistics (2014) Figure 113
0%
10%
20%
30%
40%
50%
60%
70%
80%
90%
20132012201120102009200820072006200520042003200220012000
AI B AP H W M UK NR
Arizona in this twenty year period. About 69 percent of law degrees were awarded to white students in 1994, decreasing to 65 percent in 2013 (Figure 115). The proportion of law degrees awarded to Hispanics in Arizona also decreased from 14 percent in 1994 to 9 percent in 2013. While decreases were also evident in the proportion of Asian Pacific Islanders (from 6% in 1994 to 5% in 2013) and Blacks (from 7% in 1994 to 5%
in 2013), the proportion of Native American students earning law degrees remained stable from 1994 to 2013 (3%).

CONCLUSION 67
Conclusion
Data on educational attainment show that students who graduate from post-secondary institutions with professional certifications and/or diplomas tend to be the most economically successful. It is also these graduates who contribute the most to Arizona’s economy. Minority students, now the majority of students in Arizona schools, are crucial to ongoing economic prosperity of our state because of the critical human capital that they provide. A highly qualified workforce is the best resource our state can offer for economic development.
In the 2013 report, we affirmed the warning from the Morrison Institute’s Dropped report from 2012 that “Arizona is at risk of becoming a second-tier state, educationally and economically.” Now, today, in 2016, Arizonans have an opportunity choice. We can resign ourselves to becoming that second-tier state or we can choose opportunity by collaborating with others to implement these recommendations in order to close the achievement gap.
REFERENCES
ACT. (2014). ACT Profile Report—State: Arizona Graduating Class of 2014. Iowa City, IA: ACT.
Arizona Department of Education. (2013) October 1st Enrollment [Data File] (2001-2013). Retrieved from http://www.azed.gov/data/published-public-data-sets/.
Arizona Department of Education. (2013). Dropout rates [Data File] (2002-2013). Retrieved from http://www.azed.gov/data/published-public-data-sets/.
Arizona Department of Education. (2013). Graduation rates [Data File] (2003-2012). Retrieved from http://www.azed.gov/data/published-public-data-sets/.
Arizona Department of Education. (2013). AIMS results [Data File] (2008-2013). Retrieved from http://www.azed.gov/data/published-public-data-sets/.
Arizona Department of Education. (2013). State Report Cards (2002-2013). Retrieved from http://www.azed.gov/research-evaluation/report-cards/.
Arizona State System for Information on Student Transfer (2015). June 2015 Arizona Statewide Transfer Rate. Retrieved from http://assist.aztransfer.com/resources/az_assist_transfer_rate_2015.pdf.
Baldasare, A. and Anderson, D. (2014). 2014 Arizona High School Eligibility Study (Arizona Board of Regents, Academic and Student Affairs Committee Meeting, September 16, 2015). Arizona Board of Regents.
College Board. (2001). 2001 College Bound Seniors: A Profile of SAT Test Takers. New York: College Board. Retrieved from http://research.collegeboard.org/programs/sat/data/archived/cb-seniors-2001.
College Board. (2002). 2002 College Bound Seniors: A Profile of SAT Test Takers. New York: College Board. Retrieved from http://research.collegeboard.org/programs/sat/data/archived/cb-seniors-2002.
College Board. (2003). 2003 College Bound Seniors: A Profile of SAT Test Takers. New York: College Board. Retrieved from http://research.collegeboard.org/programs/sat/data/archived/cb-seniors-2003.
College Board. (2004). 2004 College Bound Seniors: A Profile of SAT Test Takers. New York: College Board. Retrieved from http://research.collegeboard.org/programs/sat/data/archived/cb-seniors-2004.
College Board. (2005). 2005 College Bound Seniors: State Profile Report for 2005. New York: College Board. Retrieved from http://research.collegeboard.org/programs/sat/data/archived/cb-seniors-2005.
College Board. (2006). 2006 College Bound Seniors: State Profile Report for 2006. New York: College Board. Retrieved from http://research.collegeboard.org/programs/sat/data/archived/cb-seniors-2006.
College Board. (2007). 2007 College Bound Seniors: State Profile Report for 2007. New York: College Board. Retrieved from http://research.collegeboard.org/programs/sat/data/archived/cb-seniors-2007.
College Board. (2008). 2008 College Bound Seniors State Profile Report for 2008. New York: College Board. Retrieved from http://research.collegeboard.org/programs/sat/data/archived/cb-seniors-2008.
College Board. (2009). 2009 College Bound Seniors: State Profile Report for 2009. New York: College Board. Retrieved from http://research.collegeboard.org/programs/sat/data/archived/cb-seniors-2009.

68 ARIZONA MINORITY STUDENT PROGRESS REPORT
College Board. (2010). 2010 College Bound Seniors: State Profile Report for 2010. New York: College Board. Retrieved from http://research.collegeboard.org/programs/sat/data/archived/cb-seniors-2010.
College Board. (2011). 2011 College Bound Seniors: State Profile Report for 2011. New York: College Board. Retrieved from http://research.collegeboard.org/programs/sat/data/archived/cb-seniors-2011.
College Board. (2012). 2012 College Bound Seniors: A Profile of SAT Test Takers. New York: College Board. Retrieved from http://research.collegeboard.org/programs/sat/data/archived/cb-seniors-2012.
College Board. (2013). 2013 College Bound Seniors: A Profile of SAT Test Takers. New York: College Board. Retrieved from http://research.collegeboard.org/programs/sat/data/archived/cb-seniors-2013.
College Board. (2014). 2014 College Bound Seniors: A Profile of SAT Test Takers. New York: College Board. Retrieved from http://research.collegeboard.org/programs/sat/data/archived/cb-seniors-2014.
Milem, J.F, Bryan, W.P., Sesate, D.B., Montaño, S. (2013). Arizona Minority Student Progress Report 2013: Arizona in Transformation. Phoenix: Arizona Minority Education Policy Analysis Center. Retrieved from https://highered.az.gov/sites/default/files/AMEPAC%20MSPR%202013%20-%20Final.pdf.
U.S. Census Bureau (2014). DP05: ACS DEMOGRAPHIC AND HOUSING ESTIMATES [Data File]. 2009-2013 American Community Survey. Retrieved from http://factfinder.census.gov/faces/nav/jsf/pages/index.xhtml
U.S. Census Bureau (2014). DP03: SELECTED ECONOMIC CHARACTERISTICS [Data File]. 2009-2013 American Community Survey. Retrieved from http://factfinder.census.gov/faces/nav/jsf/pages/index.xhtml
U.S. Census Bureau (2010). S1701: POVERTY STATUS IN THE PAST 12 MONTHS [Data File]. 2009-2013 American Community Survey. Retrieved from http://factfinder.census.gov/faces/nav/jsf/pages/index.xhtml
U.S. Census Bureau (2014). S1501: EDUCATIONAL ATTAINMENT [Data File]. 2009-2013 American Community Survey. Retrieved from http://factfinder.census.gov/faces/nav/jsf/pages/index.xhtml
U.S. Department of Education, National Center for Education Statistics. (1991-2013). IPEDS Enrollment Survey [Data File]. Retrieved from https://nces.ed.gov/ipeds/datacenter/
U.S. Department of Education, National Center for Education Statistics. (1991-2013). IPEDS Completions Survey [Data File]. Retrieved from https://nces.ed.gov/ipeds/datacenter/
U.S. Department of Education, National Center for Education Statistics. (1991-2013). IPEDS Institutional Survey [Data File]. Retrieved from https://nces.ed.gov/ipeds/datacenter/
U.S. Department of Education, National Center for Education Statistics. (2010-2013). IPEDS Student Financial Aid [Data File]. Retrieved from https://nces.ed.gov/ipeds/datacenter/
REFERENCESCONTINUED
MORE DATA AVAILABLE AT WWW.HIGHERED.AZ.GOV 69
Please visit www.highered.az.gov/amepac for additional data and an electronic version of the
2016 Arizona Minority Student Progress Report
Full ReportAn electronic copy of the entire report
Executive Summary and Policy RecommendationsAn electronic copy of the Executive Summary and Policy Recommendations
County AddendumAn electonic copy of additional information and data for Arizona’s 14 counties
AppendicesTables for data used in the 115 figures and charts in the 2016 report
AmepacArizona Minority Education Policy Analysis Center
www.highered.az.gov/amepac

70 ARIZONA MINORITY STUDENT PROGRESS REPORT
2003 2013
hispanic
white
all minorities
see figures 9 and 10 for detailed charts
asian
american indian black
arizona p-12 enrollment
Arizona is in the midst of a demographic, economic and educational transformation.
Although our past has been illustrated with inequity and average achievement, our future is painted with quite a different brush. As Arizona solidifies itself as a majority minority state, we will be forced to focus our attention on how even the most underperforming students can enhance their educational outcomes for the greater benefit of all Arizonans.
This report illuminates the current status and trends of educational achievement in the State of Arizona from the beginning of the pipeline in elementary education through to graduate and professional school.
We encourage you to consider the 2013 Minority Student Progress Report before reading this sixth edition. We hope you will be able to use the rich data in these reports to develop your own conclusions and recommendations for addressing the issues we highlight.
Beyond this edition, there are additional data and resources available at the Arizona Minority Education Policy Analysis Center website: www.highered.az.gov/amepac