Arista Universal Spine - NLNOG · Kudu, Druid, Prometheus, etc Kafka, ActiveMQ, ZeroMQ, RabbitMQ...
36
Confidential. Copyright © Arista 2018. All rights reserved. Confidential. Copyright © Arista 2018. All rights reserved. Streaming Telemetry Really cool stuff or just another buzzword? NLNOG Camp – June 2, 2018 Joris Claassen <[email protected]>
Transcript of Arista Universal Spine - NLNOG · Kudu, Druid, Prometheus, etc Kafka, ActiveMQ, ZeroMQ, RabbitMQ...
Confidential. Copyright © Arista 2018. All rights reserved.Confidential. Copyright © Arista 2018. All rights reserved.
Streaming TelemetryReally cool stuff or just another buzzword?
NLNOG Camp – June 2, 2018
Joris Claassen <[email protected]>

Traditional / Legacy Approach Cloud Telemetry Requirements
1990’s networking Cloud DC Architectures
Polling Approach (5 min) Real-time streaming
State scope limited to MIB definition Complete state history
Per-Switch Per Device Network-wide scope
Static, discrete events. Manually correlated Dynamic event correlation
Today’s Telemetry Trends
The Cloud has driven new telemetry approaches….
Many IXP NOCs are driving in
the dark…
2

Telemetry Use-Cases
Instantaneous updates at
new levels of granularity
Recall historic network
state for off-network
analytics
Real-time data for
predictive security
approaches
Combining pieces of
information to an enriched
event for quick impact
spotting
What is possible with a modern approach?
Improved visibility is broadly applicable
Forensic
TroubleshootingSecurity Event Correlation
Real-time
Monitoring
3

Streaming Telemetry and Analytics
State Streaming Infrastructure Real-time streaming of events from devices w/ Open Standards
Analytics EngineState repository providing analytics and API’s
Telemetry VisualizationDevice, Event, Metric, Topology views
1
2
3
4

Every state change. From every device. Instantaneously.
Interface Counters
sFlow Data
Temperature Sensor
Routing Tables
MAC Tables ACL Counters
Buffer Utilization
System logs
CPU Load
Fan Speed
Power Draw
VXLAN Mappings
State Streaming
Every state change triggers
an update…
Table Utilization
Configurations
…and streamed to a
central state
repository
5
State
Repository
What is State Streaming?

Foundation for State Streaming
Open & Standards-based APIs.
1
Common Transport Protocol
(gRPC, NetConf, etc)
Data models defined by OpenConfig YANG models
OpenConfig
6

Analytics Engine2
Three Components to the Backend Infrastructure
Standard APIs accessed via
REST, Websocket, or gRPC
Query historical state and
subscribe to streaming
updates
Versions, aggregates, and
filters raw state into
actionable information:
• Track trends
• Correlate data
• Detect anomalies
High-throughput & Highly
available pub/sub engine
Built on proven, scalable
open source technology
State
RepositoryAnalytics
Engine
API
Server
7

Telemetry Visualization
• Telemetry Apps provide front-end for
visibility network state
• Correlation of network-wide data
• Views: Event, Device, Metric, and more
• Timeline view for better historic
troubleshooting
• APIs for customer & partner apps
Complete, real-time state streaming
3
8

Analytics Open Framework
State
Repository
Visual
Applications
State
Streaming
Business Apps
Analytics Engine
(Hbase, Analytics, APIs, etc.)
3
Point of Integration with
Open APIs
NOC Apps
Customer-accessible
Apps
9

Component
Build Your Own Telemetry System
Distributed
Key-value
Database
Queuing
System
Analytics
PipelineVisualization
OptionsHBase, Cassandra,
Kudu, Druid,
Prometheus, etc
Kafka, ActiveMQ,
ZeroMQ, RabbitMQ
Spark, Storm,
Heron, etcKibana, Grafana
Arista
TelemetryHBase Kafka
CloudVision
Turbines
CloudVision
Telemetry Viewers
(i.e. how a hyper-scale cloud operator might build a telemetry platform)
Telemetry based on cloud scale approaches
10

Confidential. Copyright © Arista 2018. All rights reserved.Confidential. Copyright © Arista 2018. All rights reserved.
So what to do with it?

Data Collection
12
• Data being provided ‘near real-time’ (within seconds) instead of pre-defined polling intervals
• Retrieve all available data from the switch (or just the ones you like)
- Device health (Temperature, fan, memory, CPU, power, etc.)
- Network health (Optical levels, interface counters, ACL violations, QoS drops, etc.)
• Reduce load on collectors and network devices
- No unnecessary information being repeatedly processed
• Keep historic values as detailed as you like
- Aggregation of values of time is up to yourcollector/database, but not a must

Data Collection
13

Monitoring / ACL counters
14
• Use Case
- IXPs maintain a list of allowed/forbidden protocols on their exchange and protect the
shared infrastructure with ACLs
• Reality
- Once the customer is out of quarantine, his connection will be ACL’d but increasing
counters are only being looked at when an issue occurs. This is also not something being
monitored by existing SNMP solutions.
• Approach
- Being proactively informed when a Production Customer is violating the ACLs and
automatically inform him about it

Monitoring / Microbursts
15
• Use Case
- Especially with increased traffic you are likely to see more microbursts during ‘release’ windows.
• Reality
- Interface counters (customer & backbone) are queried on a 1 to 5 minute average. Shorts bursts are flattened out and congestion of backbone interfaces might not be detected. This can cause severe impact to a large chunk of traffic.
• Approach
- The Telemetry agent on the network device can provide more granular interface statistics. This can be brought down to 5 seconds per metric and enables Operations to detect congestion quickly.

Monitoring / DDM/DOM monitoring
16
• Use Case
- Over time optics may degrade on the transmit/receive side (’optic becomes blind’) leading
to uncontrolled outages on either the backbone- or customer-facing side.
• Reality
- Not all vendors provide implementation of DDM-MIB on SNMP. Also due to the
aggregation of data with conventional tools the usefulness is not really given.
• Approach
- Telemetry can be combined with Anomaly Detection and/or Machine Learning
technologies to provide prediction mechanisms on when an issue could arise.

Monitoring / Proxy ARP detection
17
• Use Case
- Misconfiguration of a customer interface with Proxy ARP can lead to network-wide issues
and customers outages.
• Reality
- It can be relatively easy to spot the misbehaving party, but it’s hard to spot the issue in
arrears. This is the case when the ‘issue fixed itself’.
• Approach
- With the historic information provided by the Telemetry database it is easy to ‘go back in
time’ and pin down the rogue.

Monitoring / Proxy ARP detection
18

Event Correlation
19
• Use Case
- Event generation can lead to an ‘overflow of information’ and takes an operator quite a
while to actually find the root-cause and the customer impact.
• Reality
- An event comes in, several commands are executed on the CLI to check customer impact
and various other factors.
• Approach
- Providing event-specific information (MAC addresses, optical levels of the interface,
throughput, discards, etc.) around the device and network health with a timeline before
and after the event helps to easily spot all relevant details for further troubleshooting and
where to start.

Event Correlation
20

Event Correlation
21

Event Correlation
22

Confidential. Copyright © Arista 2018. All rights reserved.Confidential. Copyright © Arista 2018. All rights reserved.
How to build a (simple) Telemetry system?

Component
Back to the drawing board
Distributed
Key-value
Database
Queuing
System
Analytics
PipelineVisualization
OptionsHBase, Cassandra,
Kudu, Druid,
Prometheus
Kafka, ActiveMQ,
ZeroMQ, RabbitMQ
Spark, Storm,
Heron, etcKibana, Grafana
Basic
TelemetryPrometheus - skipped - - skipped - Grafana
24

25
• Prerequisites
- You NEED a device/firmware which supports streaming in whatever way
- Disk space and processing power on the collector
- An idea what metrics you want to collect (KPIs)
• Things to look out for
- Inform your self about the implementation on your device/vendor of choice!
≫ Some vendors ‘transform’ internal data from another format into streaming telemetry (CLI -> Streaming or
SNMP -> Streaming), others support it ‘out of the box’ from the switch state database.
≫ Data might be then just as ‘outdated’ as SNMP in those cases
- Licensing fees
- Load on the device (Telemetry can be CPU-hungry)
Providing the metrics

26
• Readable format to state repository
- Convert the metrics to a format your solution can
understand
• Push or Pull
- Whilst ‘push’ would be the desired method, some
monitoring solutions prefer ‘pull’ (like Prometheus)
• ’Source of Truth’ should be always the same
- One Agent should provide the switch metrics to
≫ A system who understands the metrics as they are
≫ A converter (exporter) to a different format
Providing the metrics

27
• Only provide necessary metrics
- Ability to define granular metrics you really need to not bloat your state repository
• Metrics will be provided via http://<switch>:8080/metrics
Converting the metrics to a Prometheus-readable format
subscriptions:
- /Sysdb/environment/archer/cooling/status
- /Sysdb/environment/archer/power/status
- /Sysdb/environment/archer/temperature/status
- /Smash/counters/ethIntf
- /Smash/interface/counter/lag/current/counter
- /Sysdb/hardware/archer/xcvr/status
metrics:
- name: intfCounter
path: /Smash/counters/ethIntf/FocalPointV2/current/(counter)/(?P<intf>.+)/statistics/(?P<direction>(?:in|out))(Octets|Errors|Discards)
help: Per-Interface Bytes/Errors/Discards Counters
- name: intfLagCounter
path: /Smash/interface/counter/lag/current/(counter)/(?P<intf>.+)/statistics/(?P<direction>(?:in|out))(Octets|Errors|Discards)
help: Per-PortChannel Bytes/Errors/Discards Counters
(...)

28
• This demo uses a ‘ready-to-go’ Prometheus/Grafana docker stack
• Only need to edit ‘prometheus/prometheus.yml’
Deploying Prometheus / Grafana
$ git clone https://github.com/vegasbrianc/prometheus.git
(...)
$ cd prometheus
$ vi prometheus/prometheus.yml
(...)
$ docker swarm init
(...)
$ HOSTNAME=$(hostname) docker stack deploy -c docker-compose.yml prom
(...)
$ docker stack ps prom | grep Run
ybxe20abekqd prom_cadvisor.bpo4ex9k1pgdlknkkxvwh6qv0 google/cadvisor:latest labvm Running Running 2 hours ago
q6x35kj8wuy9 prom_node-exporter.bpo4ex9k1pgdlknkkxvwh6qv0 prom/node-exporter:latest labvm Running Running 2 hours ago
hoag8nj3gncv prom_prometheus.1 prom/prometheus:v2.1.0 labvm Running Running 2 hours ago
lcxocx172v2i prom_alertmanager.1 prom/alertmanager:latest labvm Running Running 2 hours ago
sikfj95q1hmc prom_grafana.1 grafana/grafana:latest labvm Running Running 2 hours ago
$ docker ps
CONTAINER ID IMAGE COMMAND
CREATED STATUS PORTS NAMES
888d3bd183f2 prom/prometheus@sha256:7b987901dbc44d17a88e7bda42dbbbb743c161e3152662959acd9f35aeefb9a3 "/bin/prometheus -..." 2
hours ago Up 2 hours 9090/tcp prom_prometheus.1.hoag8nj3gncv3lohrfqmdtrhb
(...)

29
• Define the targets (switches) in ‘prometheus.yml’
• Define scraping intervals
• Prometheus will connect to the switch and retrieve all defined metrics
Retrieving the metrics
scrape_configs:
- job_name: 'arista’
scrape_interval: 5s
static_configs:
- targets: [‘leaf1:8080', ‘leaf2:8080']

30
Retrieving the metrics

31
Visualizing the metrics
• Grafana supports Prometheus natively as a
data source
• Besides Prometheus a lot of other Data
Sources are supported by Grafana as well

32
Visualizing the metrics
• Configure your dashboard(s)
with the available metrics
• Auto-completion for metrics
and functions is available
• If you have multiple vendors,
make sure that the counters
are named the same

33
Vendor solutions vs. Open Source
• Essentially it depends on the man power available
• Vendor solutions provide detailed and profound understanding of events for
their own devices and can correlate them ‘out of the box’
• Open Source solutions can support multiple vendors in the same UI, but
‘intelligence’ on metrics and correlation has to be built by the end user
34
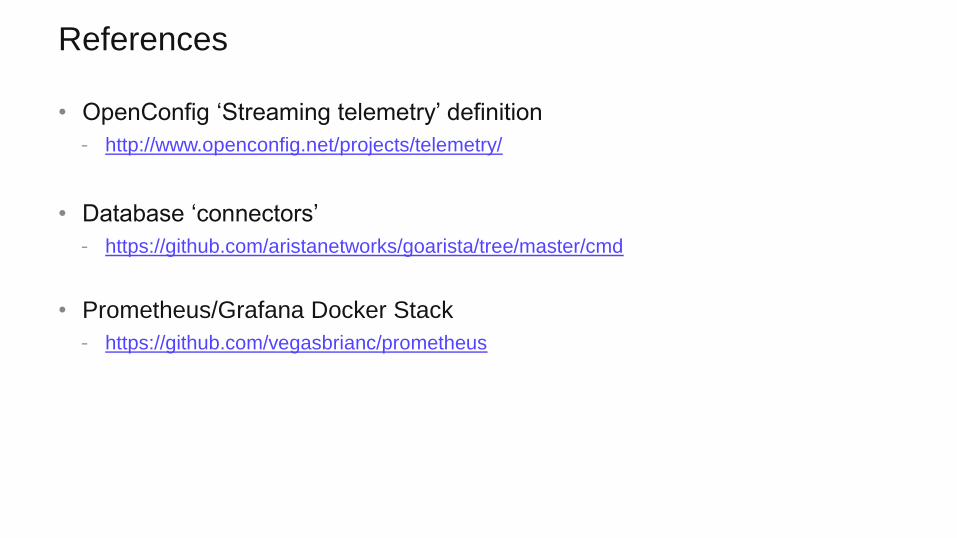
References
• OpenConfig ‘Streaming telemetry’ definition
- http://www.openconfig.net/projects/telemetry/
• Database ‘connectors’
- https://github.com/aristanetworks/goarista/tree/master/cmd
• Prometheus/Grafana Docker Stack
- https://github.com/vegasbrianc/prometheus

Questions?
35

Confidential. Copyright © Arista 2018. All rights reserved.Confidential. Copyright © Arista 2018. All rights reserved.
Thank You
Joris Claassen
Systems Engineer
(m) +31 6 48538869