Argus C5 and Hydrocarbon Resins
18
Copyright © 2018 Argus Media group Argus C5 and Hydrocarbon Resins Issue 18-1 Monday 22 January 2018 US IMPORT PRICES, LANDED, DUTY PAID HIGHLIGHTS C5 resin $/t 1Q 2Q 3Q 4Q 2016 1,543-2,646 1,433-2,646 1,433-2,425 1,323-2,315 2017 1,433-2,314 1,543-2,315 1,543-2,315 1,543-2,315 Monomers $/t Source Nov VWA Oct VWA ± UPR DCPD Canada na na na Isoprene Brazil 1,360.00 na na China 1,646.00 1,694.00 -48.00 Taiwan 1,862.00 1,519.00 +343.00 *na = no trade flows during the named month — USITC Monomers Besides upward pressure due to increased base price for crude oil, which bouyed most feedstock costs, there are a number of headwinds that may reduce C5 monomer production in 2018. Some facilities in China have not come back up in 2018 after not being able to comply with more stringent environmen- tal regulations in latter part of 2017. Compliance with these regulations is raising production costs in China and forcing integrated producers to make “sell, convert or buy to convert” decisions. Ethylene cracker scheduled maintenance shutdowns in Japan are reducing domestic availability of monomers, especially isoprene, forcing Japanese customers to buy more from the merchant market, increasing apparent demand. Demand for DCPD, especially in China, continues to be strong. All these headwinds result in prices for isoprene and DCPD to remain higher than what real demand versus installed capac- ity balance would indicate. C5 extractive distilation facilities in Taiwan and South Korea continue to run at high operating rates, filling any real and imaginary supply gaps. The supply situation should get better toward the end of 2018 as mainte- nance season in Japan comes to an end and new facilities in China are comissioned. Piperylenes The crude oil price baseline shift is forcing Asia-Pacific produc- ers to lift prices off the bottom. DCPD Prices are stable amid strong demand. Isoprene China’s export market has slowed as production tends to stay in the region and prices are flat. Butadiene BD prices have moved upward on buying to replenish stocks. Formerly Argus DeWitt C5 and Hydrocarbon Resins DCPD $/t Timing Price Bulk ex-works average Sep 915 Ex-Asia spot Oct 1200 Ex-Asia spot Nov 1100 Ex-Asia spot Dec 1100 Ex-Asia spot Jan 1100 Isoprene $/t Timing Price Bulk ex-works average Sep 1,381 Ex-Asia spot Oct 1,400 Ex-Asia spot Nov 1,400 Ex-Asia spot Dec 1,400 Ex-Asia spot Jan 1,400 Tackifying resins The market is evaluating and qualifying resins from recent HHCR expansions. In the meantime, increased crude prices and feedstock production decreases in China are pushing producer costs up. The balance game between price increase pressure, jockeying for market share and desire to fill out expansions as quickly as possible has commenced in earnest amid continued strong demand for HHCR. The feedstock supply situation may resolve itself later in the year in 2018 and into 2019 as more Licensed to: Ashley Organ, Argus Media Inc (New York)
Transcript of Argus C5 and Hydrocarbon Resins

Copyright © 2018 Argus Media group
Argus C5 and Hydrocarbon Resins
Issue 18-1 Monday 22 January 2018
US import priceS, landed, dUty paidHigHligHtS
c5 resin $/t1Q 2Q 3Q 4Q
2016 1,543-2,646 1,433-2,646 1,433-2,425 1,323-2,315
2017 1,433-2,314 1,543-2,315 1,543-2,315 1,543-2,315
monomers $/tSource nov VWa oct VWa ±
UPR DCPD Canada na na na
Isoprene Brazil 1,360.00 na na
China 1,646.00 1,694.00 -48.00
Taiwan 1,862.00 1,519.00 +343.00*na = no trade flows during the named month
— USITC
monomersBesides upward pressure due to increased base price for crude oil, which bouyed most feedstock costs, there are a number of headwinds that may reduce C5 monomer production in 2018. Some facilities in China have not come back up in 2018 after not being able to comply with more stringent environmen-tal regulations in latter part of 2017. Compliance with these regulations is raising production costs in China and forcing integrated producers to make “sell, convert or buy to convert” decisions. Ethylene cracker scheduled maintenance shutdowns in Japan are reducing domestic availability of monomers, especially isoprene, forcing Japanese customers to buy more from the merchant market, increasing apparent demand. Demand for DCPD, especially in China, continues to be strong. All these headwinds result in prices for isoprene and DCPD to remain higher than what real demand versus installed capac-ity balance would indicate. C5 extractive distilation facilities in Taiwan and South Korea continue to run at high operating rates, filling any real and imaginary supply gaps. The supply situation should get better toward the end of 2018 as mainte-nance season in Japan comes to an end and new facilities in China are comissioned.
piperylenesThe crude oil price baseline shift is forcing Asia-Pacific produc-ers to lift prices off the bottom.
dcpdPrices are stable amid strong demand.
isopreneChina’s export market has slowed as production tends to stay in the region and prices are flat.
ButadieneBD prices have moved upward on buying to replenish stocks.
Formerly Argus DeWitt C5 and Hydrocarbon Resins
dcpd $/ttiming price
Bulk ex-works average Sep 915
Ex-Asia spot Oct 1200
Ex-Asia spot Nov 1100
Ex-Asia spot Dec 1100
Ex-Asia spot Jan 1100
isoprene $/ttiming price
Bulk ex-works average Sep 1,381
Ex-Asia spot Oct 1,400
Ex-Asia spot Nov 1,400
Ex-Asia spot Dec 1,400
Ex-Asia spot Jan 1,400
tackifying resinsThe market is evaluating and qualifying resins from recent HHCR expansions. In the meantime, increased crude prices and feedstock production decreases in China are pushing producer costs up. The balance game between price increase pressure, jockeying for market share and desire to fill out expansions as quickly as possible has commenced in earnest amid continued strong demand for HHCR. The feedstock supply situation may resolve itself later in the year in 2018 and into 2019 as more
Licensed to: Ashley Organ, Argus Media Inc (New York)

Copyright © 2018 Argus Media group Page 2 of 18
Issue 18-1 Monday 22 January 2018 Argus C5 and Hydrocarbon Resins
HigHligHts
crude C5 extraction and processing capacity in China is slated to be added to the market.
HCR producers use various resin formers to produce tacki-fiers. Depending on the producer, they can utilize resin-grade DCPD, C9 aromatics or piperylenes. Tackifying resin producers drive 40pc of global DCPD demand. Using motor gasoline prices as an alternative disposition value for resin former feeds, this chart shows a comparable value for each resin former. Note these are not prices but an indication of the trend in monomer feed supply costs and price pressure that feed customers are experiencing. Depending on the region, formula-based resin pricing may move with motor gasoline or naphtha, while market prices will move based on supply/demand economics. Increasing crude oil prices are pushing resin former prices ever higher, up 10pc compared to last year since the beginning of 2018.
C5 tackifiersNothing much has changed as we start 2018. Other than upward price pressure from the feedstocks, there are no disruptions to supply, and prices are expected to remain stable as the market is adequately supplied against soft but steady demand.
C9 tackifiersDespite upward feedstock price pressure, C9 resin prices re-main flat amid stable demand and adequate supplies.
HHCR (waterwhite) tackifiersThe continued increase in feedstock prices is putting pressure
on HHCR producers. However, prices are not moving as new capacity has been realized and suppliers are jockeying for market share position while trying to fill out their new asset additions.
Natural rubberThe TSR20 on the SGX settled at $1,527/t on 18 January com-pared to $1,392/t on 20 November, higher by $135/t from the November report.
sisSIS producers continue to deal with higher priced isoprene and at least one producer has announced a price increase.
sBsImports resume their increase after September’s Hurricane Harvey impacts.
US exportsUS export volumes show an increase of 9pc year-to-date through November.
US importsUS imports through November show an increase of 30pc over the same period last year.
Key country exportsSouth Korean exports to China are higher than China’s to South Korea.
Gasoline effects on resin formers, world view ¢/lb
15
20
25
30
35
Jan 17 Mar 17 May 17 Jul 17 Sep 17 Nov 17 Jan 18
Europe: Piperylenes DCPD AROUS: Piperylenes DCPD AROAsia: Piperylenes DCPD ARO
Isoprene vs Naphtha $/t
0
500
1,000
1,500
2,000
2,500
May 16 Oct 16 Feb 17 Jul 17 Dec 17
Isoprene US import cif China SGX TSR20 fobNaphtha Japan c+f
Licensed to: Ashley Organ, Argus Media Inc (New York)
Issue Ref: 344306
.

Copyright © 2018 Argus Media group Page 3 of 18
Issue 18-1 Monday 22 January 2018 Argus C5 and Hydrocarbon Resins
MonoMers
overview resin former supply Increased crude oil prices are forcing up prices for most feedstocks including crude C5 and C9 ARO. There are several ethylene crackers in Japan that will be going down for sched-uled maintenance in 2018. This will limit domestic crude C5 availability and will force Japanese customers to look for mer-chant isoprene on the open market. Several facilities in China are facing continued shutdowns due their inability to comply with more stringent environmental regulations. The increased cost of compliance is also raising manufacturing costs in China, forcing integrated producers to make “sell, convert or buy” decisions. This dynamic is resulting in constrained supply of crude C5 streams, especially in the merchant market translat-ing into higher price pressure downstream. This will be a chal-lenging year, but there are a number of new entries who are looking to extract crude C5, which will bring more additional supply onto the market.
Piperylenes There is no change in the supply position of piperylenes as we head into 2018. Costs however are expected to increase along with stronger crude oil prices. Despite these rising costs, piperylene producers may find it difficult to pass through price increases as the C5 resin market remains weak with increased competition from additional HHCR capacity.
Dicyclopentadiene (DCPD)The majority of DCPD produced is converted into UPR for production of acrylic enclosures such as bathtubs, sinks and countertops, primarily used in new housing construction. Trends in housing starts and the general economy, therefore, are a great bellwether for what happens to UPR demand and subsequent price trends. December privately-owned housing starts moved lower from November by 8.2pc and lower than December 2016 by 6.0pc, according to the US Department of Housing and Urban Development and US Census Bureau joint release Building permits for December were 0.1pc lower than November. This decline in homebuilding is based on weather conditions throughout the US that have continued into Janu-ary. While there remains a strong demand for housing, builders continue to struggle with shortages in key resources.
The increase in the base price of crude oil, robust demand for DCPD in China for UPR production and decreased sup-ply in China due to the inability of some facilities to comply with more stringent environmental regulations tightened the market, and prices continue to stay up. This dynamic is now expected to last through first half of 2018.
The methodology behind our DCPD published price had been updated in order to better reflect changing dynamics in the market. The DCPD average ex-works price imported to US is the new chart that shows a single assessed DCPD price at
Forex Follies
The dollar is making a downturn versus currencies we moni-tor for this newsletter, while the euro is appreciating. This is great for the US exports into regions where prices are
nominated in local currency, but also pushes export busi-ness from Asia-Pacific, especially from Japan, preferentially toward Europe.
Key Us dollar exchange rate trends
-30%
-15%
0%
15%
30%
Jul 16 Oct 16 Jan 17 Apr 17 Jul 17 Oct 17 Jan 18
USD/EUR USD/KRW USD/JPY USD/CNY
Key euro exchange rate trends
-50%
-25%
0%
25%
Jul 16 Oct 16 Jan 17 Apr 17 Jul 17 Oct 17 Jan 18
EUR/USD EUR/KRW EUR/JPY EUR/CNY
Licensed to: Ashley Organ, Argus Media Inc (New York)
Copyright © 2018 Argus Media group Page 4 of 18
Issue 18-1 Monday 22 January 2018 Argus C5 and Hydrocarbon Resins
MonoMers
Us isoprene import price comparison $/t
800
1,000
1,200
1,400
1,600
1,800
2,000
2,200
2,400
Apr 16 Jul 16 Oct 16 Jan 17 Apr 17 Jul 17 Oct 17
China S. America Taiwan
Us YTD isoprene imports
0
2,000
4,000
6,000
8,000
10,000
12,000
Jan Feb Mar Apr May Jun Jul Aug Sep Oct Nov Dec
2016 2017
the time of loading based on trade data and is a calculated amalgam of imported resin and UPR DCPD grades. Argus has also added a forecast assessment based on market intelli-gence to bring our price assessment to the current publication month.
We continue to monitor imports of UPR-quality DCPD (85pc purity) from Canada to the US, and prices remain in the 46-56c/lb range, competitive with the newly-assessed ex-works Asia-Pacific DCPD price. Based on the available trade data, September delivered bulk ex-works prices eased to $848/t, in line with our previous projections. We expect DCPD prices to stay flat at the current level before starting to gradually decrease in mid-2018.
Isoprene (IPM) US imports for November spiked upward to 8,500t, reaching a high single-month level similar to that seen in May. Imports from Brazil, China and South Korea were each reported to be 30pc of the total with the balance from Taiwan. Imports through November have already reached almost 67,000t, higher than imports for all of 2016 or 2015. Preliminary esti-
mates of isoprene imports to the US in December are 5,000t. This will provide a final volume approximately over 10pc from 2016. This surge in import deliveries is the aftermath of Hur-ricane Harvey as products ordered earlier arrived to replenish customer inventories. With most domestic US producers having
Isoprene bulk ex-works price imported to Us $/t
900
1,100
1,300
1,500
1,700
Jun 16 Sep 16 Dec 16 Mar 17 Jun 17 Sep 17 Dec 17
Average delivered price into Us, 80-87% DCPD $/t
450
650
850
1,050
1,250
1,450
Jan 16 Apr 16 Jul 16 Oct 16 Jan 17 Apr 17 Jul 17
DCPD average ex-works price imported to Us $/t
450
650
850
1,050
1,250
1,450
Jun 16 Sep 16 Dec 16 Mar 17 Jun 17 Sep 17 Dec 17
Licensed to: Ashley Organ, Argus Media Inc (New York)
Copyright © 2018 Argus Media group Page 5 of 18
Issue 18-1 Monday 22 January 2018 Argus C5 and Hydrocarbon Resins
MonoMers
returned to normal production levels, we do not believe this spike in import activity is indicative of the surge in demand.
Even with demand stable and higher cost pressure, Decem-ber ex-works prices in China eased to 9,546 RMB/t ($1,447/t), 173 RMB/t ($26/t) down from October. A reduction of isoprene supply in China due to facilities struggling with compliance with government environmental regulations, and coupled with shift of the crude oil baseline price upward, moved China prices slightly upward in January, currently 9,733 RMB/t ($1,475/t), ex-works China. Isoprene producers in China appar-ently would rather sell isoprene on the merchant market and import isoprene for their own production, lowering inventories for domestic producers and inflating market isoprene prices as well as apparent demand. Exacerbating this situation is an ac-tive cracker maintenance season in Japan. Japanese isoprene customers faced with reduced domestic supply of the mono-mer are forced to be a much more active participant in the merchant market, further driving up demand and prices for merchant IPM. This situation is expected to last through 2018, indicating demand for merchant isoprene will remain fairly high. Operating rates in Taiwan and South Korea are therefore expected to be high as well, and prices will not moderate as much as was expected based on flat demand for downstream products.
Natural rubber (NR) prices for December averaged $1,453/t, with January prices averaging of $1,455/t. The TSR20 on the SGX settled at $1,527/t on 18 January compared to $1,392/t on 20 November, higher by $135/t from the Novem-ber report. Flat NR price suggests low demand for polyiso-prene and subsequently isoprene. This dynamic is therefore not expected to dramatically change the demand side of the equation to further disrupt current precarious supply/demand balance.
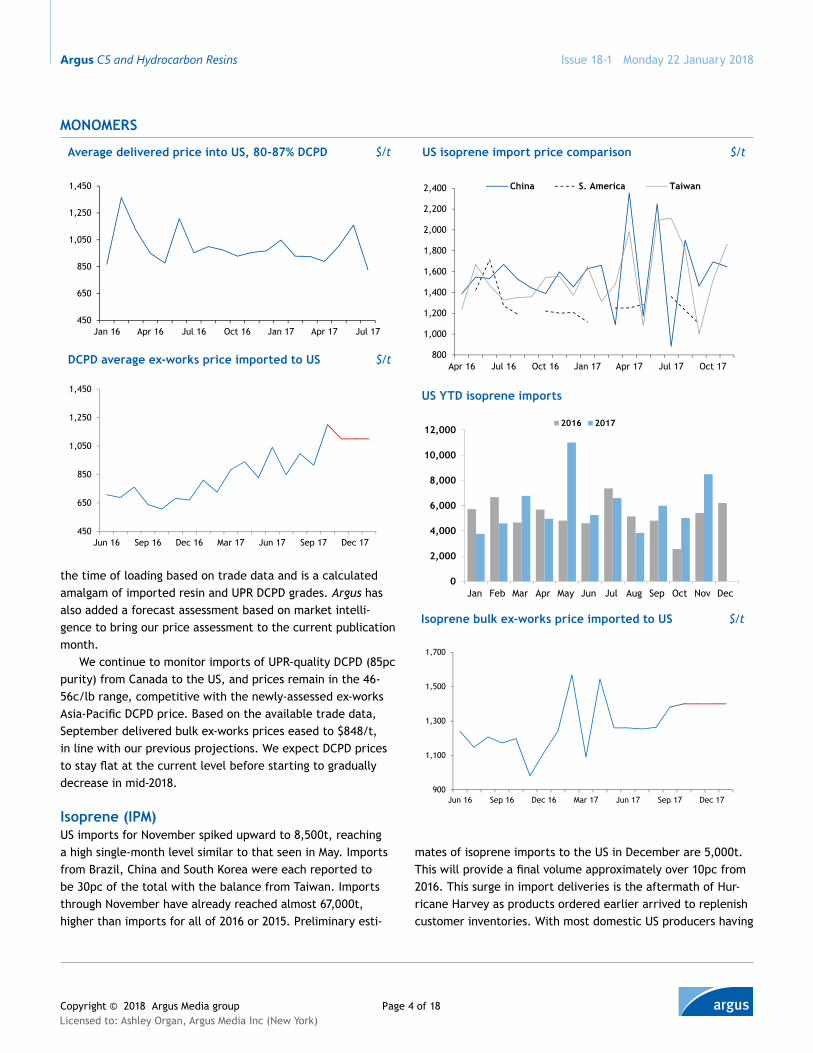
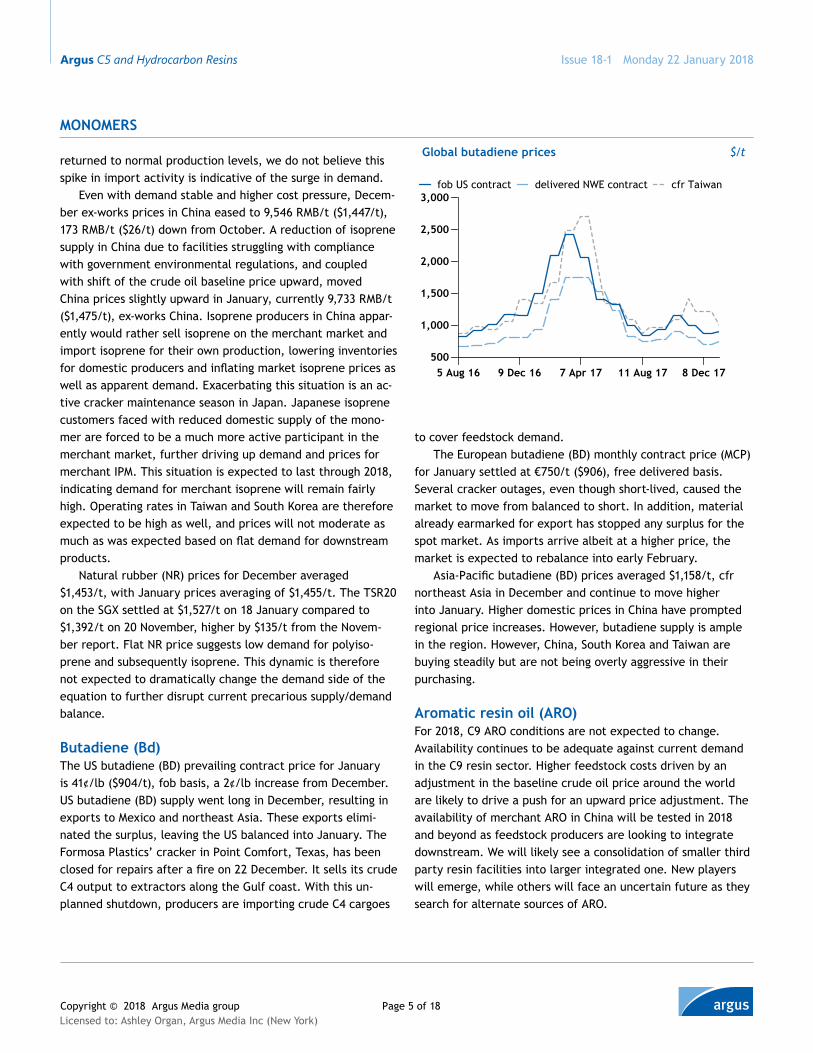
Butadiene (Bd)The US butadiene (BD) prevailing contract price for January is 41¢/lb ($904/t), fob basis, a 2¢/lb increase from December. US butadiene (BD) supply went long in December, resulting in exports to Mexico and northeast Asia. These exports elimi-nated the surplus, leaving the US balanced into January. The Formosa Plastics’ cracker in Point Comfort, Texas, has been closed for repairs after a fire on 22 December. It sells its crude C4 output to extractors along the Gulf coast. With this un-planned shutdown, producers are importing crude C4 cargoes
to cover feedstock demand.The European butadiene (BD) monthly contract price (MCP)
for January settled at €750/t ($906), free delivered basis. Several cracker outages, even though short-lived, caused the market to move from balanced to short. In addition, material already earmarked for export has stopped any surplus for the spot market. As imports arrive albeit at a higher price, the market is expected to rebalance into early February.
Asia-Pacific butadiene (BD) prices averaged $1,158/t, cfr northeast Asia in December and continue to move higher into January. Higher domestic prices in China have prompted regional price increases. However, butadiene supply is ample in the region. However, China, South Korea and Taiwan are buying steadily but are not being overly aggressive in their purchasing.
Aromatic resin oil (Aro) For 2018, C9 ARO conditions are not expected to change. Availability continues to be adequate against current demand in the C9 resin sector. Higher feedstock costs driven by an adjustment in the baseline crude oil price around the world are likely to drive a push for an upward price adjustment. The availability of merchant ARO in China will be tested in 2018 and beyond as feedstock producers are looking to integrate downstream. We will likely see a consolidation of smaller third party resin facilities into larger integrated one. New players will emerge, while others will face an uncertain future as they search for alternate sources of ARO.
Global butadiene prices $/t
500
1,000
1,500
2,000
2,500
3,000
5 Aug 16 9 Dec 16 7 Apr 17 11 Aug 17 8 Dec 17
fob US contract delivered NWE contract cfr Taiwan
Licensed to: Ashley Organ, Argus Media Inc (New York)

Copyright © 2018 Argus Media group Page 6 of 18
Issue 18-1 Monday 22 January 2018 Argus C5 and Hydrocarbon Resins
North American ethylene cash costs ¢/lb
109
1012 12 12
10 11129
13
23
2830
29
26
1412
14
2326
24 24
1921
16
2423
25
30 30 29
0
10
20
30
40
2016 avg Q1 2017 Q2 2017 Q3 2017 Oct 17 Nov 17 Dec 17 Jan 18
Ethane Propane Butane Lt Naphtha
Ethylene productionThe ethylene contract net transaction price settled at 32.5c/lb for December, consistently lowering since October, easing by 2.25c/lb. Spot prices for January are currently 27.5-28.75c/lb. Formosa Plastics’ 1.7bn lb/yr Olefins 1 cracker in Point Comfort, Texas, is expect to restart in the first half of Febru-ary. This was an unplanned shutdown caused by a fire on 22 December. Spot prices have moved upward with this news but quickly eased as downstream consumption has not fully returned. The US Energy Information Agency (EIA) continues to report record high ethane inventories for the last year, allow-ing cash costs to ease from the third quarter through the end of 2017.
Based on Argus data, ethylene cash cost levels provide a view of the support that cash costs have provided ethylene spot prices. Ethane cracking is heavily advantaged with cash costs ranging from 10-12c/lb from October through the first half of January. Heavier feedstocks struggle to compete on margin, which can be seen from prices in co-products. With propylene production curtailed due to on-going production problems at Gulf coast PDH units, producers with flexible units may see an advantage to cracking heavier feeds.
The latest settled contract ethylene prices for North Amer-ica, Europe and Asia-Pacific are 32.5c/lb (December), 57.65c/lb (January), and 49.06c/lb (November), respectively. North America remains the most cost-effective ethylene producing region in the world, and Europe the least.
The European ethylene market is tight to start 2018 as producers lowered inventories during December. In addition, an attractive export market further depleted inventories as contract prices in November lowered to €1,025/t ($1,192/t). Contract prices for January remained stable to December at
MoNoMErs
€1,057/t ($1,271/t). Derivative demand is strong as consumers also decreased inventories at the end of 2017. The increases seen in North Sea crude prices moved into increases in naph-tha prices causing a reduction in the spread between naphtha and propane, pressuring cracker margins.
In northeast Asia, prices moved upward from the last report, currently ranging $1,400-1,435/t (63.5-65.1c/lb), cfr northeast Asia for January. Spot demand has been robust, requiring additional cargoes to cover demand in China for January and into February. The demand is typical of that seen ahead of the Lunar New Year holiday. Naphtha prices continued upward through the end of the year with January currently averaging over the $600/t cfr Japan level, tightening margins for ethylene producers. Export availability from Japan and South Korea has been reduced by 20-30pc in line with the heavy turnaround schedule. Saudi Arabia’s PetroRabigh will start up its downstream 160,000t/yr polyethylene unit, limiting the amount of ethylene available for export to Asia-Pacific in the coming months.
TAckifyiNg rEsiNs
C5 tackifiers (C5T) The increase in baseline price of crude oil is pushing up all commodities, especially in Asia-Pacific and Europe, which rely on heavy crackers. Prices of crude C5 streams are increasing and C5 resin suppliers are looking to recover some of those costs. Along with a price increase on its SIS, Zeon announced a price $220/t increase on the QuintoneTM C5 resins. Even though current upstream feedstock cost escalation provides fundamentals for a C5 price increase, downstream conditions
are not so favorable, especially in the adhesive market seg-ment. Increased supply of HHCR and continued push to convert packaging adhesive applications to PO technology, especially in North America and in Europe, are making C5 resin produc-ers reticent to increase prices and chance losing market share. The balance to the demand equation is provided by continued decline in gum rosin production in China where the gap in demand, especially in road marking applications is increasingly filled by hydrocarbon resins, including C5. We expect to see
Licensed to: Ashley Organ, Argus Media Inc (New York)

Copyright © 2018 Argus Media group Page 7 of 18
Issue 18-1 Monday 22 January 2018 Argus C5 and Hydrocarbon Resins
Gum rosin price trends fob China $/t
1,600
1,700
1,800
1,900
2,000
2,100
Aug 16 Nov 16 Feb 17 May 17 Sep 17 Dec 17
Gum rosin price trends - fob China
of smaller C9 resin producers to a few integrated large ones. This transition should bring with itself an upgrade in the C9 resin product slate and a more disciplined approach to market dynamics.
Rosin The Chinese gum rosin (CGR) November and December prices averaged $2,005/t and $2,033/t, respectively. Over the two-month period from October, prices increased more than 10pc. January prices are continuing this trend, currently averaging $2,065/t. The December market remained relatively stable re-gardless of fluctuations in specific grades. January is expected to be quiet with producers expecting a pick up in the market after the Lunar New Year holiday. Initial reports suggest yet another 10pc decline in the output of gum rosin in China. Since the demand for gum rosin in China is not diminishing along with supply, the difference is made up with increasing imports of gum rosin from neighboring countries, South America, TOR from the US and continued conversion of applications to hydro-carbon resins.
more exports of C5 resins from the US to China and a contin-ued competitive market, especially in the adhesive segment.
Zeon is also making a splash pushing the C5 resin technol-ogy barrier. The company has recently introduced a low VOC aromatically modified 95℃ softening point C5 resin. Not only is it low VOC, it is also lighter in color, tipping scales at 0.7 Gard-ner (solution). Zeon uses an odor panel intensity scale, and new Quintone® DX590DP scores less than half of its typical C5/C9 resins and is close to hydrogenated analogs. The reduction in VOC is even more dramatic. Zeon’s typical offerings already have some of the lowest VOC content in the industry, but the new resin once again cuts it in half. According to testing done by Zeon, VOC content of DX590DP is considerably lower, never mind C5 resins, but competitive hydrogenated resin analogs of as well. And Zeon backs up its claims by GC scans of head-space analysis of its resin compared to competitive offerings.
HHCR (waterwhite) tackifiersNew HHCR production from ExxonMobil, Jinhai and Zeon are in the market pending evaluations and qualifications. Despite an increase in costs to produce, especially from the feedstock standpoint, there is no official talk about any price increases as suppliers are jockeying for market share and are looking to sell out their facilities as quickly as possible. There is also a continual stream of news from China about additions to the HHCR supply there, as current C9 resin producers are look-ing to upgrade their gradeslate, and integrated producers are looking to fully exploit molecules they produce. However, based on current demand, we expect the jockeying to be fairly short-lived and demand to continue to chew up available supply. The biggest wild card that will determine which way the supply/balance equation will tilt, even in light of all the capacity additions, is how successful new manufacturers in China will be in replicating HHCR grades currently in demand.
C9 aromatic tackifiersProducers of C9 resins around the world are starting to feel pressure from rising feedstock costs in the wake of upward adjustment of the crude oil price baseline. However, these increased feed costs have not yet translated into an increase in C9 resin prices, especially from Asia-Pacific. We are still expecting C9 resin volumes available for export to decline as substitution for gum rosin in road marking applications in China and conversion to hydrogenated resins has to be felt. We are also expecting the transition of supply base from a number
TaCkifyinG Resins
natural terpene-derived resins The US Department of Agriculture (USDA) 2017/2018 Florida orange crop forecast is stable to December, down from the previous report. If realized, total US production will be down 22pc from the 2016/2017 season. Florida’s all-orange produc-tion in the 2016/2017 season was 68.75mn boxes and the forecast is for a production of 46mn boxes. As Florida provided over half the production for the previous season, the current forecast has projected California production equaling that of
Licensed to: Ashley Organ, Argus Media Inc (New York)

Copyright © 2018 Argus Media group Page 8 of 18
Issue 18-1 Monday 22 January 2018 Argus C5 and Hydrocarbon Resins
Polymers
Natural rubber (Nr) Natural rubber (NR) prices have been hovering around 150c/kg mark for the last 10 months. The longest flat stretch for the last couple of years. Price dipped from October to average $1,419/t in November but returned to $1,453/t in December. For 2017, the average price from the TSR20 was $1,652/t, higher than 2016 by 20pc as rains in Thailand hampered natural rubber production early in the year, causing prices to increase to an average high in February 2017 of $2,200/t. The low for the year was seen in November 2017. The TSR20 on the SGX settled at $1,527/t on 18 January compared to $1,392/t on 20 November, higher by $135/t from the November report.
The International Tripartite Rubber Council (IRTC) an-nounced an agreement to control exports through the first quarter of this year. Withholding 350,000t of exports, the IRTC expects rubber prices to recover in an effort to make rubber plantations profitable. Thailand, the world’s biggest producer and exporter, is expected to remove 230,000t from the export market. Indonesia will remove 90,000t and Malaysia 30,000t from the export market. These volumes are expected to be shifted from export to domestic consumption through govern-ment projects. Based on data from the IRTC, world natural rubber demand is forecast to increase by 2.3pc to 12.4mn t in 2018 with a projected supply increase of 3pc to 12.5mn t.
As the IRTC works to increase prices, the largest consumer of natural rubber, China, is beginning to invest in dandelion rubber. China currently imports more than 80pc of its natural rubber demand. Linglong Group Co. Ltd. is investing $450mn to set up a new company to develop a commercially viable rubber derived from dandelion latex. Other companies have
been investing in dandelion rubber, including Continental, which received the GreenTec Award for its project to manufac-ture snow tire treads entirely from dandelion rubber.
Polyisoprene (Ir) The trend in US IR import volumes remained lower in the 2,600-2,900t from the 3,000-4,000t range seen during the summer months. Russia continues to maintain a market share of 80pc or better but volumes have lowered during October and November. For November, US import IR prices ranged from $1,600 to $2,400/t from Russia, remaining stable in the range seen back in September. Material from Japan comprises the higher end of the market with prices ranging from $2,500-$5,500/t. The price differential between Russia and Japan is due to the specialty applications for Japanese rubber, while
Natural rubber vs WTI
1,250
1,500
1,750
2,000
2,250
$/t
Jul 16 Oct 16 Jan 17 Apr 17 Jul 17 Oct 17 Jan 18
40
45
50
55
60
65
$/Bbl
TSR20 WTI
Florida. This will be the first time Florida did not produce over half the total US production of oranges and the total orange production below 100mn boxes. While we continue to focus on citrus-derived d-limonene as a most visible and tangible feed-stock availability and price driver for terpene resins, we would like to note that fortunes of alternative terpene technologies based on α-pinene, β-pinene and dipentene are tied closer to fractionation of tall oil.
The continuing decline of the d-limonene supply is one of the main reasons why Chinese gum turpentine is experienc-ing demand growth and higher prices. China turpentine prices
in November and December averaged $3,648 and $3,797/t, respectively. Since October, average prices have increased by $880/t, a 30pc increase. January price continue this forward momentum with prices currently averaging $3,868 for the first half of the month. While demand and production of turpentine in China continues to grow, it is far from being the driving force behind tree tapping. As such, the year when gum rosin becomes a by-product of turpentine production is still not on the horizon. Please note, turpentine prices indicate the rela-tive direction of terpene and derivative prices, not an abso-lute price of the feedstock.
TackIfyINg resINs
Licensed to: Ashley Organ, Argus Media Inc (New York)

Copyright © 2018 Argus Media group Page 9 of 18
Issue 18-1 Monday 22 January 2018 Argus C5 and Hydrocarbon Resins
Polymers
the majority of the rubber produced in Russia is commodity grade used primarily in tires. In comparison, the average NR price (TSR20) for November 2017 was $1,418/t. Prices for IR are expected to move sideways as the NR prices average is $1,453/t in December.
sIs Increasing crude oil prices, a decrease of isoprene produc-tion in China due to some facilities’ struggles to comply with environmental regulations and a decrease in supply of feeds in Japan due to scheduled maintenance turnarounds at domes-tic ethylene crackers have resulted in a snug isoprene supply situation in Asia-Pacific. While isoprene extraction facilities in Taiwan and South Korea have capacity to supply current de-mand, the pressure to increase prices is real. Zeon, which was instrumental in changing the SIS pricing dynamic to bring more stability to the market, has announced a price increase for 1 February to mitigate escalation of its raw material cost basis. Its QuintacTM SIS selling price will increase by $220/t (10c/lb). Any attempts to increase prices earlier by other suppliers will now be bolstered by this action. Faced with price pressure on isoprene in China due to increasing feed prices and costs of environmental compliance, we expect Chinese SIS suppli-ers to follow up with price increases of their own as well. The mitigating factor in ability to pass through this price increase is continues slack demand for SIS and an ever-present thread of PO substitution in the adhesive market segment.
sBsOverall, 2017 US SBS imports through November equal over 140,000t, an increase of 15pc from 2016. From key countries, this increase is 16pc where imports by Dynasol and Kraton increased by 12pc but imports from Asia-Pacific increased by 23pc. The amount of market share being imported from Asia-Pacific has increased to 39pc, indicating prices are more favorable for imports from that region.
China SBS operating rates increased to 68pc from the last report of 64.9pc in October. Prices increased throughout December, following increases in styrene prices. The end of 2017 saw low SBS inventory levels, allowing supply/demand fundamentals to determine prices into January. This has been realized as prices continued to rise into the second week of January. Styrene prices have recently eased from five-month highs, allowing for prices to ease even as buyers remain cau-
tious, only purchasing required inventory going into the Lunar New Year holiday.
sBr US styrene-butadiene rubber (SBR) January prices are assessed at 85.5¢/lb ($1,885/t), stable to November prices. SBR demand is expected to increase as the tire industry adds capacity throughout the Americas. The growth in both feedstock buta-diene and downstream tire demand provides a strong growth atmosphere for SBR into 2018.
European SBR prices for January are €1,510/t ($1,817/t). Prices have been following not only butadiene prices but also reflect the change in styrene prices. While one moves up, the other is moving downward, providing a stable price base for producers and consumers. SBR prices have opened the possibil-
Us sBs imports t
36,262 38,447
3,401
39,785
39,739 44,172
2,960
50,152
0
11,000
22,000
33,000
44,000
55,000
Spain, Mexico Brazil,Germany,
France
Japan Taiwan,Korea, China
Jan-Nov 2016 Jan-Nov 2017
sBs raw material cost trends ¢/lb
25
45
65
85
105
125
Aug 16 Nov 16 Feb 17 May 17 Aug 17 Nov 17
US Europe Asia
Formula: 70% Bd + 30% Sm
Licensed to: Ashley Organ, Argus Media Inc (New York)

Copyright © 2018 Argus Media group Page 10 of 18
Issue 18-1 Monday 22 January 2018 Argus C5 and Hydrocarbon Resins
Polymers
Us lDPe raw material cost/price trends ¢/lb
7277 77
74 72 7277
80 8077 77 77 79 81
85 85 85 85
3336 36
30 32 34 3630 32 33
31 29 3135 35 33 33 33
20
40
60
80
100
Aug 16 Nov 16 Feb 17 May 17 Aug 17 Nov 17
LDPE Ethylene
ity of exports from Asia-Pacific, and as China begins to prepare for its holiday season, consumers may find some attractive prices for import.
In Asia-Pacific, China’s SBR domestic market has become inactive after consumers restocked enough feedstock for their demand going into the Lunar New Year holiday. Prices since the start of November have been steadily moving upward on feedstock butadiene prices. Spot SBR prices in January range from $1,500-1,700/t crf China.
Unsaturated polyester resins (UPr) The majority of DCPD produced is converted into UPR for production of acrylic enclosures such as bathtubs, sinks and countertops, primarily used in new housing construction. Trends in housing starts and the general economy, therefore, are a great bellwether for what happens to UPR demand and subsequent price trends. December privately-owned housing starts moved lower from November by 8.2pc and lower than December 2016 by 6.0pc, according to the US Department of Housing and Urban Development and US Census Bureau joint release building permits for December were 0.1pc lower than November. This decline in homebuilding is based on weather conditions throughout the US, which have continued into Janu-ary. While there remains a strong demand for housing, builders continue to struggle with shortages in key resources. De-mand in China for DCPD in UPR continues at a robust pace, as baseline demand adjusted upward when reformulations to use more DCPD instead of styrene were utilized a year ago during styrene availability and price run-up crisis.
lDPe North American LDPE prices ended December in a conten-tious manner, finally settling at an assessed price of 79-81c/lb delivered ($1,742-1,786/t). This price is lower than the October price by 4.5c/lb ($99/t), reported in the last issue. Produc-ers indicated prices to be flat through December, but buy-ers reported a 3-6c/lb shift downward, effectively resetting contracts into 2018. This provided the downward assessment for contract pricing after remaining flat through November. At least four producers have announced a 4c/lb effective 1 February even as supply is expected to lengthen in the US. De-cember LDPE production is lower as outages continue to limit production with inventories rising only 12mn lb, based on data from the American Chemistry Council’s (ACC) Plastics Industry Producers Statistics Group as compiled by Vault Consulting.
European LDPE prices for December are assessed at €1,465-1,490/t ($1,727-1,756/t), a decrease of €30-40/t from October, bringing prices back to September levels. LDPE producers are targeting price increases in January to counteract the margins lost at the end of 2017. The price increases are supported by robust orders so far in January and the increase in crude prices.
In the Asia-Pacific market, November spot prices slowly lowered and continued this trend in December where prices ranged from $1,180-1,225/t. Prices at the start of the month were at the high end of the range with the low seen at the end of the month. Spot prices moved upward into January, rang-ing from $1,185-1,210/t on balanced to tight supply. In China, downstream demand remains steady in January as converters are in the process of restocking but this is expected to ease later this month with the Lunar New Year celebration on 16 February. Several units have restarted from scheduled mainte-nance but many have not returned to full operating rates and are not expected to do so until after the holiday.
Polypropylene (PP) US PP homopolymer prices for December were assessed at 65-68c/lb ($1,433-1,499/t). US PP pricing for January has not settled but is expected to increase significantly, tracking an increase in propylene prices, rising on production issues along the US Gulf coast. The unplanned production issues caused a 12c/lb increase in propylene prices over December contract. The PP January contract is expected to increase over 10c/lb following the feedstock increase. PP production is expected to decline on this price increase and the start of the turnaround season tightening the market.
Licensed to: Ashley Organ, Argus Media Inc (New York)
Copyright © 2018 Argus Media group Page 11 of 18
Issue 18-1 Monday 22 January 2018 Argus C5 and Hydrocarbon Resins
Polymers
energy markets
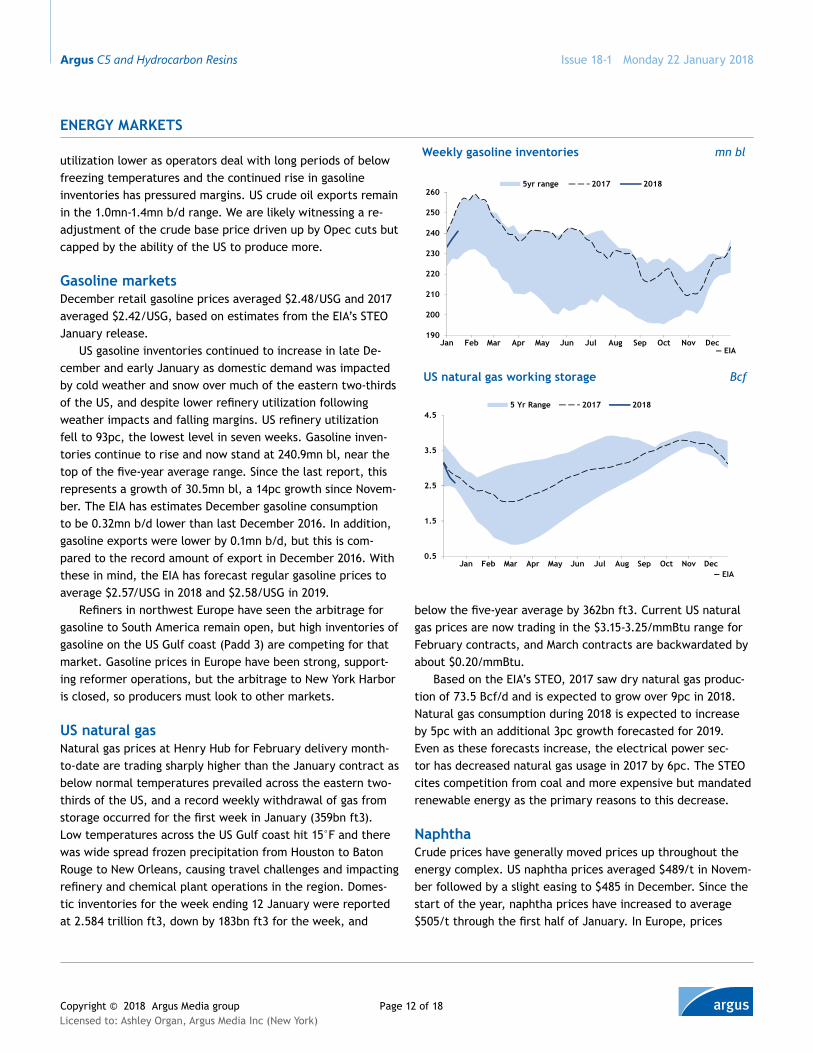
Crude oilThe oil markets moved sharply higher in late December and early January as unrest in Iran, reports of continuing sharp declines in Venezuelan crude production, and nine consecu-tive weekly declines in US crude inventories brought the bull market traders out. Brent/NSD hit $70/bl in early January, but did not close above that important level and has pulled back to the $68-69/bl range. WTI crude approached the $65/bl level but has since pulled back. The renewed threat of attacks on Nigerian oil infrastructure by a local militant group has had little impact on market sentiment. The next few months are
historically some of the lowest demand months for oil during a calendar year as winter begins to wane and summer driv-ing season is more than four months away. The Paris-based International Energy Agency (IEA) released its January re-port and has forecast that the US will exceed 10mn b/d of oil production in 2018, competing with Russia for the title of world’s largest oil producer. Oil demand growth for 2018 is still projected to be between 1.3mn-1.6mn b/d. Reported US oil production dipped by nearly 300,000 b/d in early January, but recovered the following week to just below 9.8mn b/d. Unusually cold weather in the eastern US has pushed refinery
World crude prices, historical and forecast $/t
35
45
55
65
75
Jan 17 Jun 17 Nov 17 Apr 18 Sep 18 Feb 19 Jul 19 Dec 19WTI Brent Dubai
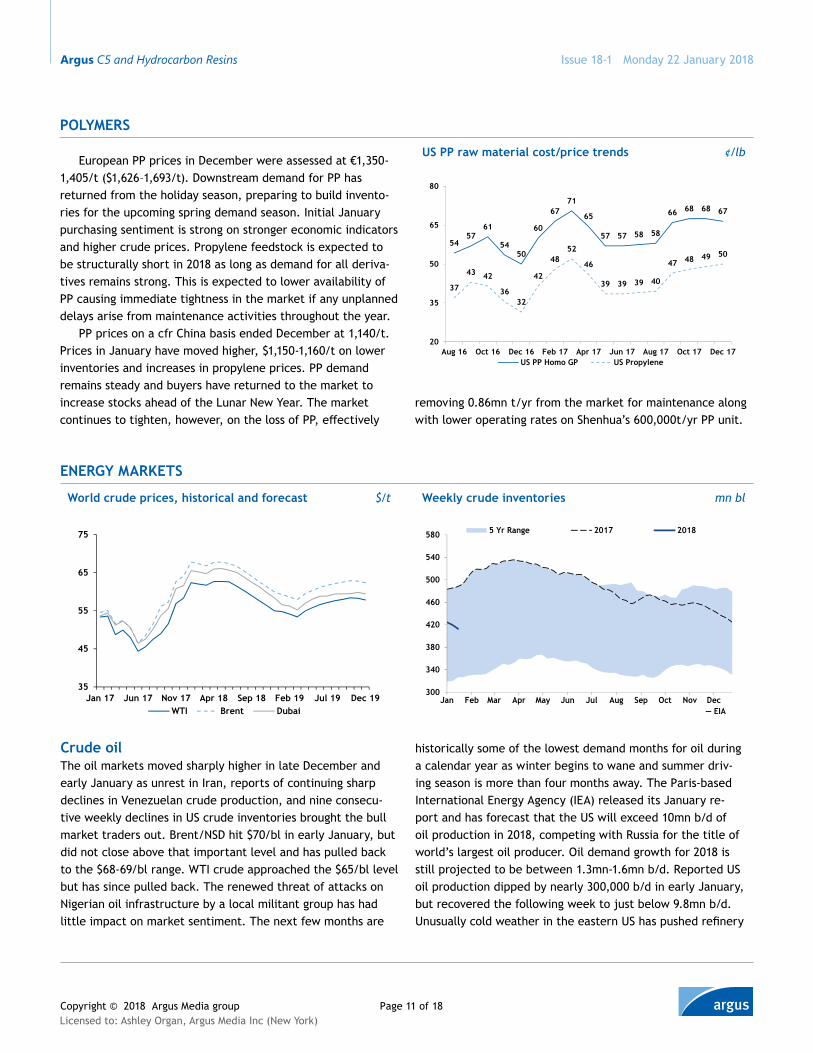
European PP prices in December were assessed at €1,350-1,405/t ($1,626–1,693/t). Downstream demand for PP has returned from the holiday season, preparing to build invento-ries for the upcoming spring demand season. Initial January purchasing sentiment is strong on stronger economic indicators and higher crude prices. Propylene feedstock is expected to be structurally short in 2018 as long as demand for all deriva-tives remains strong. This is expected to lower availability of PP causing immediate tightness in the market if any unplanned delays arise from maintenance activities throughout the year.
PP prices on a cfr China basis ended December at 1,140/t. Prices in January have moved higher, $1,150-1,160/t on lower inventories and increases in propylene prices. PP demand remains steady and buyers have returned to the market to increase stocks ahead of the Lunar New Year. The market continues to tighten, however, on the loss of PP, effectively
removing 0.86mn t/yr from the market for maintenance along with lower operating rates on Shenhua’s 600,000t/yr PP unit.
Weekly crude inventories mn bl
300
340
380
420
460
500
540
580
Jan Feb Mar Apr May Jun Jul Aug Sep Oct Nov Dec— EIA
5 Yr Range 2017 2018
Us PP raw material cost/price trends ¢/lb
5457
61
5450
60
6771
65
57 57 58 58
66 68 68 67
37
43 42
3632
42
4852
46
39 39 39 40
47 48 49 50
20
35
50
65
80
Aug 16 Oct 16 Dec 16 Feb 17 Apr 17 Jun 17 Aug 17 Oct 17 Dec 17US PP Homo GP US Propylene
Licensed to: Ashley Organ, Argus Media Inc (New York)
Copyright © 2018 Argus Media group Page 12 of 18
Issue 18-1 Monday 22 January 2018 Argus C5 and Hydrocarbon Resins
EnErgy markEts
utilization lower as operators deal with long periods of below freezing temperatures and the continued rise in gasoline inventories has pressured margins. US crude oil exports remain in the 1.0mn-1.4mn b/d range. We are likely witnessing a re-adjustment of the crude base price driven up by Opec cuts but capped by the ability of the US to produce more.
gasoline marketsDecember retail gasoline prices averaged $2.48/USG and 2017 averaged $2.42/USG, based on estimates from the EIA’s STEO January release.
US gasoline inventories continued to increase in late De-cember and early January as domestic demand was impacted by cold weather and snow over much of the eastern two-thirds of the US, and despite lower refinery utilization following weather impacts and falling margins. US refinery utilization fell to 93pc, the lowest level in seven weeks. Gasoline inven-tories continue to rise and now stand at 240.9mn bl, near the top of the five-year average range. Since the last report, this represents a growth of 30.5mn bl, a 14pc growth since Novem-ber. The EIA has estimates December gasoline consumption to be 0.32mn b/d lower than last December 2016. In addition, gasoline exports were lower by 0.1mn b/d, but this is com-pared to the record amount of export in December 2016. With these in mind, the EIA has forecast regular gasoline prices to average $2.57/USG in 2018 and $2.58/USG in 2019.
Refiners in northwest Europe have seen the arbitrage for gasoline to South America remain open, but high inventories of gasoline on the US Gulf coast (Padd 3) are competing for that market. Gasoline prices in Europe have been strong, support-ing reformer operations, but the arbitrage to New York Harbor is closed, so producers must look to other markets.
Us natural gasNatural gas prices at Henry Hub for February delivery month-to-date are trading sharply higher than the January contract as below normal temperatures prevailed across the eastern two-thirds of the US, and a record weekly withdrawal of gas from storage occurred for the first week in January (359bn ft3). Low temperatures across the US Gulf coast hit 15°F and there was wide spread frozen precipitation from Houston to Baton Rouge to New Orleans, causing travel challenges and impacting refinery and chemical plant operations in the region. Domes-tic inventories for the week ending 12 January were reported at 2.584 trillion ft3, down by 183bn ft3 for the week, and
Us natural gas working storage Bcf
0.5
1.5
2.5
3.5
4.5
Jan Jan Feb Mar Apr May Jun Jul Aug Sep Oct Nov Dec— EIA
5 Yr Range 2017 2018
Weekly gasoline inventories mn bl
190
200
210
220
230
240
250
260
Jan Feb Mar Apr May Jun Jul Aug Sep Oct Nov Dec— EIA
5yr range 2017 2018
below the five-year average by 362bn ft3. Current US natural gas prices are now trading in the $3.15-3.25/mmBtu range for February contracts, and March contracts are backwardated by about $0.20/mmBtu.
Based on the EIA’s STEO, 2017 saw dry natural gas produc-tion of 73.5 Bcf/d and is expected to grow over 9pc in 2018. Natural gas consumption during 2018 is expected to increase by 5pc with an additional 3pc growth forecasted for 2019. Even as these forecasts increase, the electrical power sec-tor has decreased natural gas usage in 2017 by 6pc. The STEO cites competition from coal and more expensive but mandated renewable energy as the primary reasons to this decrease.
naphthaCrude prices have generally moved prices up throughout the energy complex. US naphtha prices averaged $489/t in Novem-ber followed by a slight easing to $485 in December. Since the start of the year, naphtha prices have increased to average $505/t through the first half of January. In Europe, prices
Licensed to: Ashley Organ, Argus Media Inc (New York)

Copyright © 2018 Argus Media group Page 13 of 18
Issue 18-1 Monday 22 January 2018 Argus C5 and Hydrocarbon Resins
EnErgy markEts
World naphtha prices, historical and forecast $/t
300
400
500
600
700
Jan 17 Jun 17 Nov 17 Apr 18 Sep 18 Feb 19 Jul 19 Dec 19fob USGC cif NWE c+f Japan
have steadily increased through the end of 2017 with prices averaging $576 in December. Prices continue higher in January to $593/t. The increase in Japan naphtha prices followed suit with December at $593/t and pushing higher into January to $607/t.
Western European naphtha prices have trended higher with crude oil, but demand has been weaker as flexible steam crackers add more propane to their feedstock slates. Naphtha in Europe is trading in the $585-600/t range, and naphtha pric-es in Japan have recently had premiums to Europe at $10-20/t. Steam cracking margins in Asia based on naphtha have been strong, with recent margins above $600/t based on the Argus model. The current trend of weaker Asian ethylene pricing will push margins lower in the near term.
Industry snapshot
mti gets a new parentHalcyon Agri Corp. Ltd. of Singapore completed its $31.8mn acquisition of Polymer Division from RCMA, which heretofore had been MTi’s parent. With this acquisition, Halcyon Agri bol-sters not only its already considerable presence in the natural rubber latex market by adding such renowned trade names as Alan L. Grant Polymer, Corrie McCall Rubber and Wurfbain Polymer, but also adding more capability by offering synthetic rubber and polymers to its customers through distribution channels developed by MTi.
sika builds with EmsEaLUS-based EMSEAL, with a manufacturing facility in Toronto, On-tario, and headquarters in Westborough, Mass., had been acquired by Swiss-based Sika from private equity firm Fulham & Company. Emseal’s leadership position in structural expansion joint products will allow Sika to offer the most comprehensive range of sealing and bonding solutions to the North American construction market. Sika expects to run Emseal as a standalone business while taking advantage of the synergies and technology cross-pollination.
Elastomers expand in south koreaLotte Versalis Elastomers, a joint venture between Lotte and Versalis established in 2013, launched its integrated complex in Yeosu, South Korea. The facility has capacity to produce 200,000t of elastomers, including EPDM, sBR and BR. Expected
second phase of the construction will see addition of a TPE facility capable of producing block copolymers.
Epdm grows in ChinaChina Eastar Group expects to start up a 50,000t EPDM facility in Dongying, Shandong, in 2018. The $150mn facility had been under construction since 2016 and is expected to generate $190mn annually. Eastar licensed solution polymerization technology from Italy’s IPT and is capable of producing a wide range of EPDM grades.
harvey in rear view mirrorCiting strong global demand, tight raw material supply and rising freight costs exacerbated by Hurricane Harvey, on 16 January H.B. Fuller announced a 5 to 15pc price increase on its adhesive products.
Irplast cuts packagingIn collaboration with leading ink and adhesive manufacturers, Empoli, Italy-based Irplast developed a packaging film tape suitable for direct food contact. The new tape can be dis-pensed either manually or automatically and can be imprinted with clear and colorful information. Irplast expects its tape will replace shrink wrap, bands, elastics and trays leading to weight reduction of packaging content of up to 15 times and reducing packaging costs by 65pc.
Licensed to: Ashley Organ, Argus Media Inc (New York)

Copyright © 2018 Argus Media group Page 14 of 18
Issue 18-1 Monday 22 January 2018 Argus C5 and Hydrocarbon Resins
Industry snapshot
Imports and exports
World import trade flows, all hydrocarbon resins, Oct 17 t
Exports from Americas
3,965
Exports from Europe
3,529
Exports from Asia-Pacific
16,792
Imports into Americas
8,082
Imports into Europe
12,028
Imports into Asia-Pacific
4,176
Kraton goes for skin injectionIn January, Kraton demonstrated new technology it hopes will push its presence in the overmold and soft-touch markets to a new level. Kraton developed Injection Molded Soft Skin (IMSS) technology to enable manufacturers, especially in the automo-tive sector, to use their existing injection molding equipment to create larger thin wall soft skin designs. This new technol-ogy will allow manufactures to make such large items as door panels, consoles and instrument panels in a profile as thin as 0.8mm. Kraton IMSS technology will offer automotive manu-factures benefits of low VOC, better weatherability and weight savings, all the while improving on the aesthetics and improv-ing perceived value.
PO technology takes market shareAt EMPAC in January, Detmold, Germany’s Jowat will present its Jowat-Toptherm® product line of end-of-line packaging ad-hesives based on polyolefins. It seems at every packaging show
there are more and more PO-based adhesive products touting better performance, appearance and mileage being offered, clearly aimed at taking share from the conventional adhesives.
Farnesene gets more exposureDutch Royal DSM enhanced its relationship with US-based Amyris through a $96mn consideration and purchase of Amyris’ Brotas 1 facility in Brazil. Brotas 1 is a site designed for large volume production of farnesene, a biopolymer that can be used as a source of, or as Cray Valley recently showed, instead of terpenoid molecules. Amyris will continue to build Brotas 2, and the sale will allow Amyris to focus on development of its breakthrough bioscience technologies. The acquisition of Bro-tas 1 adds a state-of-the-art biotechnology site to DSM’s global footprint and allows access to abundant supply of sustainable sugar cane-based raw materials. DSM expects to optimize Brotas 1 site based on its experience with large-scale fermen-tation plants.
Licensed to: Ashley Organ, Argus Media Inc (New York)
Copyright © 2018 Argus Media group Page 15 of 18
Issue 18-1 Monday 22 January 2018 Argus C5 and Hydrocarbon Resins
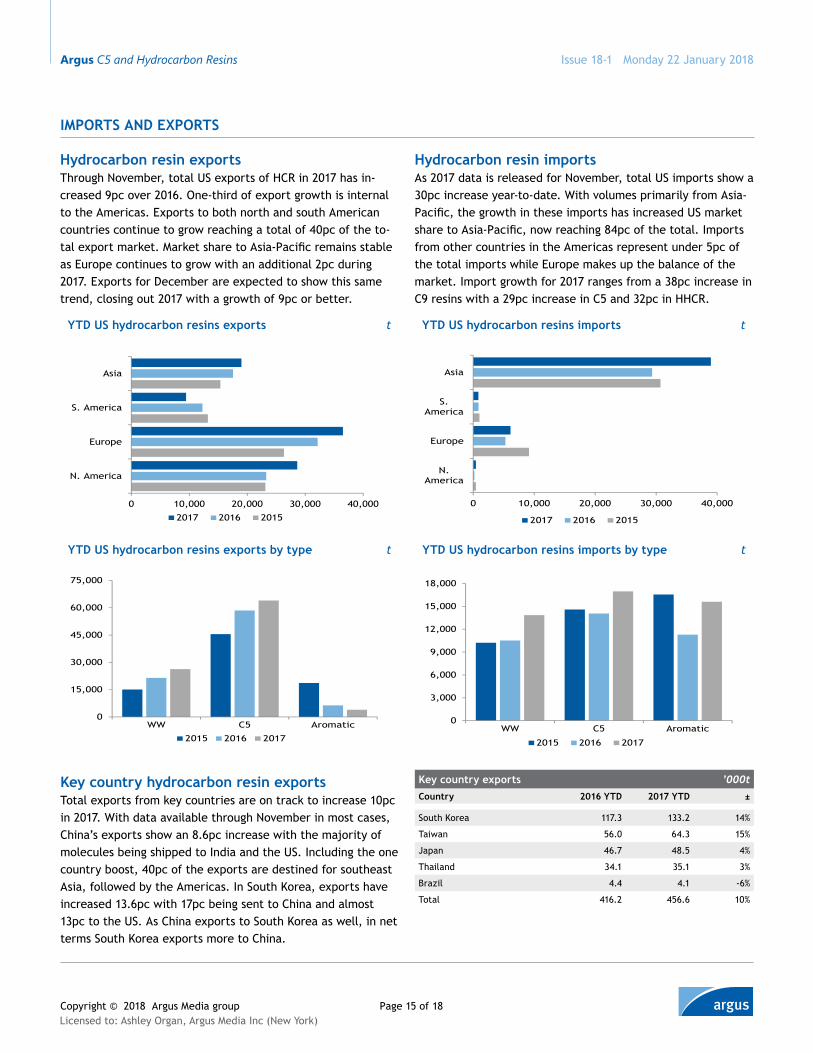
Key country exports ’000tCountry 2016 YTD 2017 YTD ±
South Korea 117.3 133.2 14%
Taiwan 56.0 64.3 15%
Japan 46.7 48.5 4%
Thailand 34.1 35.1 3%
Brazil 4.4 4.1 -6%
Total 416.2 456.6 10%
ImporTs anD exporTs
Hydrocarbon resin exportsThrough November, total US exports of HCR in 2017 has in-creased 9pc over 2016. One-third of export growth is internal to the Americas. Exports to both north and south American countries continue to grow reaching a total of 40pc of the to-tal export market. Market share to Asia-Pacific remains stable as Europe continues to grow with an additional 2pc during 2017. Exports for December are expected to show this same trend, closing out 2017 with a growth of 9pc or better.
YTD Us hydrocarbon resins exports by type t
0
15,000
30,000
45,000
60,000
75,000
WW C5 Aromatic
2015 2016 2017
YTD Us hydrocarbon resins imports by type t
0
3,000
6,000
9,000
12,000
15,000
18,000
WW C5 Aromatic
2015 2016 2017
YTD Us hydrocarbon resins exports t
0 10,000 20,000 30,000 40,000
N. America
Europe
S. America
Asia
2017 2016 2015
YTD Us hydrocarbon resins imports t
0 10,000 20,000 30,000 40,000
N.America
Europe
S.America
Asia
2017 2016 2015
Hydrocarbon resin importsAs 2017 data is released for November, total US imports show a 30pc increase year-to-date. With volumes primarily from Asia-Pacific, the growth in these imports has increased US market share to Asia-Pacific, now reaching 84pc of the total. Imports from other countries in the Americas represent under 5pc of the total imports while Europe makes up the balance of the market. Import growth for 2017 ranges from a 38pc increase in C9 resins with a 29pc increase in C5 and 32pc in HHCR.
Key country hydrocarbon resin exportsTotal exports from key countries are on track to increase 10pc in 2017. With data available through November in most cases, China’s exports show an 8.6pc increase with the majority of molecules being shipped to India and the US. Including the one country boost, 40pc of the exports are destined for southeast Asia, followed by the Americas. In South Korea, exports have increased 13.6pc with 17pc being sent to China and almost 13pc to the US. As China exports to South Korea as well, in net terms South Korea exports more to China.
Licensed to: Ashley Organ, Argus Media Inc (New York)

Copyright © 2018 Argus Media group Page 16 of 18
Issue 18-1 Monday 22 January 2018 Argus C5 and Hydrocarbon Resins
Polymers sPecialty elastometers imPorts and exPorts
Us importJan Feb mar apr may Jun Jul aug sep oct nov dec total Unit value
t t $mn $/t ¢/lb
Hydrocarbon resins2015 2,871 3,056 4,474 5,607 4,165 2,886 4,404 4,079 3,407 3,322 3,095 3,421 44,785 108,726 2,428 1102016 3,562 2,793 3,511 3,673 3,639 3,358 2,974 3,305 2,951 3,067 3,040 3,428 39,302 93,289 2,374 1082017 3,737 4,061 3,691 4,470 5,035 4,209 3,728 3,881 4,276 5,284 3,948 0 46,320 100,829 2,177 99Gum rosin unaltered2015 1,688 770 1,486 1,738 1,396 837 1,433 941 1,500 1,126 708 530 14,154 25,565 1,806 822016 1,171 1,009 802 1,214 1,468 548 741 804 1,354 770 1,082 1,445 12,408 21,937 1,768 802017 1,015 1,701 959 396 516 1,248 2,251 501 580 331 741 0 10,239 17,352 1,695 77Wood and tall oil rosin unaltered2015 74 139 154 56 166 57 215 40 202 153 160 359 1,776 2,949 1,660 752016 71 117 125 150 195 149 72 156 29 64 147 91 1,365 2,627 1,924 872017 71 38 49 77 229 34 259 136 95 84 163 0 1,235 2,007 1,625 74Rosin esters2015 257 281 482 319 567 395 357 391 369 193 399 378 4,010 17,460 4,354 1982016 325 403 364 347 254 321 417 401 315 330 465 487 3,942 15,256 3,870 1762017 536 477 772 521 490 413 321 310 305 479 380 0 5,004 15,114 3,020 137Rosin Salts2015 77 122 128 153 68 157 123 18 65 47 54 69 1,081 5,717 5,289 2402016 143 166 179 163 98 30 82 132 72 72 96 0 1,233 7,046 5,715 2592017 119 62 55 109 72 58 76 80 21 90 47 0 789 6,175 7,826 355Rosin unidentified2015 512 527 848 745 748 725 663 661 623 759 372 480 7,663 25,000 3,262 1482016 553 545 714 687 605 666 570 943 699 700 674 588 7,944 23,152 2,914 1322017 616 783 996 740 817 864 672 904 807 806 722 0 8,727 23,830 2,731 124Rosin derivatives total2015 846 930 1,458 1,217 1,383 1,277 1,143 1,070 1,057 999 825 927 12,754 48,176 3,777 1712016 1,021 1,114 1,257 1,197 957 1,017 1,069 1,476 1,086 1,102 1,235 1,075 13,119 45,454 3,465 1572017 1,271 1,322 1,823 1,370 1,379 1,335 1,069 1,294 1,133 1,375 1,149 0 14,520 45,118 3,107 141
Us exportsJan Feb mar apr may Jun Jul aug sep oct nov dec total Unit value
t t $m $/t ¢/lb
Hydrocarbon resins2015 7,415 7,938 9,057 7,038 6,487 6,593 6,998 7,378 6,509 7,396 6,529 6,535 85,874 220,103 2,563 1162016 8,221 8,194 8,794 8,595 8,142 7,620 8,119 6,920 7,640 7,161 6,956 6,644 93,006 217,570 2,339 1062017 9,682 8,813 7,630 8,468 9,055 7,591 9,899 9,577 7,993 7,509 8,711 0 94,928 229,908 2,422 110Gum rosin unaltered2015 32 12 54 72 106 180 26 101 70 231 392 102 1,378 1,494 1,084 492016 10 26 9 26 75 48 25 105 78 83 70 9 563 595 1,058 482017 80 23 2 25 78 24 304 19 73 0 20 0 649 643 991 45Wood and tall oil rosin unaltered2015 1,300 1,124 1,392 445 1,330 1,556 1,035 796 845 905 847 870 12,445 20,395 1,639 742016 1,524 878 965 1,216 931 870 1,054 1,124 880 1,354 864 1,421 13,082 18,343 1,402 642017 868 1,321 1,143 1,343 453 1,292 1,016 1,746 1,477 1,770 1,068 0 13,497 17,602 1,304 59Rosin esters2015 2,496 1,417 1,934 2,210 2,326 1,816 1,948 1,575 1,760 1,867 2,107 2,030 23,486 69,144 2,944 1342016 2,296 1,834 2,337 2,327 1,976 1,988 2,350 1,960 2,377 2,016 1,995 1,730 25,186 69,763 2,770 1262017 2,566 2,127 2,093 2,223 2,292 1,938 1,930 2,157 2,141 1,710 1,717 0 22,894 62,585 2,734 124Rosin salts2015 159 189 239 210 320 184 204 176 226 164 150 258 2,479 5,717 2,306 1052016 162 146 169 470 329 411 380 338 304 238 339 247 3,533 7,046 1,994 902017 130 238 283 223 261 277 296 229 352 275 205 0 2,769 6,175 2,230 101Rosin unidentified2015 2,913 2,579 2,803 2,193 3,215 2,098 1,934 3,061 2,723 2,133 2,281 2,189 30,122 70,917 2,354 1072016 2,416 1,837 1,702 1,944 1,277 2,318 2,386 1,566 1,576 1,377 2,104 1,745 22,248 53,812 2,419 1102017 1,700 1,764 1,667 2,071 1,703 1,855 2,122 1,749 1,659 2,488 2,050 0 20,828 46,638 2,239 102Rosin derivatives total2015 5,568 4,185 4,976 4,613 5,861 4,098 4,086 4,812 4,709 4,164 4,538 4,477 56,087 145,778 2,599 1182016 4,874 3,817 4,208 4,741 3,582 4,717 5,116 3,864 4,257 3,631 4,438 3,722 50,967 130,621 2,563 1162017 4,396 4,129 4,043 4,517 4,256 4,070 4,348 4,135 4,152 4,473 3,972 0 46,491 115,397 2,482 113
Licensed to: Ashley Organ, Argus Media Inc (New York)

Copyright © 2018 Argus Media group Page 17 of 18
Issue 18-1 Monday 22 January 2018 Argus C5 and Hydrocarbon Resins
Hydrocarbon and rosin resins exim
Us importsJan Feb mar apr may Jun Jul aug sep oct nov dec Total Unit value
t t m$ $/t ¢/lb
Isoprene >95% purity2015 8,595 3,564 4,078 5,109 4,685 5,091 6,095 3,814 3,498 4,597 3,008 7,397 59,528 100,875 1,695 772016 5,732 6,682 4,661 5,701 4,815 4,606 7,375 5,146 4,817 2,557 5,423 6,213 63,728 88,995 1,396 632017 3,767 4,594 6,775 4,967 11,010 5,260 6,604 3,839 5,991 5,028 8,485 0 66,320 95,654 1,442 65Polybutadiene2015 5,244 3,043 8,885 7,080 8,669 5,233 4,845 4,938 3,674 6,555 3,755 5,984 67,904 128,012 1,885 852016 6,482 6,130 8,875 7,048 6,921 7,084 6,728 5,726 6,456 6,740 6,829 4,693 79,711 138,368 1,736 792017 4,626 5,126 5,977 5,870 5,780 5,910 4,277 5,433 4,888 6,908 6,683 0 61,479 148,220 2,411 109Polybutylene2015 530 455 1,130 1,017 1,092 680 1,218 795 1,052 1,102 878 734 10,684 30,757 2,879 1312016 681 662 1,433 1,148 1,133 1,257 2,131 770 716 709 705 524 11,869 33,639 2,834 1292017 676 714 862 570 906 1,402 925 1,751 767 687 1,011 0 10,271 29,580 2,880 131Polyisobutylene2015 3,307 6,434 6,819 6,882 7,570 4,802 7,408 5,682 6,716 7,925 3,591 8,374 75,509 152,022 2,013 912016 4,405 4,504 8,988 5,951 6,371 3,658 4,857 5,934 5,544 6,575 5,889 6,675 69,352 125,417 1,808 822017 4,918 6,130 5,055 6,638 4,889 8,711 7,375 6,547 7,471 7,612 7,097 0 72,442 127,946 1,766 80Polyisoprene2015 2,487 3,096 4,063 4,337 4,929 2,498 3,909 3,421 2,733 3,195 2,831 2,573 40,072 77,927 1,945 882016 3,830 1,168 3,624 3,474 3,454 3,974 2,992 2,206 3,577 2,940 3,423 2,923 37,584 68,855 1,832 832017 3,513 2,750 3,570 3,695 2,880 3,189 3,105 3,940 2,600 2,899 2,735 0 34,876 75,603 2,168 98EPDM2015 4,711 2,988 5,027 4,606 4,591 4,094 4,236 5,275 4,709 4,113 4,867 4,160 53,377 170,861 3,201 1452016 4,184 4,448 5,350 5,668 5,629 5,478 6,543 5,080 4,659 5,373 4,660 4,386 61,457 171,632 2,793 1272017 4,341 3,355 5,799 3,979 5,132 5,294 6,044 5,041 5,511 5,193 4,183 0 53,871 145,350 2,698 122Natural rubber TSR202015 53,462 35,630 56,509 51,101 71,759 52,982 55,056 52,320 52,838 50,980 48,374 45,196 626,207 1,106,921 1,768 802016 47,326 44,120 50,652 53,429 60,408 51,675 58,518 52,648 45,143 52,794 43,836 45,206 605,756 950,279 1,569 712017 49,503 39,849 56,760 55,383 39,057 71,343 53,509 48,921 52,288 46,604 43,623 0 556,838 1,162,791 2,088 95
Us exportsJan Feb mar apr may Jun Jul aug sep oct nov dec Total Unit value
t t m$ $/t ¢/lb
Isoprene >95% Purity2015 943 774 522 689 702 677 356 325 154 880 531 351 6,903 7,854 1,138 522016 803 365 748 726 708 703 205 299 676 588 367 571 6,759 7,651 1,132 512017 454 911 573 521 549 584 398 249 692 458 430 0 5,820 6,147 1,056 48Polybutadiene2015 20,612 21,398 21,645 18,533 23,868 21,821 18,961 21,556 19,489 18,597 16,737 19,456 242,672 442,918 1,825 832016 21,594 22,492 21,353 26,643 28,703 25,090 25,674 24,581 23,568 22,545 25,398 23,455 291,094 495,350 1,702 772017 27,857 23,427 27,769 21,018 20,198 19,561 21,326 21,955 17,628 27,375 18,461 0 246,575 549,494 2,229 101Polybutylene2015 707 779 945 765 783 994 521 921 565 683 697 624 8,983 22,330 2,486 1132016 644 601 470 545 1,026 323 378 606 705 351 529 416 6,592 18,604 2,822 1282017 607 546 801 477 897 827 953 766 764 846 641 0 8,124 20,742 2,553 116Polyisobutylene2015 5,346 4,512 6,997 6,627 2,843 2,151 2,120 2,326 2,889 3,164 1,260 4,216 44,451 97,204 2,187 992016 1,486 2,940 6,421 2,674 6,530 4,805 4,971 6,073 2,600 3,483 4,450 4,481 50,914 87,394 1,716 782017 6,256 5,368 8,124 4,924 3,589 2,929 5,026 2,002 2,572 3,031 2,056 0 45,876 76,229 1,662 75Polyisoprene2015 1,790 1,689 1,875 1,710 2,168 1,492 2,065 1,428 1,620 1,820 2,758 1,737 22,153 65,172 2,942 1332016 1,916 1,914 2,326 2,414 2,341 2,153 1,563 3,109 2,236 2,344 2,684 1,771 26,770 107,498 4,016 1822017 2,073 2,429 2,092 2,089 2,284 2,267 1,859 1,987 2,324 1,914 2,196 0 23,514 100,956 4,293 195EPDM2015 19,056 21,824 22,525 23,128 24,129 21,508 22,872 19,632 20,892 23,288 20,452 22,939 262,244 574,195 2,190 992016 21,400 21,280 23,954 22,703 25,969 23,652 21,827 24,483 20,799 22,996 24,157 21,361 274,581 507,624 1,849 842017 21,225 20,790 23,947 23,131 21,094 19,483 21,533 24,115 18,848 26,290 22,554 0 243,010 452,598 1,862 84Natural rubber TSR202015 171 372 444 340 535 447 441 978 589 385 344 455 5,500 14,403 2,619 1192016 246 316 379 190 305 253 337 824 497 348 389 237 4,319 10,324 2,390 1082017 469 326 487 457 782 599 238 261 188 310 172 0 4,290 11,126 2,594 118
Licensed to: Ashley Organ, Argus Media Inc (New York)

illuminating the marketsPetrochemicals
Issue 18-1 Monday 22 January 2018 Argus C5 and Hydrocarbon Resins
PublisherAdrian Binks
CEO AmericasEuan Craik
Chief operating officerMatthew Burkley
Global compliance officerJeffrey Amos
Commercial managerKaren Johnson
Managing editor, AmericasJim Kennett
Contact: Vitaly RogachevskyTel: +1 713 360 [email protected]
Customer support and salesTechnical [email protected] other queries [email protected], USTel: +1 713 968 0000New York. US Tel: +1 646 376 6130Washington DC, US Tel: + 1 202 775 0240London, UK Tel: +44 20 7780 4200Astana, Kazakhstan Tel: +7 7172 72 92 94Beijing Tel: +86 10 6515 6512Dubai Tel: +971 4434 5112Moscow, Russia Tel: +7 495 933 757Rio de Janeiro, BrazilTel: +55 21 2548 0817Singapore Tel: +65 6496 9966Tokyo, Japan Tel: +81 3 3561 1805
Argus C5 and Hydrocarbon Resins is published by Argus Media group
Registered officeLacon House, 84 Theobald’s Road, London, WC1X 8NL Tel: +44 20 7780 4200 email: [email protected]: 2399-9403Copyright noticeCopyright © 2018 Argus Media group. All rights reserved. All intellectual property rights in this publication and the information published herein are the exclusive property of Argus, and/or its licensors (including exchanges) and may only be used under licence from Argus. Without limiting the foregoing, by accessing this publication you agree that you will not copy or reproduce or use any part of its contents (including, but not limited to, single prices or any other individual items of data) in any form or for any purpose whatsoever except under valid licence from Argus. Further, your access to and use of data from exchanges may be subject to additional fees and/or execution of a separate agreement, whether directly with the exchanges or via Argus.
Trademark noticeARGUS, ARGUS MEDIA, the ARGUS logo, ARGUS C5 AND HyDRoCARBoN RESINS, other ARGUS publication titles and ARGUS index names are trademarks of Argus Media Limited.Visit www.argusmedia.com/trademarks for more information.
DisclaimerThe data and other information published herein (the “Data”) are provided on an “as is” basis. Argus and its licensors (including exchanges) make no warranties, express or implied, as to the accuracy, adequacy, timeliness, or completeness of the Data or fitness for any particular purpose. Argus and its licensors (including exchanges) shall not be liable for any loss, claims or damage arising from any party’s reliance on the Data and disclaim any and all liability related to or arising out of use of the Data to the full extent permissible by law.
ANNOUNCEMENT
Terminating basic US import monomer pricesArgus is terminating its basic, origin specific US import DCPD and isoprene price assessments.
Effective 23 February, Argus will discontinue publishing its basic US import monomer price assessments for UPR DCPD (PA0017291) and isoprene cif Brazil (PA0012230), cif China (PA0012231), cif Japan (PA0012232), cif Russia (PA0012233) and cif Taiwan (PA0016887).
The price assessments will be last published 22 January.For further details, please contract Vitaly Rogachevsky at [email protected] or +1 713 360 7536.
Licensed to: Ashley Organ, Argus Media Inc (New York)
.