ARGO-YBJ DOI THE ...
32
2015 Publication Year 2021-01-08T15:53:54Z Acceptance in OA@INAF Study of the Diffuse Gamma-Ray Emission from the Galactic Plane with ARGO-YBJ Title Bartoli, B.; Bernardini, P.; Bi, X. J.; Branchini, P.; Budano, A.; et al. Authors 10.1088/0004-637X/806/1/20 DOI http://hdl.handle.net/20.500.12386/29619 Handle THE ASTROPHYSICAL JOURNAL Journal 806 Number
Transcript of ARGO-YBJ DOI THE ...

2015Publication Year
2021-01-08T15:53:54ZAcceptance in OA@INAF
Study of the Diffuse Gamma-Ray Emission from the Galactic Plane with ARGO-YBJ
Title
Bartoli, B.; Bernardini, P.; Bi, X. J.; Branchini, P.; Budano, A.; et al.Authors
10.1088/0004-637X/806/1/20DOI
http://hdl.handle.net/20.500.12386/29619Handle
THE ASTROPHYSICAL JOURNALJournal
806Number
arX
iv:1
507.
0675
8v1
[as
tro-
ph.I
M]
24
Jul 2
015
Published in ApJ
Study of the diffuse gamma-ray emission from the Galactic plane
with ARGO-YBJ
B. Bartoli1,2, P. Bernardini3,4, X.J. Bi5, P. Branchini6, A. Budano6, P. Camarri7,8, Z. Cao5,
R. Cardarelli8, S. Catalanotti1,2, S.Z. Chen5, T.L. Chen9, P. Creti4, S.W. Cui10, B.Z. Dai11,
A. D’Amone3,4, Danzengluobu9, I. De Mitri3,4, B. D’Ettorre Piazzoli1,2,21, T. Di
Girolamo1,2,21, G. Di Sciascio8, C.F. Feng12, Zhaoyang Feng5, Zhenyong Feng13, Q.B. Gou5,
Y.Q. Guo5, H.H. He5, Haibing Hu9, Hongbo Hu5, M. Iacovacci1,2, R. Iuppa7,8, H.Y. Jia13,
Labaciren9, H.J. Li9, G. Liguori14,15, C. Liu5, J. Liu11, M.Y. Liu9, H. Lu5, L.L. Ma5,21,
X.H. Ma5, G. Mancarella3,4, S.M. Mari6,16, G. Marsella3,4, D. Martello3,4, S. Mastroianni2,
P. Montini6,16, C.C. Ning9, M. Panareo3,4, L. Perrone3,4, P. Pistilli6,16, F. Ruggieri6,
P. Salvini15, R. Santonico7,8, P.R. Shen5, X.D. Sheng5, F. Shi5, A. Surdo4, Y.H. Tan5,
P. Vallania17,18, S. Vernetto17,18, C. Vigorito18,19, H. Wang5, C.Y. Wu5, H.R. Wu5, L. Xue12,
Q.Y. Yang11, X.C. Yang11, Z.G. Yao5, A.F. Yuan9, M. Zha5, H.M. Zhang5, L. Zhang11,
X.Y. Zhang12, Y. Zhang5, J. Zhao5, Zhaxiciren9, Zhaxisangzhu9, X.X. Zhou13, F.R. Zhu13,
Q.Q. Zhu5 and G. Zizzi20
(The ARGO-YBJ Collaboration)

– 2 –
ABSTRACT
The events recorded by ARGO-YBJ in more than five years of data collection
have been analyzed to determine the diffuse gamma-ray emission in the Galactic
1Dipartimento di Fisica dell’Universita di Napoli “Federico II”, Complesso Universitario di Monte
Sant’Angelo, via Cinthia, 80126 Napoli, Italy.
2Istituto Nazionale di Fisica Nucleare, Sezione di Napoli, Complesso Universitario di Monte Sant’Angelo,
via Cinthia, 80126 Napoli, Italy.
3Dipartimento Matematica e Fisica ”Ennio De Giorgi”, Universita del Salento, via per Arnesano, 73100
Lecce, Italy.
4Istituto Nazionale di Fisica Nucleare, Sezione di Lecce, via per Arnesano, 73100 Lecce, Italy.
5Key Laboratory of Particle Astrophysics, Institute of High Energy Physics, Chinese Academy of Sciences,
P.O. Box 918, 100049 Beijing, P.R. China.
6Istituto Nazionale di Fisica Nucleare, Sezione di Roma Tre, via della Vasca Navale 84, 00146 Roma,
Italy.
7Dipartimento di Fisica dell’Universita di Roma “Tor Vergata”, via della Ricerca Scientifica 1, 00133
Roma, Italy.
8Istituto Nazionale di Fisica Nucleare, Sezione di Roma Tor Vergata, via della Ricerca Scientifica 1, 00133
Roma, Italy.
9Tibet University, 850000 Lhasa, Xizang, P.R. China.
10Hebei Normal University, Shijiazhuang 050016, Hebei, P.R. China.
11Yunnan University, 2 North Cuihu Rd., 650091 Kunming, Yunnan, P.R. China.
12Shandong University, 250100 Jinan, Shandong, P.R. China.
13Southwest Jiaotong University, 610031 Chengdu, Sichuan, P.R. China.
14Dipartimento di Fisica dell’Universita di Pavia, via Bassi 6, 27100 Pavia, Italy.
15Istituto Nazionale di Fisica Nucleare, Sezione di Pavia, via Bassi 6, 27100 Pavia, Italy.
16Dipartimento di Fisica dell’Universita “Roma Tre”, via della Vasca Navale 84, 00146 Roma, Italy.
17Osservatorio Astrofisico di Torino dell’Istituto Nazionale di Astrofisica, via P. Giuria 1, 10125 Torino,
Italy.
18Istituto Nazionale di Fisica Nucleare, Sezione di Torino, via P. Giuria 1, 10125 Torino, Italy.
19Dipartimento di Fisica dell’Universita di Torino, via P. Giuria 1, 10125 Torino, Italy.
20Istituto Nazionale di Fisica Nucleare - CNAF, Viale Berti-Pichat 6/2, 40127 Bologna, Italy.
21Corresponding authors: [email protected], [email protected], [email protected]

– 3 –
plane at Galactic longitudes 25◦ < l < 100◦ and Galactic latitudes |b| < 5◦. The
energy range covered by this analysis, from ∼350 GeV to ∼2 TeV, allows the
connection of the region explored by Fermi with the multi-TeV measurements
carried out by Milagro. Our analysis has been focused on two selected regions
of the Galactic plane, i.e., 40◦ < l < 100◦ and 65◦ < l < 85◦ (the Cygnus
region), where Milagro observed an excess with respect to the predictions of
current models. Great care has been taken in order to mask the most intense
gamma-ray sources, including the TeV counterpart of the Cygnus cocoon recently
identified by ARGO-YBJ, and to remove residual contributions. The ARGO-YBJ
results do not show any excess at sub-TeV energies corresponding to the excess
found by Milagro, and are consistent with the predictions of the Fermi model
for the diffuse Galactic emission. From the measured energy distribution we
derive spectral indices and the differential flux at 1 TeV of the diffuse gamma-
ray emission in the sky regions investigated.
Subject headings: cosmic rays-diffuse radiation:Galaxy-disk: methods:observational
1. Introduction
Diffuse gamma-rays are the sum of contributions from several components: the truly
diffuse Galactic gamma-rays produced by the interaction of cosmic rays, the extragalactic
background and the contribution from undetected and faint Galactic gamma-ray sources. On
the Galactic plane the Galactic gamma-rays dominate the other components. The processes
leading to this emission are the interaction of cosmic nuclei with the interstellar gas through
the production and decay of secondary π0 mesons, the bremsstrahlung of high-energy cosmic
electrons, and their inverse Compton scattering on low-energy interstellar radiation fields.
The spectrum of this radiation may provide insight into the propagation and confinement
in the Galaxy of the parent cosmic rays, their source distribution and their spectrum at
the acceleration sites. Since gamma-rays are not deflected by magnetic fields, the diffuse
component traces cosmic rays and the interstellar environment in distant parts of the Galaxy.
In addition, the Galactic diffuse emission represents the natural background to many different
signals (Moskalenko et al. 2004). The knowledge of the diffuse emission is necessary for the
accurate detection of gamma-ray sources, either as point-like or extended. High-quality data
on the diffuse emission in the Galactic Center region are needed to constrain the dark matter
models (Macias & Gordon 2014). Electrons and positrons from astrophysical sources invoked
to explain the PAMELA results also induce gamma-rays when propagating in the Galaxy.
The induced gamma-rays represent an additional contribution to the diffuse gamma-ray

– 4 –
background(Zhang et al. 2010).
Galactic diffuse gamma-rays with energies from 100 MeV to a few GeV were firstly de-
tected by the space-borne detectors SAS-2 (Kniffen & Fichtel 1981) and COS-B (Strong et al.
1987), which revealed the noticeable correlation between the flux of gamma-rays and the
density of the interstellar medium. Then COMPTEL and EGRET on board the Comp-
ton Gamma Ray Observatory provided the first maps unveiling the spectrum of the diffuse
emission from 1 MeV up to 10 GeV (Hunter et al. 1997; Strong 2011). In the GeV en-
ergy range, the EGRET data show in all directions a significant excess (the so-called “GeV
excess”) with respect to the predictions obtained assuming a cosmic-ray flux as that mea-
sured at Earth. This result stimulated intense theoretical studies and many possible ex-
planations have been proposed, including harder cosmic-ray spectra throughout the Galaxy
(Strong et al. 2000), large contribution from high-energy electrons via inverse Compton scat-
tering (Porter & Protheroe 1997), or production of gamma-rays from annihilation of dark
matter particles with mass 40−50 GeV(Bi et al. 2008). At intermediate Galactic latitudes
this excess has not been confirmed by the Large Area Telescope (LAT) on board the Fermi
Gamma Ray Space Telescope launched in 2008 (Abdo et al. 2009a). With a sensitivity more
than one order of magnitude better than EGRET, Fermi -LAT mapped the gamma-ray sky
up to a few hundreds of GeV with unprecedented accuracy. Observation and discovery of
gamma-ray discrete sources (Nolan et al. 2012; Ackermann et al. 2013; Acero et al. 2013;
Abdo et al. 2013) as well as the study of the GeV diffuse emission at different Galactic lati-
tudes (Ackermann et al. 2012a) have been the primary targets of these analyzes. At higher
energies, due to their low fluxes, the diffuse gamma-rays can be efficiently studied only
by ground-based detectors with large effective areas. The Imaging Atmospheric Cherenkov
Telescopes (IACTs), such as Whipple and HEGRA, have set upper limits in very narrow re-
gions (LeBohec et al. 2000; Aharonian et al. 2001). The H.E.S.S. telescope array has carried
out a survey of the Galactic plane covering the region −75◦ < l < 60◦ in longitude at an
energy threshold of about 250 GeV, and has presented the latitude profile of diffuse emission
at |b| < 2◦ (Abramowski et al. 2014). This represents the first observational assessment of
diffuse TeV gamma-rays by a Cherenkov telescope. The spatial correlation of gamma-rays
with giant molecular clouds in the inner Galaxy has been also investigated, the hardness
of gamma-ray spectrum indicating that these gamma-rays originate from protons and nu-
clei rather than electrons (Aharonian et al. 2006a). However, though IACTs are the most
sensitive detectors operating in the field of gamma-ray astronomy, limited by their field of
view (FOV) they are not well suited to observe diffuse gamma-rays that have a large-scale
structure. On the other hand, air shower arrays providing a large FOV and a very high duty
cycle look more adequate for sky survey purposes. Many air shower experiments have set
upper limits to diffuse gamma-rays, such as Tibet ASγ at TeV energies (Amenomori et al.

– 5 –
2006), and EAS-TOP (Aglietta et al. 1992), KASCADE (Haungs et al. 2006), and CASA-
MIA (Borione et al. 1998) at energies >100 TeV. The Milagro detector has made the first
positive observation of the diffuse gamma-ray flux from the Galactic plane, measuring the
integral flux above 3.5 TeV in the region 40◦ < l < 100◦, |b| < 5◦ (Atkins et al. 2005). As-
suming that the contribution from inverse Compton scattering is negligible at TeV energies,
the Milagro measurement is many times higher than expected, indicating the existence of
a “TeV excess” possibly connected to the “GeV excess” of diffuse gamma-rays observed by
EGRET (Prodanovic et al. 2007). Most notably, in a following analysis of seven-years data,
the Milagro collaboration reported a clear excess of diffuse gamma-rays at 15 TeV median
energy from the galactic region 65◦ < l < 85◦, suggesting the presence of active cosmic-
ray sources accelerating hadrons (Abdo et al. 2008). This interpretation is supported by the
fact that this longitude interval harbors the Cygnus X star-forming region, rich with possible
cosmic-ray acceleration sites. However, the Fermi -LAT data do not confirm at GeV energies
the broadly distributed excess of diffuse emission observed by Milagro at multi-TeV energies
(Ackermann et al. 2012b). Instead, they have found a bright extended gamma-ray source
centered at l = 79◦.6± 0◦.3, the so-called “Cygnus cocoon” (Ackermann et al. 2011), whose
TeV counterpart has been recently identified by the ARGO-YBJ experiment (Bartoli et al.
2014a). These results suggest that the gamma-ray excess of the cocoon is likely due to a
population of freshly accelerated hadronic cosmic rays, even though a leptonic or mixed
origin cannot be discarded. High-energy protons fastly diffusing from this source and inter-
acting with the local gas could generate gamma-rays that contribute to the diffuse excess
observed by Milagro. To better clarify the interpretation of these results, we have used the
data collected by ARGO-YBJ in 5.3 yr to measure the diffuse gamma-ray emission in the
25◦ < l < 100◦, |b| < 5◦ Galactic region, then selecting the two regions 40◦ < l < 100◦ and
65◦ < l < 85◦ in order to compare the results with the Milagro measurements. Thanks to its
high-altitude location and its particular layout, ARGO-YBJ is able to operate at an energy
threshold of about 300 GeV, in such a way providing results that bridge the Fermi GeV
energies and the multi-TeV range explored by Milagro.
The plan of the paper is as follows. In Section 2 we describe the ARGO-YBJ detector
and its performance. In Section 3 we present data selection and data analysis methods. The
results of the analysis are presented in Section 4. Section 5 is devoted to a summary of the
results and to the conclusions.

– 6 –
2. The ARGO-YBJ experiment
The ARGO-YBJ detector, hosted in a building at the YangBaJing Cosmic Ray Obser-
vatory (Tibet, China, 90◦31’50” E, 30◦06’38” N), 4300 m above sea level, has been designed
for very high-energy (VHE) gamma-ray astronomy and cosmic-ray observations. It is made
up of a single layer of resistive plate chambers (RPCs) operated in streamer mode, 2.850
m × 1.225 m each, organized in a modular configuration to cover a surface of about 5600
m2 with an active area of about 93%. The RPCs detect the charged particles in air show-
ers with an efficiency ≥ 98%. To improve the shower reconstruction, other chambers are
deployed around the central carpet for a total instrumented area of 100 m × 110 m. A
highly segmented readout is performed by means of 55.6 cm × 61.8 cm external electrodes,
called ”pads,” whose fast signals are used for triggering and timing purposes. These pads
provide the digital readout of the detector up to 22 particles/m2, allowing the count of the
air shower charged particles without any significant saturation up to primary cosmic-ray
energies of about 200 TeV (Bartoli et al. 2012a). In order to extend the dynamical range
to PeV energies each RPC is also equipped with two large size pads (139 cm × 123 cm)
allowing the collection of the total charge developed by the particles hitting the detector
(Aielli et al. 2012). The digital output of each pad is splitted in two signals sent to the logic
chain that builds the trigger and to the 18,360 multi-hit time-to-digital converters, which are
routinely calibrated with 0.4 ns accuracy by means of an off-line method using cosmic-ray
showers (He et al. 2007; Aielli et al. 2009a). More details about the detector and the RPC
performance can be found in Aielli et al. (2006) and Aielli et al. (2009b). The detector is
connected to two independent acquisition systems corresponding to two different operation
modes, referred to as the shower mode and the scaler mode (Aielli et al. 2008). The data
used in this paper were recorded by the digital readout in shower mode. This mode is im-
plemented by means of an inclusive trigger based on the time correlation between the pad
signals, depending on their relative distance. In this way the data acquisition is triggered
when at least 20 pads in the central carpet are fired in a time window of 420 ns. By means
of this trigger the energy threshold for gamma-induced showers can go down to 300 GeV
with an effective area depending on the zenith angle (see Figure 1 in Bartoli et al. (2013)).
The event reconstruction follows a standard procedure allowing a detailed space-time
reconstruction of the shower front, including the position of the shower core and the incident
direction of the primary particle. A detailed account of the reconstruction algorithm can be
found in Bartoli et al. (2011a,b, 2013, 2015). Briefly, the shower core position is obtained
by fitting the lateral density distribution of the shower charged particles with a Nishimura-
Kamata-Greisen-like function using the maximum likelihood method. The arrival direction
of the showers is reconstructed by the least squares method assuming a conical shape for the
shower front, as described by Equation (1) in (Aielli et al. 2009a), which gives the relation

– 7 –
between the particle arrival time and the distance to the shower core. The angular resolution
depends on the number of fired pads N pad. The opening angle ψ70 containing 71.5% of the
events from a point source is about 2◦ for events with N pad > 20, 1.36◦ for N pad > 60 and
0.99◦ for events with N pad > 100. The number of hit pads N pad is the observable related
to the primary energy. However, the number of particles at ground level is not a very
accurate estimator of the primary energy of the single event, due to the large fluctuations
in the shower development in the atmosphere and to its partial sampling with the limited
detector area. The primary energy distribution corresponding to different N pad intervals is
very broad, spanning over more than one order of magnitude for small N pad values. The
relation between N pad and the primary gamma-ray energy of the selected showers is reported
in Bartoli et al. (2015). Since the variable N pad does not allow the accurate measurement
of the primary energy of the single event, the energy spectrum is evaluated by studying the
global distribution of N pad. The observed distribution is compared with a set of simulated
ones obtained with different test spectra, in order to find out that which better reproduces
the data (as carried out in Section 4.1). The angular resolution, pointing accuracy, absolute
energy calibration and detector stability are tested by measuring the cosmic-ray shadow
cast by the Moon, detected with a significance of 10 standard deviations (s.d.) per month
(Bartoli et al. 2011b).
3. Data analysis
The ARGO-YBJ experiment began taking data in its full configuration in 2007 Novem-
ber at a trigger rate of 3.5 kHz with a dead time of 4%. It has been operated stably for
more than five years, up to 2013 January, with an average duty cycle of 86%, for a total
effective time of 1670.45 days. For the present analysis, events with zenith angles less than
50◦, corresponding to the declination interval −20◦ < δ < 80◦, and N pad > 20 are used.
A set of standard cuts, applied to the shower core reconstructed position and to the time
spread of the shower front, have been used to select high-quality data. With this data se-
lection a total of 6.407 × 10¹⁰ shower events are observed from the Galactic plane in the
latitude belt |b| < 15◦. The fraction of survived events is about 80%. With these selections
more background cosmic rays than gamma-rays are rejected, implying an increase of the
sensitivity (Bartoli et al. 2013). These data have been used to measure the diffuse emission
from the regions of the Galactic plane of longitude 25◦ < l < 100◦ and 130◦ < l < 200◦.
Indeed the region 100◦ < l < 130◦ is excluded since in the high declination region δ > 60◦
the Galactic plane runs parallel to the right ascension axis and the contribution from the
signal could affect the background estimation. The excess of gamma-induced showers is
obtained following the procedure of the background estimation applied to the ARGO-YBJ

– 8 –
data as reported in Bartoli et al. (2011a, 2013). All data are divided into three pad groups,
20 < Npad ≤ 59, 60 ≤ Npad ≤ 99 and Npad ≥ 100. For each group of pad multiplicity both
the inner and the outer regions of the Galactic plane are divided into a grid of 0.1◦ × 0.1◦
bins and filled with the detected events according to their reconstructed arrival directions
(event map). The number of cosmic-ray background events (background map) is estimated
by using the direct integration method of Fleysher et al. (2004). The effect of cosmic-ray
anisotropy on the background evaluation has been estimated and corrected by applying the
normalization given in Bartoli et al. (2011a). This procedure is applied to each map bin us-
ing a surrounding region of 16◦ × 16◦ in which the estimated background is renormalized to
the detected events. The ±5◦ region around the Galactic plane and the 4◦×4◦/cos(b) region
around the Crab Nebula position are excluded from the normalization procedure. However,
since the diffuse gamma-ray emission extends to more than |b| = 5◦, its contribution causes
an overestimation of the correction related to the cosmic-ray anisotropy. This effect has
been evaluated using the latitude profile provided by the Fermi -LAT model for the diffuse
Galactic emission (see section 4) smeared out with the ARGO-YBJ point spread function
(PSF). A variation of 15% of this contribution implies on average a variation of the excess
of about 4%. To investigate the systematic errors related to the extension of the region used
to evaluate the anisotropy effect, the box size has been varied from 12◦ × 12◦ to 20◦ × 20◦
obtaining an excess variation of ∼10%. Both the event and background maps have been
smoothed with the PSF corresponding to each N pad interval. Then the background map has
been subtracted to the event map obtaining the event excess map. This map contains events
from true diffuse gamma-rays as well as from point and extended sources, whereas, due to the
background subtraction, the isotropic extragalactic emission is canceled out. Indeed, many
TeV gamma-ray sources of different extension lying on or close to the Galactic plane have
been detected in the longitude range 25◦ < l < 100◦. Source locations as given in the TeV-
Cat1 are excluded from the analysis. Faint sources (SNR G54.1+0.3, VER J2016+372, HESS
J1923+141 (W51) and HESS J1943+213) have not been masked. Their total contribution
to the diffuse flux at 1 TeV is estimated to be about 2.5%.
Taking into account the angular resolution of the detector and the extension of these
sources, the contribution from a region 4◦ × 4◦/cos(b) centered around each source location
has been removed. Some boxes include two sources, with the fainter one near its edge
(as for instance HESS J1849-000 and VER J2019+368). Sources distant less than 1◦.2,
as for instance HESS J1857+026 and HESS J1858+020, have been masked with a unique
box centered at the median point. The massive star-forming region of Cygnus X hosts the
extended cocoon, firstly observed by Fermi-LAT above 1 GeV (Ackermann et al. 2011),
1http://tevcat.uchicago.edu

– 9 –
whose emission at TeV energies has been recently assessed by ARGO-YBJ (Bartoli et al.
2014a). Due to its extension of about 2◦, this region has been masked with a box 6◦ ×
6◦/cos(b) centered on the source position found by ARGO-YBJ. The chosen dimensions of
these boxes is a compromise between a desired large excluded region, in order to minimize
the contamination from the sources, and the requirement of not reducing the statistics. With
this choice the solid angle of the region 25◦ < l < 100◦, |b| < 5◦ is reduced of about 22%.
The spillover from these sources outside the masked regions has been estimated by tracking
their path inside the FOV of ARGO-YBJ. The contamination is calculated bin by bin and
subtracted from the total excess in the 0◦.1× 0◦.1 bin event excess map. For ARGO J1839-
0627/HESS J1841-055, ARGO J1907+0627/MGRO J1908+06, and ARGO J2031+4157 (the
Cygnus cocoon) the fluxes measured by ARGO-YBJ have been considered (Bartoli et al.
2013, 2014a). Since the PSF broadens with decreasing energy, this contamination is found
higher for the first energy bin (corresponding to the group with 20 < Npad ≤ 59), with an
average value of 14%, while it is 21% in the Cygnus region 65◦ < l < 85◦.
4. Results
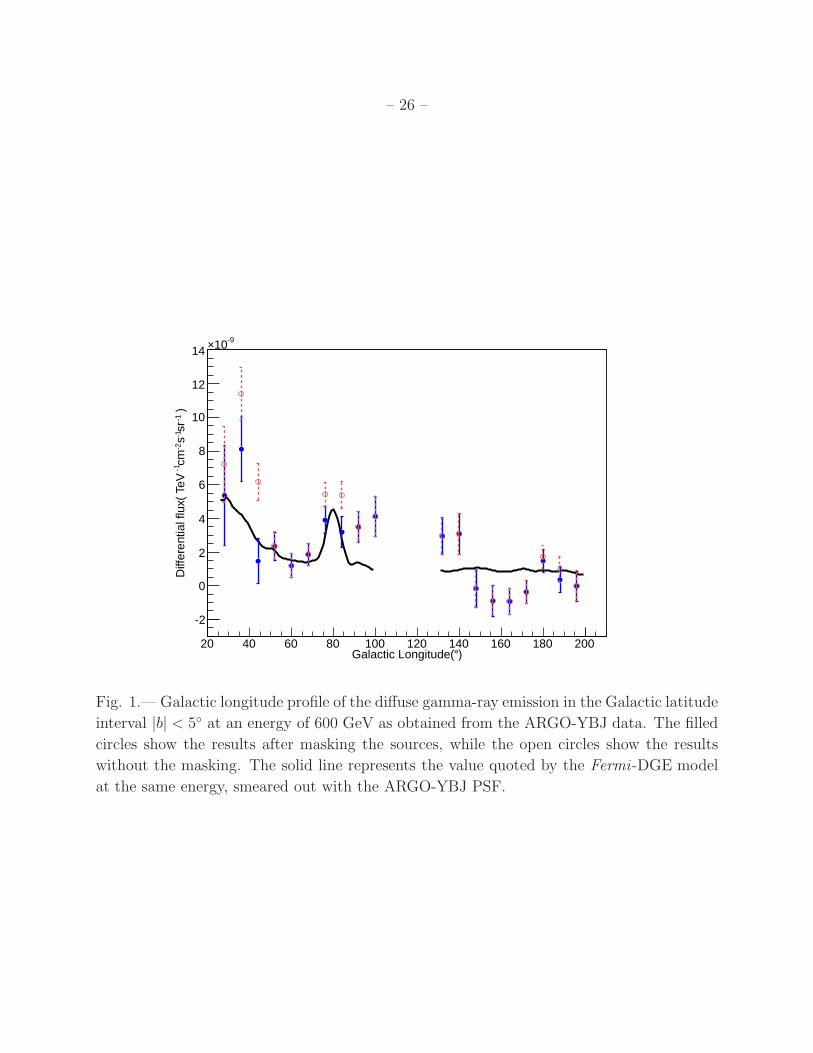
The Galactic longitude profile of the diffuse gamma-ray emission at 600 GeV in the
latitude belt |b| < 5◦ is shown in Fig. 1 by the filled circles. The profile obtained without
masking the sources is also plotted as the open circles. Each point represents the flux
obtained with the spectral analysis reported in Section 4.1 and averaged over 8◦ longitude
bins. The flux is evaluated taking into account all the events with N pad > 20. For each group
of pad multiplicity the event excess measured in each longitude bin is converted to a flux
using the effective areas estimated by means of a full Monte Carlo simulation of extensive
air showers (Heck et al. 1998) and of the RPC array (Guo et al. 2010). Then a spectral
analysis is carried out as described in Section 4.1. The negative fluxes which appear in the
outer Galaxy profile correspond to negative excess values in the event excess map. In this
case a spectral index -2.7 has been assumed. The significance of the excess measured in the
25◦ < l < 100◦ region is 6.9 s.d., while no excess is detected in the outer Galaxy region
130◦ < l < 200◦. Fig. 2 shows for |b| < 15◦ the Galactic latitude profile of the excess in bins
of 2◦. The filled circles show the results after masking the sources, while the open circles
show the results without masking. The continuous line in these plots represents the flux
at 600 GeV provided by the standard Fermi -LAT model for the diffuse Galactic emission
gal 2yearp7v6 v0.f its (hereafter Fermi -DGE) to which we refer for comparison with the
ARGO-YBJ data. This model, available at the Fermi Science Support Center2, has been
2http://fermi.gsfc.nasa.gov/ssc/data/access/lat/BackgroundModels.html

– 10 –
used to generate four Fermi -LAT Source Catalogs (Nolan et al. 2012; Ackermann et al. 2013;
Acero et al. 2013; Abdo et al. 2013). For the first time a diffuse flux measured by a ground-
based detector overlaps and can be compared with results from direct measurements. In
the region 25◦ < l < 100◦ we find a satisfactory general agreement between the ARGO-YBJ
data and the fluxes predicted by Fermi -DGE, mostly in the inner range 40◦ < l < 90◦. The
maximum deviations ≤2.5 s.d. are observed at three values outside this interval. In addition
to statistical fluctuations, systematic uncertainties related to the background evaluation,
imperfect modeling of the Galactic diffuse emission and other effects as, for instance, an
energy-dependent diffuse flux from unresolved sources, can contribute to this discrepancy.
The amount of such uncertainties is addressed in the next section, where the results of a
spectral analysis of the flux detected in this region are presented. In the following sections,
the spectral analyses concerning two selected subregions, 40◦ < l < 100◦ and 65◦ < l < 85◦,
and the upper limit to the diffuse flux in the outer Galaxy are reported and discussed.
4.1. The Galaxy Region 25◦ < l < 100◦, |b| < 5◦
The total number of shower events recorded in this region is 7.92× 10⁹. To carry out a
spectral analysis with a distribution of the number of events in excess as a function of N pad
we follow the method described in Aielli et al. (2010). Sampling events are generated by
simulations in the energy range from 10 GeV to 100 TeV assuming the spectral index of a
power law as a parameter and taking into account the detailed ARGO-YBJ detector response.
The fit to the data is made by comparing the measured excess in each pad multiplicity interval
with simulations. A differential spectral index -2.80±0.26 is found. The corresponding
median energies of the events recorded in the N pad intervals 20 < Npad ≤ 59, 60 ≤ Npad ≤
99, Npad ≥ 100 are 390 GeV, 750 GeV, and 1.64 TeV, respectively. Since the median
energies depend on the spectral index, these values are affected by an uncertainty of about
30%. This result is shown in Fig. 3 (dots). Upper limits from HEGRA, Whipple, and
Tibet ASγ experiments are also shown. The solid line represents the expectation according
to the Fermi -DGE model. This model is defined between 50 MeV and 600 GeV. Above
10 GeV the spectrum follows a power law with spectral index about -2.6 and has been
extended with the same slope to TeV energies as a guide for the eye (dashed line). The
Fermi -DGE model is based on template fits to the all sky gamma-ray data and includes
an Inverse Compton component generated by the GALPROP3 cosmic-ray propagation code
(Strong et al. 2000; Vladimirov et al. 2011). It arises from an accurate comparison of data
to the sum of many contributions including the ones from detected sources. It is not easy
3http://sourceforge.net/projects/galprop

– 11 –
to assess the uncertainty associated to the predictions of the model. In Ackermann et al.
(2012a) a grid of models is considered, which represents well the gamma-ray sky with an
agreement within 15% of the data, although various residuals at a ∼30% level are found,
both at small and large scales. Similar systematic errors are quoted in Macias & Gordon
(2014) and Gordon & Macias (2013) in an analysis concerning a very narrow region around
the Galactic center. Above 40 GeV the accuracy of the modeling is limited primarily by the
photon statistics and the diffuse emission has been derived by extrapolating the emissivities
measured at lower energies. The average systematic uncertainty at high energies is expected
to be greater than 10%, which is the systematics affecting the determination of the effective
area (Ackermann et al. 2012c). Two main systematic uncertainties can affect the ARGO-
YBJ flux estimate: one on the background and the other on the absolute scale energy. The
systematics on the background evaluation has been discussed in Section 3. The energy scale
reliability has been checked by studying the westward shift of the cosmic-ray shadow cast by
the Moon due to the geomagnetic field. At TeV energies the total absolute energy scale error
is less than 13% (Bartoli et al. 2011b) and the corresponding systematic error on the flux
normalization would be about 23%. Minor contributions to the systematic error come from
the uncertainty on the residual contamination of the masked sources, the ARGO-YBJ and
H.E.S.S. fluxes being quoted with about 30% systematic uncertainty (Bartoli et al. 2012b;
Aharonian et al. 2006b), from the uncertainty (<4%) on the detector efficiency and from the
systematic error of about 5% affecting the effective area estimate. We combine these various
errors in quadrature to obtain a total systematic error of ∼27%. The estimated ARGO-YBJ
flux at 1 TeV is (6.0 ± 1.3) × 10−10 TeV−1 cm−2 s−1 sr−1, 13% lower than the prediction
based on the Fermi -DGE extrapolation. Taking into account the whole uncertainties, we
deem the ARGO-YBJ data set consistent with the model predictions.
4.1.1. Treatment of the unresolved sources
However, it is worth noting that part of the detected signal could originate in faint
sources that are unresolved because of their low flux. Indeed, the Galactic region that we
are studying hosts many potential gamma-ray sources, mainly supernova remnants (SNRs)
and pulsar wind nebulae (PWNe). Shell-type SNRs and SNRs interacting with molecular
clouds form an established source class in VHE gamma-ray astronomy (Hinton & Hofmann
2009), although whether the nature of their emission is predominantly hadronic or lep-
tonic is still a matter of debate (Yuan et al. 2012; Volk & Berezhko 2013). The TeV flux
depends on the energy available for shock acceleration, on the distance and on many en-
vironmental parameters. The majority of the identified Galactic TeV sources are PWNe
(de Ona-Wilhelmi et al. 2013). Ninety Galactic PWNe and PWN candidates are reported

– 12 –
by Kargaltsev et al. (2013), of which 51 with VHE associations or possible VHE counter-
parts. The formation of a pulsar wind is still poorly understood and it is not known which
pulsars are able to drive PWNe and produce VHE radiation. In a PWN, the source of the
energy of the injected electrons is the pulsar spin-down luminosity. TeV PWNe detected
with the current instruments, at a sensitivity of about 2% of the Crab flux, are mainly as-
sociated with young and energetic pulsars with spin-down power E > 1035 erg s−1, showing
a TeV luminosity not significantly correlated with E (Kargaltsev et al. 2013; Klepser et al.
2013). On the other hand, as mentioned above, several energetic pulsars with prominent
X-ray PWNe are not detected at TeV energies, suggesting that environmental factors such
as, for instance, the local energy density of the ambient photon field or the intensity of the
magnetic field, are relevant for the evolution of TeV PWNe. The H.E.S.S. catalog4, which
reports the results of the Galactic plane survey in the longitude range −110◦ < l < 65◦,
lists 71 TeV sources, of which about 35% firmly associated with PWNe and 21% with SNRs.
Besides a few massive stellar clusters and some binary systems, a large fraction (about 31%)
remains unidentified, with ambiguous associations or without any plausible counterpart in
X-ray or radio (Carrigan et al. 2013). 15 TeV sources and candidate sources are recorded in
the 25◦ < l < 65◦, |b| < 3.5◦ Galactic region common to H.E.S.S. and ARGO-YBJ. They are
associated with PWNe or are unidentified, but many of them could be old PWNe, still bright
in high-energy gamma-rays, whose synchrotron emission is too faint to be detected in X-rays
(Kargaltsev et al. 2013; Acero et al. 2013). The ATNF catalog (v1.50, Manchester et al.
(2005)5) reports 321 radio-loud pulsars in this region. Taking into account the observational
selection effects, the number of predicted pulsars in the same Galactic region is 4169, while
inside 25◦ < l < 65◦, |b| < 5◦ is 46336. To obtain this prediction, we used the Galacto-
centric distribution (model C’) suggested by Lorimer et al. (2006). Therefore, the number
of TeV PWNe detected at the threshold of 2% of the Crab flux is a very tiny fraction of
the predicted number of their radio counterparts. An estimate of the contribution to the
measured diffuse emission from sources with lower fluxes would require a model of a full syn-
thetic population of PWNe based on H.E.S.S. and Fermi data and on the current theories
of PWN evolution (e.g., Bucciantini et al. (2011); Mayer et al. (2012); Torres et al. (2014)).
This study is beyond the scope of the present paper. However, in order to have an indication
of the effect of undetected sources, we can use the results obtained by Casanova & Dingus
(2008). Taking into account only the sources detected by H.E.S.S. above 6% of the Crab
flux, these authors determine the number-intensity relation dN/dS ∝ S−2, where S is the
4http://www.mpi-hd.mpg.de/hfm/HESS/pages/home/sources/
5http://www.atnf.csiro.au/research/pulsar/psrcat
6with 1.4 GHz luminosities above 0.1 mJy kpc2 and beaming towards us

– 13 –
source integral flux above 200 GeV, as expected for a uniform density distribution of sources
in a two-dimensional disk. Extrapolating this relation down to 2 mCrab flux and assuming
an average spectral index of -2.3 (Kargaltsev et al. 2013), we can estimate the cumulative
differential flux at 1 TeV as a function of the number N of unresolved sources with S in
the range 0.2%-2% of the Crab flux above 200 GeV (Aharonian et al. 2006b). As an ex-
ample, for N = 50 we obtain a contribution of about 9% to the diffuse flux measured by
ARGO-YBJ. This contribution depends linearly on N , but may be lower if the source count
distribution flattens at low fluxes. A similar exercise can be applied to SNRs. A study of
the contribution of unresolved shell-type SNRs is carried out by Volk & Berezhko (2013) to
explain the apparent excess of Fermi data at GeV energies in the inner Galaxy. We note
that the number of SNRs predicted in the 25◦ < l < 65◦, |b| < 5◦ is 69, using the radial
distribution of the surface density of shell SNRs given in Case & Bhattacharya (1998) and
the Galactic height distribution given in Xu et al. (2005).
However, these considerations do not settle definitively this matter. Indeed, the H.E.S.S.
survey extends only to l = 65◦ and in a latitude belt |b| < 3.5◦, and the sensitivity of the
instrument is reduced for extended sources. Twenty-two SNRs and 749 PSRs are predicted
in the region 65◦ < l < 100◦, |b| < 5◦. Apart from the Cygnus region observed firstly by
HEGRA (Aharonian et al. 2002) and then by the Whipple (Konopelko et al. 2007), MAGIC
(Albert et al. 2008) and VERITAS (Weinstein 2009; Aliu et al. 2013, 2014) telescopes, this
longitude interval has been surveyed only by Milagro (Atkins et al. 2004) and ARGO-YBJ
(Bartoli et al. 2013), the latter providing a study with a sensitivity of 24% Crab units. The
H.E.S.S. survey shows clearly a strong decrease of VHE gamma-ray sources moving toward
the outer Galaxy, however the presence of some isolated sources with fluxes below the ARGO-
YBJ sensitivity cannot be excluded. A single Crab-like source with 10% of the Crab flux gives
a 2% contribution at 1 TeV. The Milagro collaboration has found multi-TeV emission from
the direction of two gamma-ray pulsars (PSR J1928+1746 and PSR J2030+3641) detected
by Fermi -LAT (Abdo et al. 2014), corresponding to a total contribution of (7 ± 2)% to
the diffuse flux at 1 TeV. However, for one of these sources only a much lower upper limit
has been obtained by VERITAS, and the flux measured by Milagro might include some
additional diffuse emission.
The Fermi -LAT catalog of sources above 10 GeV 1FHL (Ackermann et al. 2013) pro-
vides a list of TeV candidates, stating that many of them should be detectable with the
current generation of ground-based instruments, but no candidate is found lying in the
Galactic region l = 85◦ to l = 100◦. In this paper the Fermi Collaboration presents a study
of the source populations above 10 GeV to infer the contribution of the resolved and unre-
solved sources to both high-latitude and low-latitude diffuse backgrounds. The method used
in Strong (2007), based on EGRET data with predictions for the Fermi -LAT, is adopted.

– 14 –
Therefore, the source count distribution for Galactic sources is modeled with a power law
luminosity function ∼ L−1.5 with given limits, and with a source distribution in Galactocen-
tric distance based on the model of Lorimer et al. (2006) for the pulsar distribution, taken
as representative of Galactic sources. An exponential scale height of 500 pc is assumed. The
simulated differential source count dN/dS is then compared with the observed flux distri-
bution of the 1FHL sources. Both the source density and the luminosity range are varied
to obtain alternative models. Thus they estimate that the contribution of sources below the
Fermi -LAT detection threshold of 5 × 10⁻¹⁰ photons cm−2 s−1 to the observed gamma-ray
intensity above 10 GeV at low latitudes (|b| < 10◦, all longitudes), is about 5%. This result
cannot be easily scaled to the TeV range in the Galactic region considered here. Never-
theless, it could suggest a small contribution from unresolved sources. Indeed, for source
emission extending to TeV energies with a spectral index of 2.3, the Fermi threshold flux at
10 GeV corresponds to a flux at 200 GeV about 1.5 times the threshold used in our study.
Moreover pulsars, which are not expected to contribute to the TeV flux (Abdo et al. 2013),
account for about half of the Galactic sources used in the Fermi estimate. A similar result
has been recently found at 1 GeV considering the Fermi -LAT third source catalog 3FGL
(Acero et al. 2015). In conclusion, we can assume that while the main contribution from
discrete sources has been removed, a residual contribution from unresolved sources could
still affect the measured fluxes.
The ARGO-YBJ data have been used to study the interval of this region, 40◦ < l < 100◦
(section 4.2), which is not rich in point or extended sources apart from the Cygnus cocoon,
and, in a separate analysis, the innermost part, 65◦ < l < 85◦ (section 4.3), which includes
the Cygnus region.
4.2. The Galaxy Region 40◦ < l < 100◦, |b| < 5◦
The total number of shower events collected in this region is 7.39× 10⁹. After masking
the discrete sources and subtracting the residual contribution, an excess with a statistical
significance of 6.1 s.d. above the background is found. The result of the spectral analysis
provides the flux at three median energies (350 GeV, 680 GeV, and 1.47 TeV, with uncer-
tainties of about 30%) as shown in Fig. 4 (dots). The fluxes measured by ARGO-YBJ below
1 TeV are ∼20% larger than what expected by the Fermi -DGE model, but are consistent
within the experimental uncertainties. Fitting the whole ARGO-YBJ data with a power law
we obtain a spectral index of -2.90±0.31 with a predicted flux at 1 TeV of (5.2±1.5)×10−10
TeV−1 cm−2 s−1 sr−1, compatible with the extrapolation of the Fermi -DGE model.
We have used these data to face the “TeV excess” anomaly associated to the Milagro

– 15 –
result concerning this Galactic region. In fact, in this region the Milagro detector made the
first measurement of the diffuse TeV gamma-ray flux from the Galactic plane (Atkins et al.
2005). The measured flux above 3.5 TeV is (6.8±1.5±2.2)×10−11 cm−2 s−1 sr−1, which, once
connected to the EGRET data with a power law with differential spectral index -2.6, reveals
a “TeV excess” in the diffuse gamma-ray spectrum, the corresponding flux being 5-10 times
higher than expected (Aharonian et al. 2008). In order to explain the enhanced gamma-ray
flux seen by Milagro, other contributions to the true diffuse flux have been envisaged and
discussed in Prodanovic et al. (2007), and include a harder cosmic-ray spectrum, additional
flux from unresolved sources, excess gamma-rays by inverse Compton scattering and photons
from dark matter annihilation. Using the Milagro data, we converted this integral flux
to the differential flux plotted in Fig. 4 (triangle). This flux is only 34% greater than
the value expected from the Fermi -DGE extrapolation, therefore within the experimental
uncertainties. Moreover, the Milagro result does not take into account the contributions from
the Cygnus cocoon and from the overlapping point or extended sources TeV J2032+4130,
VER J2019+407, and VER J2016+372. Minor contributions come also from the H.E.S.S.
sources. Following the ARGO-YBJ analysis of the Cygnus cocoon (Bartoli et al. 2014a) and
taking into account the width of the latitude band, we can evaluate the fraction of the total
flux generated by these sources. We find that the discrepancy between the Milagro results and
the Fermi -DGE predictions is almost canceled out. The full set of measurements obtained
with ground-based experiments is in agreement with direct observations by Fermi -LAT.
According to these results and taking into account that the Fermi -LAT data (Abdo et al.
2009a, 2010) do not support the high-intensity diffuse emission observed by EGRET (the
EGRET “GeV excess”), likely due to instrumental effects (Stecker et al. 2008), we rule out
the evidence of any “TeV excess” requiring additional sources or particle production processes
other than those responsible for the production of Galactic cosmic rays.
4.3. The Cygnus Region
The statistical significance of the excess found in the Galactic region 65◦ < l < 85◦,
|b| < 5◦ is 6.7 s.d. above the background. After masking the discrete sources and the Cygnus
cocoon and subtracting the residual contributions, an excess of 4.1 s.d. is left. This direction
points into our spiral arm at the Cygnus star-forming region hosting a giant molecular cloud
complex. Located at a distance of about 1.4 kpc, this region is rich in potential cosmic-ray
accelerators such as Wolf-Rayet stars, OB associations, and SNRs. Given its peculiarity, this
region has been the target of numerous multiwavelength observations, including the high-
energy measurements of Fermi -LAT (GeV) and Milagro (TeV). Fermi -LAT data have been
used to study the region of galactic coordinates 72◦ < l < 88◦, |b| < 15◦, where the bright

– 16 –
and extended cocoon has been observed. The spectral energy distribution of gamma-ray
emission is shown in Fig. 5 (filled stars) and includes different contributions from the diffuse
emission, point sources, and extended objects. A global model taking into account all the
components reproduces satisfactorily the experimental data and implies that the cosmic-
ray flux averaged over the scale of the whole Cygnus region is similar to that of the local
interstellar space. The expected energy spectrum according to the Fermi -DGE model in the
same spatial region is shown for comparison (dot-dashed line).
This region also received considerable attention by Cherenkov telescopes and air shower
arrays that have discovered VHE emission from point and extended sources. Recently, the
ARGO-YBJ experiment observed the TeV counterpart of the Fermi cocoon (Bartoli et al.
2014a). In this paper a short summary of the previous observations at TeV energies is also
reported.
Exploiting its wide FOV, the Milagro telescope measured the diffusion emission at Galac-
tic longitudes 65◦ < l < 85◦ (Abdo et al. 2007a). The first paper reports the flux in the
latitude band |b| < 3◦ at a median energy of 12 TeV. In a following paper (Abdo et al. 2008),
more data have been added and a more refined analysis is applied evaluating the flux at a
median energy of 15 TeV in the region with 65◦ < l < 85◦, |b| < 2◦, as reported (filled
triangle) in Fig. 5. The measured flux is twice the predictions based on the GALPROP code
optimized to reproduce the EGRET data. This excess has been attributed to the interaction
with the interstellar medium of hard-spectrum cosmic rays generated by local sources. For
comparison, we show (dashed line) the expected energy spectrum for this region according to
the Fermi -DGE model, not available at that time. The discrepancy is reduced, the Milagro
flux being about 75% higher than the Fermi template, but enough to suggest the presence
of an excess. The flux measured by ARGO-YBJ at median energies 440 GeV, 780 GeV, and
1.73 TeV (with uncertainties of about 40%) and averaged over the latitude band |b| < 5◦
is shown with dots. The three points can be fitted with a power law with spectral index
-2.65±0.44. The estimated flux at 1 TeV is (6.2±1.8)×10−10 TeV−1 cm−2 s−1 sr−1, resulting
about 10% lower than the Fermi -DGE extrapolation. These data do not show any excess at
energies around 1 TeV, corresponding to the excess found by Milagro at an average energy
of 15 TeV. One possible explanation of this discrepancy is that the contribution of all the
discrete gamma-ray sources was not completely removed from the Milagro data. Indeed, the
exclusion of discrete sources is of crucial importance. According to the ARGO-YBJ data,
the flux at 1 TeV injected by the cocoon is of the same order as the diffuse emission flux.
An alternative explanation could be considered if the spectrum measured in the Cygnus
region is compared with that measured in the complementary part of the 25◦ < l < 100◦
region. Adding the data from the regions 25◦ < l < 65◦ and 85◦ < l < 100◦, we found an

– 17 –
excess of 5.6 s.d. above the background. The measured spectrum has an index -2.89±0.33,
while the estimated flux at 1 TeV is (6.0 ± 1.7) × 10−10 TeV−1 cm−2 s−1 sr−1. Thus there
is an indication that the spectrum of the diffuse emission in the Cygnus region could be
harder than that in the complementary part of the 25◦ < l < 100◦ longitude interval.
Assuming that there is actually a difference, a plausible explanation is that the region of
about 500 pc around the Cygnus cocoon is more abundant of cosmic rays accelerated by
a nearby source, which produces also the TeV emission from the cocoon, whose spectrum
has not yet been steepened by diffusion (Aharonian & Atoyan 1996; Gabici et al. 2009).
These runaway cosmic rays may diffuse to a characteristic length of a few hundred parsecs
(Casanova et al. 2010) and interact with the local gas producing gamma-rays with the same
spectral shape via π0 decay. In fact, since the hadronic interactions at multi-TeV energies
are basically scale-invariant and TeV photons are not attenuated by the interstellar radiation
fields (Moskalenko et al. 2006), the gamma-ray spectrum is expected to mimic the cosmic-
ray spectrum. This interpretation assumes a hadronic origin of the gamma-ray emission
from the cocoon as discussed in Bartoli et al. (2014a). In this scenario, the region around
the cocoon is expected to contain a mixture of ordinary background cosmic rays and young
cosmic rays with a harder spectrum, released first from the source, which diffuse fastly and
reach a distance depending upon many factors as the injection history of the source, the
diffusion coefficient and the interstellar gas density. Thus, the diffuse gamma-ray emission
may consist of two distinct components produced by these two cosmic-ray populations which
have different spatial extension and different spectral shape. The superposition of these two
components may produce concave spectra at TeV energies (Gabici et al. 2009), accounting
for the Milagro result in case there is a residual excess after removing all the source contri-
butions. An interesting application of these concepts is given in Casanova et al. (2010). The
ARGO-YBJ data do not allow the study of this phenomenology. Accurate measurements
of the diffuse gamma-ray emission at TeV energies on an angular scale of a few degrees are
necessary. Future experiments with higher angular resolution and large FOV, such as HAWC
(Abeysekara et al. 2013) and LHAASO (Cao et al. 2010), are expected to probe the spatial
distribution of the photon flux at TeV energies, providing a detailed map of the diffuse
gamma-ray emission in this region. They will also benefit of the CTA (Actis et al. 2011)
survey, expected to detect very faint discrete sources, thus providing information useful to
separate the genuine diffuse emission.
The hadronic origin of the gamma-ray emission from the cocoon can be also probed
searching for an excess of GeV-TeV neutrinos over the atmospheric neutrino background
from the Cygnus cocoon (Tchernin et al. 2013; Gonzalez-Garcia et al. 2014). Interestingly,
the energy spectrum of the light component (protons plus Helium nuclei) of the primary
cosmic rays from a few TeV to 700 TeV measured by ARGO-YBJ (Bartoli et al. 2012a) and

– 18 –
by the hybrid experiment ARGO-WFCTA (Bartoli et al. 2014b) follows the same spectral
shape as that found in the Cygnus region. A precise comparison of the spectrum of young
cosmic rays, as those supposed in the Cygnus region, with the spectrum of old cosmic rays
resident in other places of the Galactic plane, could help to determine the distribution of the
sources of the cosmic rays observed at Earth.
4.4. Outer Galaxy
No excess has been measured in the outer Galaxy region 130◦ < l < 200◦, |b| < 5◦
(after masking the Crab Nebula). Assuming a spectral index -2.7 the median energy of all
the events with N pad > 20 is 700 GeV. The corresponding upper limit at 99% confidence
level (C.L.) results 5.7 × 10⁻¹⁰ TeV−1 cm−2 s−1 sr−1 and is shown in Fig. 6, where the
limits obtained at higher energies by the Tibet ASγ (3 and 10 TeV) and Milagro (15 TeV)
experiments are also reported. The Fermi -DGE flux and its extrapolation are shown for
comparison. The ARGO-YBJ upper limit is compatible with the Fermi model, providing
an useful constraint to the Galactic diffuse emission around 1 TeV.
5. Summary and conclusions
We analyzed the data recorded by ARGO-YBJ over more than five years for a total
live time of 1670.45 days, with the aim of measuring the diffuse gamma-ray emission at TeV
energies in the Galactic region visible from the Northern Hemisphere. After the application
of appropriate selection criteria, 6.407 × 10¹⁰ high-quality events are found in the Galactic
latitude belt |b| < 15◦. These events have been used to measure the gamma-ray diffuse
emission in the two Galactic regions 25◦ < l < 100◦, |b| < 5◦ and 130◦ < l < 200◦,
|b| < 5◦ accessible to the experiment. Fluxes and spectral indexes measured by ARGO-YBJ
in these Galactic regions are reported in Table 1. The standard ARGO-YBJ procedure for
background subtraction has been applied, including a suitable approach to correct for cosmic-
ray anisotropy. Great care has been taken in removing the emission from known gamma-ray
sources by masking out the brightest of them and subtracting the residual contributions. An
excess of 6.9 s.d. above the background is observed in the innermost region 25◦ < l < 100◦,
|b| < 5◦, which has been the target of a detailed analysis since the pioneering Milagro
observations at multi-TeV energies have shown significant deviations from the predictions
based on conventional models of diffuse gamma-ray emission. As a reference for our results
we used the recent Fermi model for diffuse emission extrapolating it to the TeV region.
Firstly, we have studied the region 40◦ < l < 100◦, where a “TeV excess” in the diffuse

– 19 –
gamma-ray spectrum has been suggested. The ARGO-YBJ data have been analyzed to
derive the differential flux at three median energies around 1 TeV. Fitting these points with
a power law, we found a spectrum steeper than the Fermi -DGE extrapolation, with index
-2.90±0.31, however consistent to within 1 s.d.. The large error on the spectral index is
due to the short lever arm of these data and to the poor statistics affecting the highest
energy point. The average flux is compatible with the Fermi -DGE extrapolation within the
statistical and systematic uncertainties. After subtracting the contribution of the gamma-
ray sources detected later on and thus not taken into account, also the flux measured by
Milagro at 3.5 TeV is compatible with the Fermi -DGE extrapolation. Therefore, we cannot
confirm the existence of any excess at TeV energies.
Table 1: Diffuse Gamma-ray emission from the Galactic plane for |b| < 5◦.
l Intervals Significance Spectral Index Energy (GeV) Fluxa
25◦ < l < 100◦ 6.9 s.d. −2.80± 0.26 390 8.06± 1.49
750 1.64± 0.43
1640 0.13± 0.05
1000b 0.60± 0.13
40◦ < l < 100◦ 6.1 s.d. −2.90± 0.31 350 10.94± 2.23
680 2.00± 0.60
1470 0.14± 0.08
1000b 0.52± 0.15
65◦ < l < 85◦ 4.1 s.d. −2.65± 0.44 440 5.38± 1.70
780 1.13± 0.60
1730 0.15± 0.07
1000b 0.62± 0.18
25◦ < l < 65◦ & 5.6 s.d. −2.89± 0.33 380 9.57± 2.18
85◦ < l < 100◦ 730 1.96± 0.59
1600 0.12± 0.07
1000b 0.60± 0.17
130◦ < l < 200◦ -0.5 s.d. – – < 5.7c
Note. The median energies and the corresponding differential fluxes are reported. The errors
are only statistical.aIn units of 10−9 TeV−1 cm−2 s−1 sr−1.bThis entry gives the result of the fit to the three data points.c99% C.L. at 700 GeV.
A specific study of the Cygnus region (65◦ < l < 85◦) is motivated by the Milagro
results showing, at energies >10 TeV, a strong enhancement of the diffuse flux with respect

– 20 –
to the model predictions, suggesting the existence of powerful young accelerators as sources
of hard-spectrum cosmic rays. Indeed, following the Fermi -LAT discovery of the Cygnus
cocoon at GeV energies, a TeV counterpart has been reported by ARGO-YBJ, providing
an intense flux of TeV photons. The ARGO-YBJ results on diffuse emission around 1 TeV
do not exhibit any excess when compared to the Fermi data at lower energies, suggesting
that the tail of the cocoon flux above 10 TeV and other contributions from discrete sources
not completely removed from data could explain the excess found by Milagro. The ARGO-
YBJ measurements cover the energy range from about 400 GeV - 2 TeV and follow a power
law with spectral index -2.65±0.44, a value very close to that found for TeV emission from
the Cygnus cocoon (Bartoli et al. 2014a). Thus the spectrum appears flatter than the one
found in the whole region 25◦ < l < 100◦ once the Cygnus region is excluded. Indeed, in
the combined region 25◦ < l < 65◦ plus 85◦ < l < 100◦ the spectral analysis provides an
index -2.89±0.33. These measurements are affected by large errors and their difference has
a marginal statistical significance.
The diffuse gamma-ray flux measured by ARGO-YBJ can provide useful hints to con-
strain models of Galactic origin of the high-energy neutrino excess reported by the Ice-
Cube Collaboration (Aartsen et al. 2013). The origin of this excess above the atmospheric
neutrino background is unknown. Scenarios invoking an extragalactic origin are favored
(Ahlers & Halzen 2014). Alternative models envisaging different possibilities for the Galac-
tic neutrino sources have been proposed (Ahlers & Murase 2014). One of these assumes that
the TeV-PeV diffuse gamma-ray emission from the Galactic plane and at least part of the
neutrino IceCube excess are produced via the same mechanism, that is, the interaction of
cosmic rays with the interstellar medium. With this conjecture a clear connection between
the gamma-ray and neutrino fluxes from the Galactic plane can be established. The TeV-
PeV gamma-ray emission should provide a good estimate for the 100 TeV neutrino signal
along the whole Galactic plane. Recent papers have addressed this scenario (Neronov et al.
2014; Ahlers & Murase 2014; Fox et al. 2013). The fluxes measured by ARGO-YBJ (see
Table 1) add a firm estimate to the available current data. However, only upper limits are
known for the high-energy diffuse gamma-ray emission (see Introduction), limiting the ca-
pability to draw firm conclusions. Future gamma-ray observatories as LHAASO (Cao et al.
2010) and HISCORE (Tluczykont et al. 2012) will operate with high sensitivity up to PeV
energies. The whole set of TeV-PeV data and an increased statistics of the neutrino signal
from a deeper IceCube exposure are expected to confirm or rule out the model of a neutrino
diffuse emission from the Galactic plane.
In conclusion, the ARGO-YBJ results concerning the diffuse emission at TeV energies
in the 25◦ < l < 100◦, |b| < 5◦ Galactic region are in agreement with the extrapolation of the
Fermi -DGE model, implying that the questions raised by the Milagro observations can be

– 21 –
answered by taking into account the emission of TeV photons from the Cygnus cocoon and,
to a minor extent, from discrete sources. A spectral analysis of the data has been carried
out, showing an energy spectrum softer than that of the Fermi -DGE model, but consistent
within 1 s.d.. On the other hand, the TeV flux averaged over the Cygnus region 65◦ < l < 85◦
shows a marginal evidence of a harder spectrum, indicating the possible presence of young
cosmic rays coming from a nearby source. Only an upper limit has been set to the diffuse
emission in the outer Galaxy region 130◦ < l < 200◦, |b| < 5◦, but compatible with the
extrapolation of the Fermi -DGE model.
This work is supported in China by NSFC (No.10120130794, No.11205165), the Chinese
Ministry of Science and Technology, the Chinese Academy of Sciences, the Key Laboratory
of Particle Astrophysics, CAS, and in Italy by the Istituto Nazionale di Fisica Nucleare
(INFN).
We also acknowledge the essential supports of W.Y. Chen, G. Yang, X.F. Yuan, C.Y.
Zhao, R. Assiro, B. Biondo, S. Bricola, F. Budano, A. Corvaglia, B. D’Aquino, R. Esposito,
A. Innocente, A. Mangano, E. Pastori, C. Pinto, E. Reali, F. Taurino and A. Zerbini, in the
installation, debugging and maintenance of the detector.
REFERENCES
Aartsen M. G., Abbasi R., Abdou Y. et al 2013 Sci 342 1242856
Abdo, A. A., Allen, B., Berley, D., et al. 2007a, ApJL, 658, L33
Abdo, A. A., Allen, B., Aune, T., et al. 2008, ApJ, 688, 1078
Abdo, A. A., Ackermann, M., Ajello, M., et al. 2009a, PhRvL, 103, 251101
Abdo, A. A., Ackermann, M., Ajello, M., et al. 2010, ApJ, 710, 133
Abdo, A. A., Ajello, M., Allafort, A., et al. 2013, ApJS, 208, 17
Abdo, A. A., Abeysekara, A. U., Allen, B. T., et al. 2014, APh, 57, 16
Abeysekara, A. U., Alfaro, R., Alvarez, C., et al. 2013, APh, 50, 26
Abramowski, A., Aharonian, F., Ait Benkhali, F., et al. 2014, PhRvD, 90, 122007
Acero, F., Ackermann, M., Ajello, M., et al. 2013, ApJ, 773, 77

– 22 –
Acero, F., Ackermann, M., Ajello, M., et al. 2015, ApJS, in press (arXiv:1501.02003)
Ackermann, M., Ajello, M., Allafort, A., et al. 2011, Sci, 334, 1103
Ackermann, M., Ajello, M., Atwood, W. B., et al. 2012a, ApJ, 750, 3
Ackermann, M., Ajello, M., Allafort, A., et al. 2012b, A&A, 538, A71
Ackermann, M., Ajello, M., Albert, A., et al. 2012c, ApJS, 203, 4
Ackermann, M., Ajello, M., Allafort, A., et al. 2013, ApJS, 209, 34
Actis, M., Agnetta, G., Aharonian, F., et al. 2011, ExA, 32, 193
Aglietta, M., Alessandro, B., Arneodo, F., et al. 1992, ApJ, 397, 148
Aharonian, F. A., & Atoyan, A. M. 1996, A&A 309, 917
Aharonian, F. A., Akhperjanian, A. G., Barrio, J. A., et al. 2001, A&A, 375, 1008
Aharonian, F., Akhperjanian, A., Beilicke, M., et al. 2002, A&A, 393, L37
Aharonian, F., Akhperjanian, A. G., Bazer-Bachi, A. R., et al. 2006a, Natur, 439, 695
Aharonian, F. A., Akhperjanian, A. G., Bazer-Bachi, A. R., et al. 2006b, ApJ, 636, 777
Aharonian, F. A., Buckley, J., Kifune, T., & Sinnis, G. 2008, RPPh, 71, 096901
Ahlers, M., & Halzen, F. 2014, arXiv:1406.2160
Ahlers, M., & Murase, K. 2014, Phys. ReV. D, 90, 023010
Aielli, G., Assiro, R., Bacci, C., et al. 2006, NIMPA, 562, 92
Aielli, G., Bacci, C., Barone, F., et al. 2008, APh, 30, 85
Aielli, G., Bacci, C., Bartoli, B., et al. 2009a, APh, 30, 287
Aielli, G., Bacci, C., Bartoli, B., et al. 2009b, NIMPA, 608, 246
Aielli, G., Bacci, C., Bartoli, B., et al. 2010, ApJL, 714, L208
Aielli, G., Bacci, C., Bartoli, B., et al. 2012, NIMPA, 661, S56
Albert, J., Aliu, E., Anderhub, H., et al. 2008, ApJL, 675, L25
Aliu, E., Archambault, S., Arlen, T., et al. 2013, ApJ, 770, 93

– 23 –
Aliu, E., Aune, T., Behera, B., et al. 2014, ApJ, 783, 16
Amenomori, M., Ayabe, S., Cui, S. W., et al. 2006, AdSpR, 37, 1932
Atkins, R., Benbow, W., Berley, D., et al. 2004, ApJ, 608, 680
Atkins, R., Benbow, W., Berley, D., et al. 2005, PhRvL, 95, 251103
Bartoli, B., Bernardini, P., Bi, X. J., et al. 2011a, ApJ, 734, 110
Bartoli, B., Bernardini, P., Bi, X. J., et al. 2011b, PhRvD, 84, 022003
Bartoli, B., Bernardini, P., Bi, X. J., et al. 2012a, PhRvD, 85, 092005
Bartoli, B., Bernardini, P., Bi, X. J., et al. 2012b, ApJL, 745, L22
Bartoli, B., Bernardini, P., Bi, X. J., et al. 2013, ApJ, 779, 27
Bartoli, B., Bernardini, P., Bi, X. J., et al. 2014a, ApJ, 790, 152
Bartoli, B., Bernardini, P., Bi, X. J., et al. 2014b, ChPhC, 38, 045001
Bartoli, B., Bernardini, P., Bi, X. J., et al. 2015, ApJ, 798, 119
Bi, X.J, Zhang, J., and Yuan,Q., 2008, Phys. Rev. D, 78, 043001
Borione, A., Catanese, M. A., Chantell, M. C., et al. 1998, ApJ, 493, 175
Bucciantini, N., Arons, J., & Amato, E. 2011, MNRAS, 410, 381
Cao, Z., et al. 2010, Chin. Phys. C, 34, 249
Carrigan, S., Brun, F., Chaves, R. C. G., et al. 2013, in Proc. 48th Rencontres de Moriond,
Very High Energy Phenomena in the Universe, ed. E. Aug et al. (La Thuile: ARISF),
95
Casanova, S., & Dingus, B. L. 2008, APh, 29, 63
Casanova, S., Jones, D. I., Aharonian, F. A., et al. 2010, PASJ, 62, 1127
Case, G. L., & Bhattacharya, D. 1998, ApJ, 504, 761
de Ona-Wilhelmi, E., Rudak, B., Barrio, J. A., et al. 2013, Astropart. Phys., 43, 287
Fleysher, R., Fleysher, L., Nemethy, P., Mincer, A. I., & Haines, T. J. 2004, ApJ, 603, 355
Fox, D. B., Kashiyama, K., & Meszaros, P. 2013, ApJ, 774, 74
– 24 –
Gabici, S., Aharonian, F. A., & Casanova, S. 2009, MNRAS, 396, 1629
Gonzalez-Garcia, M. C., Halzen, F. D. & Niro, V., 2014, Astropart. Phys., 57, 39
Gordon, C., & Macias, O. 2013, Phys. Rev. D, 88, 083521
Guo, Y. Q., Zhang, X. Y., Zhang, J. L., et al. 2010, ChPhC, 34, 555
Haungs, A., Antoni, T., Apel, W. D., et al. 2006, NuPhS, 151, 167
He, H. H., Bernardini, P., Calabrese Melcarne, A. K., & Chen, S. Z. 2007, Astropart. Phys.,
27, 528
Heck, D., Knapp, J., Capdevielle, J. N., Schatz, G., & Thouw, T. 1998, Forschungszentrum
Karlsruhe Report No. FZKA 6019
Hinton, J. A., & Hofmann, W. 2009, Ann. Rev. Astron. Astrophys., 47, 523
Hunter, S. D., Bertsch, D. L., Catelli, J. R., et al. 1997, ApJ, 481, 205
Kargaltsev, O., Rangelov, B., & Pavlov, G. G. 2013, arXiv:1305.2552
Klepser, S., Carrigan, S., de On-Wilhelmi, E., et al. 2013, in Proc. 33rd ICRC,
arXiv:1307.7905
Kniffen, D. A., & Fichtel, C. E. 1981, ApJ, 250, 389
Konopelko, A., Atkins, R. W., Blaylock, G., et al. 2007, ApJ, 658, 1062
LeBohec, S., Bond, I. H., Bradbury, S. M., et al. 2000, ApJ, 539, 209
Lorimer, D. R., Faulkner, A. J., Lyne, A. G., et al. 2006, MNRAS, 372, 777
Macias, O., & Gordon, C. 2014, PhRvD, 89, 063515
Manchester, R. N., Hobbs, G. B., Teoh, A., & Hobbs, M. 2005, AJ, 129, 1993
Mayer, M., Brucker, J., Holler, M., et al. 2012, arXiv:1202.1455
Moskalenko, I. V., Strong, A. W., Reimer, O., 2004, “Cosmic Gamma-Ray Sources”, Edited
by K.S. Cheng & G.E. Romero, Astrophysics and Space Science Library, Vol. 304, p.
279 (arXiv:astro-ph/0402243)
Moskalenko, I. V., Porter, T. A., Strong, A. W. 2006, ApJ, 640, 155
Neronov, A., Semikoz, D., & Tchernin, C. 2014, Phys. ReV. D, 89, 103002

– 25 –
Nolan, P. L., Abdo, A. A., Ackermann, M., et al. 2012, ApJS, 199, 31
Porter, T. A. & Protheroe, R. J. 1997, Journ. Phys. G: Nucl. Part. Phys., 23, 1765
Prodanovic, T., Fields, B. D. & Beacom, J.F., 2007, Astropart. Phys., 27, 10
Stecker, F. W., Hunter, S. D. & Kniffen, D. A., 2008, Astropart. Phys., 29, 25
Strong, A. W., Bloemen, J. B. G. M., Lebrun, F., et al. 1987, A&AS, 67, 283
Strong, A. W., Moskalenko, I.V., & Reimer, O. 2000, ApJ, 537, 763
Strong, A. W., Moskalenko, I.V., & Reimer, O. 2004, ApJ, 613, 962
Strong, A. W. 2007, Ap&SS, 309, 35
Strong, A. W. 2011, Proc. of the 12th ICATPP Conference, arXiv:1101.1381
Tchernin, C., Aguilar, J. A., Neronov, A., & Montaruli, T. 2013, A&A, 560, A67
Tluczykont, M., et al. 2012, Nucl. Instrum. Meth. A, 692, 246
Torres, D. F., Cillis, A., Martin, J., & de On-Wilhelmi, E. 2014, JHEAp, 1, 31
Vladimirov, A. E., Digel, S. W., Jhannesson, G., et al. 2011, CoPhC, 182, 1156
Volk, H. J., & Berezhko, E. G. 2013, ApJ, 777, 149
Weinstein, A. 2009, Proc. Fermi Symposium, arXiv:0912.4492
Xu, J., Zhang X., & Han J. 2005, Chinese Journ. Astron. Astrophys. 5, 165
Yuan, Q., Liu, S. M., & Bi X. J. 2012, ApJ, 761, 133
Zhang, J., et al. 2010, ApJ, 720, 9
This preprint was prepared with the AAS LATEX macros v5.2.
– 26 –
)°Galactic Longitude(20 40 60 80 100 120 140 160 180 200
)-1
sr-1 s
-2cm
-1D
iffer
entia
l flu
x( T
eV
-2
0
2
4
6
8
10
12
14-910×
Fig. 1.— Galactic longitude profile of the diffuse gamma-ray emission in the Galactic latitude
interval |b| < 5◦ at an energy of 600 GeV as obtained from the ARGO-YBJ data. The filled
circles show the results after masking the sources, while the open circles show the results
without the masking. The solid line represents the value quoted by the Fermi -DGE model
at the same energy, smeared out with the ARGO-YBJ PSF.

– 27 –
)°Galactic Latitude(-15 -10 -5 0 5 10 15
)-1
sr-1 s
-2cm
-1D
iffer
entia
l flu
x (
TeV
-1
0
1
2
3
4
5
6
7
8-910×
Fig. 2.— Galactic latitude profile of the diffuse gamma-ray emission in the Galactic longitude
interval 25◦ < l < 100◦ at an energy of 600 GeV as obtained from the ARGO-YBJ data.
The filled circles show the results after masking the sources, while the open circles show the
results without the masking. The solid line represents the value quoted by the Fermi -DGE
model at the same energy, smeared out with the ARGO-YBJ PSF.

– 28 –
Energy(TeV)
-510 -410 -310 -210 -110 1 10 210
)-1
sr-1 s
-2dN
/dE
(TeV
cm
2E
-1010
-910
-810
-710
ARGO-YBJ
EGRET
Whipple
HEGRA
γTibet AS
ARGO-YBJ
EGRET
Fig. 3.— The energy spectrum of the diffuse gamma-ray emission measured by ARGO-YBJ
in the Galactic region 25◦ < l < 100◦, |b| < 5◦ (dots). The solid line shows the flux in
the same region according to the Fermi -DGE model. The short-dashed line represents its
extension following a power law with spectral index -2.6. The EGRET results (squares) in
the same Galactic region 25◦ < l < 100◦, |b| < 5◦ and the upper limits quoted by HEGRA
(99% C.L., 38◦ < l < 43◦, |b| < 2◦), Whipple (99.9% C.L., 38.5◦ < l < 41.5◦, |b| < 2◦) and
Tibet ASγ (99%C.L., 20◦ < l < 55◦, |b| < 2◦) are also shown.

– 29 –
Energy(TeV)
-510 -410 -310 -210 -110 1 10 210
)-1
sr-1 s
-2dN
/dE
(TeV
cm
2E
-1010
-910
-810
-710
ARGO-YBJ
Milagro
EGRET
ARGO-YBJ
Milagro
EGRET
ARGO-YBJ
Milagro
EGRET
Fig. 4.— Energy spectrum of the diffuse gamma-ray emission measured by ARGO-YBJ in
the Galactic region 40◦ < l < 100◦, |b| < 5◦ (dots). The solid line shows the flux in the same
region according to the Fermi -DGE model. The short-dashed line represents its extension
following a power law with spectral index -2.6. The EGRET results (squares) in the same
Galactic region 40◦ < l < 100◦, |b| < 5◦ and the flux measurement by Milagro (triangle) in
the same region are also shown.

– 30 –
Energy(TeV)
-510 -410 -310 -210 -110 1 10 210
)-1
sr-1 s
-2dN
/dE
(TeV
cm
2E
-1010
-910
-810
-710
ARGO-YBJFermi-LATMilagroEGRET
ARGO-YBJFermi-LATMilagroEGRET
ARGO-YBJFermi-LATMilagroEGRET
Fig. 5.— Energy spectrum of the diffuse gamma-ray emission measured by ARGO-YBJ in
the Galactic region 65◦ < l < 85◦, |b| < 5◦ (dots). The solid line shows the flux according
to the Fermi -DGE model. The short-dashed line represents its extension following a power
law with spectral index -2.6. The EGRET results (squares) in the same region are also
shown. The Milagro result (triangle) for the Galactic region 65◦ < l < 85◦, |b| < 2◦ is also
given. The long-dashed line and its extension (short-dashed line) represent the flux in this
region according to the Fermi -DGE model. The spectral energy distribution of gamma-ray
emission measured by Fermi -LAT in the Galactic region 72◦ < l < 88◦, |b| < 15◦ is also
reported (stars). The flux in the same region expected from the Fermi -DGE model is shown
as a dot-dashed line.

– 31 –
Energy(TeV)
-510 -410 -310 -210 -110 1 10 210
)-1
sr-1 s
-2dN
/dE
(TeV
cm
2E
-1110
-1010
-910
-810
-710
ARGO-YBJγTibet AS
Milagro
EGRET
Fig. 6.— The 99% C.L. upper limit at a median energy of 700 GeV as obtained by ARGO-
YBJ for the Galactic region 130◦ < l < 200◦, |b| < 5◦. The solid line shows the flux in
the same region according to the Fermi -DGE model. The short-dashed line represents its
extension following a power law with spectral index -2.6. The EGRET results (squares) in
the same region are also shown. For comparison, the upper limits from the Milagro (95%
C.L., 136◦ < l < 216◦, |b| < 2◦) and Tibet ASγ (99% C.L., 140◦ < l < 225◦, |b| < 2◦)
experiments are also reported.