AREMA Gradations Affecting Ballast Performance Using Discrete Element Modeling DEM Approach
12
AREMA Gradations Affecting Ballast Performance Using Discrete Element Modeling (DEM) Approach Tutumluer, E., Huang, H., Hashash, Y.M.A., and Ghaboussi, J. University of Illinois at Urbana-Champaign Abstract: This paper evaluates the different AREMA gradations currently in use for their effects on both ballast void space and load carrying performances using a discrete particle analysis computational technique called Discrete Element Modeling (DEM). The effect of gradation on aggregate assembly volumetric properties was first studied. Full-scale ballast layers with common gradations listed in AREMA specifications for main line railroads were generated using the University of Illinois ballast DEM model BLOKS3D program. Repeated train loading was applied to the different ballast gradation characteristic curves to investigate the adequacy of drainage and structural performances by means of comparing settlements occurred after certain volume of traffic. More uniformly gradated aggregate assemblies generally had larger air voids thus better drainage. However, such uniform particles at certain sizes might tend to dilate under loading thus creating an unstable ballast particle packing and void structure. Associated deformations predicted from the DEM simulations also showed that generally more uniformly graded ballast produced larger accumulations of permanent deformation with repeated load application. The denser AREMA No.24 gradation was found to resist the most the ballast settlement. Furthermore, the settlement could be minimized by engineering the gradations for denser packing towards the maximum density line. However, there is a limiting gradation line on a maximum density plot beyond which an aggregate assembly could not gain more settlement resistance. At such a gradation, it is also possible to maintain large enough void space for proper drainage. Therefore, the DEM findings identified differences in current ballast specifications in terms of drainage and structural support as well as provided new insight into optimizing ballast layer aggregate gradations for better railroad track performances. Key words: Railroad track, ballast gradation, void ratio, settlement, Discrete Element Modeling Introduction Railroad ballast is uniformly-graded coarse aggregate placed between and immediately underneath the crossties. The purpose of ballast is to provide drainage and structural support for the heavy loading applied by trains. Aggregate particle shape and size distribution (gradation) are two major considerations in ballasted railroad track design. Superior ballast aggregate shape properties such as by an angular crushed stone have been proven to be critical for ballast strength and stability. Yet, impacts of different AREMA gradations on functional performance of ballast have not been fully explored. Such an investigation of proper ballast gradation design should require large enough voids for providing adequate drainage. At the same time, load carrying through contacting aggregate particles or structural performance should not be compromised. By adjusting the percentages of aggregates at different sizes, ballast gradations can be optimized at the microstructure level for maximum void space and adequate structural performance. © AREMA 2009 ®
-
Upload
lester-the-nightfly -
Category
Documents
-
view
21 -
download
1
description
Gradations Affecting Ballast Performance using DEM
Transcript of AREMA Gradations Affecting Ballast Performance Using Discrete Element Modeling DEM Approach
AREMA Gradations Affecting Ballast Performance Using Discrete Element Modeling (DEM) Approach Tutumluer, E., Huang, H., Hashash, Y.M.A., and Ghaboussi, J. University of Illinois at Urbana-Champaign Abstract: This paper evaluates the different AREMA gradations currently in use for their effects on both ballast void space and load carrying performances using a discrete particle analysis computational technique called Discrete Element Modeling (DEM). The effect of gradation on aggregate assembly volumetric properties was first studied. Full-scale ballast layers with common gradations listed in AREMA specifications for main line railroads were generated using the University of Illinois ballast DEM model BLOKS3D program. Repeated train loading was applied to the different ballast gradation characteristic curves to investigate the adequacy of drainage and structural performances by means of comparing settlements occurred after certain volume of traffic. More uniformly gradated aggregate assemblies generally had larger air voids thus better drainage. However, such uniform particles at certain sizes might tend to dilate under loading thus creating an unstable ballast particle packing and void structure. Associated deformations predicted from the DEM simulations also showed that generally more uniformly graded ballast produced larger accumulations of permanent deformation with repeated load application. The denser AREMA No.24 gradation was found to resist the most the ballast settlement. Furthermore, the settlement could be minimized by engineering the gradations for denser packing towards the maximum density line. However, there is a limiting gradation line on a maximum density plot beyond which an aggregate assembly could not gain more settlement resistance. At such a gradation, it is also possible to maintain large enough void space for proper drainage. Therefore, the DEM findings identified differences in current ballast specifications in terms of drainage and structural support as well as provided new insight into optimizing ballast layer aggregate gradations for better railroad track performances. Key words: Railroad track, ballast gradation, void ratio, settlement, Discrete Element Modeling Introduction Railroad ballast is uniformly-graded coarse aggregate placed between and immediately underneath the crossties. The purpose of ballast is to provide drainage and structural support for the heavy loading applied by trains. Aggregate particle shape and size distribution (gradation) are two major considerations in ballasted railroad track design. Superior ballast aggregate shape properties such as by an angular crushed stone have been proven to be critical for ballast strength and stability. Yet, impacts of different AREMA gradations on functional performance of ballast have not been fully explored. Such an investigation of proper ballast gradation design should require large enough voids for providing adequate drainage. At the same time, load carrying through contacting aggregate particles or structural performance should not be compromised. By adjusting the percentages of aggregates at different sizes, ballast gradations can be optimized at the microstructure level for maximum void space and adequate structural performance.
© AREMA 2009 ®

Gradation is a term to describe the size and size distribution of a granular media. It is usually expressed as a relationship (gradation curve) between size and percentage by weight of particles smaller than that size. Gradation is one of the most influential aggregate characteristics in determining how aggregates will perform in a constructed structural layer. In bound Hot Mix Asphalt (HMA) layers, aggregate gradation influences almost every important property including stiffness, permeability, workability, and resistance to moisture damage (Roberts et al., 1996). Just recently, Vavrik (2000) proposed a new HMA gradation design called the Bailey method that adequately characterized HMA voids and compaction characteristics for improved performance. In Portland Cement Concrete (PCC), gradation impacts durability, porosity, and aggregate to cement bond strength through surface area characteristics of different aggregate sizes. Extensive research has been conducted on the optimization of aggregate packing in the concrete industry (Shilstone, 1990; Roy et al., 1993; de Larrard and Sedran, 1994; and Goltermann et al., 1997). A study by University of Wisconsin researchers has shown that with an optimized aggregate gradation an increase in concrete strength of 10 to 20 percent could be achieved (Goltermann et al., 1997). They also noticed decreased segregation after extended vibration, which leads to quality construction and long performance life. The air voids of compacted aggregate ranged from 32% to 41% depending on the gradation (Goltermann et al., 1997). For continuously graded sand, air voids are typically 33% to 38% (Powers, 1964). Previous research efforts mainly focused identifying relationships between the aggregate density and the gradation. For example, analytical models exist for evaluating the densities resulting from combining two different sizes (binary packing) of spherical particles; those with spherical particle diameter ratios (small diameter divided by large diameter) below 0.22 and those with spherical particle diameter ratios above 0.22 (Johansen and Anderson, 1990). Toufar et al. (1976) indicated that the smaller particles, in the case of the diameter ratios greater than 0.22, would be too large to fit in the interstices between the large particles. Such models directly deal with aggregate particle sizes and packing orders to dictate density and air void content of a granular assembly. Railroad ballast is often designed using uniformly graded material to mainly satisfy the drainage requirement. However, uniformly graded aggregates may tend to be structurally less stable due to larger air voids and possibly yield more settlement than continuously or densely graded materials. A good ballast design needs to consider both void space and structural stability. In this paper, an image-aided Discrete Element Modeling (DEM) approach is used to investigate the effect of aggregate gradation on the assembly volumetric properties. Structural performance of ballast with different gradations will be evaluated by comparing the settlement potentials under repeated train loading. Maximum Density and Characteristic Gradation Curves It is usually assumed that the “preferred” gradation is one that produces the maximum density which creates more particle-to-particle contact and thus increases the structural stability. For railroad ballast, maximizing the density will obviously minimize the function of drainage. Nevertheless, maximum density gradation still provides a datum to start with.
© AREMA 2009 ®
A widely used equation to describe a maximum density gradation was developed by Fuller and Thompson (1907) which, sometimes, is also referred to as Talbot Equation. The basic equation is:
1 where: “p” is the percentage finer than the size; “d” is the aggregate size being considered; “D” is the maximum aggregate size;
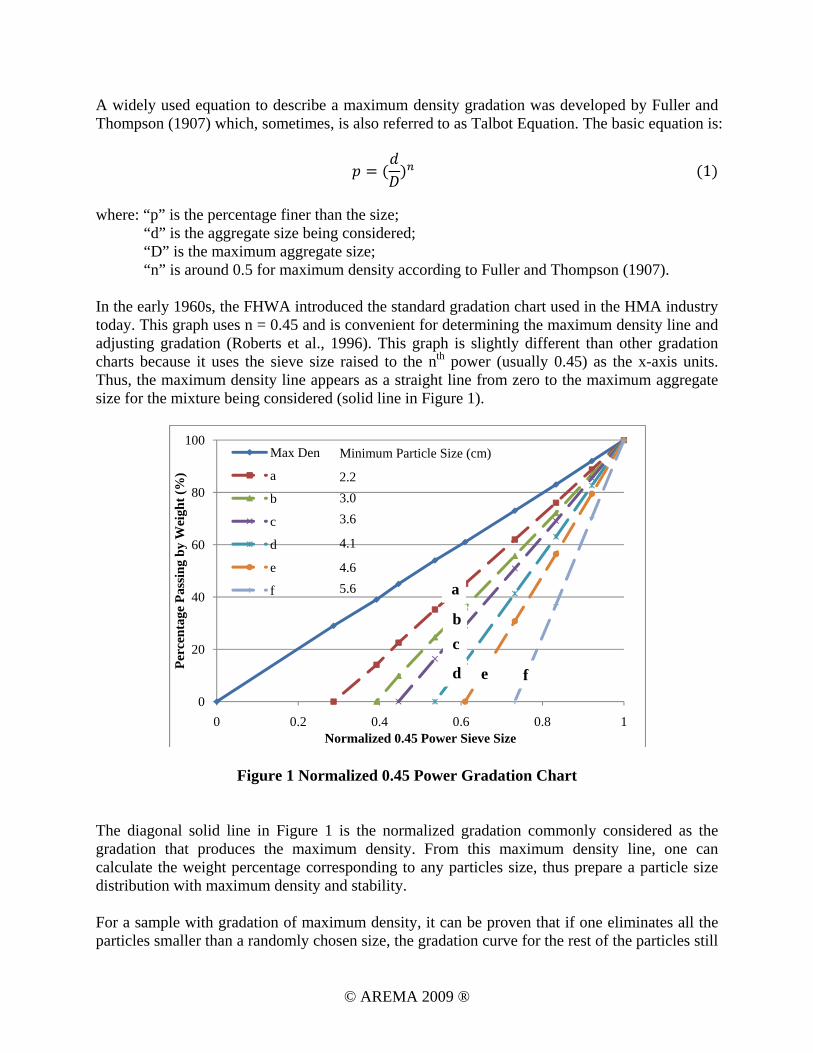
“n” is around 0.5 for maximum density according to Fuller and Thompson (1907). In the early 1960s, the FHWA introduced the standard gradation chart used in the HMA industry today. This graph uses n = 0.45 and is convenient for determining the maximum density line and adjusting gradation (Roberts et al., 1996). This graph is slightly different than other gradation charts because it uses the sieve size raised to the nth power (usually 0.45) as the x-axis units. Thus, the maximum density line appears as a straight line from zero to the maximum aggregate size for the mixture being considered (solid line in Figure 1).
Figure 1 Normalized 0.45 Power Gradation Chart The diagonal solid line in Figure 1 is the normalized gradation commonly considered as the gradation that produces the maximum density. From this maximum density line, one can calculate the weight percentage corresponding to any particles size, thus prepare a particle size distribution with maximum density and stability. For a sample with gradation of maximum density, it can be proven that if one eliminates all the particles smaller than a randomly chosen size, the gradation curve for the rest of the particles still
0
20
40
60
80
100
0 0.2 0.4 0.6 0.8 1
Perc
enta
ge P
assi
ng b
y W
eigh
t (%
)
Normalized 0.45 Power Sieve Size
Max Den
a
b
c
d
e
f a
bc
d e f
Minimum Particle Size (cm)
2.2 3.0 3.6
4.1
4.6 5.6
© AREMA 2009 ®
remains a straight line plotted in the 0.45 power chart. However, depending on the minimum size chosen, the gradation line will have different slopes in the 0.45 power gradation chart (dashed lines in Figure 1). The slope of the gradation line increases with increasing of the minimum size (see minimum particle sizes listed in Figure 1). In other words, the aggregate sample becomes more uniformly graded when the positive slope of the gradation line increases. These gradation lines with different minimum particle sizes are named as “characteristic gradation curves” in this paper. Their effects on aggregate assembly volumetric properties and the structural layer support characteristics will be further investigated in the following section.
Commonly Used Ballast Gradations
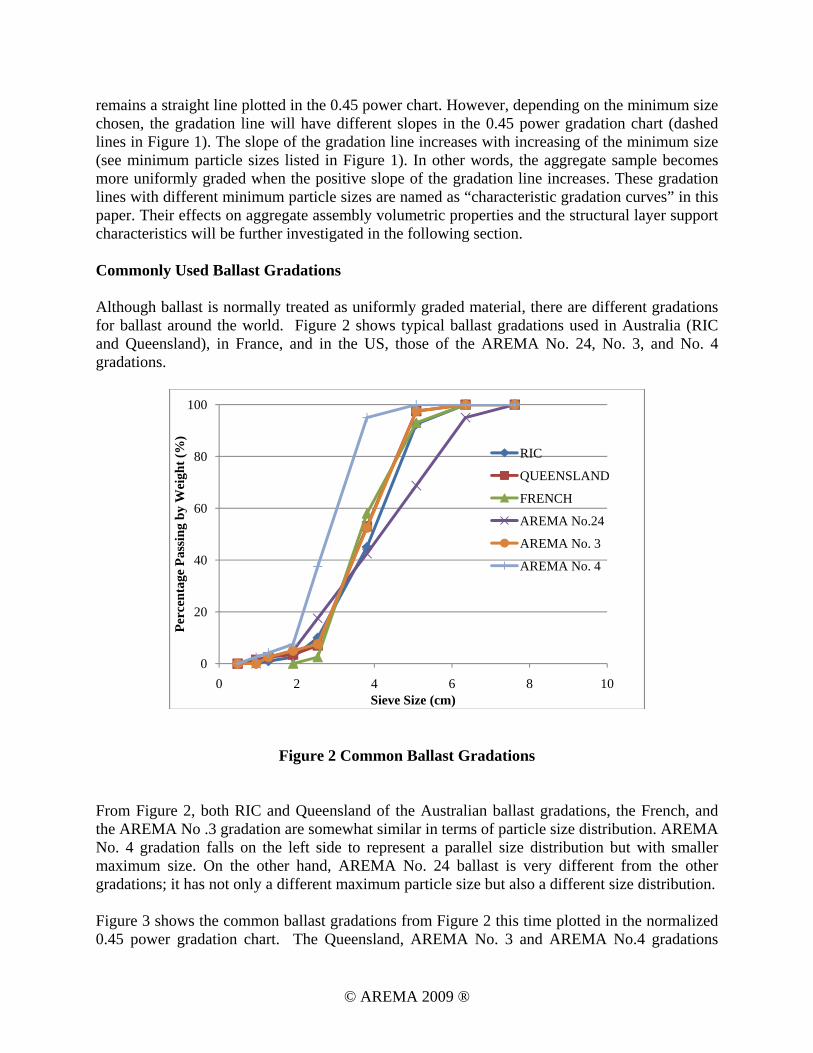
Although ballast is normally treated as uniformly graded material, there are different gradations for ballast around the world. Figure 2 shows typical ballast gradations used in Australia (RIC and Queensland), in France, and in the US, those of the AREMA No. 24, No. 3, and No. 4 gradations.
Figure 2 Common Ballast Gradations
From Figure 2, both RIC and Queensland of the Australian ballast gradations, the French, and the AREMA No .3 gradation are somewhat similar in terms of particle size distribution. AREMA No. 4 gradation falls on the left side to represent a parallel size distribution but with smaller maximum size. On the other hand, AREMA No. 24 ballast is very different from the other gradations; it has not only a different maximum particle size but also a different size distribution. Figure 3 shows the common ballast gradations from Figure 2 this time plotted in the normalized 0.45 power gradation chart. The Queensland, AREMA No. 3 and AREMA No.4 gradations
0
20
40
60
80
100
0 2 4 6 8 10
Perc
enta
ge P
assi
ng b
y W
eigh
t (%
)
Sieve Size (cm)
RIC
QUEENSLAND
FRENCH
AREMA No.24
AREMA No. 3
AREMA No. 4
© AREMA 2009 ®
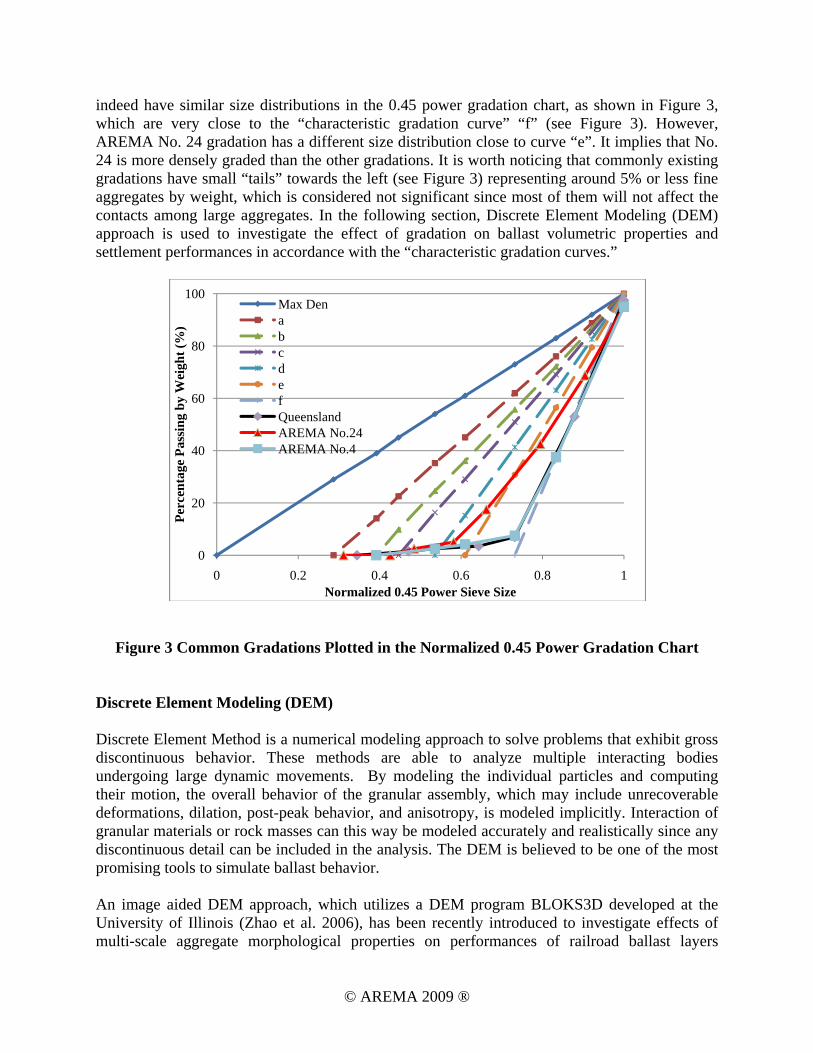
indeed have similar size distributions in the 0.45 power gradation chart, as shown in Figure 3, which are very close to the “characteristic gradation curve” “f” (see Figure 3). However, AREMA No. 24 gradation has a different size distribution close to curve “e”. It implies that No. 24 is more densely graded than the other gradations. It is worth noticing that commonly existing gradations have small “tails” towards the left (see Figure 3) representing around 5% or less fine aggregates by weight, which is considered not significant since most of them will not affect the contacts among large aggregates. In the following section, Discrete Element Modeling (DEM) approach is used to investigate the effect of gradation on ballast volumetric properties and settlement performances in accordance with the “characteristic gradation curves.”
Figure 3 Common Gradations Plotted in the Normalized 0.45 Power Gradation Chart
Discrete Element Modeling (DEM) Discrete Element Method is a numerical modeling approach to solve problems that exhibit gross discontinuous behavior. These methods are able to analyze multiple interacting bodies undergoing large dynamic movements. By modeling the individual particles and computing their motion, the overall behavior of the granular assembly, which may include unrecoverable deformations, dilation, post-peak behavior, and anisotropy, is modeled implicitly. Interaction of granular materials or rock masses can this way be modeled accurately and realistically since any discontinuous detail can be included in the analysis. The DEM is believed to be one of the most promising tools to simulate ballast behavior. An image aided DEM approach, which utilizes a DEM program BLOKS3D developed at the University of Illinois (Zhao et al. 2006), has been recently introduced to investigate effects of multi-scale aggregate morphological properties on performances of railroad ballast layers
0
20
40
60
80
100
0 0.2 0.4 0.6 0.8 1
Perc
enta
ge P
assi
ng b
y W
eigh
t (%
)
Normalized 0.45 Power Sieve Size
Max DenabcdefQueenslandAREMA No.24AREMA No.4
© AREMA 2009 ®
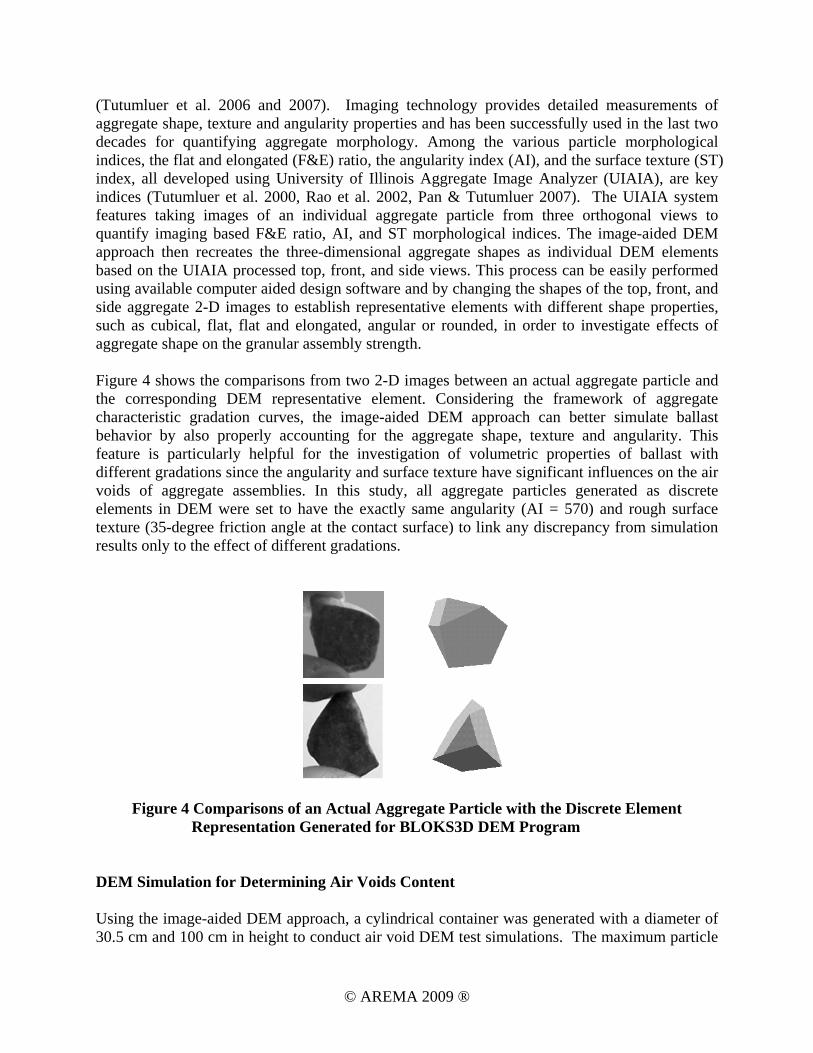
(Tutumluer et al. 2006 and 2007). Imaging technology provides detailed measurements of aggregate shape, texture and angularity properties and has been successfully used in the last two decades for quantifying aggregate morphology. Among the various particle morphological indices, the flat and elongated (F&E) ratio, the angularity index (AI), and the surface texture (ST) index, all developed using University of Illinois Aggregate Image Analyzer (UIAIA), are key indices (Tutumluer et al. 2000, Rao et al. 2002, Pan & Tutumluer 2007). The UIAIA system features taking images of an individual aggregate particle from three orthogonal views to quantify imaging based F&E ratio, AI, and ST morphological indices. The image-aided DEM approach then recreates the three-dimensional aggregate shapes as individual DEM elements based on the UIAIA processed top, front, and side views. This process can be easily performed using available computer aided design software and by changing the shapes of the top, front, and side aggregate 2-D images to establish representative elements with different shape properties, such as cubical, flat, flat and elongated, angular or rounded, in order to investigate effects of aggregate shape on the granular assembly strength. Figure 4 shows the comparisons from two 2-D images between an actual aggregate particle and the corresponding DEM representative element. Considering the framework of aggregate characteristic gradation curves, the image-aided DEM approach can better simulate ballast behavior by also properly accounting for the aggregate shape, texture and angularity. This feature is particularly helpful for the investigation of volumetric properties of ballast with different gradations since the angularity and surface texture have significant influences on the air voids of aggregate assemblies. In this study, all aggregate particles generated as discrete elements in DEM were set to have the exactly same angularity (AI = 570) and rough surface texture (35-degree friction angle at the contact surface) to link any discrepancy from simulation results only to the effect of different gradations.
Figure 4 Comparisons of an Actual Aggregate Particle with the Discrete Element Representation Generated for BLOKS3D DEM Program DEM Simulation for Determining Air Voids Content Using the image-aided DEM approach, a cylindrical container was generated with a diameter of 30.5 cm and 100 cm in height to conduct air void DEM test simulations. The maximum particle
© AREMA 2009 ®
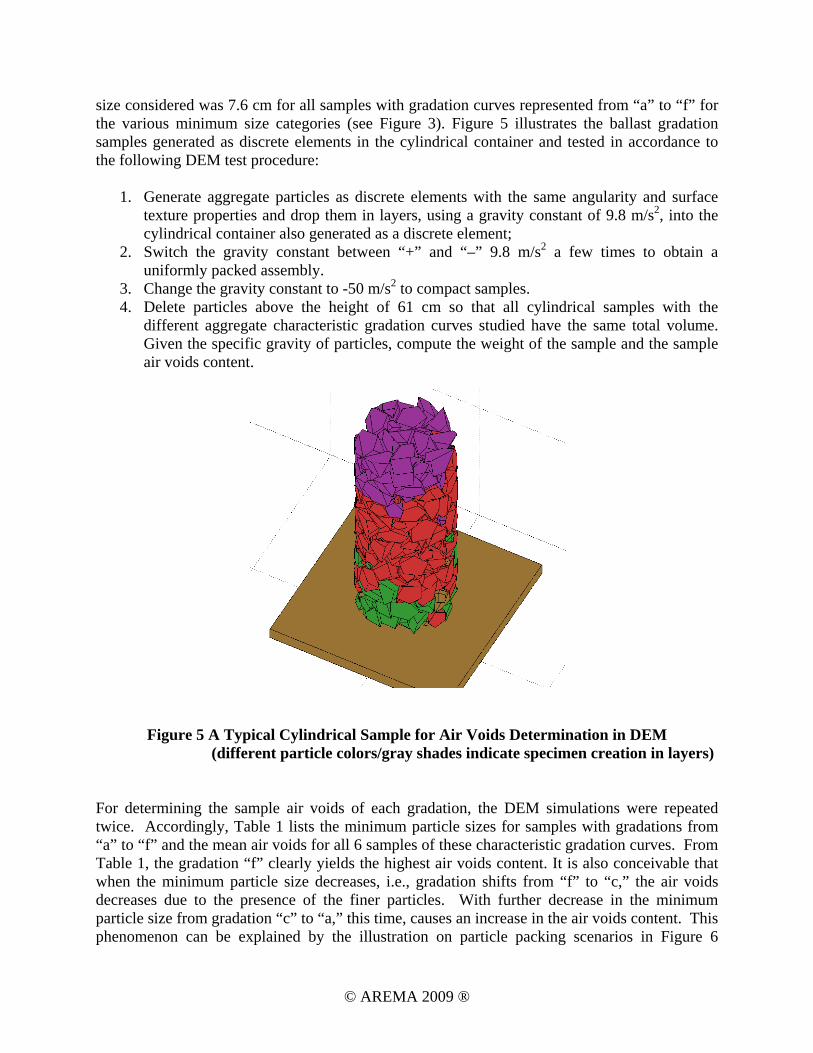
size considered was 7.6 cm for all samples with gradation curves represented from “a” to “f” for the various minimum size categories (see Figure 3). Figure 5 illustrates the ballast gradation samples generated as discrete elements in the cylindrical container and tested in accordance to the following DEM test procedure:
1. Generate aggregate particles as discrete elements with the same angularity and surface texture properties and drop them in layers, using a gravity constant of 9.8 m/s2, into the cylindrical container also generated as a discrete element;
2. Switch the gravity constant between “+” and “–” 9.8 m/s2 a few times to obtain a uniformly packed assembly.
3. Change the gravity constant to -50 m/s2 to compact samples. 4. Delete particles above the height of 61 cm so that all cylindrical samples with the
different aggregate characteristic gradation curves studied have the same total volume. Given the specific gravity of particles, compute the weight of the sample and the sample air voids content.
Figure 5 A Typical Cylindrical Sample for Air Voids Determination in DEM (different particle colors/gray shades indicate specimen creation in layers) For determining the sample air voids of each gradation, the DEM simulations were repeated twice. Accordingly, Table 1 lists the minimum particle sizes for samples with gradations from “a” to “f” and the mean air voids for all 6 samples of these characteristic gradation curves. From Table 1, the gradation “f” clearly yields the highest air voids content. It is also conceivable that when the minimum particle size decreases, i.e., gradation shifts from “f” to “c,” the air voids decreases due to the presence of the finer particles. With further decrease in the minimum particle size from gradation “c” to “a,” this time, causes an increase in the air voids content. This phenomenon can be explained by the illustration on particle packing scenarios in Figure 6
© AREMA 2009 ®
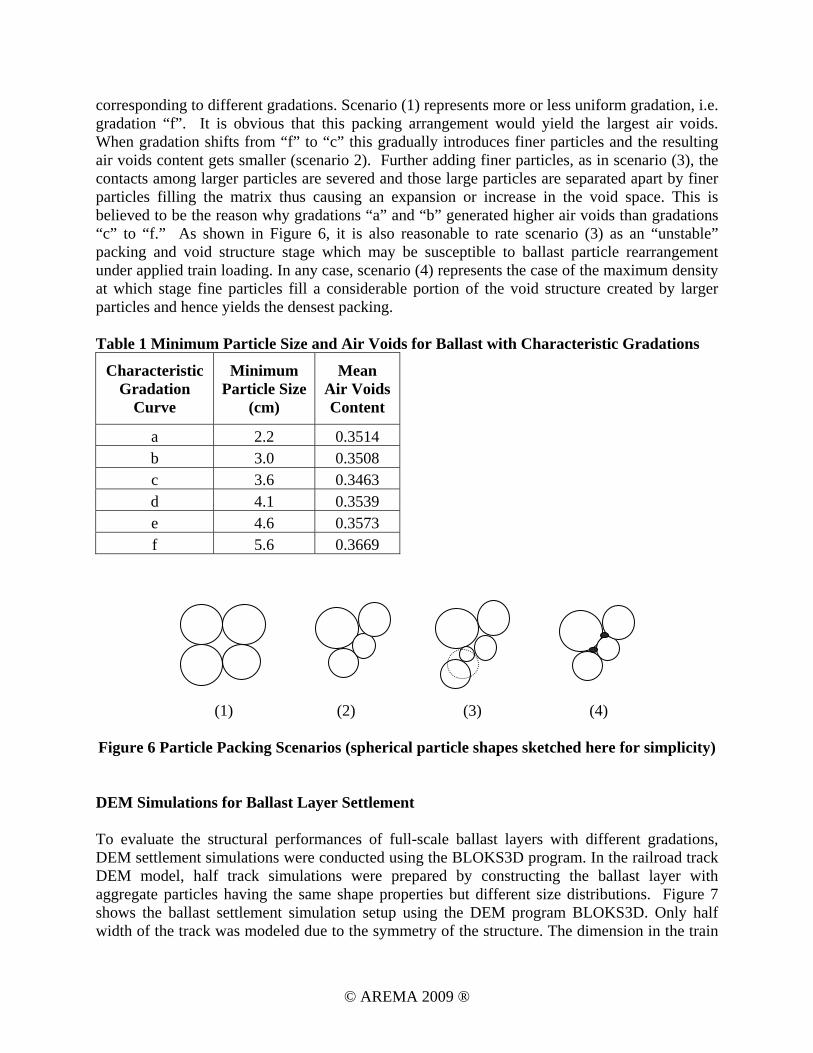
corresponding to different gradations. Scenario (1) represents more or less uniform gradation, i.e. gradation “f”. It is obvious that this packing arrangement would yield the largest air voids. When gradation shifts from “f” to “c” this gradually introduces finer particles and the resulting air voids content gets smaller (scenario 2). Further adding finer particles, as in scenario (3), the contacts among larger particles are severed and those large particles are separated apart by finer particles filling the matrix thus causing an expansion or increase in the void space. This is believed to be the reason why gradations “a” and “b” generated higher air voids than gradations “c” to “f.” As shown in Figure 6, it is also reasonable to rate scenario (3) as an “unstable” packing and void structure stage which may be susceptible to ballast particle rearrangement under applied train loading. In any case, scenario (4) represents the case of the maximum density at which stage fine particles fill a considerable portion of the void structure created by larger particles and hence yields the densest packing. Table 1 Minimum Particle Size and Air Voids for Ballast with Characteristic Gradations
Characteristic Gradation
Curve
Minimum Particle Size
(cm)
Mean Air Voids Content
a 2.2 0.3514 b 3.0 0.3508 c 3.6 0.3463 d 4.1 0.3539 e 4.6 0.3573 f 5.6 0.3669
(1) (2) (3) (4)
Figure 6 Particle Packing Scenarios (spherical particle shapes sketched here for simplicity)
DEM Simulations for Ballast Layer Settlement To evaluate the structural performances of full-scale ballast layers with different gradations, DEM settlement simulations were conducted using the BLOKS3D program. In the railroad track DEM model, half track simulations were prepared by constructing the ballast layer with aggregate particles having the same shape properties but different size distributions. Figure 7 shows the ballast settlement simulation setup using the DEM program BLOKS3D. Only half width of the track was modeled due to the symmetry of the structure. The dimension in the train
© AREMA 2009 ®
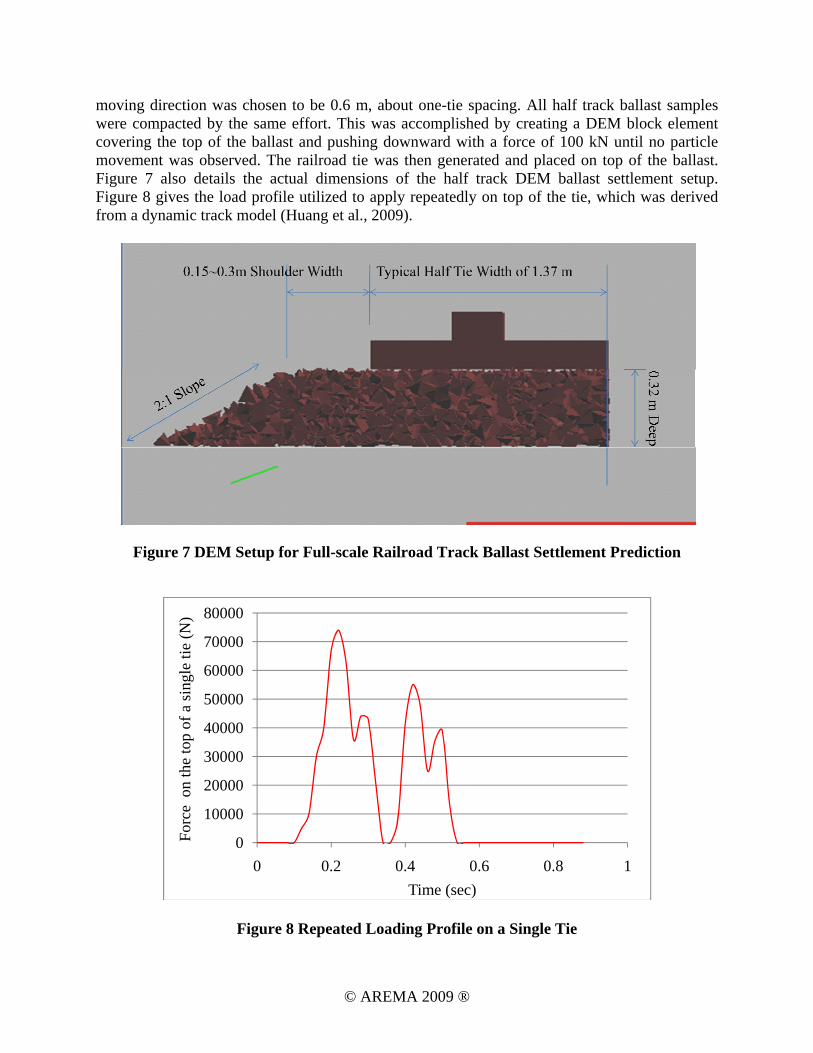
moving direction was chosen to be 0.6 m, about one-tie spacing. All half track ballast samples were compacted by the same effort. This was accomplished by creating a DEM block element covering the top of the ballast and pushing downward with a force of 100 kN until no particle movement was observed. The railroad tie was then generated and placed on top of the ballast. Figure 7 also details the actual dimensions of the half track DEM ballast settlement setup. Figure 8 gives the load profile utilized to apply repeatedly on top of the tie, which was derived from a dynamic track model (Huang et al., 2009).
Figure 7 DEM Setup for Full-scale Railroad Track Ballast Settlement Prediction
Figure 8 Repeated Loading Profile on a Single Tie
0
10000
20000
30000
40000
50000
60000
70000
80000
0 0.2 0.4 0.6 0.8 1
Forc
e o
n th
e to
p of
a si
ngle
tie
(N)
Time (sec)
© AREMA 2009 ®

Figure 9 shows the settlement predictions of the six different ballast characteristic gradation samples graphed with repeated loading cycles. Note that gradation “d” yields the least amount of settlement after 300 cycles of repeated loading. When gradation becomes more uniform, i.e., as it moves from “d” to “f,” the ballast produces more and more settlement. It is interesting to note that the ballast with gradation “c” has more or less the same settlement as the ballast with gradation “d.” On the other hand, the ballast layers with gradations “a” and “b” clearly yield higher settlements than the settlement from gradation “d” and have less structural support. This result is consistent with the volumetric properties reported previously. Hence, gradation curve “c” falls at the performance boundary with its minimum particle size of 3.6 cm (see Table 1) beyond which ballast may become structurally inadequate and prone to settlement.
Figure 9 Settlement for Ballast with Different Gradations
AREMA No. 3, AREMA No. 4, and Queensland gradations currently in use happen to be similar to the characteristic gradation curve “f” (see Figures 2 and 3). Likewise, AREMA No. 24 gradation currently in use closely resembles the characteristic gradation curve “e” (see Figures 2 and 3). Therefore, the settlement performances of these gradations can be also deduced from the DEM simulation findings highlighted in Figure 9. Accordingly, AREMA No. 24 gradation is expected to yield the least amount of settlement. Having said that, it is also possible to further engineer AREMA ballast gradation specifications based on the DEM simulation results and
0.000
0.005
0.010
0.015
0.020
0.025
0.030
0.035
0 100 200 300 400
Sett
lem
ent (
m)
Loading cycle
abcdef
© AREMA 2009 ®
possibly improve the structural support and resistance to settlement by changing the gradations towards the characteristic gradation curve “d” (see Figure 3). Conclusions This paper investigated the effect of gradation on ballast settlement using an image-aided Discrete Element Modeling (DEM) approach. Mechanical behavior of ballast layers with different aggregate gradations, including those of AREMA gradations currently in use, was simulated using a full-scale track DEM model. Following the concept of 0.45-power maximum density gradation charts, “characteristic gradation curves” were generated for different minimum aggregate sizes. The AREMA No. 3, No. 4 and No. 24 gradations fall into the categories of some of these “characteristic gradation curves.” An investigation on the air void contents of ballast characteristic gradation curves revealed that more uniformly graded aggregate assemblies generally had larger air voids but higher tendencies to produce permanent deformation under repeated train loading. Although large voids are desirable for better drainage, when particles finer than 3.6 cm existed in the gradation, the stability of the void structure and the resistance to permanent deformation accumulation, i.e. settlement, decreased. In view of the DEM study findings, it was concluded that AREMA No.24 gradation would yield the least amount of settlement among all the existing gradations. Moreover, according to the DEM methodology employed, there is also room to further engineer current specifications, including AREMA No. 24 gradation, by optimizing the gradation for a minimum allowable particle size of 3.6 cm, which still accommodates large enough air voids for drainage and minimizes the overall settlement potential of the ballast layer. Acknowledgements The authors would like to thank the Association of American Railroads (AAR) Technical Scanning Program for their financial support of this research study through the AAR Affiliated Research Laboratory established at the University of Illinois at Urbana-Champaign. References de Larrard and, F., and Sedran, T., “Optimization of Ultra-High-Performance Concrete by the Use of a Packing Model,” Cement and Concrete Research, Vol. 24, 1994. Fuller, W and Thompson, S. E, “The laws of proportioning concrete,” Transactions of the American Society of Civil Engineers. Paper no 1053, pp 67-143, 1907. Goltermann, P., Johanson, V., and Palbol, L., “Packing of Aggregates: An Alternative Tool to Determine the Optimal Aggregate Mix,” ACI Material Journal, September-October, 1997. Huang, H., Shen, S., and Tutumluer, E., “‘Sandwich’ Model to Evaluate Railroad Asphalt Trackbed Performance under Moving Loads,” accepted for publication, Journal of Transportation Research Record, 2009.
© AREMA 2009 ®

Johansen, V. and Andersen, P.J., “Particle Packing and Concrete Properties,” Materials Science of Concrete II, The American Ceramic Society, 1990. Pan, T. and Tutumluer, E., “Quantification of Coarse Aggregate Surface Texture using Image Analysis,” ASTM Journal of Testing and Evaluation, Volume 35, Issue 2, March 2007. Powers, T.C., “Geometric Properties of Particles and Aggregates,” Journal of the PCA Research and Development Laboratories, Portland Cement Association, Vol.6, 1964. Rao, C., Tutumluer, E. and Kim, I.T., “Quantification of Coarse Aggregate Angularity Based on Image Analysis,” Transportation Research Record No. 1787, TRB, National Research Council, Washington, D.C., 2002, pp. 117-124. Roberts, F., Kandle, P., Brown, E.R., Lee, D., and Kennedy, T. Hot Mix Asphalt Materials, Mixture Design and Construction. NAPA Research and Education Foundation, Second Edition, 1996. Roy, D.M., Scheetz, B.E., and Silsbee, M.R., “ Processing of Optimized Cements and Concretes Via Particle Packing,” MRS Bulletin, March, 1993. Shilstone, J.M., “High Performance Concrete Mixtures for Durability,” High Performance Concrete, 1990. Toufar, W., Born, M., and Klose, E., “Beitrag zur Optimierung der Packungsdichte Polydisperse Korniger Systeme,” Freiberger Forschungsheft A 588, VEB Deutscher Verlag fur Grundstoffindustrie, 1976. Tutumluer, E., Rao, C., and Stefanski, J.A., “Video Image Analysis of Aggregates,” Final Report, FHWA-IL-UI-278, Civil Engineering Studies UILU-ENG-2000-2015, University of Illinois Urbana-Champaign, Urbana, Illinois, 2000. Tutumluer, E., Huang, H., Hashash, Y.M.A., and Ghaboussi J., “Aggregate Shape Effects on Ballast Tamping and Railroad Track Lateral Stability,” AREMA Conference, 2006. Tutumluer, E., Huang, H., Hashash, Y.M.A., and Ghaboussi, J., “Discrete Element Modeling of Railroad Ballast Settlement,” Proceedings 2007 AREMA Annual Conference, Chicago, Illinois, September 9-12, 2007. Vavrik, W.R. Asphalt Mixture Design Concepts to Develop Aggregate Interlock, PhD Thesis, University of Illinois at Urbana-Champaign, July 2000. Zhao, D., Nezami, E.G., Hashash, Y.M.A & Ghaboussi, J., “Three-dimensional Discrete Element Simulation for Granular Materials,” Journal of Engineering Computations, Emerald Group Publishing Ltd., Vol. 23, Issue 7, 2006, pp. 749-770.
© AREMA 2009 ®