AREA OFFICES April, 2009 PLACE ADDRESS LANDLINE … · alwar : 9950995148 agra : ... shriram...
16
Investment Managers : LIC Mutual Fund Asset Management Company Ltd. MUTUAL INTEREST April, 2009 FOR PRIVATE CIRCULATION 4th Floor, Industrial Assurance Bldg., Opp. Churchgate Station, Mumbai - 400 020. Tel.: 22851663. www.licmutual.com
-
Upload
hoangkhanh -
Category
Documents
-
view
216 -
download
1
Transcript of AREA OFFICES April, 2009 PLACE ADDRESS LANDLINE … · alwar : 9950995148 agra : ... shriram...

Investment Managers :
LIC Mutual Fund Asset Management Company Ltd.
MUTUALINTEREST
April, 2009FOR PRIVATE CIRCULATION
De
sig
ne
db
y:
Pri
nta
nia
Offse
tP
vt.
Ltd
.
4th Floor, Industrial Assurance Bldg., Opp. Churchgate Station, Mumbai 400 020. Tel. : 22851663 visit us at www.licmutual.com
Statutory DetailsRISK FACTORS
: LIC Mutual Fund has been set up as a Trust sponsored by Life Insurance Corporation of India. LIC Mutual Fund Asset Management Co. Ltd. is the Investment Managerto the Fund. : Mutual Funds and Securities investments are subject to market risks and there is no assurance and no guarantee that the objectives of the Mutual Fund willbe achieved. As with any investment in stocks and shares, the NAV of the units issued under the scheme can go up or down depending on the factors and forces affecting the capitalmarkets. The Sponsor is not responsible for or liable to any loss resulting from the operations of the scheme beyond their initial contribution of Rs. 2 Crore towards the setting up of theMutual Fund. Past performance of the Sponsor/AMC/Mutual Fund does not indicate the future performance of the schemes of the Mutual Fund. The NAV of units of the scheme may beaffected by changes in general level of interest rates. Please read the offer document carefully before investing.
Investment Manager:
AREA OFFICES
Mobile No. Name of Place Mobile No. Name of Place Mobile No.
PLACE ADDRESS LANDLINE MOBILE
AHMEDABAD
BANGALORE
CHENNAI
ERNAKULAM
HYDERABAD
JAIPUR
KANPUR
MUMBAI
NEW DELHI
RAIPUR
RANCHI
Jeevan Sadan, 3rd Floor, LIC Building, Opp. Capital Commercial Center,Ashram Road, AHMEDABAD - 380006.
No.4, Canara Mutual Building (Opp. Cash Pharmacy), 2nd Floor,Residency Road, BANGALORE-560025.
Jeevan Vikas, 16/98, M.G. Road, KANPUR - 208001.
- LIC Mutual Fund, 4th Floor, Industrial Assurance Bldg.,Opp. Churchgate Station, MUMBAI - 400020.
7th Floor, Jeevan Prakash, 25 K.G. Marg, NEW DELHI - 110001.
Narsaria Tower, 2nd Floor, Opp. Lalpur Police Station, Post Lalpur, 0651-2206372
079-26631989 / 65431989 9375090006 / 9924403147
080-22210180 / 22295598 9845172957 / 9972092957 /9986500721
OCHC Building, Ground Floor, 24-Janpath, Unit-3, BHUBANESHWAR-751001. 0674-2390694 9438132162 /9438081037 /9438526420
15, Anna Salai, Next to V.G.P. Bldg., CHENNAI - 600002. 044-28411984 / 28555883 9382315850 / 9382980073 /
9962526278
11th Floor, Jeevan Prakash, M.G. Road, Ernakulam, Kochi - 682011 0484-2367643 9895036554 / 9745612888 /
9446042945
T 9/10, 3rd floor, Alfran Plaza, Opp. Don Bosco High School, M. G. Road, 0832-2420561 9421151400 / 9890711551
Panaji, Goa-403001.
LICMF AMC Ltd., C/o LIC of India, Jeevan Deep Building, Panbazar, Guwahati -782 001 0361 - 2735323 9435040478 / 9707021706
LIC Mutual Fund, House No. 5-9-57, 4th Floor, Jeevan Jyoti Building, 040-23244445 / 23210572 9392471583 / 9000444850 /Basheerbagh, HYDERABAD - 500029. 9000550850
U.V. Business Centre, 1st Floor, Snehil 9/1-A South Tukoganj, INDORE - 452001. 0731-2520262 / 4069162 9753242050 / 9425870126
327 - A, 3rd floor, Ganpati Plaza, M. I. Road, JAIPUR - 1. 0141-5112620 9460873120 / 9829098323 /9929095005
0512-2360240 / 3244949 9415060134 / 9984006600 /
9838038440 / 9918971258
Ground Floor, Hindustan Building Annexe, 4, Chittaranjan Avenue, 033-22129455 / 65290605 9432128113 / 9433098459 /
KOLKATA - 700072. 9339531895 / 9339002574 /9231407611
LICMF AMC LTD., Room No. 102, 1st Fl., S.C.O. 19, Opp. Stock Exchange 0161 - 2405805 / 2405806 9814703558 / 9888320209Feroze Gandhi Market, Ludhiana - 141 001 9872106060
LICMF AMC Ltd., No. 6, Gr. Floor, Popular Building, K S Rao Road, Managalore - 575 001 0824 - 2411482 9845190466 / 9980950466
022-22885971 / 55719750 9324543832 / 9323181203 /9323180802 / 9892550455 /9930957772 / 9870775600
LIC Mutual Fund, 4th Floor, Industrial Assurance Bldg., 022-22851660 9820002994 / 9967655060 /Opp. Churchgate Station, MUMBAI - 400020. 9371617717 / 9920675088
LIC Mutual Fund, Iind Floor, Indian Mutual Bldg., Mount Road, Sadar, Nagpur - 440 001 0712 - 2542497 9422113800
Shop No.2, Ground Floor, Rajvee Enclave, New Pandit Colony, NASHIK - 422002. 0253-2579507 9922996155 / 9823366379
011-23359190/23314396 9818039607 / 9818039603 /9818030124 / 9999828173 /9818191263 / 9811108744
Ground floor, Jeevan Jyothi Bldg. Exhibition Road, PATNA - 800001. 0612-2501157/6452757 9470610695 / 9431023274
SF-22-23, Millennium Plaza, Near Indian Coffee House, 0771-2236780/4051137 9329731077 / 9329100009/G.E. Road, RAIPUR - 492001 C.G. 9329778201
RANCHI -834001. 9470524099 / 9334768543
BHUBANESHWAR
GOA
GUWAHATI
INDORE
KOLKATA
LUDHIANA
MANGALORE
MUMBAI -
NAGPUR
NASHIK
PATNA
I
II
ALWAR : 9950995148AGRA : 9927888854ALAPUZHA : 9447367160AMRITSAR : 9814299747AJMER : 9829077674AMRAVATI : 9923797207ANANTPUR : 9000444852AURANGABAD : 9422728151BERHAMPORE : 9238504924BELGAUM : 9845205168BELLARY : 9980830179BILASPUR : 9301982280BHILAI : 9301701133BHOPAL : 9302441980BHAGALPUR : 9431609765BOKARO : 9955189443CHANDIGARH : 9316065681COIMBATORE : 9282216891DHANBAD : 9835334495DEHRADUN : 9410702598FARIDABAD : 9871814850GORAKHPUR : 9336833448GULBARGA : 9900144196GAYA : 9334118071
GWALIOR : 9406586454HUBLI : 9880058223HAZARIBAG : 9835197681 /
9199107292JABALPUR : 9407606313JAMMU : 9419213201JAMSHEDPUR : 9234620669JODHPUR : 9829947974KANNUR : 9846113249KARIMNAGAR : 9000444853KOTTAYAM : 9349374220KOZHICODE : 9961036375KOTA : 9829905879KOLHAPUR : 9822851948LUCKNOW : 9450661015 /
9453016072MADURAI : 9994509005MALDA : 9836237434 /
9851955023MEERUT : 9319267811MYSORE : 9986117183MUZAFFARPUR : 9431813155
NELLORE : 9000444854PONDICHERRY : 9443337411PANIPAT : 9996006023PUNE : 9325523480RAJKOT : 9898733233SAMBALPUR : 9937040031SALEM : 9944744424SHIMOGA : 9902007686SURAT : 9978862626
9925027406SILIGURI : 9332114747THANE : 9320180806THIRUVANANTHAPURAM : 9388088066THRISSUR : 9388110220TRICHY : 9842524130UDAIPUR : 9784011432VADODARA : 9327494916VARANASI : 9336501004VISHAKHAPATNAM : 9000444851VIJAYWADA : 9000444856
BUSINESS CENTREName of Place
4th Floor, Industrial Assurance Bldg., Opp. Churchgate Station,Mumbai - 400 020. Tel.: 22851663. www.licmutual.com

15MUTUAL INTERESTMUTUAL INTEREST2
LICMF UNIT LINKED INSURANCE SCHEMEAn Open-ended Insurance linked Tax Saving Scheme
EQUITY PORTFOLIO (as on 31/03/2009)
TOTAL FUND : Rs. 6257.24 Lakh(as on 31/03/2009)
NAV (Rs.) as on 31/03/2009: 7.2488
Last 1 yearLast 3 yearsSince Inception
-24.13%-2.34%10.13%
Benchmark (C BalanceEx) Return (Last 1 year) -22.34%
ANNUALISED RETURNS
(Past Performance may or may not be Sustained in Future)
Holdings Rating Market Value(Rs. in Lakhs)
Equity
TOTAL - EQUITY 2795.46
POWER GRID CORPORATION OF INDIA 409.03
BHARTI TELEVENTURE 375.48
S B I 351.96
N T P C 324.36
INDRAPRASTHA GAS 136.60
BHARAT ELECTRONICS 129.31
L & T 121.08
O N G C 116.96
H D F C BANK 116.14
PUNJAB NATIONAL BANK 98.32
GMR INFRASTRUCTURE 94.90
RELIANCE COMMUNICATION 87.30
G A C L 71.30
DEEPAK FERTILISERS 60.35
B H E L 60.17
RELIANCE POWER LTD 51.25
MERCATOR LINES 49.53
R I L 45.70
JAIPRAKASH ASSOCIATES 25.26
G A I L 24.43
S A I L 24.11
BANK OF BARODA 21.93
DEBT PORTFOLIO (as on 31/03/2009)
Holdings Rating Market Value(Rs. in Lakhs)
Debt
TOTAL - DEBT 3099.78Commercial Paper 0.00TOTAL - Commercial Paper
Cash ‘n’ Call, Current Assets & Receivables 362.00
GSEC 6.05% 02/02/2019 AAA 186.48RURAL ELECTRIFICATION CORPORATION AAA 96.65RELIANCE CAPITAL A1+ 800.00IL&FS INVESTSMART F1(SO) 709.17FIRST LEASING PR1+ 700.00ERA CONSTRUCTION F2+ 507.48BAJAJ HINDUSTAN F1 100.00
Avg. Maturity (in years) : 1.12
Avg. Duration (in years) : 1.00
PORTFOLIO (as on 31/03/2009)
TOTAL FUND : Rs. 122651.80 Lakh(as on 31 )/03/2009
Bonds / Debentures
Commercial Papers
IDFC AAA 5027.50
H D F C AAA 4974.75
I C I C I BANK AAA 3510.00
MAGMA LEASING AA- 7000.00
ARCH PHARMALABS F1 5000.00
TATA REALTY AND INFRASTRUCTURE LTD PR1+(SO) 3000.00
B. SEENAIAH & CO. (PROJECTS) LTD. A1 3000.00
BLUE BIRD (IND) PR1 3000.00
MAGMA LEASING AA 2865.00
BHUSHAN STEEL & STRIPS F1 1200.00
STERLING BIO-TECH PR1 1150.00
TRAPTI TRADING & INVESTMENT A1+ 1000.00
MIDDAY MULTIMEDIA P1 995.00
SHRIRAM TRANSPORT FINANCE AA 800.00
COX AND KINGS PR1 800.00
BAJAJ HINDUSTAN F1 500.00
KOUTONS RETAIL INDIA PR1 476.20
ALOK INDUSTRIES PR1 300.00
REI AGRO PR1 300.00
AMALGMATED BEAN COFEE TRADING CO. L PR1+ 50.00
VIDEOCON INDUSTRIES F1 20.00
SREI INFRASTRUCTURE FINANCE AA 2.82
DLF A1+ 8517.31
SUNDARAM FINANCE A1+ 559.59
INDIABULLS FINANCIAL SERVICES P1+ 286.51
Holdings Rating Market Value(Rs. in Lakhs)
Expense Ratio (as on 31/03/2009) : 0.43%
NAV (Rs.) as on 31 3
Daily Dividend : 10.0000 Weekly Dividend : 10.0026
10.0614 11.7431
/0 /2009
Monthly Dividend : Growth :
LICMF INCOME PLUS FUNDAn Open-ended Debt Scheme
Category Exposure (Rs. Lakh) % Contribution
Equity 2795.46 44.68%
Debt 3099.78 49.54%
Money Mkt. 362.00 5.79%
Total 6257.24 100.00%
DIVIDEND RECORD
Year Rate
1989-90 12.50%
1990-91 13.00%
1991-92 13.50%
1992-94 (18 months) 15.00%
1994-95 7.50%
1996-97 6.00%
1997-98 10.00%
1999-00 10.00%
Year Rate
2001-02 10.00%
2002-03 7.50%
2003-04 17.00%
2004-05 20.00%
2005-06 28.00%
2006-07 44.00%
2007-08 30.00%
2008-09 0.00%
July, 07 0.06660000 0.08314312 0.06570000Aug., 07 0.06640000 0.05480000 0.07180000Sept., 07 0.06460000 0.07320000 0.06490000Oct., 07 0.07380000 0.07020000 0.07410000Nov-07 0.07040000 0.06220000 0.06900000Dec-07 0.07400000 0.06670000 0.07430000Jan-08 0.07500000 0.08500000 0.07530000Feb-08 0.06900000 0.06300000 0.06910000Mar-08 0.08220000 0.09270000 0.08290000Apr-08 0.06720000 0.06200000 0.06750000May-08 0.06860000 0.06340000 0.06870000Jun-08 0.07650000 0.08690000 0.07690000Jul-08 0.07880000 0.08860000 0.07910000Aug-08 0.07820000 0.07560000 0.07870000Sep-08 0.08850000 0.09690000 0.08890000Oct-08 0.09410000 0.08220000 0.09450000Nov-08 0.07390000 0.07850000 0.07510000
Dec-08 0.08630000 0.09820000 0.09370000Jan-09 0.07070000 0.05430000 0.07080000Feb-09 0.05580000 0.05660000 0.05590000Mar-09 0.06120000 0.06460000 0.06140000
Month Daily Weekly Monthly
Certificate of Deposit
Bank Deposits
Cash ‘n’ Call, Current Assests and Receivables 33925.67
VYSYA BANK P1+ 9275.50VIJAYA BANK PR1+ 4916.33UNITED BANK OF INDIA A1+ 4855.43I D B I BANK A1+ 4844.20
BANK OF INDIA 10000.00PUNJAB NATIONAL BANK 500.00
Holdings Rating Market Value(Rs. in Lakhs)
PORTFOLIO (as on 31/03/2009)
Avg. Maturity (in months) : 5.89Avg. Duration (in months) : 5.59
Expense Ratio (as at 31 ) : 2. %/03/2009 50
Last 1 yearSince Inception
9.50%9.14%
Benchmark (C Fund ~ LX) Return - last 1 year 8.80%
ANNUALISED RETURNS
(Past Performance may or may not be Sustained in Future)
DIVIDEND DECLARED
The financial year 2008-09 was a very difficult year not only for the global and Indian economy in general but also
for the India Mutual Fund Industry in particular. Following the bankruptcy of Lehman Brothers in mid September
2008, the global financial markets that were already suffering the consequences of the sub-prime credit and
other financial misadventures, totally seized and the shockwaves hit India and other emerging economies
shattering in its wake the “decoupling” theory which had claimed that emerging markets would be immune to
the financial turmoil faced by the Developed economies for various reasons. The turmoil in the financial and real
economy soon caused a deep crisis of confidence and Mutual funds faced a deluge of redemptions in October
2008. Just as the saying goes “When the going gets tough, the tough get going”, LICMF, which also faced the
crisis, came out much stronger.
On its part, the Government of India, to combat slowdown announced three stimulus packages, of which one
includes the reduction in the key interest rates. This came as a boon to the G-Sec investors with yields falling to
its lowest thereby benefiting the banks with better profits. Inflation figures began to fall though too much of it is
not good for economic growth. While rest of the measures were meant to boost the aggregate economic
demand, their impact is yet to be felt in the coming quarters and it is believed that if the investment and
consumption picks up as expected, the increased fiscal deficit, which is inevitable on account of the conscious
decision to provide the monetary and fiscal stimulus, can be quickly reversed.
After 9% GDP growth for 2007-08, PM's Advisory Council has projected, in January 09, growth of 7.1% for 2008-
09. This has been revised further to 6.5-7% in March 09. However, there are positive notes as well. GDP growth
rate of 7% is expected in 2009-10 and is possible to accomplish for all valid reasons. Oil and Commodities prices,
the key factors to dampen the industry demand, have now declined. Interest rates have calmed down and cost of
borrowing has reduced and may be relaxed further if there is another cut in key interest rates. Liquidity is no
longer a constraint. Sixth Pay Commission when fully implemented is bound to increase the disposable income
of the population. Interest on the investment in country's infrastructure is still strong.
Average AUM of LIC Mutual Fund as on March 31, 2009 stood at Rs.23,092.37 crore. With this we have achieved
a growth of 64.29% in AAUM over last year's AAUM of Rs.14,056.16 crore. The growth in AAUM registered by
LICMF is one the highest in the industry. Of the total assets under management, nearly 87% is contributed by
debt schemes while the rest is made of equity and hybrid schemes. During the year we have launched 11 NFOs,
of which 7 were FMPs and 4 were Interval Funds.
For the period ending December 31, 2008, LICMF Liquid Fund and LICMF Floating Rate Fund received the “Gold
Award” for best performance in the respective category for 3-year period and were rated as 7 Star Funds in the
ICRA Mutual Fund Awards. While LICMF Income Plus received the “Gold Award” for best performance in the
respective category for 1-year period, was also rated as 7 Star Funds. Besides this our schemes got three 5 Star
Fund Awards. Morningstar, leading global investment research based company best known for rating funds and
stocks, awarded LICMF Liquid Fund with the Best Fund in the India Liquid category.
The schemes in debt category have by and large outperformed their respective benchmarks for FY2008-09.
Hybrid and equity schemes performed in line with the market indices. Almost all the schemes performed in the
top-20 performance bracket.
Increased thrust is given to attracting and retaining pool of retail investors across semi urban and rural areas.
Determined efforts have been made to make products available across wide spread locations. Field force has
been increased by manifold and feedback mechanism is in place. LICMF Short Term Plan was relaunched as
LICMF Savings Plus Fund keeping the needs of retail investors in mind.
LICMF thanks all its investors for their continuous trust. We reaffirm our commitment to deliver value to our
customers.
- CEO's Desk
Where we stand…
Whither from here…
FUND PERSPECTIVE

3MUTUAL INTERESTMUTUAL INTEREST14
LICMF GROWTH FUNDAn Open-ended SchemeGrowth
PORTFOLIO (as on 31/03/2009) PORTFOLIO (as on 31/03/2009)
YESBANK 12.48 0.26%
VIJAYABANK 11.65 0.24%
PROVOGUE(INDIA) 5.80 0.12%
RENAISSANCEJEWELLERY 0.06 0.00%
0.00%
Total Equity 4110.01 86.27%
Debt 0.00 0.00%
Total-Debt 0.00 0.00%
Commercial Paper/Bank Deposit 0.00 0.00%
Cash‘n’Call, Current Assets & Receivables 654.28 13.73%
Holdings Mkt. Value %
(Rs. Lakh) Contribution
TOTAL FUND : Rs. Lakh(as on 31 )/03/2009 4764.29
Expense Ratio (as on ) : 0. %31/03/2009 16
Last 1 year -35.27%
Last 3 year -10.66%
Since Inception 5.37%
%Benchmark (Sensex) Return - last 1 year -37.94
ANNUALISED RETURNS
(Past Performance may or may not be Sustained in Future)
Holdings Mkt. Value %(Rs. Lakh) Contribution
Equity
SBI 381.86 8.01%
RIL 380.80 7.99%
L&T 302.69 6.35%
ONGC 296.29 6.22%
ICICIBANK 249.45 5.24%
GAIL 247.41 5.19%
HDFCBANK 203.25 4.27%
CONCOR 190.78 4.00%
NTPC 180.20 3.78%
POWERFINANCECORPORATION 179.55 3.77%
PUNJABNATIONALBANK 164.36 3.45%
RELIANCEINFRASTRUCTURE 154.61 3.25%
HDFC 141.12 2.96%
INFRASTRUCTUREDEVELOPMENTFINANCE 135.50 2.84%
BANKOFINDIA 109.95 2.31%
ELDERPHARMACEUTICALS 108.63 2.28%
TATACHEMICALS 82.71 1.74%
RELIGAREENTERPRISES 81.88 1.72%
NEYVELILIGNITECORPORATION 73.70 1.55%
AXISBANK 62.18 1.31%
BEML 57.23 1.20%
POWERTRADINGCORPORATIONOFINDIA 56.17 1.18%
JAIPRAKASHASSOCIATES 54.73 1.15%
JAIPRAKASHHYDRO-POWERLTD. 53.94 1.13%
POWERGRIDCORPORATIONOFINDIA 37.49 0.79%
PUNJLLOYD 27.35 0.57%
RELIANCECOMMUNICATION 26.19 0.55%
TISCO 20.60 0.43%
PETRONETLNG 19.43 0.41%
LICMF TAX PLANAn Open-ended ELSS
PORTFOLIO (as on 31/03/2009)
DIVIDEND HISTORY
Month Dividend
Mar-04 20.00%Mar-05 30.00%Aug-05 10.00%Mar-06 20.00%Oct-06 25.00%May-07 10.00%Oct-07 15.00%
TOTAL FUND : Rs. 2756.30 Lakh(as on 31 )/03/2009
Expense Ratio (as on ) : 1. %31/03/2009 52
(Past Performance may or may not be Sustained in Future)
PORTFOLIO (as on 31/03/2009)
Holdings Mkt. Value %
(Rs. Lakh) Contribution
Debt 0.00
Total - Debt 0.00
Commercial Paper / Bank Deposit 0.00
Cash ‘n’ Call, Current Assets & Receivables 841.24
Equity
Total Equity 1915.06
S B I 223.98
L & T 201.80
S A I L 183.26
R I L 177.65
O N G C 155.94
I T C 147.84
H D F C 98.78
BHARTI TELEVENTURE 93.87
RELIANCE COMMUNICATION 88.67
I C I C I BANK 83.64
RELIANCE INFRASTRUCTURE 56.69
G A I L 54.96
RELIGARE ENTERPRISES 49.13
T I S C O 47.17
BANK OF INDIA 43.98
JAIPRAKASH ASSOCIATES 42.10
CAIRN INDIA 36.81
CENTURY TEXTILES 35.18
POWER FINANCE CORPORATION 26.06
ADANI ENTERPRISES 21.36
PAREKH ALUMINEX 11.09
TATA MOTORS 10.82
KOTAK MAHINDRA BANK 8.57
INFRASTRUCTURE DEVELOPMENT FINANCE 8.13
POWER GRID CORPORATION OF INDIA 7.56
RENAISSANCE JEWELLERY 0.02
Holdings Market Value(Rs. in Lakhs)
Last 1 year
Last 3 years
Since Inception
-37.51%
-12.74%
4.45%
Benchmark (Sensex) Return Last 1 year -37.94%
ANNUALISED RETURNS
DIVIDEND HISTORY
Month Dividend
Oct-07 15.00%
NAV (Rs.) as on 31/03/2009: DIVIDEND: 5.8477; GROWTH: 6.5934
NAV (Rs.) as on 31/03/2009; Dividend: 5.9741; Growth: 16.6857
The year that was….
Indices % Fall Indices % Fall
Sensex -37.94 BSE POWER -42.09
BSE FMCG -11.08 BSE 500 -42.77
HEALTHCARE -26.45 CAPITAL GOODS -53.84
BSE-oil and Gas -29.59 BSE Midcap -54.01
Auto -32.34 Consumer Durables -58.14
BSE-IT -35.57 Small-cap -58.6
Tech -38.93 Metal -58.67
Bankex -41.81 Realty -79.34
Indian Economy
The projected growth rate for the Indian economy is estimatedto be 6.5-7% for the year 2009 as per the PM's Advisory Counciland around 7.7% in the year 2010. The growth rate will bemoderate mainly due to fall in the Industrial growth and sloweragricultural growth. The inflation measured by the WPI hasreached in the trajectory of disinflation. The decliningcommodity prices and weakening demand resulting fromeconomic slowdown led to decline of the annual inflation rate tofall to another historic low of 0.27 per cent for the week endedMarch 14. The Rupee has been very volatile and weak againstdollar during the year. Gold as an asset class gave anappreciation of 29% in the last financial year which is anindicator of investors' attention shifting from financial assets totraditional commodities.
Currently, in order to increase the liquidity in the market, thegovernment and the Reserve Bank of India has introducedstimulus packages leading to softening of interest rates, cuttingof duties and tax rates. Falling Stock market, slowing real estatemarket and stringent lending which leads to slowconsumption/spending is leading the overall economy into adawdling phase.
However, with the new government in place, new reforms areexpected. India's banking system has been sound and resilientin the current financial turmoil.
The year 2008-2009 was a gloomy year for the Indian stockmarket. The unprecedented mayhem in the financial markets inUS that began in the late FY08 brought the entire world in itsclutches.
For the first time in five years the BSE Sensex gave negativereturns over the financial year. It closed at 9708 down 37.94 percent from the previous fiscal close of 15644. The broader 50-share Nifty closed at 3021 down 36.19 per cent from theprevious fiscal close of 4734.50.
Booking of losses under sub-prime loans by leading financialfirms in US and the credit crises in US led to fall of the entirefinancial system all over the world. The economic crises causedsteep fall of the stock markets across various countries and alsoled to temporarily close some of the stock markets. Indian Stockmarket fell drastically to 15332.42 levels on 22 January 2008from its peak of 20206.77 on 10 January 2008. The next majorshock came in September 08 with the filing of bankruptcy byLehaman Brothers, Sale of Merril Lynch to bank of America andrescue package for one of the largest insurer AIG which sufferedliquidity crisis led to major Financial meltdown across the globe.The Indian Stock market was no exception to this financialhavoc. The heavy selling by the FIIs, liquidity crunch and worriesabout global slowdown put pressure on the Indian stockmarket. The BSE Sensex touched the lowest of the year 7697.39on 27 October 08. However, from October to March 2009, themarkets have been moving in the range of 8000 to 11000 levels.The Indian economy along with the global economy fell into thevicious circle of slowdown. The regulators revised downwardEconomic growth estimates due to poor industrial output data.
The Sensex lost almost 6000 points during this financial year.The Mid-cap and Small-caps are more affected than the largecaps and the indices fell by 54% and 58.6% during the year.
Amongst the Sectoral indices, BSE Realty Index was the worsthit during the fiscal losing 79.34%. The real estate companystocks had a good rally in the last Bull Run. However, theseprices corrected sharply due to plunge in the real estate market
nd
th
th
Equity Market
owing to slow demand, higher interest costs and input cost. TheBSE Metal Index also lost 58.67% due to sharp fall in thecommodity prices. The most resilient sectors were FMCG andHealthcare that fell only 11.08% and 26.45% respectively. Thesteep fall in the oil prices led to fall in the prices of Oil companiesstocks.
The Foreign Institutional Investors (FIIs), the major participantsin the Indian stock market offloaded equities worth Rs.6151.50Crores during 2008-2009(sebi data). However, the FIIregistration showed a significant rise during the same period.The total number of registration of FII stood at 1635 and FII sub-accounts at 5015 as on 31st march 2009 against 1319 FIIs and3964 sub-accounts a year ago. The Domestic Institutionalinvestors tried to support the Indian Market by on buying side.The Mutual Funds bought shares worth Rs.1477.30 crore on31/03/2009.
The Elections are due in April 2009 and as per estimates,Rs. 10,000 crores is to be spent on it. From 1996 till date inspiteof 4 coalition governments into power India has managed togrow at 9 per cent rate. This time around as well, many fear ahung Lok Sabha. But any new government will try to continuereforms, wipe out the fiscal deficit as much as possible in orderto put the Indian growth story on track.
Money market was easy and the call rates were soft through outthe month on account of ample cash with the Bank & improvedliquidity condition. Call rates traded at 2.25 -4.30 % at the end ofthe month.
Headline inflation, as measured by the wholesale price index,has fallen sharply to 0.44 percent week to march 7, two decadelow providing room for RBI to cut interest rates. FY 2008-09 sawa massive reversal of fortunes in terms of crude oil prices, withthe commodity hitting its all time-high in July and a four-year lowby mid-December. Inventory pile caused by Lower demand sawcrude oil prices dropped by nearly $100 to $47.25 by the end ofyear from its peak in July 2008.
Last year 10-year G-sec was trading at a yield of 7.94 percent, assentiments were jittery on inflation concerns. The yield on the 10year bond fell by 93 basis points in FY 2008-09, mostly due toaggressive rate cuts by the RBI to boost the economy. Thecentral bank has cut its repo rate by 275 basis points to 5.00percent and banks' cash reserve requirements by 250 basispoints to 5.00 percent over the past one year. Earlier, G-Secyield touched a record low of 4.86 percent, as series of rate cutcoupled MSS buy back by RBI boosted the confidence in G-secMarket. However, the yield on government securities has beenclimbing in the recent past with new benchmark 2019 bondclosing at 7.01 percent at the end of month. This Sluggishnessin G-sec market is largely attributable to the substantial increasein the quantum of government borrowing reflecting the surge infiscal deficit. The central government's borrowing target for thefirst half of FY 2009-10 has been pegged at Rs 2,41,000 crorealmost 80 per cent of its total borrowing in FY 2008-09. On thecorporate bond front, spread between the ten -year corporateand government debt yields was at around 202 basis points and5-year AAA corporate bond and government debt was 171basis points. Rupee closed at 50.71/72 per dollar on 31st March09. Rupee lost nearly 21 percent in 2008-09, biggest fall sincethe balance of payment crisis.
The capital markets seem to be in a consolidation phase. Thenext major response from the Equity markets is expected afterthe results of the forthcoming Election, the policy decisionstaken by the New Government, the economic response to thesepolicy decisions, the GDP Data and the corporate resultsexpected soon. The Indian stock market is expected to be rangebound in near future.
The Debt Markets also have gone through their own turmoil.With inflation moving towards negative territory, RBI may go fora rate cut to stimulate demand and protect the economy fromglobal recession. This may help in softening of yields ongovernment securities & corporate bonds. We expect liquidityto remain soft in the foreseeable future.
CIO’s Desk...
Debt Market
Outlook

MUTUAL INTEREST4 13MUTUAL INTEREST
SCHEMES
26th March 99
To generate attractive returns forour investors by investing in qualitydebt securities and money marketinstruments.
Debt
Nil
1% if exit within 1 year forInvestment 1 Cr;
Nil for Investment > 1 Cr
Rs. 5000/-
On all business days
SIP / SWP / STP / AWOCA
Available
Dividend / Growth
Redemption on all business days
<
15th November 99
To generate steady and consistentreturns for our investors by timingthe government securities market.
Debt - Gilt
PF / Regular
Investment upto 1 crore : 1.25%
Nil
1% if Exit within 365 daysfrom the date of allotment
Regular Plan: Rs. 5,000/-PF Plan: Rs. 10000/-
Dividend / Growth
Investment above 1 crore : Nil
Nil
Redemption on all business days
On all business days
SIP / SWP / STP / AWOCA
Available
Regular Plan
PF Plan :
Regular Plan
PF Plan :
26th September 01
To generate long term capitalappreciation through judiciousmix of quality debt & equityinstrument at moderate risklevels through research basedinvestments.
Balanced
Nil
1% if exit within 3 years fromthe date of investment; Nil if exitafter 3 years from the date ofinvestment
Rs. 5000/-
Growth
Redemption on all business days
On all business days
SIP / SWP / STP / AWOCA
Available
29th May 03
To generate income by investing ina portfolio of quality short termdebt securities.
Debt - Short Term
Nil
Nil
Rs. 5000/-
Dividend / Growth
Redemption on all business days
On all business days
SIP / SWP / STP / AWOCA
Available
Bond Fund G-Sec Fund Savings Plus Fund Children’s Fund
11th March 02
To generate reasonable returnswith low risk and high liquiditythrough judicious mix of investmentin money market and quality debtinstruments
Debt - Liquid
Dividend / Growth
Nil
Nil
Rs. 25000/-
Redemption on all businessdays
On all days
STP
Available
1st June / 03
To generate regular income byinvesting mainly in quality debt andmoney market instruments withsome portion in equity/equityrelated instruments for long termcapital appreciation.
Debt
Monthly Div./Quarterly Div.Yearly Div./Growth
Nil
0.5% for investments25 lakhs for 6 months;
0.25% for investment> 25 lakhs for 3 months.
Rs. 25000/- for MonthlyOption; Rs.15000/- for QuarterlyOption; Rs.10000/- for YearlyOption; Rs.5000/- for Growth Option.
Redemption on all businessdays
On all business days
SIP / SWP / STP / AWOCA
Available
<
15th March 2004
To generate consistent returnsby investing mainly in floatingrate instruments/fixed rateinstruments swapped for floatingrate return so as to minimise theinterest rate risk for the investor.
Debt - Floating
Dividend / Growth
Nil
Nil
Rs. 5,000/- and thereafter inmultiples of Rs. 500/-.
Redemption on all businessdays
On all days
SIP / SWP / STP / AWOCA
Available
19th June 89
To generate long term capitalappreciation and offer Tax rebate u/s80 C as well as additional benefits ofa life & insurance cover free accidentinsurance cover.
Insurance linked tax saving
Single Premium-5/10 year termRegular Contribution-10/15 year term
Dividend Re-investment
2.25%
Nil
Rs. 10000/- under Single PremiumRs. 1000/- under Regular Premium-yearly option, Rs. 500/- underRegular Premium - monthly option
Redemption on all businessdays
On all business days
SIP / STP
Available
Liquid Fund Monthly Income Plan Unit Linked Insurance Scheme Floating Rate Fund - STP
Launch Date
Objective
Type
Plans
Options
Entry Load
Exit Load
Minimum Investment
Liquidity
NAV Declaration
Special Facilities
Nomination
Launch Date
Objective
Type
Plans
Options
Entry Load
Exit Load
Minimum Investment
Liquidity
NAV Declaration
Special Facilities
Nomination
LICMF INDEX FUNDAn Open-ended Index Linked Equity Scheme
Equity
TotalEquity 9590.06Cash‘n’Call, Current Assets & Receivables 259.31
RIL 1216.29ONGC 845.15NTPC 751.62BHARTITELEVENTURE 602.84INFOSYSTECHNOLOGIES 383.80BHEL 375.02ITC 354.09SBI 343.95TATACONSULTANCYSERVICES 266.50HUL 262.94RELIANCEPETROLEUM 217.57HDFCBANK 209.37POWERGRIDCORPORATIONOFINDIA 205.08HDFC 204.25SAIL 202.67L&T 198.72ICICIBANK 188.36RELIANCECOMMUNICATION 183.35WIPRO 181.61CAIRNINDIA 177.70GAIL 157.03DLF 144.37STERLITEINDUSTRIES 127.77RELIANCEPOWERLTD 124.82SUNPHARMACEUTICALS 116.45MUL 113.61HEROHONDAMOTORS 107.99CIPLA 87.71TATAPOWER 85.61IDEACELLULAR 79.03TISCO 75.77AXISBANK 75.47VSNL 74.46GRASIMINDUSTRIES 73.66NALCO 70.88BPCL 68.43PUNJABNATIONALBANK 65.59RELIANCEINFRASTRUCTURE 60.90ACC 54.41GACL 54.18M&M 49.04ABB 46.18SIEMENS 44.81RELIANCECAPITAL 44.76HINDALCO 44.39TATAMOTORS 41.32RANBAXYLABORATORIES 35.61HCLTECHNOLOGIES 34.41SUZLONENERGY 31.50UNITECH 29.00
NIFTY PLAN - PORTFOLIO (as on )31/03/2009
TOTAL FUND / : Rs. 9849.37 Lakh(as on 31/03 2009)
NAV (Rs.) as on 31/03/2009: Dividend: 6.3646; Growth: 17.2522
Last 1 yearLast 3 yearsSince Inception
(Last 1 year)
-37.82%-7.77%10.68%
Benchmark NSE - Nifty Return -36.19%
ANNUALISED RETURNS
EquityRIL 394.77INFOSYSTECHNOLOGIES 214.90ITC 162.71BHARTITELEVENTURE 136.82ICICIBANK 123.44L&T 118.00HDFCBANK 116.55HDFC 113.69ONGC 111.15SBI 101.52HUL 86.55BHEL 85.97NTPC 74.37TATACONSULTANCYSERVICES 43.99RELIANCECOMMUNICATION 42.06TATAPOWER 39.51MUL 37.24GRASIMINDUSTRIES 36.14TISCO 35.18
SENSEX PLAN PORTFOLIO (as on 31/03/2009)
Holdings Mkt. Value (Rs. lakhs)
SENSEX PLAN PORTFOLIO (as on 27/02/2009)
TOTAL FUND : Rs. 2310.78 Lakh(as on 31 )/03/2009
NAV (Rs.) as on 31/03/2009: Dividend: 6.4333; Growth: 18.7745
Expense Ratio (as on ) : 1. %31/03/2009 05
Last 1 yearsLast 3 yearsSince Inception
-41.87%-7.35%12.17%
Benchmark BSE - Sensex Return (Last 1 years) -37.94%
ANNUALISED RETURNS
SENSEX ADVT. PLAN PORTFOLIO (as on 31/03/2009)
Month Dividend (%)Nifty Sensex Sensex Advt.
Nov-03 13 13 15Jan-04 16 15 17Aug-05 25Nov-05 40Jan-06 50Feb-06 50Nov-06 50Feb-07 50Mar-07 20 20Mar-08 20 15
Expense Ratio (as on 31/03/2009) : 1.50%
(Past Performance may or may not be Sustained in Future)
(Past Performance may or may not be Sustained in Future)
Holdings Mkt. Value (Rs. lakhs)
Holdings Mkt. Value (Rs. lakhs)
TOTAL FUND : Rs. 375.51 Lakh(as on 31 )/03/2009
NAV (Rs.) as on 31/03/2009: Dividend: 7.2294; Growth: 17.4536
Expense Ratio (as on 31/03/2009) : 1.46%
Last 1 yearLast 3 yearsSince Inception
-37.72%-11.50%11.16%
Benchmark BSE - Sensex Return (Last 1 year) -37.94%
ANNUALISED RETURNS
DIVIDEND HISTORY
(Past Performance may or may not be Sustained in Future)
Holdings Mkt. Value (Rs. lakhs)Equtiy
Total Equity 315.02
Cash ‘n’ Call, Current Assets & Receivables 60.49
RIL 46.63
INFOSYSTECHNOLOGIES 23.93
AXISBANK 20.73
ITC 18.13
BHARATELECTRONICS 17.66
BHARTITELEVENTURE 17.36
ICICIBANK 13.73
L&T 13.12
HDFC 12.56
ONGC 12.45
SBI 11.45
HDFCBANK 10.99
HUL 9.82
BHEL 9.64
NTPC 8.31
TATAPOWER 6.57
INDIACEMENTS 5.30
TATACONSULTANCYSERVICES 4.92
SAIL 4.82
RELIANCECOMMUNICATION 4.68
TATAMOTORS 4.65
GRASIMINDUSTRIES 4.30
MUL 4.16
TISCO 3.92
JAIPRAKASHASSOCIATES 3.63
HINDALCO 3.10
WIPRO 2.87
M&M 2.84
RELIANCEINFRASTRUCTURE 2.83
STERLITEINDUSTRIES 2.64
ACC 2.51
SUNPHARMACEUTICALS 1.71
DLF 1.59
RANBAXYLABORATORIES 1.46
STERLITEINDUSTRIES 33.59SUNPHARMACEUTICALS 30.87RELIANCEINFRASTRUCTURE 25.30M&M 24.72WIPRO 23.98ACC 19.88HINDALCO 19.26JAIPRAKASHASSOCIATES 18.33TATAMOTORS 14.48DLF 14.18
RANBAXYLABORATORIES 9.33
Total Equity 2308.48
Cash ‘n’ Call, Current Assets & Receivables 2.30

MUTUAL INTEREST12 5MUTUAL INTEREST
SNAPSHOT
31st January 2005
The investment objective of the scheme isto provide capital growth in long-term withreasonable risk levels by investing mainlyin companies which are in sector/s, whichhave a high growth potential at that pointto time.
Equity - Diversified
Dividend / Growth
Investment upto 1 crore: 2.25%Investment above 1 crore: Nil
Nil
Rs. 5000/-
Redemption on all businessdays
On all business days
SIP / SWP / STP / AWOCA
Available
1st January 1997
To provide capital growth alongwithtax rebate and tax relief u/s 80 C toour investors through PrudentInvestments in the stock market.
ELSS
Dividend / Growth
2.25%
Nil
Rs. 500/-
Redemption on all businessdays
On all business days
SIP / SWP / STP / AWOCA
Available
21st September 2004
Debt
Plan A / Plan B
Monthly Div. / Quarterly Div. / Yearly Div. /Growth
Nil
For application size upto 25 lakh: 0.5% if exit within6 months from the date of investment.For application size > 25 lakh: 0.25% if exit within3 months from the date of Investment.
Rs. 25000 for Monthly Div. / Rs. 15000 forQuarterly Div. / Rs. 10000 for yearlyDiv. / Rs. 5000 for Growth
Redemption on all business days
On all business days
SIP / SWP / STP / AWOCA
Available
The investment objective of the scheme is togenerate regular income by investing mainly infloating rate instruments / fixed rate instrumentsswapped for floating rate return so as to minimisethe interest rate risk and at the same time aiming atgenerating capital appreciation in a long term byinvesting in equity / equity related instruments.
14th November 02
To provide capitalgrowth by investing in index stocks.
Equity - Index
Sensex / Nifty / Sensex Advantage
Dividend / Growth
Investment upto 1 crore: 2.25%Investment above 1 crore: Nil
Nil
Rs. 2000/-
Redemption on all business days
On all business days
SIP / SWP / STP / AWOCA
Available
16th April 98
To obtain maximum possible maximumpossible growth consistent withreasonable levels of safety and securityby investing mainly in equities.
Equity - Diversified
Dividend / Growth
Investment upto 1 crore: 2.25%Investment above 1 crore: Nil
Nil
Rs. 2000/-
Redemption on all business days
On all business days
SIP / SWP / STP / AWOCA
Available
1st January 91
To provide regular returns & capitalappreciation according to the slection of theplan by investing in equities & debt.
Balanced
Dividend / Growth
Investment upto 1 crore: 2.25%Investment above 1 crore: Nil
Nil
Rs. 1000/-
Redemption on all business days
On all business days
SIP / SWP / STP / AWOCA
Available
Index Fund Growth Fund Balanced Fund Equity Fund
Opportunities Fund Tax Plan Floater MIP
SIP: SWP: STP: AWOCA:Note :
Systematic Investment Plan; Systematic Withdrawal Plan; Systematic Transfer Plan; Automatic Withdrawal of Capital AppreciationSWP & AWOCA are available under growth options only.
1st September 99
To provide capital growth by investingin a mix of equity instruments.
Equity - Diversified
Dividend / Growth
Investment upto 1 crore: 2.25%Investment above 1 crore: Nil
Nil
Rs. 2000/-
Redemption on all business days
On all business days
SIP / SWP / STP / AWOCA
Available
LICMF EQUITY FUNDAn Open-ended Equity Scheme
LICMF OPPORTUNITIES FUNDAn Open-ended Growth Scheme
TOTAL FUND : Rs. Lakh(as on 31 )/03/2009 5307.80
NAV (Rs.) as on 31/03/2009: Dividend: 6.1849; Growth: 10.8664
PORTFOLIO (as on 31/03/2009)
Expense Ratio (as on 31/03/2009) : 1.96%
Holdings Mkt. Value %(Rs. Lakh) Contribution
Holdings Mkt. Value %(Rs. Lakh) Contribution
Last 1 year
Since Inception
-38.11%Last 3 year -10.85%
2.10%Benchmark (BSE-200) Return Last 1 year -40.98%
ANNUALISED RETURNS
(Past Performance may or may not be Sustained in Future)
DIVIDEND HISTORYMonth DividendFeb-06 20.00%Oct-06 25.00%Nov-07 30.00%
Income Plus Fund
28th May 2007
To provide reasonable possible currentincome - consistent with preservationof capital & providing liquidity frominvesting in a diversified portfolio ofShort-Term Money Market & Debtsecurities.
Debt
Dividend Frequency :Daily / Weekly / Monthly
Dividend / Growth
Nil
Nil
Rs.5,00,000/-
Redemption on all business days
On all business days
STP
Available
PORTFOLIO (as on 31/03/2009)
Equity
L & T 336.33 6.34%
S B I 319.97 6.03%
TATA POWER 191.33 3.60%
BHARTI TELEVENTURE 188.80 3.56%
H D F C 183.46 3.46%
N T P C 180.20 3.40%
I C I C I BANK 166.30 3.13%
POWER FINANCE CORPORATION 159.28 3.00%
BANK OF INDIA 153.93 2.90%
O N G C 148.14 2.79%
H D F C BANK 145.18 2.74%
RELIANCE INFRASTRUCTURE 133.01 2.51%
INFRASTRUCTURE DEVELOPMENT FINANCE 124.66 2.35%
PUNJAB NATIONAL BANK 123.27 2.32%
R I L 121.86 2.30%
A C C 115.33 2.17%
POWER GRID CORPORATION OF INDIA 114.78 2.16%
B H E L 105.30 1.98%
RELIANCE PETROLEUM 95.15 1.79%
CONCOR 85.94 1.62%
POWER TRADING CORPORATION OF INDIA 76.29 1.44%
PUNJ LLOYD 72.92 1.37%
RELIANCE COMMUNICATION 69.84 1.32%
PETRONET LNG 58.28 1.10%
S A I L 53.36 1.01%
JAIPRAKASH ASSOCIATES 50.52 0.95%
ABAN OFFSHORE 27.98 0.53%
T I S C O 20.60 0.39%
CAIRN INDIA 18.41 0.35%
IDEA CELLULAR 5.02 0.09%
RENAISSANCE JEWELLERY 0.02 0.00%
Total - Equity 3645.42 68.68%
Debt 0.00
Total - Debt 0.00 0.00%
Cash ‘n’ Call, Current Assets & Receivables 1662.38 31.32%
An Open-ended Equity Scheme
PORTFOLIO (as on 31/03/2009) PORTFOLIO (as on 31/03/2009)
Holdings Mkt. Value %(Rs. Lakh) Holdings
TOTAL FUND : Rs. 6386.75 Lakh(as on 31 )/03/2009
NAV (Rs.) as on 31/03/2009: Dividend: 5.6969; Growth: 14.4580
DIVIDEND HISTORY
Month DividendMar-04 12.00%Mar-05 10.00%Nov-05 20.00%Oct-06 25.00%Nov-07 50.00%
Expense Ratio (as on ) : %31/03/2009 0.89
Holdings Mkt. Value %(Rs. Lakh) Holdings
Equity
BHARTI TELEVENTURE 531.93 8.33%
S B I 373.48 5.85%
L & T 371.89 5.82%
PUNJAB NATIONAL BANK 348.70 5.46%
BANK OF INDIA 340.85 5.34%
I C I C I BANK 329.27 5.16%
N T P C 320.74 5.02%
JAIPRAKASH ASSOCIATES 181.03 2.83%
PETRONET LNG 155.59 2.44%
RELIANCE INFRASTRUCTURE 151.01 2.36%
RELIANCE PETROLEUM 142.73 2.23%
CAIRN INDIA 128.84 2.02%
SUN PHARMACEUTICALS 122.57 1.92%
TATA POWER 114.80 1.80%
KOTAK MAHINDRA BANK 113.18 1.77%
I F C I 96.50 1.51%
RELIGARE ENTERPRISES 81.88 1.28%
INFRASTRUCTURE DEVELOPMENT FINANCE 78.59 1.23%
H D F C 70.56 1.10%
I O C L 58.10 0.91%
TATA MOTORS 56.69 0.89%
PROVOGUE (INDIA) 49.91 0.78%
H D F C BANK 48.39 0.76%
PAREKH ALUMINEX 46.19 0.72%
AXIS BANK 41.45 0.65%
M & M 38.32 0.60%
ALPHAGEO INDIA 13.58 0.21%
RENAISSANCE JEWELLERY 0.06 0.00%
Total Equity 4406.82 69.00%
Debt 0.00 0.00%
Total Debt 0.00 0.00%
Cash ‘n’ Call, Current Assets & Receivables 1979.93 31.00%
ANNUALISED RETURNS
(Past Performance may or may not be Sustained in Future)
Last 1 year -35.59%Last 3 years -10.01%Since Inception 5.38%Benchmark (Sensex) Return Last 1 year -37.94%

MUTUAL INTEREST6 11MUTUAL INTEREST
LICMF BOND FUNDAn Open-ended Debt Scheme
LICMF LIQUID FUNDAn Open-ended Liquid Scheme
PORTFOLIO (as on 31/03/2009)
Bonds / Debentures
Commercial Papers
Certificate of Deposit
NHB HDFC AAA 12597.50
WELSPUN GUJARAT STAHL ROHREN A+ 10570.00
I R F C AAA 9166.92
I C I C I BANK AAA 5521.00
P F C AAA 2491.25
H D F C AAA 1568.55
TGS INVESTMENT & TRADE A1+ 30000.00
REI AGRO PR1 28900.00
ALOK INDUSTRIES PR1 23040.00
JAIPRAKASH ASSOCIATES PR1+ 23000.00
VIDEOCON INDUSTRIES F1 22500.00
TRAPTI TRADING & INVESTMENT PVT LTD A1+ 20000.00
BIRLA TMT HOLDING P1+ 10000.00
JINDAL STEEL & POWER A1+ 10000.00
GENUS POWER INFRA F1 8800.00
MAGMA LEASING AA 8385.00
PIRAMAL HEALTHCARE A1+ 7175.00
BLUE BIRD (IND) PR1 7000.00
TATA REALTY AND INFRASTRUCTURE LTD PR1+(SO) 7000.00
SHRIRAM TRANSPORT FINANCE AA 6700.00
ORIENT PAPERS & INDUSTRIES A1+ 5000.00
DEWAN HOUSING FINANCE AA+ 5000.00
TRAPTI TRADING & INVESTMENT A1+ 5000.00
EURO CERAMICS PR1+ 4000.00
RELIGARE FINVEST A1+ 3800.00
KOUTONS RETAIL INDIA PR1 3538.80
COX AND KINGS PR1+ 3500.00
MAGMA LEASING AA- 3000.00
VALECHA ENGINEERING PR1 2500.00
FIRST LEASING PR1 1498.77
SREI INFRASTRUCTURE FINANCE AA 1392.31
HINDUSTTHAN NATIONAL GLASS & INDS PR1+ 1320.00
STERLING BIO-TECH PR1 1260.00
B. SEENAIAH & CO. (PROJECTS) LTD. A1 1200.00
VIDEOCON INDUSTRIES F1 1200.00
BALLARPUR INDUSTRIES F1+ 575.00
PMT MACHINES LTD PR1 400.00
COX AND KINGS PR1 100.00
RELIANCE CAPITAL A1+ 84527.80
INDIABULLS FINANCIAL SERVICES P1+ 84332.40
TATA CAPITAL A1+ 36960.19
ADLABS FILMS A1+ 18996.19
RELIGARE FINVEST A1+ 18318.57
ICICI HOME FINANCE COMPANY A1+ 18146.02
SHRIRAM TRANSPORT FINANCE F1+ 17981.21
MAGMA FINCORP PR1+ 13695.38
TATA MOTORS A1+ 13605.45
BHUSHAN STEEL & STRIPS PR1+ 9157.53
MERCATOR LINES PR1+ 9095.66
FIRST LEASING PR1+ 9012.82
TATA CAPITAL LTD A1+ 8937.90
IL&FS INVESTSMART F1+ 8916.12
TELEVISION EIGHTEEN A1+ 8629.33
DALMIA CEMENT A1+ 8221.51
UTV SOFTWARE COMMUNICATION LTD. A1+ 7221.93
ESSAR SHIPPING PORTS & LOGISTICS F1 6626.75
FUTURE CAPITAL HOLDINGS P1 5630.79
KALPATARU POWER TRANSMISSION PR1+ 4770.72
RELIGARE SECURITIES P1 4542.47
BAJAJ AUTO FINANCE P1+ 4509.78
PATEL ENGINEERING PR1+ 4485.57
ORIX AUTO INFRASTRUCTURE SERVICES PR1+ 4465.60
ABG SHIPYARD PR1+ 4397.06
RAYMOND PR1+ 3922.61
VYSYA BANK P1+ 24149.91
ORIENTAL BANK OF COMMERCE P1+ 9250.93
EXIM AAA 9248.24
ANDHRA BANK F1+ 9247.44
I D B I BANK P1+ 7663.69
VIJAYA BANK PR1+ 4916.33
Last 1 yearLast 3 yearSince Inception (18.03.2002)
9.23%8.28%6.96%
Benchmark © Fund ~LX) Return (Last 1 year) 8.80%
ANNUALISED RETURNS
(Past Performance may or may not be Sustained in Future)
Holdings Rating Mkt. Value(Rs. lakhs)
PORTFOLIO (as on 31/03/2009)
Holdings Rating Mkt. Value(Rs. lakhs)
TOTAL FUND : Rs. 1102275.31Lakh(as on 31 )/03/2009
NAV (Rs.) as on 31/03/2009: Dividend: 10.9801; Growth: 16.0772
Expense Ratio (as on 31/03/2009) : 0.47%
DIVIDEND HISTORY
Mar-02 0.0204May-02 0.0472Oct-03 0.0400Nov-03 0.0337Dec-03 0.0421Jan-04 0.0327Feb-04 0.0335Mar-04 0.0298Apr-04 0.0329May-04 0.0368Jun-04 0.0285Jul-04 0.0145Aug-04 0.0417Sep-04 0.0339Oct-04 0.0333Nov-04 0.0448Dec-04 0.0348Jan-05 0.0461Feb-05 0.0400Mar-05 0.0422Apr-05 0.03933992May-05 0.04240000Jun-05 0.04089337Jul-05 0.04210000Aug-05 0.04250000Sep-05 0.04100000Oct-05 0.04455476Nov-05 0.04749685Dec-05 0.04943670Jan-06 0.05202764Feb-06 0.04836850Mar-06 0.07196284Apr-06 0.05065708May-06 0.05328228
Avg. Maturity (in month) : 5.99
Avg. Duration (in month) : 5.69
Jun-06 0.05243226Jul-06 0.05969500Aug-06 0.06310000Sep-06 0.06340000Oct-06 0.06860000Nov-06 0.06750000Dec-06 0.06280627Jan-07 0.07300000Feb-07 0.06420000Mar-07 0.07660000Apr-07 0.07970000May-07 0.07980000
Jun-07 0.06120000Jul-07 0.05370000Aug-07 0.06730000Sep-07 0.06430000Oct-07 0.06980000Nov-07 0.07360000Dec-07 0.07930000Jan-08 0.07750000Feb-08 0.07470000Mar-08 0.07973000Apr-08 0.07280000May-08 0.07830000Jun-08 0.08110000Jul-08 0.08440000Aug-08 0.08610000Sep-08 0.08700000Oct-08 0.09810000Nov-08 0.08640000Dec-08 0.08750000Jan-09 0.07920000Feb-09 0.08620000Mar-09 0.06830000
Month Gross DividendMonth Gross Dividend
UNITED BANK OF INDIA A1+ 4855.43
I D B I BANK A1+ 4844.20
CANARA BANK P1+ 4608.93
VYSYA BANK 20000.00
H D F C BANK 18800.00
CENTRAL BANK OF INDIA 13100.00
FEDERAL BANK 7500.00
AXIS BANK 2500.00
PUNJAB NATIONAL BANK 500.00
Bank Deposits
Cash ‘n’ Call, Current Assets & Receivables 243282.76
PORTFOLIO (as on )31/03/2009
TOTAL FUND : Rs. 8965.65 Lakh(as on 31/03/2009)
NAV (Rs.) as on 31/03/2009: Dividend: 10.6026; Growth: 24.4363
DIVIDEND HISTORY
Last 1 yearLast 3 years .Since inception (09.05.1999) 9.
11.54%8 57%
29%
Benchmark (C CompBex) Return (Last 1 year) 7.26%
ANNUALISED RETURNS
PORTFOLIO RATING ANALYSIS
Month Gross Div. (%) Month Gross Div. (%)
(Past Performance may or may not be Sustained in Future)
DEBT
COMMERCIAL PAPER/ BANK DEPOSIT
Cash ‘n’ Call, Current Assets & Receivables 829.11
I O C L AA+ 1161.59
RURAL ELECTRIFICATION CORPORATION AAA 966.52
T I S C O AA 877.06
S A I L AAA(SO) 536.94
GSEC 8.33% 2036 AAA 530.20
H U D C O AA 524.81
CITI BANK AAA 515.30
JET AIRWAYS (JUS TRUST PTC) AAA(SO) 400.62
R I L AAA 207.86
BOB HOUSING FINANCE(PTC NHB) AAA(SO) 96.83
DEVELOMENT CREDIT BANK A- 1154.11
I R F C AAA 1105.25
ANDHRA BANK PTC (NHB) AAA(SO) 59.44
Holdings Rating Mkt. Value (Rs. lakhs)
LICMF G-SEC FUNDAn Open-ended Gilt Scheme
PORTFOLIO (as on 31/03/2009)
GSEC 7.95%2032 AAA 5070.00
GSEC 7.95% 2032 AAA 4056.00
RURAL ELECTRIFICATION CORPORATION AAA 2899.57
GSEC 8.33% 2036 AAA 2120.80
GSEC 8.24% .2027 AAA 459.89
Commercial Paper / Bank Deposit
Cash ‘n’ Call, Current Assets & Receivables 881.68
TOTAL FUND : Rs. 15487.94 Lakh(as on 31 )/03/2009
Last 1 year
Last 3 years
Since inception (29.11.1999)
6.65%
5.68%
8.49%
Benchmark (I Sec Composite Gilt) Return
Last 1 year 12.97%
ANNUALISED RETURNS
(Past Performance may or may not be Sustained in Future)
NAV (Rs.) as on / /20010.5462 21.5971;
12.4538; 12.4538
31 03 9Reg.: ; Reg.Gr.:
PF-Div. PF-Gr. :
Securities Mkt. Value (Rs. Lakhs)Rating DIVIDEND HISTORY
Month Gross Div. (%) Month Gross Div. (%)
Mar-00 2.50%
May-00 2.50%
Nov-00 2.50%
Mar-01 3.50%
Jul-01 3.00%
Nov-01 3.50%
Mar-02 7.00%
Jul-02 3.00%
Oct-02 3.50%
Jan-03 4.00%
Apr-03 4.00%
Jun-03 3.50%
Sep-03 3.50%
Dec-03 3.00%
Mar-04 3.00%
Jun-04 0.75%
Sep-04 0.50%
Mar-09 2.00%
Expense Ratio (as on ) : 1. %31/03/2009 11
Expense Ratio (as on ) : 1. %31/03/2009 31
Oct-99 4.00%Mar-00 4.50%May-00 3.00%Nov-00 3.50%Mar-01 4.50%Jul-01 4.00%Nov-01 3.50%Mar-02 3.50%Jul-02 3.00%Oct-02 3.00%Jan-03 3.00%Jun-03 2.25%Sep-03 2.25%Dec-03 2.00%Mar-04 1.50%Jun-04 1.00%Sep-04 0.50%Dec-04 1.00%
Mar-05 1.50%Jul-05 1.50%Oct-05 1.00%Jan-06 1.00%Mar-06 1.00%Jul-06 2.00%Oct-06 4.00%Jan-07 1.00%Mar-07 1.00%Jul-07 2.50%Oct-07 2.50%Jan-08 2.00%Mar-08 1.50%Jul-08 1.50%Oct-08 1.50%Jan-09 2.00%Mar-09 2.50%
Avg. Maturity (in years) : 5.47
Avg. Duration (in years) : 4.93
Avg. Maturity (in years) : 18.20
Avg. Duration (in years) : 16.38
AAA (SO)12.20%
AAA,AA+,P1+ orEquivalent59.73%
Money Market & Other22.07%
AA, AA-, A, PR1+(SO)& Others28.51%
AAA37.09%
AA+12.96%
Money Market9.25%
P1, , A+AA-- orEquivalent12.54%
Bank Deposits5.66%

MUTUAL INTEREST10 7MUTUAL INTEREST
LICMF FLOATING RATE FUND - STPAn Open-ended Income Fund
PORTFOLIO (as on )31/03/2009
TOTAL FUND : Rs. 83941.05 Lakhs(as on 31/03/2009)
LICMF SAVINGS PLUS FUND(An open-ended income scheme)
PORTFOLIO (as on )31/03/2009
Debt Instruments
Commercial Paper
Certificate of Deposits
Bank Deposits
Cash 'n' Call, Current Assets & Receivables 2737.11
WELSPUN GUJARAT STAHL ROHREN A+ 2430.00
VIDEOCON INDUSTRIES F1 5000.00
ARCH PHARMALABS A1 5000.00
TRAPTI TRADING & INVESTMENT PVT LTD A1+ 4000.00
RAMSARUP INDUSTRIES PR1 4000.00
BALLARPUR INDUSTRIES F1+ 2500.00
PIRAMAL HEALTHCARE A1+ 2500.00
TATA CAPITAL A1+ 9243.22
ADLABS FILMS A1+ 4746.95
BAJAJ AUTO FINANCE P1+ 4524.59
INDIABULLS FINANCIAL SERVICES P1+ 2410.70
UTV SOFTWARE COMMUNICATION LTD. A1+ 2383.81
SUNDARAM FINANCE A1+ 1639.74
DALMIA CEMENT A1+ 584.30
RAYMOND PR1+ 570.64
VIJAYA BANK PR1+ 4916.33
I D B I BANK A1+ 4844.20
VYSYA BANK P1+ 4629.63
I D B I BANK P1+ 1572.48
BANK OF INDIA 10000.00
TOTAL FUND Rs. 80233.71 Lakh(as on 31/03/2009) :
Last 1 year 7.88%Last 3 years 7.02%Since Inception 5.78%
Benchmark (C Fund ~LX) Return 8.80%
ANNUALISED RETURNS
(Past Performance may or may not be Sustained in Future)
Holdings Rating Mkt. Value
(Rs. lakhs)
DIVIDEND DECLARED (Dividend Option)
Jul-03 0.0500Aug-03 0.0500Sep-03 0.0350Oct-03 0.0350Nov-03 0.0350Dec-03 0.0317Jan-04 0.0293Feb-04 0.0275Apr-04 0.0306May-04 0.0373Jun-04 0.0353Jul-04 0.0391Aug-04 0.0389Sep-04 0.0389Oct-04 0.0389Nov-04 0.0389Dec-04 0.0350Jan-05 0.0250Feb-05 0.0100Mar-05 0.0458Apr-05 0.0458May-05 0.0458Jun-05 0.0458Jul-05 0.0458Aug-05 0.0458Sep-05 0.0350Oct-05 0.0400Nov-05 0.04162Dec-05 0.04167Jan-06 0.04167Feb-06 0.04167Mar-06 0.01400672Apr-06 0.04167000May-06 0.04167000
Month Gross Div. (%)Month Gross Div. (%)Jun-06 0.05000000Jul-06 0.05000000Aug-06 0.05000000Sep-06 0.05000000Oct-06 0.05000000Nov-06 0.05000000Dec-06 0.03000000Jan-07 0.07000000Feb-07 0.04000000Mar-07 0.08000000Apr-07 NilMay-07 NilJun-07 0.02000000Jul-07 0.02000000Aug-07 0.04000000Sep-07 0.05000000Oct-07 0.09000000Nov-07 0.07520000Dec-07 0.09680000Jan-08 0.09670000Feb-08 0.10240000Mar-08 0.07810000Apr-08 0.06460000May-08 0.06340000Jun-08 0.03380000Jul-08 0.01930000Aug-08 0.07390000Sep-08 0.07160000Oct-08 0.04880000Nov-08 0.06650000Dec-08 0.01030000Jan-09 0.55670000Feb-09 0.06320000Mar-09 0.06970000
NAV (Rs.) as on 31/03/2009: Dividend: 10.1484; Growth: 14.3305
GROSS DIVIDEND DECLARED (Rs. Per Unit)
Last 1 year 9.80%
Last 3 year 8.81%
Since Inception 7.39%
Benchmark (C Fund ~LX) Return 8.80%
(Past Performance may or may not be Sustained in Future)
Expense Ratio (as on 31/03/2009) : 0.50%
LICMF BALANCED FUNDAn Open-ended Balanced Scheme
EQUITY PORTFOLIO (as on 31/03/2009)
Holdings Mkt. Value (Rs. lakhs)
Bonds / Debentures
Commercial Paper
Certificate of Deposit
Bank Depost
Cash ‘n’ Call, Current Assets & Receivables 28934.54
JAIPRAKASH ASSOCIATES PR1+ 5000.00
RELIANCE CAPITAL A1+ 4541.56INDIABULLS FINANCIAL SERVICES P1+ 4506.95TATA MOTORS A1+ 4505.73FIRST LEASING PR1+ 2703.44TELEVISION EIGHTEEN F1 1415.31IDFC A1+ 978.21TELEVISION EIGHTEEN A1+ 951.29DLF A1+ 740.06
I D B I BANK A1+ 4844.20VYSYA BANK P1+ 4819.76
BANK OF INDIA 20000.00
TOTAL FUND : Rs. Lakh(as on 31/03/2009) 2443.77
DEBT PORTFOLIO (as on 31/03/2009)
Debt
TOTAL - DEBT 1189.54
Cash ‘n’ Call, Current Assets & Receivables 230.27
RURAL ELECTRIFICATION CORPORATION AAA 96.65GSEC 6.05% 02/02/2019 AAA 93.24ALOK INDUSTRIES PR1 300.00IL&FS INVESTSMART F1(SO) 299.65RELIANCE CAPITAL A1+ 200.00BAJAJ HINDUSTAN F1 200.00
Holdings Rating Mkt. Value (Rs. lakhs)
NAV (Rs.) as on 31/03/2009 : Dividend: 8.1817; Growth: 38.7092
Last 1 yearLast 3 yearsSince Inception 5.
-23.37%-3.25%
31%
Benchmark (C BalanceEx) Return (Last 1 year) -22.34%
ANNUALISED RETURNS
(Past Performance may or may not be Sustained in Future)
Expense Ratio (as on 31/03/2009) : 2.15%
Month DividendNov-04 3.50%Mar-05 8.50%Aug-05 10.00%Nov-05 7.50%Feb-06 8.50%Apr-06 17.00%Sep-06 10.00%Jan-07 15.00%Oct-07 15.00%
DIVIDEND HISTORY
Avg. Maturity (in years) : 0.76
Avg. Duration (in years) : 0.68
Expense Ratio (as on 31/03/2009) : 0.60%
Avg. Maturity (in month) : 6.67
Avg. Duration (in month) : 6.00
Avg. Maturity (in month) : 2.63
Avg. Duration (in month) : 2.50
Equity
Total Equity 1023.96
POWER GRID CORPORATION OF INDIA 188.03
N T P C 126.14
INFRASTRUCTURE DEVELOPMENT FINANCE 116.53
BHARTI TELEVENTURE 93.87
POWER FINANCE CORPORATION 88.31
G A C L 71.30
POWER TRADING CORPORATION OF INDIA 69.35
RELIANCE COMMUNICATION 52.38
UCO BANK 51.96
PUNJ LLOYD 45.58
L & T 33.63
PVR 29.66
MERCATOR LINES 26.94
S A I L 19.29
CENTURY TEXTILES 11.00
Holdings Rating Market Value(Rs. in Lakhs)
Jan-05 0.1250
May-05 0.0425
Jun-05 0.0377
Jul-05 0.0392
Aug-05 0.0490
Sep-05 0.0392
Oct-05 0.04687965
Nov-05 0.04059843
Dec-05 0.03919996
Jan-06 0.04899995
Feb-06 0.03919996
Mar-06 0.03919996
Apr-06 0.03919999
May-06 0.05522018
Jun-06 0.04748464
Jul-06 0.06431700
Aug-06 0.05345360
Sep-06 0.05495360
Oct-06 0.071817000
Nov-06 0.06095360
Dec-06 0.05386606
Jan-07 0.07841700
Feb-07 0.06585360
Mar-07 0.06555360
Apr-07 0.09231700
May-07 0.07105360
Jun-07 0.05555360
Jul-07 0.06071700
Aug-07 0.06475360
Sep-07 0.07391700
Oct-07 0.06845360
Nov-07 0.06515360
Dec-07 0.06975360
Jan-08 0.09361700
Feb-08 0.07255360
Mar-08 0.09801700
Apr-08 0.06945360
May-08 0.07005360
Jun-08 0.08871700
Jul-08 0.07485360
Aug-08 0.07655360
Sep-08 0.09821700
Oct-08 0.08135360
Nov-08 0.08115360
Dec-08 0.09231700
Jan-09 0.07085360
Feb-09 0.06962420
Mar-09 0.07181700
LICMF CHILDREN’S FUNDAn Open-ended Balanced Scheme for Children
TOTAL FUND : Rs. Lakh(as on 31/03/2009) 467.82
NAV (Rs.) as on 31/03/2009 : 6.5737
Last 1 year
Last 3 years
Since inception (12/11/2001)
-50.75%
-21.96%
-5.47%
Benchmark ) Return Last 1 year(C BalanceEx -22.34%
ANNUALISED RETURNS
(Past Performance may or may not be Sustained in Future)
Expense Ratio (as on 31/03/2009) : 2.24%
PORTFOLIO (as on 31/03/2009)
Equity
Total Equity 277.48Debt
Total Debt 0.00Commercial Paper/ Bank Deposits
Cash ‘n’ Call, Current Assets & Receivables 190.34
R I L 53.31S B I 52.26ADLABS FILMS 30.51RELIANCE INFRASTRUCTURE 20.61I F C I 19.30ADANI ENTERPRISES 18.69RELIANCE CAPITAL 17.68JAIPRAKASH ASSOCIATES 16.84PROVOGUE (INDIA) 16.78KNR CONSTRUCTIONS 11.69GTC INDUSTRIES 8.11RELIANCE COMMUNICATION 6.98ORBIT CORPORATION 4.71RENAISSANCE JEWELLERY 0.01
Holdings Rating Mkt. Value (Rs. lakhs) Avg. Maturity (in month) : 0.00
Avg. Duration (in month) : 0.00
Equity59.31%
AAA,AA+,P1+ orEquivalent40.02%
ANNUALISED RETURNS
Money Mkt.,9.42%
Equity,41.90%Debt,
4 .8 68%
Money Mkt.%40.69
NAV (Rs.) as on 31/03/2009: Daily Dividend : 10.0000;Monthly Dividend: 10.0697; Weekly Divedend: 10.0025; Growth: 13.8716
P1,AA-- ,A+ orEquivalent1
1.69%
Money Market & Others34.47%
Bank Deposits23.83%

MUTUAL INTEREST8 9MUTUAL INTEREST
LICMF MONTHLY INCOME PLANAn Open-ended Monthly Income Scheme w.e.f. 01/06/2003
EQUITY PORTFOLIO (as on 31/03/2009)
Last 1 year
Since Inception
-0.46%Last 3 years 5.56%
9.57%Benchmark (C MiPex) Return(Last 1 year) 0.50%
ANNUALISED RETURNS
DEBT PORTFOLIO (as on 31/03/2009)
Debt
TOTAL - DEBT 8555.04Commercial Paper / Bank DepositsCash 'n' Call, Current Assets & Receivables 822.13
GSEC 6.05% 02/02/2019 AAA 186.48ERA CONSTRUCTION F2+ 1620.38IL&FS INVESTSMART F1(SO) 1548.18BAJAJ HINDUSTAN F1 1500.00RELIANCE CAPITAL A1+ 1500.00FIRST LEASING PR1+ 1200.00ALOK INDUSTRIES PR1 1000.00
0.00
(Past Performance may or may not be Sustained in Future)
DIVIDEND DECLARED
Jun-03 Monthly 0.0500Jul-03 Monthly 0.0500Aug-03 Monthly 0.0500Sep-03 Monthly 0.0600Oct-03 Monthly 0.0700Nov-03 Monthly 0.0700Dec-03 Monthly 0.0800Jan-04 Monthly 0.0800Feb-04 Monthly 0.0850Mar-04 Monthly 0.0800Mar-04 Yearly 0.8500Apr-04 Monthly 0.0700May-04 Monthly 0.0585Jun-04 Monthly 0.0500Jul-04 Monthly 0.0550Aug-04 Monthly 0.0550Sep-04 Monthly 0.0550Sep-04 Quarterly 0.0500Oct-04 Monthly 0.0550Nov-04 Monthly 0.0550Dec-04 Monthly 0.0650Dec-04 Quarterly 0.1000Jan-05 Monthly 0.0650Feb-05 Monthly 0.0700Mar-05 Monthly 0.2500Mar-05 Quarterly 0.3000Mar-05 Yearly 0.9500Apr-05 Monthly 0.0550May-05 Monthly 0.0550Jun-05 Monthly 0.0700
Jun-05 Quarterly 0.1800Jul-05 Monthly 0.0900Aug-05 Monthly 0.0900Sep-05 Monthly 0.1400Sep-05 Quarterly 0.2200Oct-05 Monthly 0.0800Nov-05 Monthly 0.1000Dec-05 Monthly 0.1200Dec-05 Quarterly 0.3000Jan-06 Monthly 0.1500Feb-06 Monthly 0.1500Mar-06 Monthly 0.3000Mar-06 Quarterly 0.7000Mar-06 Yearly 1.4000Apr-06 Monthly 0.1500May-06 Monthly 0.1500Jun-06 Monthly 0.1200Jun-06 Quarterly 0.2000Jul-06 Monthly 0.1200Aug-06 Monthly 0.1200Sep-06 Monthly 0.1400Sep-06 Quarterly 0.4000Oct-06 Monthly 0.1400Nov-06 Monthly 0.1400Dec-06 Monthly 0.1200Dec-06 Quarterly 0.4000Jan-07 Monthly 0.1000Feb-07 Monthly NilMar-07 Monthly NilMar-07 Quarterly 0.1500
Month Frequency GrossDiv.(Rs/Unit)
Month Frequency GrossDiv.(Rs/Unit)
Month Frequency GrossDiv.(Rs/Unit)
Equity
TOTAL - EQUITY 1393.61
N T P C 163.95
BHARTI TELEVENTURE 156.45
S B I 127.99
INDRAPRASTHA GAS 117.48
POWER GRID CORPORATION OF INDIA 110.00
H D F C BANK 96.79
GMR INFRASTRUCTURE 94.90
PETRONET LNG 77.70
PUNJAB NATIONAL BANK 61.64
L & T 60.54
B H E L 60.17
SUN PHARMACEUTICALS 55.62
RELIANCE POWER LTD 51.25
R I L 45.70
H D F C 42.34
PUNJ LLOYD 31.90
JAIPRAKASH ASSOCIATES 16.84
INDIAN OVERSEAS BANK 11.38
CENTURY TEXTILES 11.00
LICMF FLOATER MIPAn Open-ended income Scheme
PLAN - A PORTFOLIO (as on 31/03/2009)
Equity
Bonds / Debenture
Commercial paper
Bank Deposits
Cash 'n' Call, Current Assets & Receivables 332.76
N T P C 189.21
POWER GRID CORPORATION OF INDIA 143.48
PETRONET LNG 58.28
GMR INFRASTRUCTURE 47.45
INFRASTRUCTURE DEVELOPMENT FINANCE 40.65
POWER TRADING CORPORATION OF INDIA 34.68
L & T 33.63
PUNJ LLOYD 22.79
RELIANCE POWER LTD 20.50
VOLTAS 16.15
RELIANCE PETROLEUM 6.66
INDIAN OVERSEAS BANK 4.55
GSEC 8.24% 2018 AAA 543.00
GSEC 6.05% 02/02/2019 AAA 466.20
RURAL ELECTRIFICATION CORPORATION AAA 289.96
BAJAJ HINDUSTAN F1 700.00
ALOK INDUSTRIES PR1 660.00
IL&FS INVESTSMART F1(SO) 599.30
RELIANCE CAPITAL A1+ 400.00
0.00
0.00
TOTAL FUND 31 3 : Rs. Lakh(as on /0 /2009) 4609.23
NAV (Rs.) as on 31/03/2009
9.8559; 10.1545;9.8880; Growth : 14.6143
Month Income : Yearly Income :
Quarterly :
TOTAL FUND 31 : Rs. 262.97 Lakhs(as on )/03/2009
DIVIDEND HISTORY
Month FrequencyGross Div. (Rs/Unit)
Plan A Plan B
Dec-04 Monthly 0.0500 0.0500Dec-04 Quarterly 0.0500 0.0250Jan-05 Monthly 0.0500 0.0500Feb-05 Monthly 0.0550 0.0500Mar-05 Monthly 0.0700 NilMar-05 Quarterly 0.1800 0.0850Mar-05 Yearly 0.2500 0.1100May-05 Monthly 0.0500 NilJun-05 Monthly 0.0600 0.0450Jun-05 Quarterly 0.1500 0.1000Jul-05 Monthly 0.0600 0.0450Aug-05 Monthly 0.0600 0.0450Sep-05 Monthly 0.1200 0.0900Sep-05 Quarterly 0.2100 0.2000Oct-05 Monthly 0.0300 0.0450Nov-05 Monthly 0.1000 0.0850Dec-05 Monthly 0.1200 0.0900Dec-05 Quarterly 0.2500 0.2000Jan-06 Monthly 0.1400 NilFeb-06 Monthly 0.1400 NilMar-06 Monthly 0.3100 0.2500Mar-06 Quarterly 0.5900 0.3500Mar-06 Yearly 1.2000 0.8500Apr-06 Monthly 0.1000 0.0700May-06 Monthly 0.0300 0.0500Jun-06 Monthly Nil NilJun-06 Quarterly 0.2100 0.2000Jul-06 Monthly 0.1000 0.0200Aug-06 Monthly 0.1000 0.1200Sep-06 Monthly 0.1400 0.0700Sep-06 Quarterly 0.2600 0.3000Oct-06 Monthly 0.1000 0.0600Nov-06 Monthly 0.1300 0.0500Dec-06 Monthly 0.1500 NilDec-06 Quarterly 0.3800 0.1000Jan-07 Monthly 0.1400 NilFeb-07 Monthly Nil NilMar-07 Monthly Nil 0.0500Mar-07 Quarterly 0.2000 0.0500Mar-07 Yearly 0.9000 0.5000Apr-07 Monthly 0.1000 0.0400May-07 Monthly 0.1000 0.0700Jun-07 Monthly 0.1500 0.1000Jun-07 Quarterly 0.2500 0.2000Jul-07 Monthly 0.1000 0.1000Aug-07 Monthly 0.1000 0.0700Sep-07 Monthly 0.1000 0.0600Sep-07 Quarterly 0.3000 0.3000Oct-07 Monthly 0.1500 0.0500Nov-07 Monthly 0.2000 0.1000Dec-07 Monthly 0.2000 0.1000Dec-07 Quarterly 0.5000 0.2500Jan-08 Monthly 0.1000 0.2500Feb-08 Monthly 0.1500 0.3000Mar-08 Monthly 0.0000 0.0000Mar-08 Quarterly 0.3500 0.0000Mar-08 Yearly 1.6000 0.4000Apr-08 Monthly 0.0000 0.0000May-08 Monthly 0.0000 0.0000Jun-08 Monthly 0.0000 0.0000Jun-08 Quarterly 0.0000 0.0000Jul-08 Monthly 0.0000 0.0000Aug-08 Monthly 0.0000 0.0000Sep-08 Monthly 0.0700 0.0000Sep-08 Quarterly 0.2000 0.0000Oct-08 Monthly 0.0000 0.0000Nov-08 Monthly 0.0000 0.0000Dec-08 Monthly 0.0000 0.0000Jan-09 Monthly 0.0000 0.0000Feb-09 Monthly 0.0000 0.0000Mar-09 Monthly 0.0000 0.0000
Last 1 year 0.48%
Last 3 years 6.83%
Since Inception 8.90%
Benchmark (C MiPex) Return - last 1 year 0.50%
ANNUALISED RETURNS
(Past Performance may or may not be Sustained in Future)
ANNUALISED RETURNS
(Past Performance may or may not be Sustained in Future)
NAV (Rs.) as on 31/03/2009
9.3846; 10.1077;
9.7076; 12.0753
Month Income : Yearly Income :
Quarterly : Growth :
Holdings Rating Mkt. Value(Rs. lakhs)
Expense Ratio (as on 31/03/2009) : 1.44%
Expense Ratio (as on ) : 1. %31/03/2009 88
Holdings Rating Market Value(Rs. in Lakhs)
Holdings Rating Market Value(Rs. in Lakhs)
TOTAL FUND 31 3 : Rs. 10770.78 Lakh(as on /0 /2009)
NAV (Rs.) as on 31/03/2009Monthly Income : Yearly Income :
Quarterly : Growth :
9.7197; 10.0241;
9.8006; 27.1440
Expense Ratio (as on 31/03/2009) : 1.62%
Avg. Maturity (in years) : 0.48
Avg. Duration (in years) : 0.43
Avg. Maturity (in months) : 47.70
Avg. Duration (in ) : .months 42 93
Avg. Maturity (in ) : 1.
Avg. Duration (in ) : 1.
month 33
month 20
PLAN - B PORTFOLIO (as on 31/03/2009)
Equity
Bonds/Debentures
Bank Deposits
Cash 'n' Call, Current Assets & Receivables 183.02
ALOK INDUSTRIES PR1 40.00
IL&FS INVESTSMART F1(SO) 39.95
Holdings Rating Mkt. Value
(Rs. Lakhs)
Category Exposure % Exposure %(Rs. Lakh) Contribution (Rs. Lakh) Contribution
Plan A Plan B
Total 4609.23 100.00% 262.97 100.00%
Equity 618.02 13.41% 0.00 0.00%Debt 3658.45 79.37% 79.95 30.40%Money Mkt. 332.76 7.22% 183.02 69.60%
LICMF INDIA VISION FUNDA 36 months Close ended Equity Fund with an automatic conversion into
an Open ended scheme on expiry of 36 months from the date of allotment (15/01/2007).
TOTAL FUND 31 3 : Rs. 7234.44 Lakh(as on /0 /2009)
NAV (Rs.) as on 31/03/2009: Dividend: 5.6475; Growth: 5.6475
PORTFOLIO (as on 31/03/2009)
Equity
POWER GRID CORPORATION OF INDIA 487.82
S B I 472.48
INFRASTRUCTURE DEVELOPMENT FINANCE 379.40
POWER FINANCE CORPORATION 363.17
INFOSYS TECHNOLOGIES 331.03
N T P C 319.38
POWER TRADING CORPORATION OF INDIA 312.08
DEEPAK FERTILISERS 281.95
GMR INFRASTRUCTURE 260.98
INDRAPRASTHA GAS 217.54
APOLLO HOSIPTALS & ENTERPRISES 204.10
L & T 168.16
B H E L 150.44
SUN PHARMACEUTICALS 111.24
RELIANCE POWER LTD 102.50
PUNJ LLOYD 91.15
TV TODAY NETWORK 79.08
PETRONET LNG 77.70
INDO TECH TRANSFORMERS 74.95
MERCATOR LINES 38.21
Holdings Mkt. Value (Rs. lakhs)
PORTFOLIO (as on 31/03/2009)
YES BANK 37.43
PVR 36.02
S A I L 24.11
VOLTAS 13.85
J K CORP 10.80
PROVOGUE (INDIA) 0.36
RENAISSANCE JEWELLERY 0.03
RURAL ELECTRICIFICATION CORPORATION AAA 483.26
IL&FS INVESTSMART F1(SO) 249.71
0.00
TOTAL-EQUITY 4645.92
Debt
TOTAL-DEBT 732.97
Commercial Paper/Bank Deposits
Cash 'n' Call, Current Assets & Receivables 1855.55
Holdings Mkt. Value (Rs. Lakhs)
Expense Ratio (as on 31/03/2009) : 2.50%
Category Exposure (Rs. Lakh) % ContributionEquity 1393.61 12.94%Debt 8555.04 79.43%Money Mkt. 822.13 7.63%Total 10770.78 100.00%
Last 1 year
Since Inception -22.80%
-48.99%
Benchmark (BSE 200) Return Last 1 year -40.98%
ANNUALISED RETURNS
(Past Performance may or may not be Sustained in Future)
Mar-07 Yearly 0.9000Apr-07 Monthly 0.0700May-07 Monthly 0.1000Jun-07 Monthly 0.0800Jun-07 Quarterly 0.2000Jul-07 Monthly 0.1200Aug-07 Monthly 0.1200Sep-07 Monthly 0.1200Sep-07 Quarterly 0.3500Oct-07 Monthly 0.1800
Nov-07 Monthly 0.2000Dec-07 Monthly 0.2000Dec-07 Quarterly 0.5000Jan-08 Monthly 0.2500Feb-08 Monthly 0.0700Mar-08 Monthly 0.0000Mar-08 Quarterly 0.2000Mar-08 Yearly 1.6000Apr-08 Monthly 0.0000May-08 Monthly 0.0000Jun-08 Monthly 0.0000Jul-08 Monthly 0.0000Aug-08 Monthly 0.0000Spet-08 Monthly 0.0000Sep-08 Quarterly 0.1500Oct-08 Monthly 0.0000Nov-08 Monthly 0.0000Dec-08 Monthly 0.0000Jan-09 Monthly 0.0000Feb-09 Monthly 0.0000Mar-09 Monthly 0.0000
Last 1 year 0.48%Last 3 years 2.47%Since Inception 4.31%Benchmark (C MiPex) Return - last 1 year 0.50%
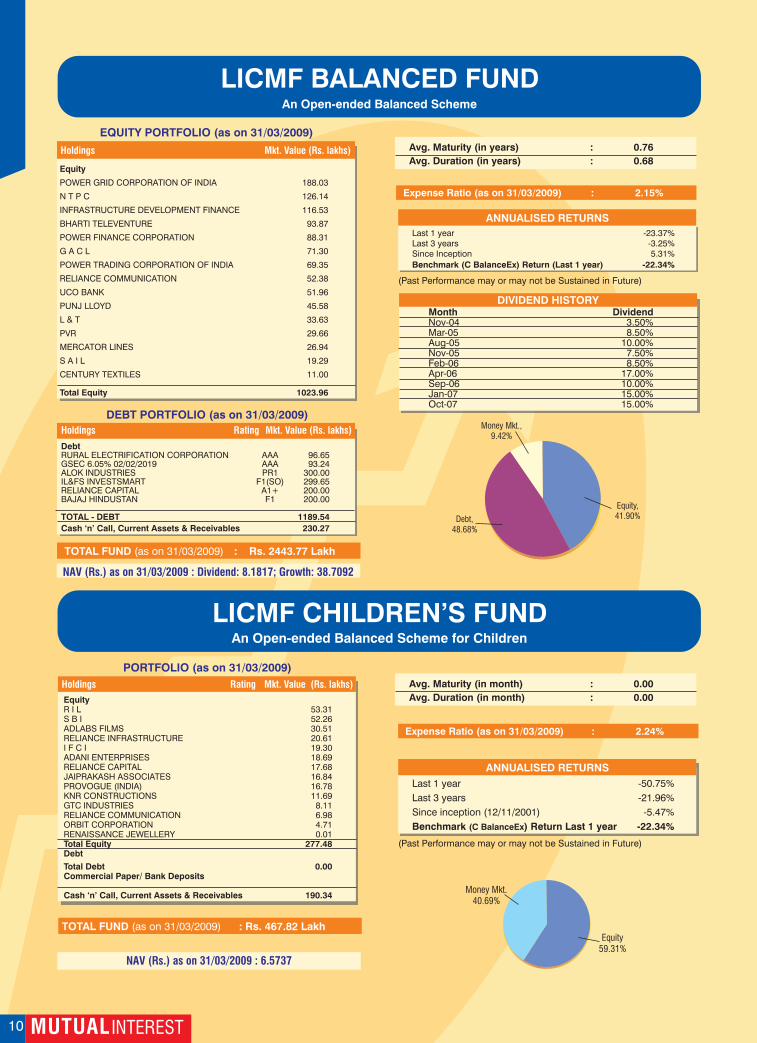
MUTUAL INTEREST10 7MUTUAL INTEREST
LICMF FLOATING RATE FUND - STPAn Open-ended Income Fund
PORTFOLIO (as on )31/03/2009
TOTAL FUND : Rs. 83941.05 Lakhs(as on 31/03/2009)
LICMF SAVINGS PLUS FUND(An open-ended income scheme)
PORTFOLIO (as on )31/03/2009
Debt Instruments
Commercial Paper
Certificate of Deposits
Bank Deposits
Cash 'n' Call, Current Assets & Receivables 2737.11
WELSPUN GUJARAT STAHL ROHREN A+ 2430.00
VIDEOCON INDUSTRIES F1 5000.00
ARCH PHARMALABS A1 5000.00
TRAPTI TRADING & INVESTMENT PVT LTD A1+ 4000.00
RAMSARUP INDUSTRIES PR1 4000.00
BALLARPUR INDUSTRIES F1+ 2500.00
PIRAMAL HEALTHCARE A1+ 2500.00
TATA CAPITAL A1+ 9243.22
ADLABS FILMS A1+ 4746.95
BAJAJ AUTO FINANCE P1+ 4524.59
INDIABULLS FINANCIAL SERVICES P1+ 2410.70
UTV SOFTWARE COMMUNICATION LTD. A1+ 2383.81
SUNDARAM FINANCE A1+ 1639.74
DALMIA CEMENT A1+ 584.30
RAYMOND PR1+ 570.64
VIJAYA BANK PR1+ 4916.33
I D B I BANK A1+ 4844.20
VYSYA BANK P1+ 4629.63
I D B I BANK P1+ 1572.48
BANK OF INDIA 10000.00
TOTAL FUND Rs. 80233.71 Lakh(as on 31/03/2009) :
Last 1 year 7.88%Last 3 years 7.02%Since Inception 5.78%
Benchmark (C Fund ~LX) Return 8.80%
ANNUALISED RETURNS
(Past Performance may or may not be Sustained in Future)
Holdings Rating Mkt. Value
(Rs. lakhs)
DIVIDEND DECLARED (Dividend Option)
Jul-03 0.0500Aug-03 0.0500Sep-03 0.0350Oct-03 0.0350Nov-03 0.0350Dec-03 0.0317Jan-04 0.0293Feb-04 0.0275Apr-04 0.0306May-04 0.0373Jun-04 0.0353Jul-04 0.0391Aug-04 0.0389Sep-04 0.0389Oct-04 0.0389Nov-04 0.0389Dec-04 0.0350Jan-05 0.0250Feb-05 0.0100Mar-05 0.0458Apr-05 0.0458May-05 0.0458Jun-05 0.0458Jul-05 0.0458Aug-05 0.0458Sep-05 0.0350Oct-05 0.0400Nov-05 0.04162Dec-05 0.04167Jan-06 0.04167Feb-06 0.04167Mar-06 0.01400672Apr-06 0.04167000May-06 0.04167000
Month Gross Div. (%)Month Gross Div. (%)Jun-06 0.05000000Jul-06 0.05000000Aug-06 0.05000000Sep-06 0.05000000Oct-06 0.05000000Nov-06 0.05000000Dec-06 0.03000000Jan-07 0.07000000Feb-07 0.04000000Mar-07 0.08000000Apr-07 NilMay-07 NilJun-07 0.02000000Jul-07 0.02000000Aug-07 0.04000000Sep-07 0.05000000Oct-07 0.09000000Nov-07 0.07520000Dec-07 0.09680000Jan-08 0.09670000Feb-08 0.10240000Mar-08 0.07810000Apr-08 0.06460000May-08 0.06340000Jun-08 0.03380000Jul-08 0.01930000Aug-08 0.07390000Sep-08 0.07160000Oct-08 0.04880000Nov-08 0.06650000Dec-08 0.01030000Jan-09 0.55670000Feb-09 0.06320000Mar-09 0.06970000
NAV (Rs.) as on 31/03/2009: Dividend: 10.1484; Growth: 14.3305
GROSS DIVIDEND DECLARED (Rs. Per Unit)
Last 1 year 9.80%
Last 3 year 8.81%
Since Inception 7.39%
Benchmark (C Fund ~LX) Return 8.80%
(Past Performance may or may not be Sustained in Future)
Expense Ratio (as on 31/03/2009) : 0.50%
LICMF BALANCED FUNDAn Open-ended Balanced Scheme
EQUITY PORTFOLIO (as on 31/03/2009)
Holdings Mkt. Value (Rs. lakhs)
Bonds / Debentures
Commercial Paper
Certificate of Deposit
Bank Depost
Cash ‘n’ Call, Current Assets & Receivables 28934.54
JAIPRAKASH ASSOCIATES PR1+ 5000.00
RELIANCE CAPITAL A1+ 4541.56INDIABULLS FINANCIAL SERVICES P1+ 4506.95TATA MOTORS A1+ 4505.73FIRST LEASING PR1+ 2703.44TELEVISION EIGHTEEN F1 1415.31IDFC A1+ 978.21TELEVISION EIGHTEEN A1+ 951.29DLF A1+ 740.06
I D B I BANK A1+ 4844.20VYSYA BANK P1+ 4819.76
BANK OF INDIA 20000.00
TOTAL FUND : Rs. Lakh(as on 31/03/2009) 2443.77
DEBT PORTFOLIO (as on 31/03/2009)
Debt
TOTAL - DEBT 1189.54
Cash ‘n’ Call, Current Assets & Receivables 230.27
RURAL ELECTRIFICATION CORPORATION AAA 96.65GSEC 6.05% 02/02/2019 AAA 93.24ALOK INDUSTRIES PR1 300.00IL&FS INVESTSMART F1(SO) 299.65RELIANCE CAPITAL A1+ 200.00BAJAJ HINDUSTAN F1 200.00
Holdings Rating Mkt. Value (Rs. lakhs)
NAV (Rs.) as on 31/03/2009 : Dividend: 8.1817; Growth: 38.7092
Last 1 yearLast 3 yearsSince Inception 5.
-23.37%-3.25%
31%
Benchmark (C BalanceEx) Return (Last 1 year) -22.34%
ANNUALISED RETURNS
(Past Performance may or may not be Sustained in Future)
Expense Ratio (as on 31/03/2009) : 2.15%
Month DividendNov-04 3.50%Mar-05 8.50%Aug-05 10.00%Nov-05 7.50%Feb-06 8.50%Apr-06 17.00%Sep-06 10.00%Jan-07 15.00%Oct-07 15.00%
DIVIDEND HISTORY
Avg. Maturity (in years) : 0.76
Avg. Duration (in years) : 0.68
Expense Ratio (as on 31/03/2009) : 0.60%
Avg. Maturity (in month) : 6.67
Avg. Duration (in month) : 6.00
Avg. Maturity (in month) : 2.63
Avg. Duration (in month) : 2.50
Equity
Total Equity 1023.96
POWER GRID CORPORATION OF INDIA 188.03
N T P C 126.14
INFRASTRUCTURE DEVELOPMENT FINANCE 116.53
BHARTI TELEVENTURE 93.87
POWER FINANCE CORPORATION 88.31
G A C L 71.30
POWER TRADING CORPORATION OF INDIA 69.35
RELIANCE COMMUNICATION 52.38
UCO BANK 51.96
PUNJ LLOYD 45.58
L & T 33.63
PVR 29.66
MERCATOR LINES 26.94
S A I L 19.29
CENTURY TEXTILES 11.00
Holdings Rating Market Value(Rs. in Lakhs)
Jan-05 0.1250
May-05 0.0425
Jun-05 0.0377
Jul-05 0.0392
Aug-05 0.0490
Sep-05 0.0392
Oct-05 0.04687965
Nov-05 0.04059843
Dec-05 0.03919996
Jan-06 0.04899995
Feb-06 0.03919996
Mar-06 0.03919996
Apr-06 0.03919999
May-06 0.05522018
Jun-06 0.04748464
Jul-06 0.06431700
Aug-06 0.05345360
Sep-06 0.05495360
Oct-06 0.071817000
Nov-06 0.06095360
Dec-06 0.05386606
Jan-07 0.07841700
Feb-07 0.06585360
Mar-07 0.06555360
Apr-07 0.09231700
May-07 0.07105360
Jun-07 0.05555360
Jul-07 0.06071700
Aug-07 0.06475360
Sep-07 0.07391700
Oct-07 0.06845360
Nov-07 0.06515360
Dec-07 0.06975360
Jan-08 0.09361700
Feb-08 0.07255360
Mar-08 0.09801700
Apr-08 0.06945360
May-08 0.07005360
Jun-08 0.08871700
Jul-08 0.07485360
Aug-08 0.07655360
Sep-08 0.09821700
Oct-08 0.08135360
Nov-08 0.08115360
Dec-08 0.09231700
Jan-09 0.07085360
Feb-09 0.06962420
Mar-09 0.07181700
LICMF CHILDREN’S FUNDAn Open-ended Balanced Scheme for Children
TOTAL FUND : Rs. Lakh(as on 31/03/2009) 467.82
NAV (Rs.) as on 31/03/2009 : 6.5737
Last 1 year
Last 3 years
Since inception (12/11/2001)
-50.75%
-21.96%
-5.47%
Benchmark ) Return Last 1 year(C BalanceEx -22.34%
ANNUALISED RETURNS
(Past Performance may or may not be Sustained in Future)
Expense Ratio (as on 31/03/2009) : 2.24%
PORTFOLIO (as on 31/03/2009)
Equity
Total Equity 277.48Debt
Total Debt 0.00Commercial Paper/ Bank Deposits
Cash ‘n’ Call, Current Assets & Receivables 190.34
R I L 53.31S B I 52.26ADLABS FILMS 30.51RELIANCE INFRASTRUCTURE 20.61I F C I 19.30ADANI ENTERPRISES 18.69RELIANCE CAPITAL 17.68JAIPRAKASH ASSOCIATES 16.84PROVOGUE (INDIA) 16.78KNR CONSTRUCTIONS 11.69GTC INDUSTRIES 8.11RELIANCE COMMUNICATION 6.98ORBIT CORPORATION 4.71RENAISSANCE JEWELLERY 0.01
Holdings Rating Mkt. Value (Rs. lakhs) Avg. Maturity (in month) : 0.00
Avg. Duration (in month) : 0.00
Equity59.31%
AAA,AA+,P1+ orEquivalent40.02%
ANNUALISED RETURNS
Money Mkt.,9.42%
Equity,41.90%Debt,
4 .8 68%
Money Mkt.%40.69
NAV (Rs.) as on 31/03/2009: Daily Dividend : 10.0000;Monthly Dividend: 10.0697; Weekly Divedend: 10.0025; Growth: 13.8716
P1,AA-- ,A+ orEquivalent1
1.69%
Money Market & Others34.47%
Bank Deposits23.83%

MUTUAL INTEREST6 11MUTUAL INTEREST
LICMF BOND FUNDAn Open-ended Debt Scheme
LICMF LIQUID FUNDAn Open-ended Liquid Scheme
PORTFOLIO (as on 31/03/2009)
Bonds / Debentures
Commercial Papers
Certificate of Deposit
NHB HDFC AAA 12597.50
WELSPUN GUJARAT STAHL ROHREN A+ 10570.00
I R F C AAA 9166.92
I C I C I BANK AAA 5521.00
P F C AAA 2491.25
H D F C AAA 1568.55
TGS INVESTMENT & TRADE A1+ 30000.00
REI AGRO PR1 28900.00
ALOK INDUSTRIES PR1 23040.00
JAIPRAKASH ASSOCIATES PR1+ 23000.00
VIDEOCON INDUSTRIES F1 22500.00
TRAPTI TRADING & INVESTMENT PVT LTD A1+ 20000.00
BIRLA TMT HOLDING P1+ 10000.00
JINDAL STEEL & POWER A1+ 10000.00
GENUS POWER INFRA F1 8800.00
MAGMA LEASING AA 8385.00
PIRAMAL HEALTHCARE A1+ 7175.00
BLUE BIRD (IND) PR1 7000.00
TATA REALTY AND INFRASTRUCTURE LTD PR1+(SO) 7000.00
SHRIRAM TRANSPORT FINANCE AA 6700.00
ORIENT PAPERS & INDUSTRIES A1+ 5000.00
DEWAN HOUSING FINANCE AA+ 5000.00
TRAPTI TRADING & INVESTMENT A1+ 5000.00
EURO CERAMICS PR1+ 4000.00
RELIGARE FINVEST A1+ 3800.00
KOUTONS RETAIL INDIA PR1 3538.80
COX AND KINGS PR1+ 3500.00
MAGMA LEASING AA- 3000.00
VALECHA ENGINEERING PR1 2500.00
FIRST LEASING PR1 1498.77
SREI INFRASTRUCTURE FINANCE AA 1392.31
HINDUSTTHAN NATIONAL GLASS & INDS PR1+ 1320.00
STERLING BIO-TECH PR1 1260.00
B. SEENAIAH & CO. (PROJECTS) LTD. A1 1200.00
VIDEOCON INDUSTRIES F1 1200.00
BALLARPUR INDUSTRIES F1+ 575.00
PMT MACHINES LTD PR1 400.00
COX AND KINGS PR1 100.00
RELIANCE CAPITAL A1+ 84527.80
INDIABULLS FINANCIAL SERVICES P1+ 84332.40
TATA CAPITAL A1+ 36960.19
ADLABS FILMS A1+ 18996.19
RELIGARE FINVEST A1+ 18318.57
ICICI HOME FINANCE COMPANY A1+ 18146.02
SHRIRAM TRANSPORT FINANCE F1+ 17981.21
MAGMA FINCORP PR1+ 13695.38
TATA MOTORS A1+ 13605.45
BHUSHAN STEEL & STRIPS PR1+ 9157.53
MERCATOR LINES PR1+ 9095.66
FIRST LEASING PR1+ 9012.82
TATA CAPITAL LTD A1+ 8937.90
IL&FS INVESTSMART F1+ 8916.12
TELEVISION EIGHTEEN A1+ 8629.33
DALMIA CEMENT A1+ 8221.51
UTV SOFTWARE COMMUNICATION LTD. A1+ 7221.93
ESSAR SHIPPING PORTS & LOGISTICS F1 6626.75
FUTURE CAPITAL HOLDINGS P1 5630.79
KALPATARU POWER TRANSMISSION PR1+ 4770.72
RELIGARE SECURITIES P1 4542.47
BAJAJ AUTO FINANCE P1+ 4509.78
PATEL ENGINEERING PR1+ 4485.57
ORIX AUTO INFRASTRUCTURE SERVICES PR1+ 4465.60
ABG SHIPYARD PR1+ 4397.06
RAYMOND PR1+ 3922.61
VYSYA BANK P1+ 24149.91
ORIENTAL BANK OF COMMERCE P1+ 9250.93
EXIM AAA 9248.24
ANDHRA BANK F1+ 9247.44
I D B I BANK P1+ 7663.69
VIJAYA BANK PR1+ 4916.33
Last 1 yearLast 3 yearSince Inception (18.03.2002)
9.23%8.28%6.96%
Benchmark © Fund ~LX) Return (Last 1 year) 8.80%
ANNUALISED RETURNS
(Past Performance may or may not be Sustained in Future)
Holdings Rating Mkt. Value(Rs. lakhs)
PORTFOLIO (as on 31/03/2009)
Holdings Rating Mkt. Value(Rs. lakhs)
TOTAL FUND : Rs. 1102275.31Lakh(as on 31 )/03/2009
NAV (Rs.) as on 31/03/2009: Dividend: 10.9801; Growth: 16.0772
Expense Ratio (as on 31/03/2009) : 0.47%
DIVIDEND HISTORY
Mar-02 0.0204May-02 0.0472Oct-03 0.0400Nov-03 0.0337Dec-03 0.0421Jan-04 0.0327Feb-04 0.0335Mar-04 0.0298Apr-04 0.0329May-04 0.0368Jun-04 0.0285Jul-04 0.0145Aug-04 0.0417Sep-04 0.0339Oct-04 0.0333Nov-04 0.0448Dec-04 0.0348Jan-05 0.0461Feb-05 0.0400Mar-05 0.0422Apr-05 0.03933992May-05 0.04240000Jun-05 0.04089337Jul-05 0.04210000Aug-05 0.04250000Sep-05 0.04100000Oct-05 0.04455476Nov-05 0.04749685Dec-05 0.04943670Jan-06 0.05202764Feb-06 0.04836850Mar-06 0.07196284Apr-06 0.05065708May-06 0.05328228
Avg. Maturity (in month) : 5.99
Avg. Duration (in month) : 5.69
Jun-06 0.05243226Jul-06 0.05969500Aug-06 0.06310000Sep-06 0.06340000Oct-06 0.06860000Nov-06 0.06750000Dec-06 0.06280627Jan-07 0.07300000Feb-07 0.06420000Mar-07 0.07660000Apr-07 0.07970000May-07 0.07980000
Jun-07 0.06120000Jul-07 0.05370000Aug-07 0.06730000Sep-07 0.06430000Oct-07 0.06980000Nov-07 0.07360000Dec-07 0.07930000Jan-08 0.07750000Feb-08 0.07470000Mar-08 0.07973000Apr-08 0.07280000May-08 0.07830000Jun-08 0.08110000Jul-08 0.08440000Aug-08 0.08610000Sep-08 0.08700000Oct-08 0.09810000Nov-08 0.08640000Dec-08 0.08750000Jan-09 0.07920000Feb-09 0.08620000Mar-09 0.06830000
Month Gross DividendMonth Gross Dividend
UNITED BANK OF INDIA A1+ 4855.43
I D B I BANK A1+ 4844.20
CANARA BANK P1+ 4608.93
VYSYA BANK 20000.00
H D F C BANK 18800.00
CENTRAL BANK OF INDIA 13100.00
FEDERAL BANK 7500.00
AXIS BANK 2500.00
PUNJAB NATIONAL BANK 500.00
Bank Deposits
Cash ‘n’ Call, Current Assets & Receivables 243282.76
PORTFOLIO (as on )31/03/2009
TOTAL FUND : Rs. 8965.65 Lakh(as on 31/03/2009)
NAV (Rs.) as on 31/03/2009: Dividend: 10.6026; Growth: 24.4363
DIVIDEND HISTORY
Last 1 yearLast 3 years .Since inception (09.05.1999) 9.
11.54%8 57%
29%
Benchmark (C CompBex) Return (Last 1 year) 7.26%
ANNUALISED RETURNS
PORTFOLIO RATING ANALYSIS
Month Gross Div. (%) Month Gross Div. (%)
(Past Performance may or may not be Sustained in Future)
DEBT
COMMERCIAL PAPER/ BANK DEPOSIT
Cash ‘n’ Call, Current Assets & Receivables 829.11
I O C L AA+ 1161.59
RURAL ELECTRIFICATION CORPORATION AAA 966.52
T I S C O AA 877.06
S A I L AAA(SO) 536.94
GSEC 8.33% 2036 AAA 530.20
H U D C O AA 524.81
CITI BANK AAA 515.30
JET AIRWAYS (JUS TRUST PTC) AAA(SO) 400.62
R I L AAA 207.86
BOB HOUSING FINANCE(PTC NHB) AAA(SO) 96.83
DEVELOMENT CREDIT BANK A- 1154.11
I R F C AAA 1105.25
ANDHRA BANK PTC (NHB) AAA(SO) 59.44
Holdings Rating Mkt. Value (Rs. lakhs)
LICMF G-SEC FUNDAn Open-ended Gilt Scheme
PORTFOLIO (as on 31/03/2009)
GSEC 7.95%2032 AAA 5070.00
GSEC 7.95% 2032 AAA 4056.00
RURAL ELECTRIFICATION CORPORATION AAA 2899.57
GSEC 8.33% 2036 AAA 2120.80
GSEC 8.24% .2027 AAA 459.89
Commercial Paper / Bank Deposit
Cash ‘n’ Call, Current Assets & Receivables 881.68
TOTAL FUND : Rs. 15487.94 Lakh(as on 31 )/03/2009
Last 1 year
Last 3 years
Since inception (29.11.1999)
6.65%
5.68%
8.49%
Benchmark (I Sec Composite Gilt) Return
Last 1 year 12.97%
ANNUALISED RETURNS
(Past Performance may or may not be Sustained in Future)
NAV (Rs.) as on / /20010.5462 21.5971;
12.4538; 12.4538
31 03 9Reg.: ; Reg.Gr.:
PF-Div. PF-Gr. :
Securities Mkt. Value (Rs. Lakhs)Rating DIVIDEND HISTORY
Month Gross Div. (%) Month Gross Div. (%)
Mar-00 2.50%
May-00 2.50%
Nov-00 2.50%
Mar-01 3.50%
Jul-01 3.00%
Nov-01 3.50%
Mar-02 7.00%
Jul-02 3.00%
Oct-02 3.50%
Jan-03 4.00%
Apr-03 4.00%
Jun-03 3.50%
Sep-03 3.50%
Dec-03 3.00%
Mar-04 3.00%
Jun-04 0.75%
Sep-04 0.50%
Mar-09 2.00%
Expense Ratio (as on ) : 1. %31/03/2009 11
Expense Ratio (as on ) : 1. %31/03/2009 31
Oct-99 4.00%Mar-00 4.50%May-00 3.00%Nov-00 3.50%Mar-01 4.50%Jul-01 4.00%Nov-01 3.50%Mar-02 3.50%Jul-02 3.00%Oct-02 3.00%Jan-03 3.00%Jun-03 2.25%Sep-03 2.25%Dec-03 2.00%Mar-04 1.50%Jun-04 1.00%Sep-04 0.50%Dec-04 1.00%
Mar-05 1.50%Jul-05 1.50%Oct-05 1.00%Jan-06 1.00%Mar-06 1.00%Jul-06 2.00%Oct-06 4.00%Jan-07 1.00%Mar-07 1.00%Jul-07 2.50%Oct-07 2.50%Jan-08 2.00%Mar-08 1.50%Jul-08 1.50%Oct-08 1.50%Jan-09 2.00%Mar-09 2.50%
Avg. Maturity (in years) : 5.47
Avg. Duration (in years) : 4.93
Avg. Maturity (in years) : 18.20
Avg. Duration (in years) : 16.38
AAA (SO)12.20%
AAA,AA+,P1+ orEquivalent59.73%
Money Market & Other22.07%
AA, AA-, A, PR1+(SO)& Others28.51%
AAA37.09%
AA+12.96%
Money Market9.25%
P1, , A+AA-- orEquivalent12.54%
Bank Deposits5.66%
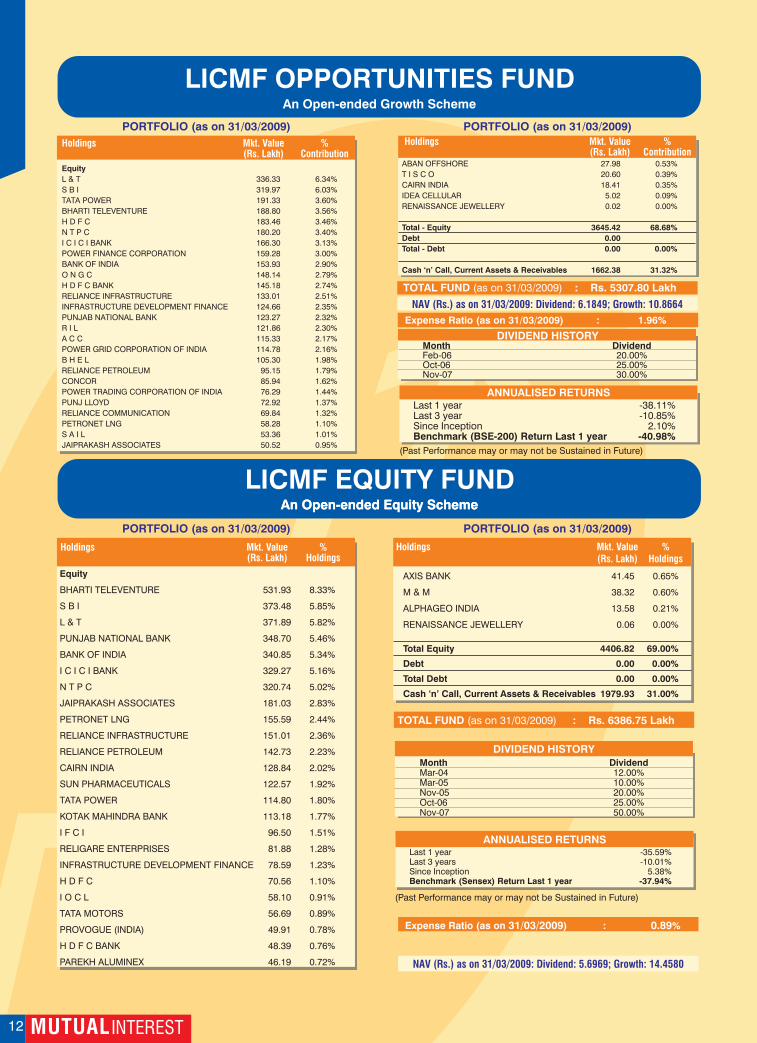
MUTUAL INTEREST12 5MUTUAL INTEREST
SNAPSHOT
31st January 2005
The investment objective of the scheme isto provide capital growth in long-term withreasonable risk levels by investing mainlyin companies which are in sector/s, whichhave a high growth potential at that pointto time.
Equity - Diversified
Dividend / Growth
Investment upto 1 crore: 2.25%Investment above 1 crore: Nil
Nil
Rs. 5000/-
Redemption on all businessdays
On all business days
SIP / SWP / STP / AWOCA
Available
1st January 1997
To provide capital growth alongwithtax rebate and tax relief u/s 80 C toour investors through PrudentInvestments in the stock market.
ELSS
Dividend / Growth
2.25%
Nil
Rs. 500/-
Redemption on all businessdays
On all business days
SIP / SWP / STP / AWOCA
Available
21st September 2004
Debt
Plan A / Plan B
Monthly Div. / Quarterly Div. / Yearly Div. /Growth
Nil
For application size upto 25 lakh: 0.5% if exit within6 months from the date of investment.For application size > 25 lakh: 0.25% if exit within3 months from the date of Investment.
Rs. 25000 for Monthly Div. / Rs. 15000 forQuarterly Div. / Rs. 10000 for yearlyDiv. / Rs. 5000 for Growth
Redemption on all business days
On all business days
SIP / SWP / STP / AWOCA
Available
The investment objective of the scheme is togenerate regular income by investing mainly infloating rate instruments / fixed rate instrumentsswapped for floating rate return so as to minimisethe interest rate risk and at the same time aiming atgenerating capital appreciation in a long term byinvesting in equity / equity related instruments.
14th November 02
To provide capitalgrowth by investing in index stocks.
Equity - Index
Sensex / Nifty / Sensex Advantage
Dividend / Growth
Investment upto 1 crore: 2.25%Investment above 1 crore: Nil
Nil
Rs. 2000/-
Redemption on all business days
On all business days
SIP / SWP / STP / AWOCA
Available
16th April 98
To obtain maximum possible maximumpossible growth consistent withreasonable levels of safety and securityby investing mainly in equities.
Equity - Diversified
Dividend / Growth
Investment upto 1 crore: 2.25%Investment above 1 crore: Nil
Nil
Rs. 2000/-
Redemption on all business days
On all business days
SIP / SWP / STP / AWOCA
Available
1st January 91
To provide regular returns & capitalappreciation according to the slection of theplan by investing in equities & debt.
Balanced
Dividend / Growth
Investment upto 1 crore: 2.25%Investment above 1 crore: Nil
Nil
Rs. 1000/-
Redemption on all business days
On all business days
SIP / SWP / STP / AWOCA
Available
Index Fund Growth Fund Balanced Fund Equity Fund
Opportunities Fund Tax Plan Floater MIP
SIP: SWP: STP: AWOCA:Note :
Systematic Investment Plan; Systematic Withdrawal Plan; Systematic Transfer Plan; Automatic Withdrawal of Capital AppreciationSWP & AWOCA are available under growth options only.
1st September 99
To provide capital growth by investingin a mix of equity instruments.
Equity - Diversified
Dividend / Growth
Investment upto 1 crore: 2.25%Investment above 1 crore: Nil
Nil
Rs. 2000/-
Redemption on all business days
On all business days
SIP / SWP / STP / AWOCA
Available
LICMF EQUITY FUNDAn Open-ended Equity Scheme
LICMF OPPORTUNITIES FUNDAn Open-ended Growth Scheme
TOTAL FUND : Rs. Lakh(as on 31 )/03/2009 5307.80
NAV (Rs.) as on 31/03/2009: Dividend: 6.1849; Growth: 10.8664
PORTFOLIO (as on 31/03/2009)
Expense Ratio (as on 31/03/2009) : 1.96%
Holdings Mkt. Value %(Rs. Lakh) Contribution
Holdings Mkt. Value %(Rs. Lakh) Contribution
Last 1 year
Since Inception
-38.11%Last 3 year -10.85%
2.10%Benchmark (BSE-200) Return Last 1 year -40.98%
ANNUALISED RETURNS
(Past Performance may or may not be Sustained in Future)
DIVIDEND HISTORYMonth DividendFeb-06 20.00%Oct-06 25.00%Nov-07 30.00%
Income Plus Fund
28th May 2007
To provide reasonable possible currentincome - consistent with preservationof capital & providing liquidity frominvesting in a diversified portfolio ofShort-Term Money Market & Debtsecurities.
Debt
Dividend Frequency :Daily / Weekly / Monthly
Dividend / Growth
Nil
Nil
Rs.5,00,000/-
Redemption on all business days
On all business days
STP
Available
PORTFOLIO (as on 31/03/2009)
Equity
L & T 336.33 6.34%
S B I 319.97 6.03%
TATA POWER 191.33 3.60%
BHARTI TELEVENTURE 188.80 3.56%
H D F C 183.46 3.46%
N T P C 180.20 3.40%
I C I C I BANK 166.30 3.13%
POWER FINANCE CORPORATION 159.28 3.00%
BANK OF INDIA 153.93 2.90%
O N G C 148.14 2.79%
H D F C BANK 145.18 2.74%
RELIANCE INFRASTRUCTURE 133.01 2.51%
INFRASTRUCTURE DEVELOPMENT FINANCE 124.66 2.35%
PUNJAB NATIONAL BANK 123.27 2.32%
R I L 121.86 2.30%
A C C 115.33 2.17%
POWER GRID CORPORATION OF INDIA 114.78 2.16%
B H E L 105.30 1.98%
RELIANCE PETROLEUM 95.15 1.79%
CONCOR 85.94 1.62%
POWER TRADING CORPORATION OF INDIA 76.29 1.44%
PUNJ LLOYD 72.92 1.37%
RELIANCE COMMUNICATION 69.84 1.32%
PETRONET LNG 58.28 1.10%
S A I L 53.36 1.01%
JAIPRAKASH ASSOCIATES 50.52 0.95%
ABAN OFFSHORE 27.98 0.53%
T I S C O 20.60 0.39%
CAIRN INDIA 18.41 0.35%
IDEA CELLULAR 5.02 0.09%
RENAISSANCE JEWELLERY 0.02 0.00%
Total - Equity 3645.42 68.68%
Debt 0.00
Total - Debt 0.00 0.00%
Cash ‘n’ Call, Current Assets & Receivables 1662.38 31.32%
An Open-ended Equity Scheme
PORTFOLIO (as on 31/03/2009) PORTFOLIO (as on 31/03/2009)
Holdings Mkt. Value %(Rs. Lakh) Holdings
TOTAL FUND : Rs. 6386.75 Lakh(as on 31 )/03/2009
NAV (Rs.) as on 31/03/2009: Dividend: 5.6969; Growth: 14.4580
DIVIDEND HISTORY
Month DividendMar-04 12.00%Mar-05 10.00%Nov-05 20.00%Oct-06 25.00%Nov-07 50.00%
Expense Ratio (as on ) : %31/03/2009 0.89
Holdings Mkt. Value %(Rs. Lakh) Holdings
Equity
BHARTI TELEVENTURE 531.93 8.33%
S B I 373.48 5.85%
L & T 371.89 5.82%
PUNJAB NATIONAL BANK 348.70 5.46%
BANK OF INDIA 340.85 5.34%
I C I C I BANK 329.27 5.16%
N T P C 320.74 5.02%
JAIPRAKASH ASSOCIATES 181.03 2.83%
PETRONET LNG 155.59 2.44%
RELIANCE INFRASTRUCTURE 151.01 2.36%
RELIANCE PETROLEUM 142.73 2.23%
CAIRN INDIA 128.84 2.02%
SUN PHARMACEUTICALS 122.57 1.92%
TATA POWER 114.80 1.80%
KOTAK MAHINDRA BANK 113.18 1.77%
I F C I 96.50 1.51%
RELIGARE ENTERPRISES 81.88 1.28%
INFRASTRUCTURE DEVELOPMENT FINANCE 78.59 1.23%
H D F C 70.56 1.10%
I O C L 58.10 0.91%
TATA MOTORS 56.69 0.89%
PROVOGUE (INDIA) 49.91 0.78%
H D F C BANK 48.39 0.76%
PAREKH ALUMINEX 46.19 0.72%
AXIS BANK 41.45 0.65%
M & M 38.32 0.60%
ALPHAGEO INDIA 13.58 0.21%
RENAISSANCE JEWELLERY 0.06 0.00%
Total Equity 4406.82 69.00%
Debt 0.00 0.00%
Total Debt 0.00 0.00%
Cash ‘n’ Call, Current Assets & Receivables 1979.93 31.00%
ANNUALISED RETURNS
(Past Performance may or may not be Sustained in Future)
Last 1 year -35.59%Last 3 years -10.01%Since Inception 5.38%Benchmark (Sensex) Return Last 1 year -37.94%

MUTUAL INTEREST4 13MUTUAL INTEREST
SCHEMES
26th March 99
To generate attractive returns forour investors by investing in qualitydebt securities and money marketinstruments.
Debt
Nil
1% if exit within 1 year forInvestment 1 Cr;
Nil for Investment > 1 Cr
Rs. 5000/-
On all business days
SIP / SWP / STP / AWOCA
Available
Dividend / Growth
Redemption on all business days
<
15th November 99
To generate steady and consistentreturns for our investors by timingthe government securities market.
Debt - Gilt
PF / Regular
Investment upto 1 crore : 1.25%
Nil
1% if Exit within 365 daysfrom the date of allotment
Regular Plan: Rs. 5,000/-PF Plan: Rs. 10000/-
Dividend / Growth
Investment above 1 crore : Nil
Nil
Redemption on all business days
On all business days
SIP / SWP / STP / AWOCA
Available
Regular Plan
PF Plan :
Regular Plan
PF Plan :
26th September 01
To generate long term capitalappreciation through judiciousmix of quality debt & equityinstrument at moderate risklevels through research basedinvestments.
Balanced
Nil
1% if exit within 3 years fromthe date of investment; Nil if exitafter 3 years from the date ofinvestment
Rs. 5000/-
Growth
Redemption on all business days
On all business days
SIP / SWP / STP / AWOCA
Available
29th May 03
To generate income by investing ina portfolio of quality short termdebt securities.
Debt - Short Term
Nil
Nil
Rs. 5000/-
Dividend / Growth
Redemption on all business days
On all business days
SIP / SWP / STP / AWOCA
Available
Bond Fund G-Sec Fund Savings Plus Fund Children’s Fund
11th March 02
To generate reasonable returnswith low risk and high liquiditythrough judicious mix of investmentin money market and quality debtinstruments
Debt - Liquid
Dividend / Growth
Nil
Nil
Rs. 25000/-
Redemption on all businessdays
On all days
STP
Available
1st June / 03
To generate regular income byinvesting mainly in quality debt andmoney market instruments withsome portion in equity/equityrelated instruments for long termcapital appreciation.
Debt
Monthly Div./Quarterly Div.Yearly Div./Growth
Nil
0.5% for investments25 lakhs for 6 months;
0.25% for investment> 25 lakhs for 3 months.
Rs. 25000/- for MonthlyOption; Rs.15000/- for QuarterlyOption; Rs.10000/- for YearlyOption; Rs.5000/- for Growth Option.
Redemption on all businessdays
On all business days
SIP / SWP / STP / AWOCA
Available
<
15th March 2004
To generate consistent returnsby investing mainly in floatingrate instruments/fixed rateinstruments swapped for floatingrate return so as to minimise theinterest rate risk for the investor.
Debt - Floating
Dividend / Growth
Nil
Nil
Rs. 5,000/- and thereafter inmultiples of Rs. 500/-.
Redemption on all businessdays
On all days
SIP / SWP / STP / AWOCA
Available
19th June 89
To generate long term capitalappreciation and offer Tax rebate u/s80 C as well as additional benefits ofa life & insurance cover free accidentinsurance cover.
Insurance linked tax saving
Single Premium-5/10 year termRegular Contribution-10/15 year term
Dividend Re-investment
2.25%
Nil
Rs. 10000/- under Single PremiumRs. 1000/- under Regular Premium-yearly option, Rs. 500/- underRegular Premium - monthly option
Redemption on all businessdays
On all business days
SIP / STP
Available
Liquid Fund Monthly Income Plan Unit Linked Insurance Scheme Floating Rate Fund - STP
Launch Date
Objective
Type
Plans
Options
Entry Load
Exit Load
Minimum Investment
Liquidity
NAV Declaration
Special Facilities
Nomination
Launch Date
Objective
Type
Plans
Options
Entry Load
Exit Load
Minimum Investment
Liquidity
NAV Declaration
Special Facilities
Nomination
LICMF INDEX FUNDAn Open-ended Index Linked Equity Scheme
Equity
TotalEquity 9590.06Cash‘n’Call, Current Assets & Receivables 259.31
RIL 1216.29ONGC 845.15NTPC 751.62BHARTITELEVENTURE 602.84INFOSYSTECHNOLOGIES 383.80BHEL 375.02ITC 354.09SBI 343.95TATACONSULTANCYSERVICES 266.50HUL 262.94RELIANCEPETROLEUM 217.57HDFCBANK 209.37POWERGRIDCORPORATIONOFINDIA 205.08HDFC 204.25SAIL 202.67L&T 198.72ICICIBANK 188.36RELIANCECOMMUNICATION 183.35WIPRO 181.61CAIRNINDIA 177.70GAIL 157.03DLF 144.37STERLITEINDUSTRIES 127.77RELIANCEPOWERLTD 124.82SUNPHARMACEUTICALS 116.45MUL 113.61HEROHONDAMOTORS 107.99CIPLA 87.71TATAPOWER 85.61IDEACELLULAR 79.03TISCO 75.77AXISBANK 75.47VSNL 74.46GRASIMINDUSTRIES 73.66NALCO 70.88BPCL 68.43PUNJABNATIONALBANK 65.59RELIANCEINFRASTRUCTURE 60.90ACC 54.41GACL 54.18M&M 49.04ABB 46.18SIEMENS 44.81RELIANCECAPITAL 44.76HINDALCO 44.39TATAMOTORS 41.32RANBAXYLABORATORIES 35.61HCLTECHNOLOGIES 34.41SUZLONENERGY 31.50UNITECH 29.00
NIFTY PLAN - PORTFOLIO (as on )31/03/2009
TOTAL FUND / : Rs. 9849.37 Lakh(as on 31/03 2009)
NAV (Rs.) as on 31/03/2009: Dividend: 6.3646; Growth: 17.2522
Last 1 yearLast 3 yearsSince Inception
(Last 1 year)
-37.82%-7.77%10.68%
Benchmark NSE - Nifty Return -36.19%
ANNUALISED RETURNS
EquityRIL 394.77INFOSYSTECHNOLOGIES 214.90ITC 162.71BHARTITELEVENTURE 136.82ICICIBANK 123.44L&T 118.00HDFCBANK 116.55HDFC 113.69ONGC 111.15SBI 101.52HUL 86.55BHEL 85.97NTPC 74.37TATACONSULTANCYSERVICES 43.99RELIANCECOMMUNICATION 42.06TATAPOWER 39.51MUL 37.24GRASIMINDUSTRIES 36.14TISCO 35.18
SENSEX PLAN PORTFOLIO (as on 31/03/2009)
Holdings Mkt. Value (Rs. lakhs)
SENSEX PLAN PORTFOLIO (as on 27/02/2009)
TOTAL FUND : Rs. 2310.78 Lakh(as on 31 )/03/2009
NAV (Rs.) as on 31/03/2009: Dividend: 6.4333; Growth: 18.7745
Expense Ratio (as on ) : 1. %31/03/2009 05
Last 1 yearsLast 3 yearsSince Inception
-41.87%-7.35%12.17%
Benchmark BSE - Sensex Return (Last 1 years) -37.94%
ANNUALISED RETURNS
SENSEX ADVT. PLAN PORTFOLIO (as on 31/03/2009)
Month Dividend (%)Nifty Sensex Sensex Advt.
Nov-03 13 13 15Jan-04 16 15 17Aug-05 25Nov-05 40Jan-06 50Feb-06 50Nov-06 50Feb-07 50Mar-07 20 20Mar-08 20 15
Expense Ratio (as on 31/03/2009) : 1.50%
(Past Performance may or may not be Sustained in Future)
(Past Performance may or may not be Sustained in Future)
Holdings Mkt. Value (Rs. lakhs)
Holdings Mkt. Value (Rs. lakhs)
TOTAL FUND : Rs. 375.51 Lakh(as on 31 )/03/2009
NAV (Rs.) as on 31/03/2009: Dividend: 7.2294; Growth: 17.4536
Expense Ratio (as on 31/03/2009) : 1.46%
Last 1 yearLast 3 yearsSince Inception
-37.72%-11.50%11.16%
Benchmark BSE - Sensex Return (Last 1 year) -37.94%
ANNUALISED RETURNS
DIVIDEND HISTORY
(Past Performance may or may not be Sustained in Future)
Holdings Mkt. Value (Rs. lakhs)Equtiy
Total Equity 315.02
Cash ‘n’ Call, Current Assets & Receivables 60.49
RIL 46.63
INFOSYSTECHNOLOGIES 23.93
AXISBANK 20.73
ITC 18.13
BHARATELECTRONICS 17.66
BHARTITELEVENTURE 17.36
ICICIBANK 13.73
L&T 13.12
HDFC 12.56
ONGC 12.45
SBI 11.45
HDFCBANK 10.99
HUL 9.82
BHEL 9.64
NTPC 8.31
TATAPOWER 6.57
INDIACEMENTS 5.30
TATACONSULTANCYSERVICES 4.92
SAIL 4.82
RELIANCECOMMUNICATION 4.68
TATAMOTORS 4.65
GRASIMINDUSTRIES 4.30
MUL 4.16
TISCO 3.92
JAIPRAKASHASSOCIATES 3.63
HINDALCO 3.10
WIPRO 2.87
M&M 2.84
RELIANCEINFRASTRUCTURE 2.83
STERLITEINDUSTRIES 2.64
ACC 2.51
SUNPHARMACEUTICALS 1.71
DLF 1.59
RANBAXYLABORATORIES 1.46
STERLITEINDUSTRIES 33.59SUNPHARMACEUTICALS 30.87RELIANCEINFRASTRUCTURE 25.30M&M 24.72WIPRO 23.98ACC 19.88HINDALCO 19.26JAIPRAKASHASSOCIATES 18.33TATAMOTORS 14.48DLF 14.18
RANBAXYLABORATORIES 9.33
Total Equity 2308.48
Cash ‘n’ Call, Current Assets & Receivables 2.30
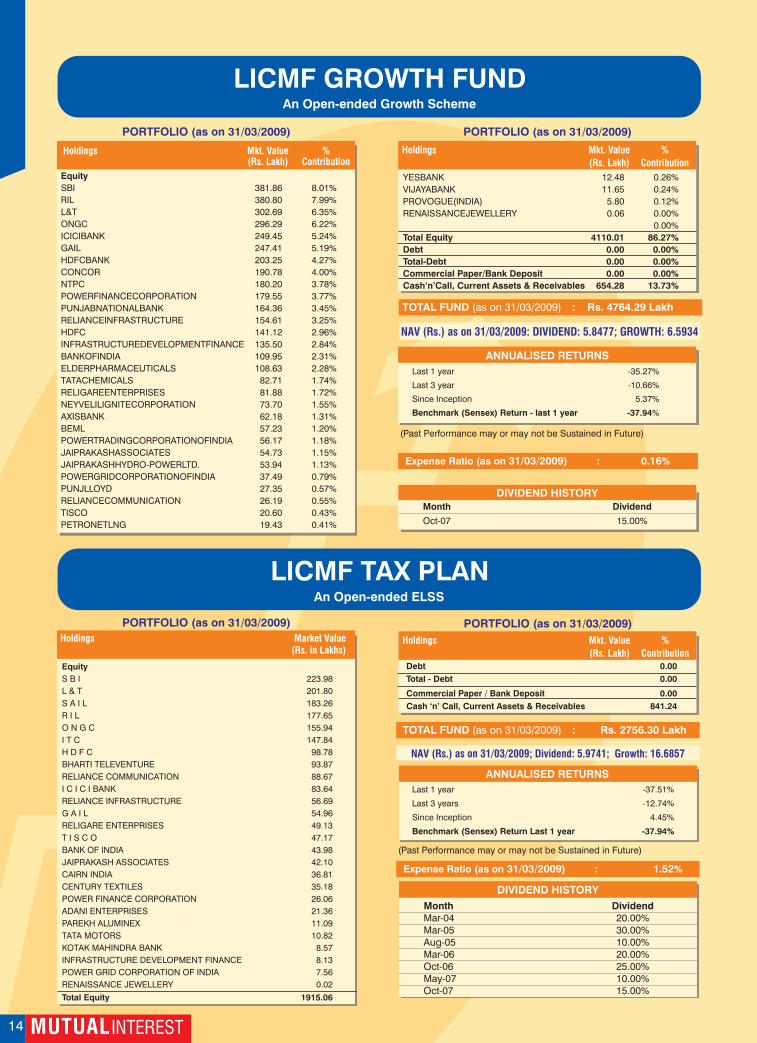
3MUTUAL INTERESTMUTUAL INTEREST14
LICMF GROWTH FUNDAn Open-ended SchemeGrowth
PORTFOLIO (as on 31/03/2009) PORTFOLIO (as on 31/03/2009)
YESBANK 12.48 0.26%
VIJAYABANK 11.65 0.24%
PROVOGUE(INDIA) 5.80 0.12%
RENAISSANCEJEWELLERY 0.06 0.00%
0.00%
Total Equity 4110.01 86.27%
Debt 0.00 0.00%
Total-Debt 0.00 0.00%
Commercial Paper/Bank Deposit 0.00 0.00%
Cash‘n’Call, Current Assets & Receivables 654.28 13.73%
Holdings Mkt. Value %
(Rs. Lakh) Contribution
TOTAL FUND : Rs. Lakh(as on 31 )/03/2009 4764.29
Expense Ratio (as on ) : 0. %31/03/2009 16
Last 1 year -35.27%
Last 3 year -10.66%
Since Inception 5.37%
%Benchmark (Sensex) Return - last 1 year -37.94
ANNUALISED RETURNS
(Past Performance may or may not be Sustained in Future)
Holdings Mkt. Value %(Rs. Lakh) Contribution
Equity
SBI 381.86 8.01%
RIL 380.80 7.99%
L&T 302.69 6.35%
ONGC 296.29 6.22%
ICICIBANK 249.45 5.24%
GAIL 247.41 5.19%
HDFCBANK 203.25 4.27%
CONCOR 190.78 4.00%
NTPC 180.20 3.78%
POWERFINANCECORPORATION 179.55 3.77%
PUNJABNATIONALBANK 164.36 3.45%
RELIANCEINFRASTRUCTURE 154.61 3.25%
HDFC 141.12 2.96%
INFRASTRUCTUREDEVELOPMENTFINANCE 135.50 2.84%
BANKOFINDIA 109.95 2.31%
ELDERPHARMACEUTICALS 108.63 2.28%
TATACHEMICALS 82.71 1.74%
RELIGAREENTERPRISES 81.88 1.72%
NEYVELILIGNITECORPORATION 73.70 1.55%
AXISBANK 62.18 1.31%
BEML 57.23 1.20%
POWERTRADINGCORPORATIONOFINDIA 56.17 1.18%
JAIPRAKASHASSOCIATES 54.73 1.15%
JAIPRAKASHHYDRO-POWERLTD. 53.94 1.13%
POWERGRIDCORPORATIONOFINDIA 37.49 0.79%
PUNJLLOYD 27.35 0.57%
RELIANCECOMMUNICATION 26.19 0.55%
TISCO 20.60 0.43%
PETRONETLNG 19.43 0.41%
LICMF TAX PLANAn Open-ended ELSS
PORTFOLIO (as on 31/03/2009)
DIVIDEND HISTORY
Month Dividend
Mar-04 20.00%Mar-05 30.00%Aug-05 10.00%Mar-06 20.00%Oct-06 25.00%May-07 10.00%Oct-07 15.00%
TOTAL FUND : Rs. 2756.30 Lakh(as on 31 )/03/2009
Expense Ratio (as on ) : 1. %31/03/2009 52
(Past Performance may or may not be Sustained in Future)
PORTFOLIO (as on 31/03/2009)
Holdings Mkt. Value %
(Rs. Lakh) Contribution
Debt 0.00
Total - Debt 0.00
Commercial Paper / Bank Deposit 0.00
Cash ‘n’ Call, Current Assets & Receivables 841.24
Equity
Total Equity 1915.06
S B I 223.98
L & T 201.80
S A I L 183.26
R I L 177.65
O N G C 155.94
I T C 147.84
H D F C 98.78
BHARTI TELEVENTURE 93.87
RELIANCE COMMUNICATION 88.67
I C I C I BANK 83.64
RELIANCE INFRASTRUCTURE 56.69
G A I L 54.96
RELIGARE ENTERPRISES 49.13
T I S C O 47.17
BANK OF INDIA 43.98
JAIPRAKASH ASSOCIATES 42.10
CAIRN INDIA 36.81
CENTURY TEXTILES 35.18
POWER FINANCE CORPORATION 26.06
ADANI ENTERPRISES 21.36
PAREKH ALUMINEX 11.09
TATA MOTORS 10.82
KOTAK MAHINDRA BANK 8.57
INFRASTRUCTURE DEVELOPMENT FINANCE 8.13
POWER GRID CORPORATION OF INDIA 7.56
RENAISSANCE JEWELLERY 0.02
Holdings Market Value(Rs. in Lakhs)
Last 1 year
Last 3 years
Since Inception
-37.51%
-12.74%
4.45%
Benchmark (Sensex) Return Last 1 year -37.94%
ANNUALISED RETURNS
DIVIDEND HISTORY
Month Dividend
Oct-07 15.00%
NAV (Rs.) as on 31/03/2009: DIVIDEND: 5.8477; GROWTH: 6.5934
NAV (Rs.) as on 31/03/2009; Dividend: 5.9741; Growth: 16.6857
The year that was….
Indices % Fall Indices % Fall
Sensex -37.94 BSE POWER -42.09
BSE FMCG -11.08 BSE 500 -42.77
HEALTHCARE -26.45 CAPITAL GOODS -53.84
BSE-oil and Gas -29.59 BSE Midcap -54.01
Auto -32.34 Consumer Durables -58.14
BSE-IT -35.57 Small-cap -58.6
Tech -38.93 Metal -58.67
Bankex -41.81 Realty -79.34
Indian Economy
The projected growth rate for the Indian economy is estimatedto be 6.5-7% for the year 2009 as per the PM's Advisory Counciland around 7.7% in the year 2010. The growth rate will bemoderate mainly due to fall in the Industrial growth and sloweragricultural growth. The inflation measured by the WPI hasreached in the trajectory of disinflation. The decliningcommodity prices and weakening demand resulting fromeconomic slowdown led to decline of the annual inflation rate tofall to another historic low of 0.27 per cent for the week endedMarch 14. The Rupee has been very volatile and weak againstdollar during the year. Gold as an asset class gave anappreciation of 29% in the last financial year which is anindicator of investors' attention shifting from financial assets totraditional commodities.
Currently, in order to increase the liquidity in the market, thegovernment and the Reserve Bank of India has introducedstimulus packages leading to softening of interest rates, cuttingof duties and tax rates. Falling Stock market, slowing real estatemarket and stringent lending which leads to slowconsumption/spending is leading the overall economy into adawdling phase.
However, with the new government in place, new reforms areexpected. India's banking system has been sound and resilientin the current financial turmoil.
The year 2008-2009 was a gloomy year for the Indian stockmarket. The unprecedented mayhem in the financial markets inUS that began in the late FY08 brought the entire world in itsclutches.
For the first time in five years the BSE Sensex gave negativereturns over the financial year. It closed at 9708 down 37.94 percent from the previous fiscal close of 15644. The broader 50-share Nifty closed at 3021 down 36.19 per cent from theprevious fiscal close of 4734.50.
Booking of losses under sub-prime loans by leading financialfirms in US and the credit crises in US led to fall of the entirefinancial system all over the world. The economic crises causedsteep fall of the stock markets across various countries and alsoled to temporarily close some of the stock markets. Indian Stockmarket fell drastically to 15332.42 levels on 22 January 2008from its peak of 20206.77 on 10 January 2008. The next majorshock came in September 08 with the filing of bankruptcy byLehaman Brothers, Sale of Merril Lynch to bank of America andrescue package for one of the largest insurer AIG which sufferedliquidity crisis led to major Financial meltdown across the globe.The Indian Stock market was no exception to this financialhavoc. The heavy selling by the FIIs, liquidity crunch and worriesabout global slowdown put pressure on the Indian stockmarket. The BSE Sensex touched the lowest of the year 7697.39on 27 October 08. However, from October to March 2009, themarkets have been moving in the range of 8000 to 11000 levels.The Indian economy along with the global economy fell into thevicious circle of slowdown. The regulators revised downwardEconomic growth estimates due to poor industrial output data.
The Sensex lost almost 6000 points during this financial year.The Mid-cap and Small-caps are more affected than the largecaps and the indices fell by 54% and 58.6% during the year.
Amongst the Sectoral indices, BSE Realty Index was the worsthit during the fiscal losing 79.34%. The real estate companystocks had a good rally in the last Bull Run. However, theseprices corrected sharply due to plunge in the real estate market
nd
th
th
Equity Market
owing to slow demand, higher interest costs and input cost. TheBSE Metal Index also lost 58.67% due to sharp fall in thecommodity prices. The most resilient sectors were FMCG andHealthcare that fell only 11.08% and 26.45% respectively. Thesteep fall in the oil prices led to fall in the prices of Oil companiesstocks.
The Foreign Institutional Investors (FIIs), the major participantsin the Indian stock market offloaded equities worth Rs.6151.50Crores during 2008-2009(sebi data). However, the FIIregistration showed a significant rise during the same period.The total number of registration of FII stood at 1635 and FII sub-accounts at 5015 as on 31st march 2009 against 1319 FIIs and3964 sub-accounts a year ago. The Domestic Institutionalinvestors tried to support the Indian Market by on buying side.The Mutual Funds bought shares worth Rs.1477.30 crore on31/03/2009.
The Elections are due in April 2009 and as per estimates,Rs. 10,000 crores is to be spent on it. From 1996 till date inspiteof 4 coalition governments into power India has managed togrow at 9 per cent rate. This time around as well, many fear ahung Lok Sabha. But any new government will try to continuereforms, wipe out the fiscal deficit as much as possible in orderto put the Indian growth story on track.
Money market was easy and the call rates were soft through outthe month on account of ample cash with the Bank & improvedliquidity condition. Call rates traded at 2.25 -4.30 % at the end ofthe month.
Headline inflation, as measured by the wholesale price index,has fallen sharply to 0.44 percent week to march 7, two decadelow providing room for RBI to cut interest rates. FY 2008-09 sawa massive reversal of fortunes in terms of crude oil prices, withthe commodity hitting its all time-high in July and a four-year lowby mid-December. Inventory pile caused by Lower demand sawcrude oil prices dropped by nearly $100 to $47.25 by the end ofyear from its peak in July 2008.
Last year 10-year G-sec was trading at a yield of 7.94 percent, assentiments were jittery on inflation concerns. The yield on the 10year bond fell by 93 basis points in FY 2008-09, mostly due toaggressive rate cuts by the RBI to boost the economy. Thecentral bank has cut its repo rate by 275 basis points to 5.00percent and banks' cash reserve requirements by 250 basispoints to 5.00 percent over the past one year. Earlier, G-Secyield touched a record low of 4.86 percent, as series of rate cutcoupled MSS buy back by RBI boosted the confidence in G-secMarket. However, the yield on government securities has beenclimbing in the recent past with new benchmark 2019 bondclosing at 7.01 percent at the end of month. This Sluggishnessin G-sec market is largely attributable to the substantial increasein the quantum of government borrowing reflecting the surge infiscal deficit. The central government's borrowing target for thefirst half of FY 2009-10 has been pegged at Rs 2,41,000 crorealmost 80 per cent of its total borrowing in FY 2008-09. On thecorporate bond front, spread between the ten -year corporateand government debt yields was at around 202 basis points and5-year AAA corporate bond and government debt was 171basis points. Rupee closed at 50.71/72 per dollar on 31st March09. Rupee lost nearly 21 percent in 2008-09, biggest fall sincethe balance of payment crisis.
The capital markets seem to be in a consolidation phase. Thenext major response from the Equity markets is expected afterthe results of the forthcoming Election, the policy decisionstaken by the New Government, the economic response to thesepolicy decisions, the GDP Data and the corporate resultsexpected soon. The Indian stock market is expected to be rangebound in near future.
The Debt Markets also have gone through their own turmoil.With inflation moving towards negative territory, RBI may go fora rate cut to stimulate demand and protect the economy fromglobal recession. This may help in softening of yields ongovernment securities & corporate bonds. We expect liquidityto remain soft in the foreseeable future.
CIO’s Desk...
Debt Market
Outlook

15MUTUAL INTERESTMUTUAL INTEREST2
LICMF UNIT LINKED INSURANCE SCHEMEAn Open-ended Insurance linked Tax Saving Scheme
EQUITY PORTFOLIO (as on 31/03/2009)
TOTAL FUND : Rs. 6257.24 Lakh(as on 31/03/2009)
NAV (Rs.) as on 31/03/2009: 7.2488
Last 1 yearLast 3 yearsSince Inception
-24.13%-2.34%10.13%
Benchmark (C BalanceEx) Return (Last 1 year) -22.34%
ANNUALISED RETURNS
(Past Performance may or may not be Sustained in Future)
Holdings Rating Market Value(Rs. in Lakhs)
Equity
TOTAL - EQUITY 2795.46
POWER GRID CORPORATION OF INDIA 409.03
BHARTI TELEVENTURE 375.48
S B I 351.96
N T P C 324.36
INDRAPRASTHA GAS 136.60
BHARAT ELECTRONICS 129.31
L & T 121.08
O N G C 116.96
H D F C BANK 116.14
PUNJAB NATIONAL BANK 98.32
GMR INFRASTRUCTURE 94.90
RELIANCE COMMUNICATION 87.30
G A C L 71.30
DEEPAK FERTILISERS 60.35
B H E L 60.17
RELIANCE POWER LTD 51.25
MERCATOR LINES 49.53
R I L 45.70
JAIPRAKASH ASSOCIATES 25.26
G A I L 24.43
S A I L 24.11
BANK OF BARODA 21.93
DEBT PORTFOLIO (as on 31/03/2009)
Holdings Rating Market Value(Rs. in Lakhs)
Debt
TOTAL - DEBT 3099.78Commercial Paper 0.00TOTAL - Commercial Paper
Cash ‘n’ Call, Current Assets & Receivables 362.00
GSEC 6.05% 02/02/2019 AAA 186.48RURAL ELECTRIFICATION CORPORATION AAA 96.65RELIANCE CAPITAL A1+ 800.00IL&FS INVESTSMART F1(SO) 709.17FIRST LEASING PR1+ 700.00ERA CONSTRUCTION F2+ 507.48BAJAJ HINDUSTAN F1 100.00
Avg. Maturity (in years) : 1.12
Avg. Duration (in years) : 1.00
PORTFOLIO (as on 31/03/2009)
TOTAL FUND : Rs. 122651.80 Lakh(as on 31 )/03/2009
Bonds / Debentures
Commercial Papers
IDFC AAA 5027.50
H D F C AAA 4974.75
I C I C I BANK AAA 3510.00
MAGMA LEASING AA- 7000.00
ARCH PHARMALABS F1 5000.00
TATA REALTY AND INFRASTRUCTURE LTD PR1+(SO) 3000.00
B. SEENAIAH & CO. (PROJECTS) LTD. A1 3000.00
BLUE BIRD (IND) PR1 3000.00
MAGMA LEASING AA 2865.00
BHUSHAN STEEL & STRIPS F1 1200.00
STERLING BIO-TECH PR1 1150.00
TRAPTI TRADING & INVESTMENT A1+ 1000.00
MIDDAY MULTIMEDIA P1 995.00
SHRIRAM TRANSPORT FINANCE AA 800.00
COX AND KINGS PR1 800.00
BAJAJ HINDUSTAN F1 500.00
KOUTONS RETAIL INDIA PR1 476.20
ALOK INDUSTRIES PR1 300.00
REI AGRO PR1 300.00
AMALGMATED BEAN COFEE TRADING CO. L PR1+ 50.00
VIDEOCON INDUSTRIES F1 20.00
SREI INFRASTRUCTURE FINANCE AA 2.82
DLF A1+ 8517.31
SUNDARAM FINANCE A1+ 559.59
INDIABULLS FINANCIAL SERVICES P1+ 286.51
Holdings Rating Market Value(Rs. in Lakhs)
Expense Ratio (as on 31/03/2009) : 0.43%
NAV (Rs.) as on 31 3
Daily Dividend : 10.0000 Weekly Dividend : 10.0026
10.0614 11.7431
/0 /2009
Monthly Dividend : Growth :
LICMF INCOME PLUS FUNDAn Open-ended Debt Scheme
Category Exposure (Rs. Lakh) % Contribution
Equity 2795.46 44.68%
Debt 3099.78 49.54%
Money Mkt. 362.00 5.79%
Total 6257.24 100.00%
DIVIDEND RECORD
Year Rate
1989-90 12.50%
1990-91 13.00%
1991-92 13.50%
1992-94 (18 months) 15.00%
1994-95 7.50%
1996-97 6.00%
1997-98 10.00%
1999-00 10.00%
Year Rate
2001-02 10.00%
2002-03 7.50%
2003-04 17.00%
2004-05 20.00%
2005-06 28.00%
2006-07 44.00%
2007-08 30.00%
2008-09 0.00%
July, 07 0.06660000 0.08314312 0.06570000Aug., 07 0.06640000 0.05480000 0.07180000Sept., 07 0.06460000 0.07320000 0.06490000Oct., 07 0.07380000 0.07020000 0.07410000Nov-07 0.07040000 0.06220000 0.06900000Dec-07 0.07400000 0.06670000 0.07430000Jan-08 0.07500000 0.08500000 0.07530000Feb-08 0.06900000 0.06300000 0.06910000Mar-08 0.08220000 0.09270000 0.08290000Apr-08 0.06720000 0.06200000 0.06750000May-08 0.06860000 0.06340000 0.06870000Jun-08 0.07650000 0.08690000 0.07690000Jul-08 0.07880000 0.08860000 0.07910000Aug-08 0.07820000 0.07560000 0.07870000Sep-08 0.08850000 0.09690000 0.08890000Oct-08 0.09410000 0.08220000 0.09450000Nov-08 0.07390000 0.07850000 0.07510000
Dec-08 0.08630000 0.09820000 0.09370000Jan-09 0.07070000 0.05430000 0.07080000Feb-09 0.05580000 0.05660000 0.05590000Mar-09 0.06120000 0.06460000 0.06140000
Month Daily Weekly Monthly
Certificate of Deposit
Bank Deposits
Cash ‘n’ Call, Current Assests and Receivables 33925.67
VYSYA BANK P1+ 9275.50VIJAYA BANK PR1+ 4916.33UNITED BANK OF INDIA A1+ 4855.43I D B I BANK A1+ 4844.20
BANK OF INDIA 10000.00PUNJAB NATIONAL BANK 500.00
Holdings Rating Market Value(Rs. in Lakhs)
PORTFOLIO (as on 31/03/2009)
Avg. Maturity (in months) : 5.89Avg. Duration (in months) : 5.59
Expense Ratio (as at 31 ) : 2. %/03/2009 50
Last 1 yearSince Inception
9.50%9.14%
Benchmark (C Fund ~ LX) Return - last 1 year 8.80%
ANNUALISED RETURNS
(Past Performance may or may not be Sustained in Future)
DIVIDEND DECLARED
The financial year 2008-09 was a very difficult year not only for the global and Indian economy in general but also
for the India Mutual Fund Industry in particular. Following the bankruptcy of Lehman Brothers in mid September
2008, the global financial markets that were already suffering the consequences of the sub-prime credit and
other financial misadventures, totally seized and the shockwaves hit India and other emerging economies
shattering in its wake the “decoupling” theory which had claimed that emerging markets would be immune to
the financial turmoil faced by the Developed economies for various reasons. The turmoil in the financial and real
economy soon caused a deep crisis of confidence and Mutual funds faced a deluge of redemptions in October
2008. Just as the saying goes “When the going gets tough, the tough get going”, LICMF, which also faced the
crisis, came out much stronger.
On its part, the Government of India, to combat slowdown announced three stimulus packages, of which one
includes the reduction in the key interest rates. This came as a boon to the G-Sec investors with yields falling to
its lowest thereby benefiting the banks with better profits. Inflation figures began to fall though too much of it is
not good for economic growth. While rest of the measures were meant to boost the aggregate economic
demand, their impact is yet to be felt in the coming quarters and it is believed that if the investment and
consumption picks up as expected, the increased fiscal deficit, which is inevitable on account of the conscious
decision to provide the monetary and fiscal stimulus, can be quickly reversed.
After 9% GDP growth for 2007-08, PM's Advisory Council has projected, in January 09, growth of 7.1% for 2008-
09. This has been revised further to 6.5-7% in March 09. However, there are positive notes as well. GDP growth
rate of 7% is expected in 2009-10 and is possible to accomplish for all valid reasons. Oil and Commodities prices,
the key factors to dampen the industry demand, have now declined. Interest rates have calmed down and cost of
borrowing has reduced and may be relaxed further if there is another cut in key interest rates. Liquidity is no
longer a constraint. Sixth Pay Commission when fully implemented is bound to increase the disposable income
of the population. Interest on the investment in country's infrastructure is still strong.
Average AUM of LIC Mutual Fund as on March 31, 2009 stood at Rs.23,092.37 crore. With this we have achieved
a growth of 64.29% in AAUM over last year's AAUM of Rs.14,056.16 crore. The growth in AAUM registered by
LICMF is one the highest in the industry. Of the total assets under management, nearly 87% is contributed by
debt schemes while the rest is made of equity and hybrid schemes. During the year we have launched 11 NFOs,
of which 7 were FMPs and 4 were Interval Funds.
For the period ending December 31, 2008, LICMF Liquid Fund and LICMF Floating Rate Fund received the “Gold
Award” for best performance in the respective category for 3-year period and were rated as 7 Star Funds in the
ICRA Mutual Fund Awards. While LICMF Income Plus received the “Gold Award” for best performance in the
respective category for 1-year period, was also rated as 7 Star Funds. Besides this our schemes got three 5 Star
Fund Awards. Morningstar, leading global investment research based company best known for rating funds and
stocks, awarded LICMF Liquid Fund with the Best Fund in the India Liquid category.
The schemes in debt category have by and large outperformed their respective benchmarks for FY2008-09.
Hybrid and equity schemes performed in line with the market indices. Almost all the schemes performed in the
top-20 performance bracket.
Increased thrust is given to attracting and retaining pool of retail investors across semi urban and rural areas.
Determined efforts have been made to make products available across wide spread locations. Field force has
been increased by manifold and feedback mechanism is in place. LICMF Short Term Plan was relaunched as
LICMF Savings Plus Fund keeping the needs of retail investors in mind.
LICMF thanks all its investors for their continuous trust. We reaffirm our commitment to deliver value to our
customers.
- CEO's Desk
Where we stand…
Whither from here…
FUND PERSPECTIVE

Investment Managers :
LIC Mutual Fund Asset Management Company Ltd.
MUTUALINTEREST
April, 2009FOR PRIVATE CIRCULATION
De
sig
ne
db
y:
Pri
nta
nia
Offse
tP
vt.
Ltd
.
4th Floor, Industrial Assurance Bldg., Opp. Churchgate Station, Mumbai 400 020. Tel. : 22851663 visit us at www.licmutual.com
Statutory DetailsRISK FACTORS
: LIC Mutual Fund has been set up as a Trust sponsored by Life Insurance Corporation of India. LIC Mutual Fund Asset Management Co. Ltd. is the Investment Managerto the Fund. : Mutual Funds and Securities investments are subject to market risks and there is no assurance and no guarantee that the objectives of the Mutual Fund willbe achieved. As with any investment in stocks and shares, the NAV of the units issued under the scheme can go up or down depending on the factors and forces affecting the capitalmarkets. The Sponsor is not responsible for or liable to any loss resulting from the operations of the scheme beyond their initial contribution of Rs. 2 Crore towards the setting up of theMutual Fund. Past performance of the Sponsor/AMC/Mutual Fund does not indicate the future performance of the schemes of the Mutual Fund. The NAV of units of the scheme may beaffected by changes in general level of interest rates. Please read the offer document carefully before investing.
Investment Manager:
AREA OFFICES
Mobile No. Name of Place Mobile No. Name of Place Mobile No.
PLACE ADDRESS LANDLINE MOBILE
AHMEDABAD
BANGALORE
CHENNAI
ERNAKULAM
HYDERABAD
JAIPUR
KANPUR
MUMBAI
NEW DELHI
RAIPUR
RANCHI
Jeevan Sadan, 3rd Floor, LIC Building, Opp. Capital Commercial Center,Ashram Road, AHMEDABAD - 380006.
No.4, Canara Mutual Building (Opp. Cash Pharmacy), 2nd Floor,Residency Road, BANGALORE-560025.
Jeevan Vikas, 16/98, M.G. Road, KANPUR - 208001.
- LIC Mutual Fund, 4th Floor, Industrial Assurance Bldg.,Opp. Churchgate Station, MUMBAI - 400020.
7th Floor, Jeevan Prakash, 25 K.G. Marg, NEW DELHI - 110001.
Narsaria Tower, 2nd Floor, Opp. Lalpur Police Station, Post Lalpur, 0651-2206372
079-26631989 / 65431989 9375090006 / 9924403147
080-22210180 / 22295598 9845172957 / 9972092957 /9986500721
OCHC Building, Ground Floor, 24-Janpath, Unit-3, BHUBANESHWAR-751001. 0674-2390694 9438132162 /9438081037 /9438526420
15, Anna Salai, Next to V.G.P. Bldg., CHENNAI - 600002. 044-28411984 / 28555883 9382315850 / 9382980073 /
9962526278
11th Floor, Jeevan Prakash, M.G. Road, Ernakulam, Kochi - 682011 0484-2367643 9895036554 / 9745612888 /
9446042945
T 9/10, 3rd floor, Alfran Plaza, Opp. Don Bosco High School, M. G. Road, 0832-2420561 9421151400 / 9890711551
Panaji, Goa-403001.
LICMF AMC Ltd., C/o LIC of India, Jeevan Deep Building, Panbazar, Guwahati -782 001 0361 - 2735323 9435040478 / 9707021706
LIC Mutual Fund, House No. 5-9-57, 4th Floor, Jeevan Jyoti Building, 040-23244445 / 23210572 9392471583 / 9000444850 /Basheerbagh, HYDERABAD - 500029. 9000550850
U.V. Business Centre, 1st Floor, Snehil 9/1-A South Tukoganj, INDORE - 452001. 0731-2520262 / 4069162 9753242050 / 9425870126
327 - A, 3rd floor, Ganpati Plaza, M. I. Road, JAIPUR - 1. 0141-5112620 9460873120 / 9829098323 /9929095005
0512-2360240 / 3244949 9415060134 / 9984006600 /
9838038440 / 9918971258
Ground Floor, Hindustan Building Annexe, 4, Chittaranjan Avenue, 033-22129455 / 65290605 9432128113 / 9433098459 /
KOLKATA - 700072. 9339531895 / 9339002574 /9231407611
LICMF AMC LTD., Room No. 102, 1st Fl., S.C.O. 19, Opp. Stock Exchange 0161 - 2405805 / 2405806 9814703558 / 9888320209Feroze Gandhi Market, Ludhiana - 141 001 9872106060
LICMF AMC Ltd., No. 6, Gr. Floor, Popular Building, K S Rao Road, Managalore - 575 001 0824 - 2411482 9845190466 / 9980950466
022-22885971 / 55719750 9324543832 / 9323181203 /9323180802 / 9892550455 /9930957772 / 9870775600
LIC Mutual Fund, 4th Floor, Industrial Assurance Bldg., 022-22851660 9820002994 / 9967655060 /Opp. Churchgate Station, MUMBAI - 400020. 9371617717 / 9920675088
LIC Mutual Fund, Iind Floor, Indian Mutual Bldg., Mount Road, Sadar, Nagpur - 440 001 0712 - 2542497 9422113800
Shop No.2, Ground Floor, Rajvee Enclave, New Pandit Colony, NASHIK - 422002. 0253-2579507 9922996155 / 9823366379
011-23359190/23314396 9818039607 / 9818039603 /9818030124 / 9999828173 /9818191263 / 9811108744
Ground floor, Jeevan Jyothi Bldg. Exhibition Road, PATNA - 800001. 0612-2501157/6452757 9470610695 / 9431023274
SF-22-23, Millennium Plaza, Near Indian Coffee House, 0771-2236780/4051137 9329731077 / 9329100009/G.E. Road, RAIPUR - 492001 C.G. 9329778201
RANCHI -834001. 9470524099 / 9334768543
BHUBANESHWAR
GOA
GUWAHATI
INDORE
KOLKATA
LUDHIANA
MANGALORE
MUMBAI -
NAGPUR
NASHIK
PATNA
I
II
ALWAR : 9950995148AGRA : 9927888854ALAPUZHA : 9447367160AMRITSAR : 9814299747AJMER : 9829077674AMRAVATI : 9923797207ANANTPUR : 9000444852AURANGABAD : 9422728151BERHAMPORE : 9238504924BELGAUM : 9845205168BELLARY : 9980830179BILASPUR : 9301982280BHILAI : 9301701133BHOPAL : 9302441980BHAGALPUR : 9431609765BOKARO : 9955189443CHANDIGARH : 9316065681COIMBATORE : 9282216891DHANBAD : 9835334495DEHRADUN : 9410702598FARIDABAD : 9871814850GORAKHPUR : 9336833448GULBARGA : 9900144196GAYA : 9334118071
GWALIOR : 9406586454HUBLI : 9880058223HAZARIBAG : 9835197681 /
9199107292JABALPUR : 9407606313JAMMU : 9419213201JAMSHEDPUR : 9234620669JODHPUR : 9829947974KANNUR : 9846113249KARIMNAGAR : 9000444853KOTTAYAM : 9349374220KOZHICODE : 9961036375KOTA : 9829905879KOLHAPUR : 9822851948LUCKNOW : 9450661015 /
9453016072MADURAI : 9994509005MALDA : 9836237434 /
9851955023MEERUT : 9319267811MYSORE : 9986117183MUZAFFARPUR : 9431813155
NELLORE : 9000444854PONDICHERRY : 9443337411PANIPAT : 9996006023PUNE : 9325523480RAJKOT : 9898733233SAMBALPUR : 9937040031SALEM : 9944744424SHIMOGA : 9902007686SURAT : 9978862626
9925027406SILIGURI : 9332114747THANE : 9320180806THIRUVANANTHAPURAM : 9388088066THRISSUR : 9388110220TRICHY : 9842524130UDAIPUR : 9784011432VADODARA : 9327494916VARANASI : 9336501004VISHAKHAPATNAM : 9000444851VIJAYWADA : 9000444856
BUSINESS CENTREName of Place
4th Floor, Industrial Assurance Bldg., Opp. Churchgate Station,Mumbai - 400 020. Tel.: 22851663. www.licmutual.com