
Rules-Based and Principles-Based Accounting Standards and Earnings Management

Are International Accounting Standards-based and US GAAP-based
Accounting Amounts Comparable?
Mary E. Barth* Stanford University
Wayne R. Landsman, Mark Lang, and Christopher Williams
University of North Carolina
June 2009 * Corresponding author: Graduate School of Business, Stanford University, 94305-5015, [email protected]. We appreciate funding from the Center for Finance and Accounting Research, Kenan-Flagler Business School and the Center for Global Business and the Economy, Stanford Graduate School of Business. We appreciate comments from Julie Erhardt of the Securities and Exchange Commission, and workshop participants at George Washington University, Oklahoma State University, Shanghai University of Finance and Economics, Singapore Management University, Southern Methodist University, and the 2007 European Accounting Association Congress. We also thank Dan Amiram and Mark Maffett for assistance with data collection.
Are International Accounting Standards-based and US GAAP-based
Accounting Amounts Comparable?
Abstract
We address whether IAS as applied by non-US firms results in accounting amounts that are comparable to those resulting from US GAAP as applied by US firms. We assess comparability using value relevance of equity book value and net income, and the correlation between net incomes. We find US firms applying US GAAP generally have higher value relevance of accounting amounts than non-US firms applying IAS. Value relevance generally became more comparable after non-US firms applied IAS than when they applied non-US domestic standards; we find more consistent evidence for an increase in net income comparability. We also find that value relevance and net income comparability are higher for both IAS adoption and IAS sample years after 2005. Findings indicate that value relevance is more comparable for firms in common law countries; the increase in net income comparability after non-US firms apply IAS holds for both common and code law IAS firms. Our findings suggest that widespread application of IAS by non-US firms has enhanced financial reporting comparability with US firms, but differences remain.
.
2
1. Introduction
The question we address is whether application of International Accounting Standards
(IAS) as applied by non-US firms results in accounting amounts that are comparable to those
resulting from US Generally Accepted Accounting Principles (GAAP) as applied by US firms.
Although there is a growing literature examining whether application of IAS affects quality of
accounting amounts and has economic implications in capital markets, no study directly
examines whether application of IAS by non-US firms results in accounting amounts that are
comparable to those based on application of US GAAP by US firms. We operationalize
comparability by assessing the value relevance of equity book value and net income of firms that
apply IAS and US GAAP, and the correlation between net incomes for the two groups of firms.
Although US firms applying US GAAP generally have higher value relevance of accounting
amounts, several findings support evidence of increased value relevance and net income
comparability after non-US firms adopt IAS and in more recent years.
These findings are potentially relevant to current policy debates relating to possible use
of IAS by US firms.1 Following its 2007 decision to permit non-US firms cross-listing in the US
to file financial statements based on IAS, the US Securities and Exchange Commission (SEC)
presently is considering permitting US firms to file financial statements based on IAS. A major
reason for this is the possibility that accounting amounts based on IAS may be comparable to
those based on US GAAP. Four contributing factors underlying this possibility are the efforts of
the International Accounting Standards Board (IASB) and the Financial Accounting Standards
Board (FASB) to converge accounting standards, the increasing use of IAS throughout the 1 The International Accounting Standards Board (IASB) issues International Financial Reporting Standards (IFRS), which include standards issued not only by the IASB, but also by its predecessor body, the International Accounting Standards Committee, some of which have been amended by the IASB. Because most of our sample period pre-dates the effective dates of standards issued by the IASB, following the convention of Barth, Landsman, and Lang (2008), throughout we refer to IAS rather than IFRS.

3
world, development of international auditing standards, and the increasing coordination of
international securities market regulators. A goal of these efforts is to develop similar
accounting standards and more consistent interpretation, auditing, and enforcement of the
standards. The application of US GAAP or IAS reflects the combined effect of these features of
the financial reporting system. The SEC is ultimately concerned with comparability of financial
statement accounting amounts, not simply comparability of accounting standards. Although our
findings indicate that accounting amounts for US firms applying US GAAP and for non-US
firms applying IAS are not fully comparable, the findings indicate that comparability has
increased following IAS adoption by non-US firms, especially in more recent years.
We use four metrics to assess comparability based on value relevance. The first is based
on the explanatory power of equity book value and net income for share price. The second is
based on the explanatory power of earnings and change in earnings for stock return. The third
and fourth are based on the explanatory power of stock return for net income separately for firms
with positive and negative annual stock return, i.e., good and bad news firms. We assess net
income comparability using the degree to which earnings, deflated by beginning of year price,
for non-US firms correlate with those of matched US firms by regressing earnings for non-US
firms on earnings for US firms.2 We measure correlation using both the magnitude of the
regression coefficient on US earnings and the model explanatory power. Because our value
relevance and correlation metrics reflect the effects of the economic environment that are
unattributable to the financial reporting system, such as the volatility of economic activity and
information environment, we match each non-US firm applying IAS (IAS firms) to a US firm
applying US GAAP that is of similar size and in the same industry as the IAS firm (US firms).
IAS firms are domiciled in 26 countries. 2 Throughout we use the terms “net income” and “earnings” interchangeably.
4
Regarding value relevance, we first assess comparability based on the full sample. We
also assess comparability for IAS adoption and sample years before and after 2005, and based on
the legal origins of the IAS firms’ countries. Our motivation for testing for differences in
comparability using the 2005 partitioning for adoption year is that comparability likely changed
after IAS adoption became mandatory, and 2005 is the year in which IAS adoption became
mandatory in many countries. Similarly, our motivation for testing for differences in
comparability using the 2005 sample year partitioning is that comparability likely changed
following 2005, the year in which substantial changes in IAS became effective as a result of the
IASB’s improvements project. In addition, interpretation, auditing, and enforcement likely
improved after 2005 as regulators and auditors allocated greater resources to, and became more
familiar with, IAS subsequent to mandatory adoption in many countries. Our motivation for
testing for differences in comparability using legal origin based on a code or common law
classification is that application of even a common set of accounting standards may not have
uniform effects on accounting amounts in reporting regimes with different regulatory, litigation,
and auditing environments. Regarding net income comparability, we examine whether it is
higher after non-US firms adopt IAS than when they applied non-US domestic standards, and
whether it is higher after IAS adoption for non-US firms regardless of the legal origin of the
country in which firms are domiciled.
We find that accounting amounts of US firms applying US GAAP generally have higher
value relevance than those of non-US firms applying IAS. However, value relevance generally
became more comparable after non-US firms adopted IAS than when they applied non-US
domestic standards. Findings also indicate that value relevance for the two groups of firms is
more comparable for both IAS adoption and IAS sample years after 2005, which suggests that
5
efforts to converge accounting standards, the increasing use of IAS throughout the world, the
development of international auditing standards, and the increasing coordination of international
securities market regulators have increased comparability of accounting amounts. We also find
that non-US firms have higher net income comparability with US firms when non-US firms
apply IAS than when they applied non-US domestic standards. In addition, for non-US firms
applying IAS, we find net income comparability is higher for both adoption and sample years
after 2005. Tests for differences in comparability based on the legal origins of the non-US firms’
countries indicate that value relevance is more comparable for firms in common law countries.
The tests also indicate that net income comparability is higher for both code and common law
firms when they apply IAS than when they applied non-US domestic standards.
The remainder of the paper is organized as follows. The next section discusses
institutional background and related literature. Sections three and four develop the hypotheses
and explain the research design. Sections five and six describe the sample and data and present
the results. Section seven offers a summary and concluding remarks.
2. Institutional Background and Related Research
2.1 INSTITUTIONAL BACKGROUND
The SEC and the FASB have been working with their international counterparts on a
convergence effort to develop high quality, internationally comparable financial information that
investors find useful for decision making in global capital markets (SEC, 2008; Financial
Accounting Foundation, 2009). The convergence efforts have focused on coordinating standard
setting and reducing differences in accounting standards. To this end, the FASB and IASB are
working to achieve the standard-setting milestones specified in their Memorandum of
Understanding (FASB and IASB, 2008) with a goal of developing a single set of high quality
6
accounting standards. However, comparability of accounting information is a function not only
of accounting standards, but also of interpretation, auditing, and the regulatory and litigation
environment. Recognizing this, the International Auditing and Assurance Standards Board has
been developing International Standards on Auditing to enhance convergence in application of
accounting standards around the world. Similarly, the SEC and the International Organization of
Securities Commissions are working to coordinate oversight and regulation to facilitate
consistent enforcement across countries.
In 2007, the SEC issued a Final Rule (SEC, 2007) permitting non-US firms that apply IAS
as issued by the IASB to file financial statements with the SEC without reconciliation to US
GAAP. The rationale underlying the SEC’s decision is the belief that IAS-based financial
statement information has become sufficiently comparable to US GAAP-based information so as
to render the reconciliation requirement unnecessary. Despite the fact that the SEC permits non-
US firms to file financial statements based on IAS, the SEC currently requires US firms to file
financial statements based on US GAAP. Consistent with the SEC’s stated desire for firms to
use a single set of high quality accounting standards, in November 2008, the SEC issued a
proposed rule, “Roadmap for the Potential Use of Financial Statements Prepared in Accordance
with International Financial Reporting Standards by U.S. Issuers,” that would require US firms
to apply IAS. The roadmap states:
Through this Roadmap, the Commission is seeking to realize the objective of providing investors with financial information from U.S. issuers under a set of high-quality globally accepted accounting standards, which would enable U.S. investors to better compare financial information of U.S. issuers and competing international investment opportunities.
Implicit in the SEC’s decision regarding the application of IAS by US firms is the notion
that financial statement information based on IAS is comparable in quality to that based on US

7
GAAP, and that application of IAS will benefit US firms and investors by increasing
comparability of resulting accounting amounts. If the Roadmap is adopted as proposed, then
larger US firms will be required to apply IAS beginning in 2014 and smaller firms by 2016.3
In its comment letter on the Roadmap, the Financial Accounting Foundation (FAF,
2009), which oversees the FASB, recommends study of the “best path forward for the U.S.
financial reporting system toward the ultimate end goal,” and that the SEC should consider
“other possible approaches [beyond those specifically described in the Roadmap], such as
convergence through continuation of the joint standard-setting efforts of the FASB and the IASB
over a longer period as advocated by some investors and other parties.” The FAF recommends
that the study include:
Steps that can and should be taken through continued international cooperation to more fully realize the potential benefits afforded by adopting a single set of high-quality global accounting standards, given the important effects of other factors that impact the quality and the comparability of reporting outcomes, such as differing incentives, enforcement, and auditing practices, which continue to change over time.
Our goal is to provide input to this debate by providing evidence on the effectiveness of
convergence efforts to date, as well as remaining differences in comparability of accounting
amounts. Although our study cannot address the normative question regarding which approach
is best, because, e.g., we cannot assess the costs and benefits of IAS adoption versus continued
convergence, it provides evidence on the effects of convergence in accounting standards,
auditing, and enforcement.
2.2 RELATED RESEARCH
3 Recent events, including the financial crisis, change in SEC leadership, and perceived political influence on the IASB’s standard-setting process may extend the adoption dates specified in the SEC’s Roadmap. In addition, some commentators express the view that costs of IFRS adoption outweigh perceived benefits, in part because the convergence effort has reduced any gain to IFRS adoption (Bothwell, 2009).

8
Although there is a substantial literature comparing quality of accounting amounts
internationally as well as capital market effects of IAS adoption (see Hail, Leuz, and Wysocki,
2009), there is less evidence on the comparability of accounting amounts resulting from
application of IAS and US GAAP. Studies in the literature can be characterized as relating to
comparisons of accounting amounts resulting from application of IAS and non-US domestic
standards, application of US GAAP and non-US domestic standards, and application of IAS and
US GAAP.
Relating to studies that compare accounting amounts based on, and the economic
implications of, non-US firms applying IAS and domestic standards, Barth, Landsman, and Lang
(2008) finds that accounting quality of firms applying IAS in 21 countries, not including the US,
generally is higher than that of firms applying domestic standards. Studies relating to German
firms include Bartov, Goldberg, and Kim (2005), Van Tendeloo and Vanstraelen (2005), Daske
(2006), and Hung and Subramanyam (2007). With the exception of Bartov, Goldberg, and Kim
(2005), these studies generally fail to find differences in accounting quality or economic
implications, e.g., cost of capital. Daske et al. (2008) analyzes the economic consequence of
mandatory application of IAS in 26 countries and generally finds capital market benefits.
However, the capital market benefits exist in countries with strict enforcement regimes and
institutional environments that provide strong reporting incentives.
Several studies compare accounting amounts based on, and the economic implications of,
US firms applying US GAAP and non-US firms applying domestic standards. Alford, Jones,
Leftwich, and Zmijewski (1993) documents differences in earnings information content and
timeliness for 17 countries. The study finds mixed evidence regarding whether US GAAP
earnings is more informative or more timely than earnings based on non-US domestic standards.
9
Land and Lang (2002) compares earnings-price ratios for firms in six countries and the US, and
finds they converge between an earlier and a later sample period. Using samples of firms from
six countries plus the US and 30 countries plus the US, Ball, Kothari, and Robin (2000) and
Leuz, Nanda, and Wysocki (2003), respectively, provide evidence that observed differences in
the properties of accounting amounts, including quality differences, reflect cross-country
differences in incentives, enforcement, and attestation, in addition to differences in accounting
standards.
Evidence from studies comparing accounting amounts based on, and the economic
implications of, non-US firms applying IAS and US firms applying US GAAP is particularly
relevant to the comparability question raised by the SEC in its Roadmap. Several studies focus
on comparisons using German firms that were permitted to choose to apply either IAS or US
GAAP. Leuz (2003) compares measures of information asymmetry for German firms trading on
Germany’s New Market and finds little evidence of differences in bid/ask spreads and trading
volume for firms that apply US GAAP relative to those that apply IAS. Bartov, Goldberg, and
Kim (2005) documents that earnings response coefficients are highest for those applying US
GAAP, followed by those applying IAS, and followed by those applying German standards.
However, because these studies examine the properties of IAS-based accounting amounts in a
single country with unique institutional features, it is not clear to what extent conclusions from
these studies would be applicable to comparisons between IAS and US firms more generally.
Several studies compare properties of accounting amounts based on IAS with those based
on US GAAP reconciled amounts for firms that cross-listed on US markets. Harris and Muller
(1999) provides evidence that US GAAP-reconciled amounts for 31 firms applying IAS are
value relevant incremental to IAS-based accounting amounts. Gordon et al. (2008) and Hughes
10
and Sander (2008) compare earnings attributes for earnings based on IFRS and based on US
GAAP-reconciled amounts. The studies generally find IAS and US GAAP-reconciled earnings
are comparable, although there is some evidence that US GAAP-reconciled earnings are of
higher quality. Although these studies provide some evidence regarding comparability of
accounting amounts based on US GAAP and IAS, the studies’ findings do not bear directly on
our research question of comparability of US GAAP-based accounting amounts applied by US
firms and IAS-based accounting amounts applied by non-US firms.
There are several reasons why this is true. First, by design, these studies do not include
US firms. However, a primary concern of the SEC is with the comparability of accounting
amounts of IAS firms with those of US firms. Cross-listed firms do not face the same incentives,
auditing, regulation, and litigation environment as faced by US firms (Lang, Raedy, and Wilson,
2006). Second, the properties of accounting amounts resulting from reconciliation of earnings
and equity book value to US GAAP are not the same as those resulting from comprehensive
application of US GAAP (Bradshaw and Miller, 2008). Third, because of the reconciliation
requirement, cross-listed firms likely made US GAAP-consistent choices under IAS to minimize
reconciling items that likely would not be made absent reconciliation requirements (Lang,
Raedy, and Yetman, 2003). Fourth, although within-firm comparisons of US GAAP- and IAS-
based accounting amounts mitigate the need to control for factors other than accounting
standards, the SEC’s concerns about comparability include the effects of all factors that affect
accounting amounts, e.g., managerial incentives, auditing, and regulatory and litigation
environments.
3. Comparability of IAS and US GAAP Accounting Amounts
3.1 FACTORS AFFECTING COMPARABILITY
11
Accounting amounts reflect the interaction of features of the financial reporting system,
which include accounting standards, their interpretation, enforcement, and litigation, all of which
can affect comparability. Relating to standards, the IASB has adopted an approach in developing
standards different from the FASB that could result in lack of comparability of accounting
amounts. In particular, the IASB’s approach relies more on principles, whereas the FASB’s
approach relies more on rules.4 Reliance on principles specifies guidelines, but requires
judgment in application. Reliance on rules specifies more requirements that leave less room for
discretion. Ewert and Wagenhofer (2005) develops a rational expectations model that shows that
accounting standards that limit opportunistic discretion result in accounting earnings that are
more reflective of a firm’s underlying economics. However, although discretion in accounting
can be opportunistic and possibly misleading about the firm’s economic performance, it can be
used to reveal private information about the firm (Watts and Zimmerman, 1986).
Relating to other features of the financial reporting system, Ball (1995, 2006), Lang,
Raedy, and Wilson (2006), Daske et al. (2007), and Bradshaw and Miller (2008) observe that
both accounting standards and the regulatory and litigation environment can affect reported
accounting amounts. For example, Cairns (1999), Ball, Kothari, and Robin (2000), Street and
Gray (2001), and Ball, Robin, and Wu (2003) suggest that lax enforcement can result in limited
compliance with IAS. Thus, because of the inherent flexibility of principles-based standards and
potential weakness in other features of financial reporting systems outside the US, accounting
amounts based on IAS and US GAAP may not be comparable.
3.2 ASSESSING COMPARABILITY
4 The distinction here is more relative than absolute. IAS and US GAAP include both general principles and rules, depending on context (Schipper, 2003). However, the FASB has generally provided more detailed guidance on application of accounting principles than has the IASB.
12
We use two approaches to assess comparability of accounting amounts resulting from
application of IAS and US GAAP. The first is a comparison of the value relevance of
accounting amounts based on earnings and equity book value for IAS firms and matched US
firms. Value relevance is one of several accounting quality measures used in prior research to
assess accounting quality (Lang, Raedy, and Yetman, 2003; Lang, Raedy, and Wilson, 2006;
Barth, Landsman, and Lang, 2008). A benefit of focusing on value relevance measure is that, as
Barth, Landsman, and Lang (2008) notes, value relevance is a summary measure of how well
accounting amounts reflect a firm’s underlying economics, regardless of potential sources of
differences in accounting quality as reflected in other quality metrics. Another benefit of
focusing on value relevance is that the objective of financial reporting as articulated in the
Conceptual Frameworks of the FASB and IASB is to provide information that is useful to
investors and other financial statement users in making their capital allocation decisions. Value
relevance captures the extent to which accounting amounts reflect the effects of equity investors’
investment decisions. Therefore, comparing value relevance for firms that apply IAS and US
GAAP should provide evidence to the SEC as it considers whether the information provided to
investors by non-US firms applying IAS is comparable to the information provided by US firms
applying US GAAP.
Our second approach to assess comparability is to examine the degree to which earnings
for IAS and US firms are correlated. This approach follows De Franco, Kothari, and Verdi
(2008), which measures comparability as the degree to which earnings for two firms in the same
industry covary over time. We build on the insights of De Franco, Kothari, and Verdi (2008) by
measuring comparability in a cross-sectional context. In particular, we measure comparability as
13
the degree to which contemporaneous earnings for non-US firms applying IAS are correlated
with those of matched US firms applying US GAAP.
Relating to value relevance comparability, we begin our assessment by examining the
value relevance metrics described in section 4.2 for the full sample of IAS firms and those of
matched US firms. Although Barth, Landsman, and Lang (2008) finds that accounting quality
improved around IAS adoption, that study’s evidence is based on firms that voluntary adopted
IAS and a sample period that predates recent developments in accounting standards and related
institutions. Our sample comprises firms from a larger number of countries, including those
affected by the wave of mandatory adoptions in 2005, and findings from our more recent period
are likely to be more relevant to the SEC’s Roadmap proposals.
We next examine whether value relevance comparability with US firms differs for IAS
firms that adopted IAS before and after 2005. The purpose of this examination is to determine
whether comparability differs for firms that adopt IAS before and after it was mandatory in most
countries. In 2005, IAS adoption became mandatory in many countries. It is likely that value
relevance comparability with US firms’ accounting amounts is higher in the years after IAS
became mandatory. Although incentives of early adopters of IAS could result in them having
accounting amounts exhibiting more comparable value relevance than accounting amounts of
firms that waited until IAS became mandatory, more uniform application of IAS in the period
after IAS became mandatory should result in more comparability. Similarly, we examine
whether comparability differs for IAS firm-year observations corresponding to sample years
before or after 2005. The purpose of this examination is to determine whether comparability is
higher in later time periods than in earlier time periods because the provisions of IAS allegedly
improved over time.

14
Lastly, we examine whether value relevance comparability differs based on the legal
origins of the IAS firms’ countries based on common and code law classification. As noted in
section 3.1, findings in prior research suggest that application of accounting standards is not
likely to have uniform effects on accounting amounts in reporting regimes with different
regulatory and litigation environments, and that common and code law are key classifications
(Ball, Kothari, and Robin, 2000; Ball, Robin, and Wu, 2003).
Our assessment of comparability based on net income correlation is structured similarly
to that for value relevance. We begin by examining whether net income comparability with US
firms differs before and after IAS firms adopt IAS. We do this by comparing the correlation
between net income of IAS and US firms after the IAS firms applied IAS and the correlation
between net income of IAS firms and US firms when the IAS firms applied non-US domestic
standards. We next examine whether net income comparability with US firms differs for IAS
firms that adopted IAS before and after 2005, and whether comparability differs for IAS firm-
year observations corresponding to sample years before or after 2005. Lastly, we examine
whether net income comparability differs based on the legal origins of the IAS firms’ countries.
Regarding value relevance, we predict value relevance for US firms is higher than that
for IAS firms. Although prior research does not directly address this question, Lang, Raedy and
Yetman (2003) and Leuz, Nanda and Wysocki (2003) suggest that US financial reporting quality
is generally higher than that of other countries, which likely reflects the combined effects of high
quality accounting standards and strong enforcement and auditing. We expect this prediction to
hold regardless of when IAS firms adopted IAS, for all firm-years during which IAS firms apply
IAS, and regardless of the legal origin of IAS firms’ countries. We also predict that value
relevance is more comparable to that of US firms after the IAS firms adopt IAS than when they
15
applied non-US domestic standards. In addition, we predict that the difference in value
relevance is smaller, i.e., value relevance comparability is higher, for IAS firms that adopted IAS
after 2005 than those that adopted earlier, and for observations corresponding to sample years
after 2005. It is difficult to predict differences in comparability for firms from countries with
different legal origins. For example, although IAS may represent more of relative improvement
in accounting standards for firms from code law countries, code law countries likely have weaker
enforcement and auditing, which affects the application of the standards (Ball, Kothari, and
Robin, 2000; Ball, Robin, and Wu, 2003).
Regarding comparability based on net income correlation, we make analogous
predictions to those for value relevance comparability. In particular, we predict comparability is
higher after IAS firms adopt IAS than when they applied non-US domestic standards, regardless
of the legal origin of IAS firms’ countries. We also predict that net income comparability is
higher for IAS firms that adopted IAS after 2005 than those that adopted earlier, and for firm-
year observations corresponding to sample years after 2005. We make no prediction regarding
differences in net income comparability for firms from countries with different legal origins.
4. Research Design
4.1 MATCHING PROCEDURE
To test our predictions, we use a matched sample design. In particular, for each non-US
firm that applies IAS (IAS firm) we select a US firm that applies US GAAP (US firm) in the
same industry as the IAS firm whose size as measured by equity market value is closest to the
IAS firm’s at the end of the year of its adoption of IAS (Barth, Landsman, and Lang, 2008). Our
analyses include all firm-years for which the IAS firm and its matched US firm both have data.
For example, if the IAS firm has data from 1994 through 2000, and its matched US firm has data
16
for 1995 through 2002, then our analysis includes data from 1995 through 2000 for the IAS firm
and its matched US firm. Following prior research, we employ this matching procedure to
mitigate the effects on our inferences of economic differences unattributable to the financial
reporting system.
4.2 VALUE RELEVANCE COMPARABILITY METRICS
We use four measures of value relevance. Our primary measure is based on the
explanatory power of earnings and equity book value for stock price (Lang, Raedy, and Yetman,
2003; Lang, Raedy, and Wilson, 2006; Barth, Landsman, and Lang, 2008). Our second measure
is based on the explanatory power of earnings and change in earnings for stock return. A feature
of the return regression is that it focuses on the timeliness of earnings. Because prior research
suggests that timely loss recognition affects the relation between earnings and return, we use an
additional measure, the explanatory power of stock return for earnings, estimated separately for
firms with positive (negative) stock return, i.e., good (bad) news firms (Basu, 1996; Ball,
Kothari, and Robin, 2000; Lang, Raedy, and Yetman, 2003; Lang, Raedy, and Wilson, 2006;
Barth, Landsman, and Lang, 2008).
To construct each value relevance metric, we use a two-step procedure. In the first step,
we regress each dependent variable, i.e., stock price, stock returns, or earnings, on industry and
country fixed effects. In the second step, we regress the residual from the first-step regression on
the relevant explanatory variables, i.e., earnings and equity book value, earnings and change in
earnings, and stock return, separately for IAS firms and their matched US firms. We employ this
two-step procedure to remove any variation in the dependent variable of interest, e.g., stock
price, that can be explained by the indicator variables. By construction, this procedure attributes
to the indicator variables any joint explanatory power for the dependent variable of the indicator
17
variables and the relevant explanatory variables, e.g., earnings and equity book value. Thus,
each value relevance metric reflects only the explanatory power of the relevant explanatory
variables for the dependent variable.
We estimate the first-step regression using those observations relevant to each value
relevance comparison. For example, when we compare value relevance of IAS and US firms
after the IAS firms adopt IAS, we estimate the first-step regression using the combined sample of
IAS firms and their matched US firms for sample years after the IAS firms adopt IAS. Similarly,
when we compare value relevance of IAS and US firms before the IAS firms adopt IAS, we
estimate the first-step regression using the combined sample of IAS firms and their matched US
firms for sample years before the IAS firms adopt IAS, i.e., when they applied domestic
standards. We estimate separate first-step regressions in this way because the impact on model
explanatory power of the indicator variables is likely to differ for each value relevance
comparison.
Our first value relevance metric, Price, is based on the explanatory power from a
regression of stock price, P, on net income per share, NI, and book value of equity per share,
BVE. In particular, our first value relevance metric is the adjusted R2 from equation (1):
. (1)
P* is the residual from the regression of share weighted P, Ps, from the first-step regression
described above. BVEs and NIs are share weighted BVE, and NI. We share-weight all variables
to enable us to pool observations from different IAS countries that could have differences in
share price arising from differences in typical trading ranges. The share weighting for each IAS
country is the average number of shares outstanding for firms in that country divided by the
average number of shares outstanding for firms in the pooled IAS sample. By convention, we set
18
the share-weight to one for US firms. Following prior research, to ensure accounting
information is in the public domain, P is stock price six months after fiscal year-end (Lang,
Raedy, and Yetman, 2003; Lang, Raedy, and Wilson, 2006; Barth, Landsman, and Lang, 2008).
NI is net income before extraordinary items. i and t refer to firm and year.
Our second value relevance metric, Return, is based on the adjusted R2 from a regression
of annual stock return, RETURN, on net income and change in earnings, deflated by beginning of
year price, NI/P and ΔNI/P. In particular, our second value relevance metric is the adjusted R2
from equation (2):
(2)
RETURN* is the residual from the regression of RETURN from the first-step regression.5 We
measure RETURN as the cumulative percentage change in stock price beginning nine months
before fiscal year end and ending three months after fiscal year end, adjusted for dividends and
stock splits. We permit the coefficients on NI/P and ΔNI/P to differ for loss firms (Hayn, 1995)
using the indicator variable LOSS, which equals one if NI/P is negative and zero otherwise.
Our third and fourth value relevance metrics, Good News and Bad News, are based on
the adjusted R2s from regressions of net income deflated by beginning of year price on annual
stock return. We estimate the earnings-returns relation separately for positive and negative
return subsamples. Because we partition firms based on the sign of the return, we estimate two
“reverse” regressions with earnings as the dependent variable, where one is for good news firms
and the other is for bad news firms (Ball, Kothari, and Robin, 2000).
(3)
5 There is no need to share weight the variables in equation (2) because each is deflated by price per share.
19
Analogously to equations (1) and (2), is the residual from the first-step regression of
NI/P on the indicator variables.
We test for differences in each metric using an empirical distribution of the differences
using a boot-strapping procedure. Specifically, for each test, we first randomly select, with
replacement, firm observations that we assign as either an IAS or a US firm.6 We then calculate
the difference in the metric that is the subject of the particular test for the two randomly assigned
types of firms. We obtain the empirical distribution of this difference by repeating this
procedure 1,000 times. We deem a difference as being significant if our observed sample
difference exceeds 950 of the differences calculated based on the boot-strapping procedure. An
advantage of this approach for testing significance of the differences is that it requires no
assumptions about the distribution of each metric.
We estimate equations (1) through (3) using five groupings of the sample firm-years.
First, we use all firm-year observations after the IAS firms adopt IAS. Second, we use all firm-
year observations before the IAS firms adopt IAS, i.e., when they applied non-US domestic
standards. Estimation using this second grouping permits us to examine whether value relevance
comparability increased after IAS firms adopt IAS. Third, we partition firm-year observations
after IAS firms adopt IAS into two groups based on whether the IAS firm adopted IAS before or
after 2005. The purpose of estimating the value relevance regressions using this grouping is to
determine whether findings differ for firms that adopt IAS before and after it was mandatory in
most countries. Fourth, we partition firm-year observations after IAS firms adopt IAS into two
groups corresponding to sample years before or after 2005. The purpose of estimating
6 Inferences are unchanged if we sample with replacement.

20
regressions using this grouping is to determine whether findings differ between earlier versus
later time periods because the provisions of IAS changed over time.
Fifth, we partition observations after IAS firms adopt IAS into two groups based on
firms’ countries legal origins, common law and code law. We do this because, as explained in
section 3, findings in prior research suggest that application of accounting standards is not likely
to have uniform effects on accounting amounts in reporting regimes with different regulatory and
litigation environments (Ball, Kothari, and Robin, 2000; Ball, Robin, and Wu, 2003). La Porta et
al. (1998) and subsequent studies indicate that legal origin differences affect institutional features
of financial markets, including the financial reporting environment. Key legal origin groups
identified in prior research are common law and code law. The common law legal origin group
in our sample includes Australia, Canada, Hong Kong, Ireland, Singapore, South Africa, and the
UK; the code law legal origin group includes Austria, Belgium, Denmark, Finland, France,
Germany, Greece, Italy, Netherlands, Norway, Portugal, Spain, Sweden, and Switzerland.
4.3 NET INCOME COMPARABILITY METRICS
We measure net income comparability as the degree to which earnings, deflated by price,
for non-US firms applying IAS are correlated with those of matched US firms applying US
GAAP. In particular, we estimate the following regression:7
, (4)
where and are NI/P* for the IAS firm and its matched US firm. As
with equations (1) through (3), we use the NI/P* rather than NI/P to mitigate the effects of
7 De Franco, Kothari, and Verdi (2008) estimates net income correlations deflating net income by average total assets. We deflate by beginning-of-year stock price instead of average total assets because asset measurement and recognition rules differ among IAS, non-US domestic standards, and US GAAP, and thus deflating by total assets could affect inferences regarding net income correlation. In addition, we use price as the deflator in equation (3). Therefore, deflating by price in equation (4) enhances the internal consistency of the metrics.

21
country and industry differences on comparisons of correlations.8 We operationalize correlation
as the R2 from equation (4) and the magnitude of the US earnings-price coefficient, .
We estimate equation (4) using several groupings of the sample firm-years to test for
differences in net income comparability. For each test of differences we compare and R2
from equation (4) obtained using the two groups of firm-year observations that are relevant to the
difference test. First, to examine whether net income comparability changed after IAS firms
adopt IAS, we first estimate equation (4) using all firm-year observations after the IAS firms
adopt IAS, i.e., with as the dependent variable, and using all firm-year observations
when they applied non-US domestic standards, i.e., with as the dependent
variable. is the residual from the first-step regression of net income to price
for IAS firms when they applied domestic accounting standards. Second, to determine whether
net income comparability changed after IAS firms adopt IAS for firms in countries with different
legal origins, we repeat these same two estimations but using subsamples of observations that
correspond to IAS firms from countries with common and code law legal origins. We also test
for differences in changes in net income comparability across firms from common and code law
countries. Third, we test for differences in net income comparability based on whether IAS
firms adopted IAS before or after 2005 by estimating equation (4) using IAS firm-year
observations corresponding to the two groups. Fourth, we test for differences in net income
comparability based on sample firm years before or after 2005 by estimating equation (4) using
IAS firm-year observations corresponding to sample years before or after 2005.
8 As with the value relevance comparability tests, we estimate the first-step regression using those observations relevant to each second step analysis.
22
As with the value relevance metrics, we test for differences based on the empirical
distribution of the difference between the R2 from the two estimations of equation (4) that are
relevant to the particular test. To test for differences in , we estimate a version of equation (4)
in which we pool observations from the two estimations relevant to the particular test, and
include an indicator variable to distinguish one group of observations from the other, and a
variable that interacts the indicator variable and .
5. Data and Sample
We obtain our sample of IAS firms from Worldscope, which identifies the set of
accounting standards a firm uses to prepare its financial statements and its industry. The two
Worldscope standards categories that we code as IAS based on the Worldscope Accounting
Standards Applied data field are “international standards” and “IASC” or “IFRS.”9 There are
two sources of potential error in classifying a firm as applying IAS. The first is that firms do not
always indicate clearly the accounting standards that they apply in their financial statements.
The second is that Daske et al. (2007) reports that the Worldscope data field contains
classification errors. If a substantial portion of firms we classify as IAS firms is affected by
these sources of classification error and if IAS-based accounting amounts are more comparable
to US GAAP-based accounting amounts than are accounting amounts based on other standards,
it is likely that our tests are biased against our finding that IAS- and US GAAP-based accounting
amounts are comparable.10 We limit IAS firms to those that do not cross-list in the US to
eliminate effects on the IAS accounting amounts associated with the reconciliation requirement
(Harris and Muller, 1999; Lang, Raedy, and Wilson, 2006).
9 Worldscope category 23 was “IASC” prior to 2004 and “IFRS” in 2005 and 2006. 10 Limiting our comparisons to IAS firms classified by Worldscope as applying IASC or IFRS results in inferences similar to those we obtain from our tabulated findings.

23
We gather data for IAS firms from DataStream and data for US firms from Compustat
and CRSP. We winsorize at the 5% level all variables used to construct our metrics to mitigate
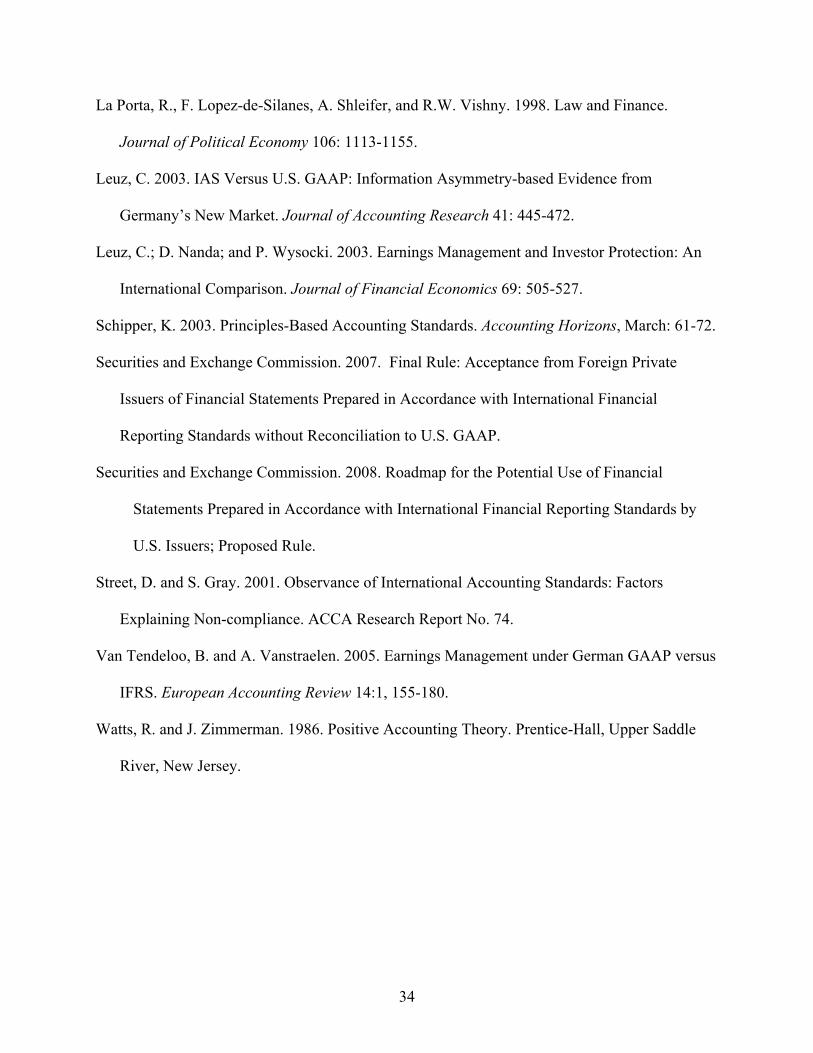
the effects of outliers on our inferences. The resulting sample of IAS firms comprises 15,458
firm year observations for 3,055 firms that adopted IAS between 1995 and 2006. Of the 15,458
firm years, 4,526 are post-IAS adoption observations, and 10,932 are pre-adoption observations.
Table 1, panel A, provides a breakdown of sample firms by country. Sample firms are
from 26 countries, with the greatest proportion from the United Kingdom, Australia, France, and
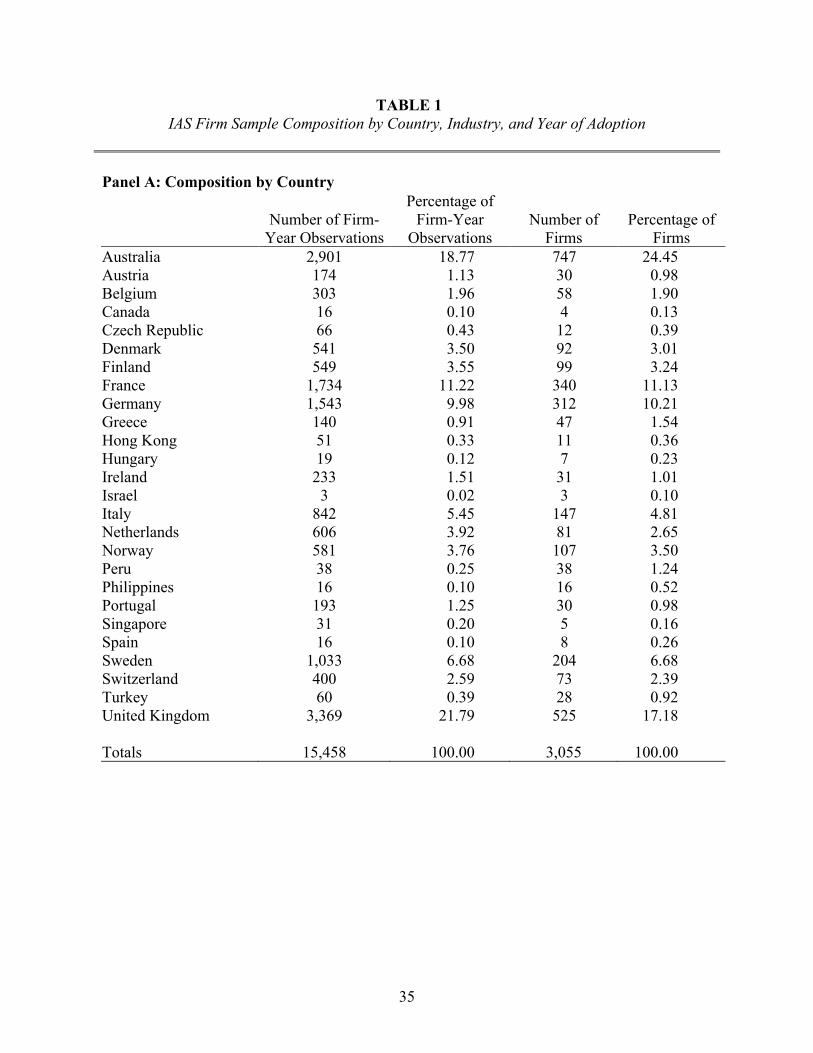
Germany. Panel B of table 1 provides an industry breakdown. Sample firms are from many
industries, with the greatest proportion from manufacturing, services, finance, insurance and real
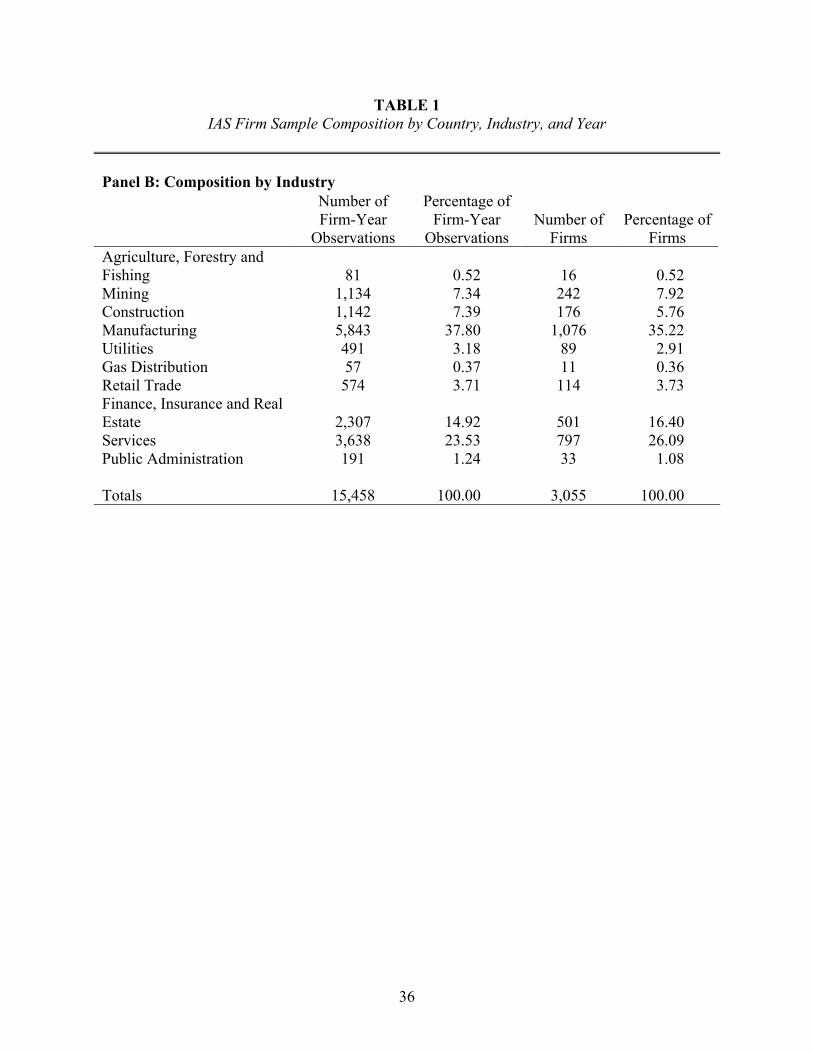
estate, and construction. Panel C of table 1 provides a breakdown by IAS adoption year. The
number of firms adopting IAS each year rises until 1999, then remains relatively constant
through 2003, and jumps substantially in 2005 when IAS became mandatory for firms in many
countries.
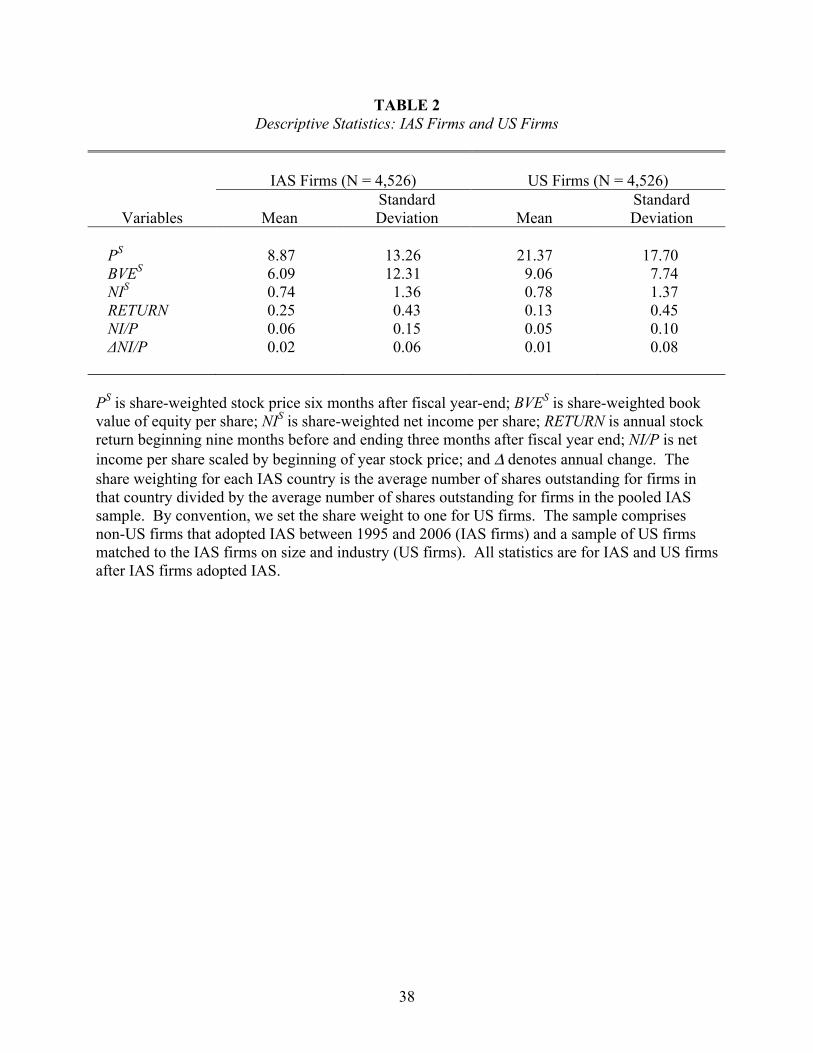
Table 2 reports descriptive statistics for IAS and US firms based on data for IAS firms
and their matched US firms after the IAS firms adopted IAS. Although we do not conduct
significance tests for differences in means between IAS and US firms, table 2 suggests that
despite our share-weighting procedure, mean differences likely exist for P* and BVE*. Because
it is likely that these mean differences in the tabulated variables are at least in part attributable to
country and industry differences, as described in section 4, we include country and industry fixed
effects when constructing our metrics.
6. Results
6.1 VALUE RELEVANCE
Application of IAS and non-US Domestic Standards
24
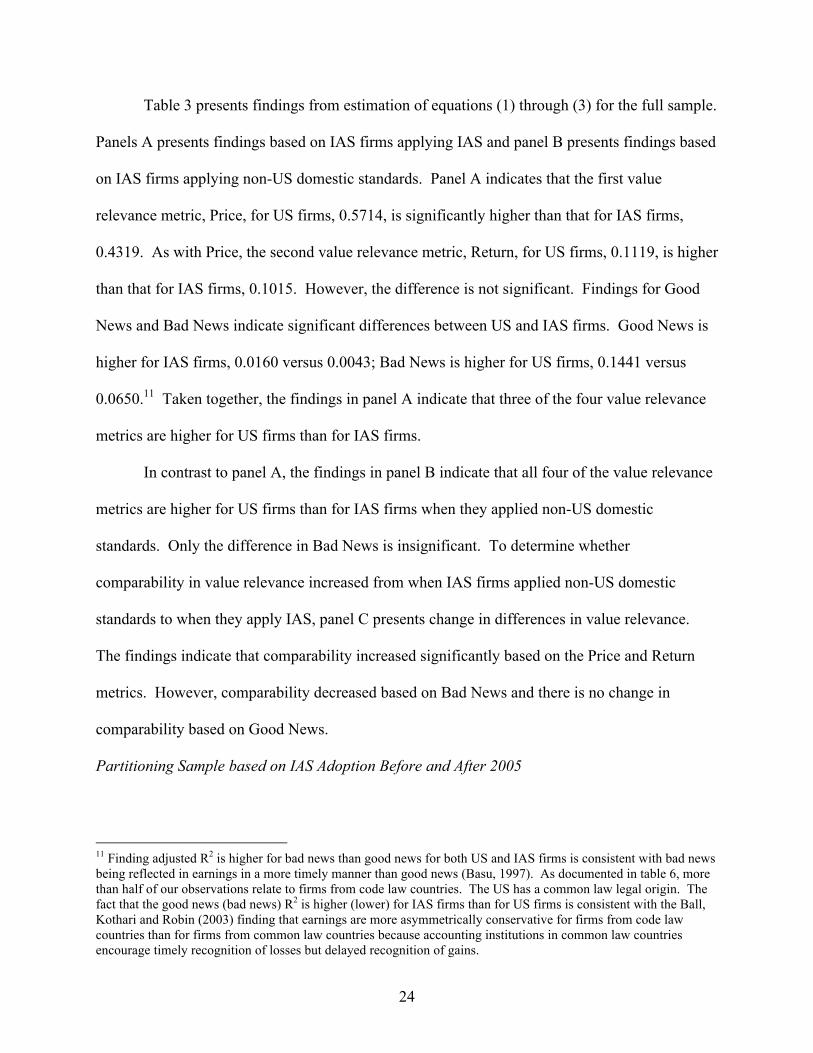
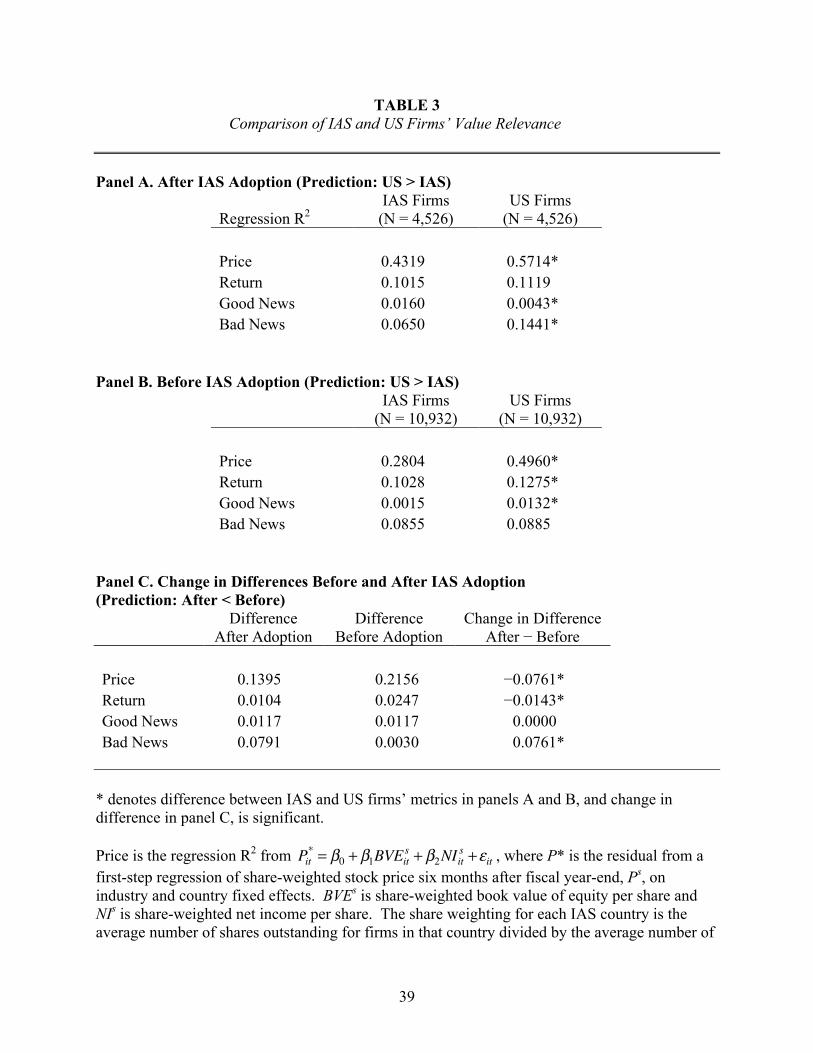
Table 3 presents findings from estimation of equations (1) through (3) for the full sample.
Panels A presents findings based on IAS firms applying IAS and panel B presents findings based
on IAS firms applying non-US domestic standards. Panel A indicates that the first value
relevance metric, Price, for US firms, 0.5714, is significantly higher than that for IAS firms,
0.4319. As with Price, the second value relevance metric, Return, for US firms, 0.1119, is higher
than that for IAS firms, 0.1015. However, the difference is not significant. Findings for Good
News and Bad News indicate significant differences between US and IAS firms. Good News is
higher for IAS firms, 0.0160 versus 0.0043; Bad News is higher for US firms, 0.1441 versus
0.0650.11 Taken together, the findings in panel A indicate that three of the four value relevance
metrics are higher for US firms than for IAS firms.
In contrast to panel A, the findings in panel B indicate that all four of the value relevance
metrics are higher for US firms than for IAS firms when they applied non-US domestic
standards. Only the difference in Bad News is insignificant. To determine whether
comparability in value relevance increased from when IAS firms applied non-US domestic
standards to when they apply IAS, panel C presents change in differences in value relevance.
The findings indicate that comparability increased significantly based on the Price and Return
metrics. However, comparability decreased based on Bad News and there is no change in
comparability based on Good News.
Partitioning Sample based on IAS Adoption Before and After 2005
11 Finding adjusted R2 is higher for bad news than good news for both US and IAS firms is consistent with bad news being reflected in earnings in a more timely manner than good news (Basu, 1997). As documented in table 6, more than half of our observations relate to firms from code law countries. The US has a common law legal origin. The fact that the good news (bad news) R2 is higher (lower) for IAS firms than for US firms is consistent with the Ball, Kothari and Robin (2003) finding that earnings are more asymmetrically conservative for firms from code law countries than for firms from common law countries because accounting institutions in common law countries encourage timely recognition of losses but delayed recognition of gains.
25
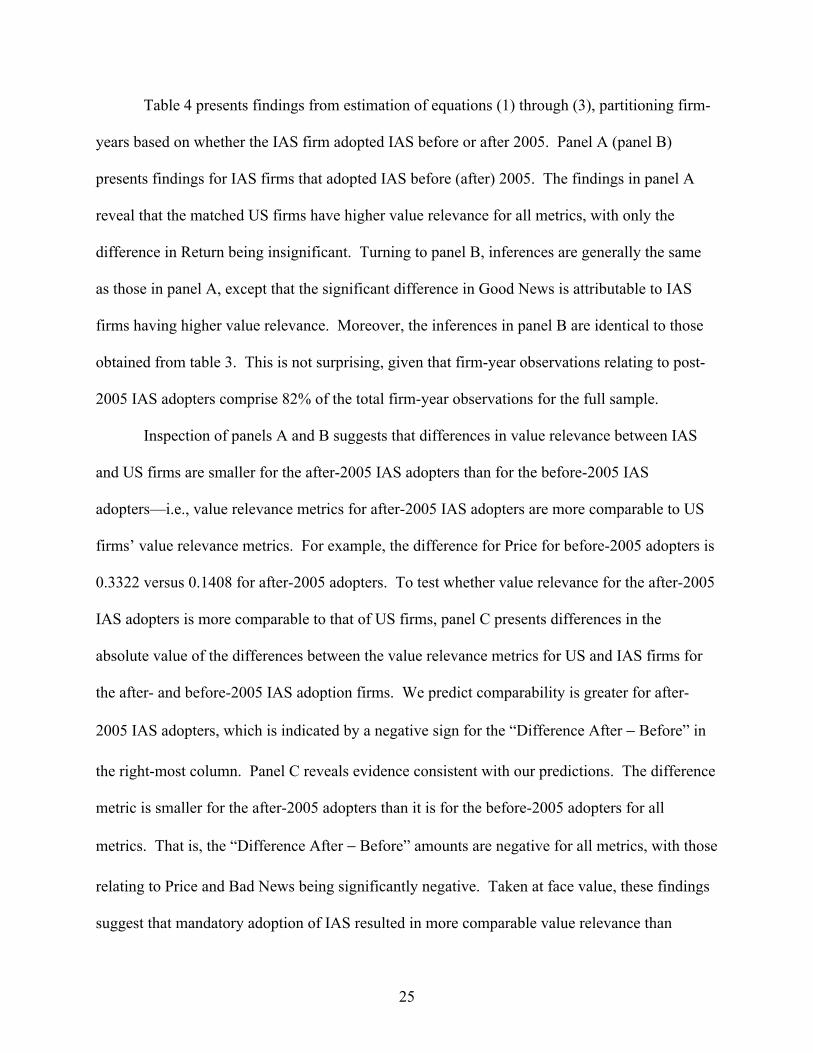
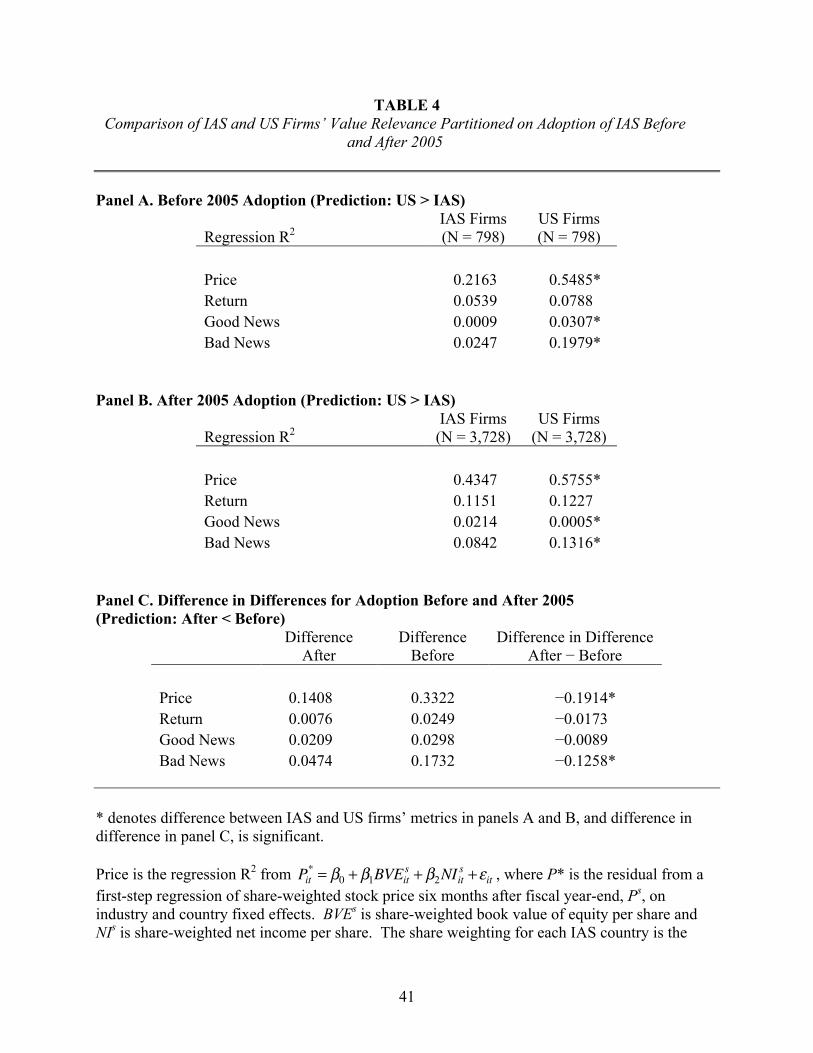
Table 4 presents findings from estimation of equations (1) through (3), partitioning firm-
years based on whether the IAS firm adopted IAS before or after 2005. Panel A (panel B)
presents findings for IAS firms that adopted IAS before (after) 2005. The findings in panel A
reveal that the matched US firms have higher value relevance for all metrics, with only the
difference in Return being insignificant. Turning to panel B, inferences are generally the same
as those in panel A, except that the significant difference in Good News is attributable to IAS
firms having higher value relevance. Moreover, the inferences in panel B are identical to those
obtained from table 3. This is not surprising, given that firm-year observations relating to post-
2005 IAS adopters comprise 82% of the total firm-year observations for the full sample.
Inspection of panels A and B suggests that differences in value relevance between IAS
and US firms are smaller for the after-2005 IAS adopters than for the before-2005 IAS
adopters—i.e., value relevance metrics for after-2005 IAS adopters are more comparable to US
firms’ value relevance metrics. For example, the difference for Price for before-2005 adopters is
0.3322 versus 0.1408 for after-2005 adopters. To test whether value relevance for the after-2005
IAS adopters is more comparable to that of US firms, panel C presents differences in the
absolute value of the differences between the value relevance metrics for US and IAS firms for
the after- and before-2005 IAS adoption firms. We predict comparability is greater for after-
2005 IAS adopters, which is indicated by a negative sign for the “Difference After − Before” in
the right-most column. Panel C reveals evidence consistent with our predictions. The difference
metric is smaller for the after-2005 adopters than it is for the before-2005 adopters for all
metrics. That is, the “Difference After − Before” amounts are negative for all metrics, with those
relating to Price and Bad News being significantly negative. Taken at face value, these findings
suggest that mandatory adoption of IAS resulted in more comparable value relevance than
26
voluntary adoption. However, it is possible that this result could be attributable to a temporal
effect rather than the effect of mandatory adoption.
Partitioning Sample based on Sample year Before and After 2005
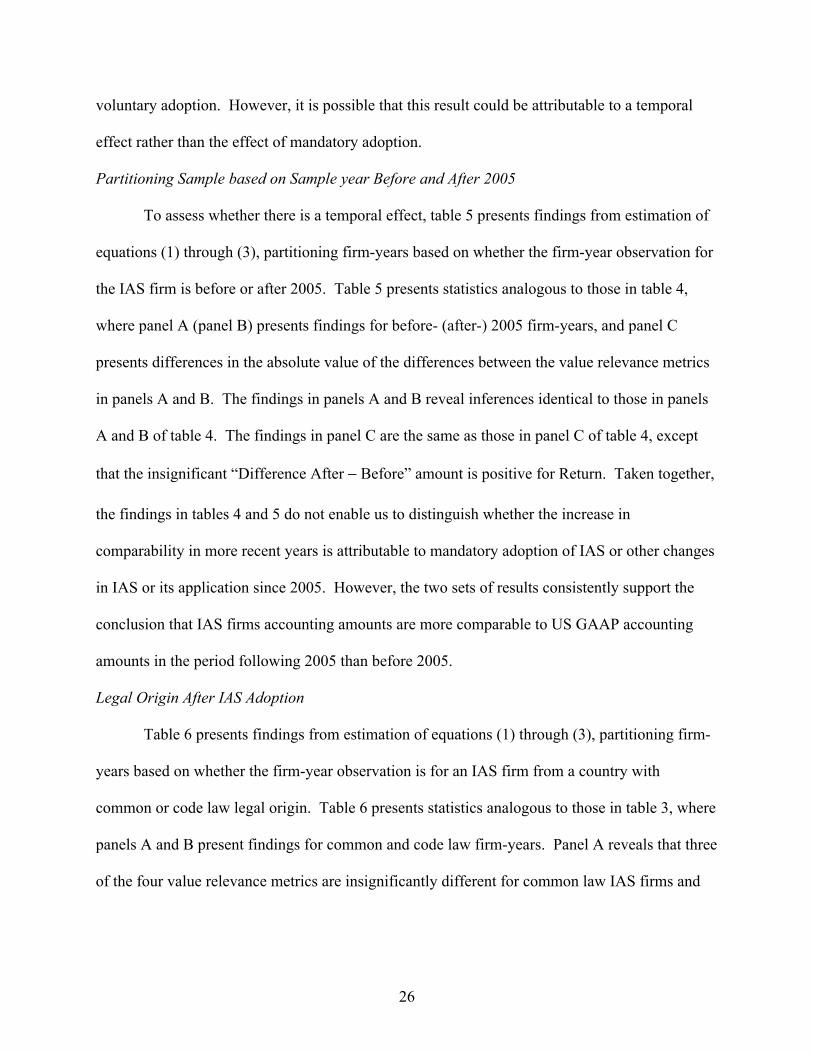
To assess whether there is a temporal effect, table 5 presents findings from estimation of
equations (1) through (3), partitioning firm-years based on whether the firm-year observation for
the IAS firm is before or after 2005. Table 5 presents statistics analogous to those in table 4,
where panel A (panel B) presents findings for before- (after-) 2005 firm-years, and panel C
presents differences in the absolute value of the differences between the value relevance metrics
in panels A and B. The findings in panels A and B reveal inferences identical to those in panels
A and B of table 4. The findings in panel C are the same as those in panel C of table 4, except
that the insignificant “Difference After − Before” amount is positive for Return. Taken together,
the findings in tables 4 and 5 do not enable us to distinguish whether the increase in
comparability in more recent years is attributable to mandatory adoption of IAS or other changes
in IAS or its application since 2005. However, the two sets of results consistently support the
conclusion that IAS firms accounting amounts are more comparable to US GAAP accounting
amounts in the period following 2005 than before 2005.
Legal Origin After IAS Adoption
Table 6 presents findings from estimation of equations (1) through (3), partitioning firm-
years based on whether the firm-year observation is for an IAS firm from a country with
common or code law legal origin. Table 6 presents statistics analogous to those in table 3, where
panels A and B present findings for common and code law firm-years. Panel A reveals that three
of the four value relevance metrics are insignificantly different for common law IAS firms and
27
US firms. The only significant difference is for Bad News, where the metrics are 0.1058 and
0.1867 for IAS firms and matched US firms.
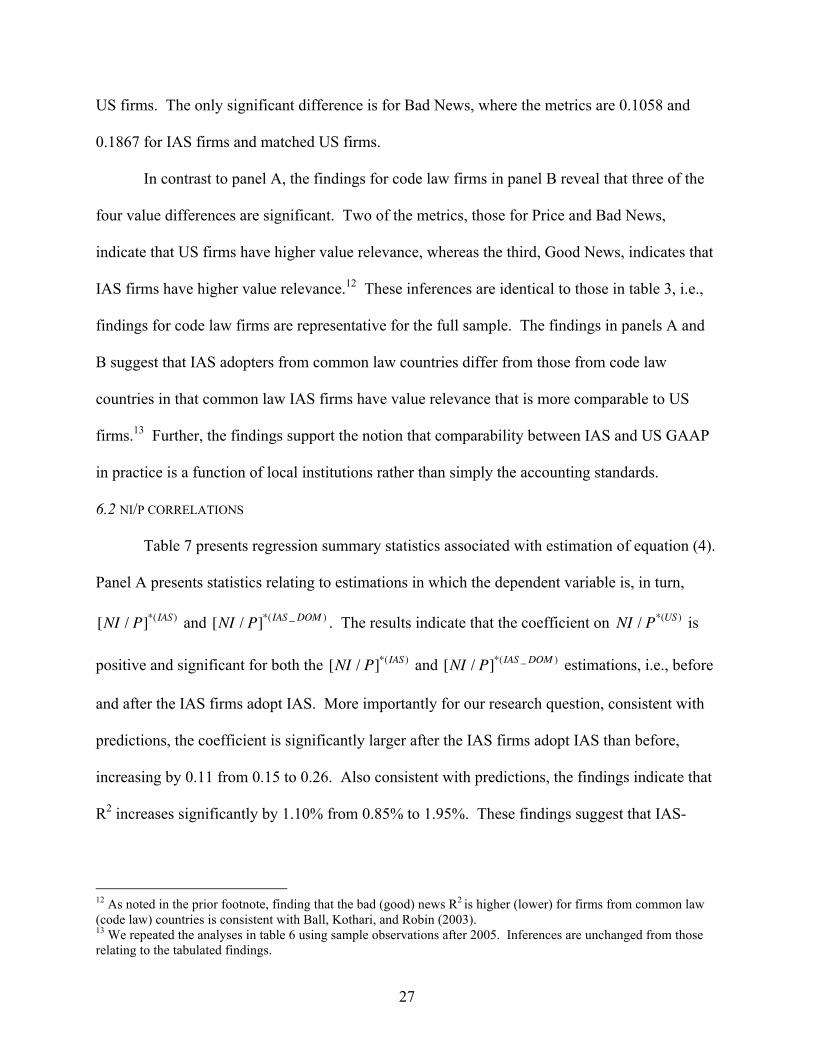
In contrast to panel A, the findings for code law firms in panel B reveal that three of the
four value differences are significant. Two of the metrics, those for Price and Bad News,
indicate that US firms have higher value relevance, whereas the third, Good News, indicates that
IAS firms have higher value relevance.12 These inferences are identical to those in table 3, i.e.,
findings for code law firms are representative for the full sample. The findings in panels A and
B suggest that IAS adopters from common law countries differ from those from code law
countries in that common law IAS firms have value relevance that is more comparable to US
firms.13 Further, the findings support the notion that comparability between IAS and US GAAP
in practice is a function of local institutions rather than simply the accounting standards.
6.2 NI/P CORRELATIONS
Table 7 presents regression summary statistics associated with estimation of equation (4).
Panel A presents statistics relating to estimations in which the dependent variable is, in turn,
and . The results indicate that the coefficient on is
positive and significant for both the and estimations, i.e., before
and after the IAS firms adopt IAS. More importantly for our research question, consistent with
predictions, the coefficient is significantly larger after the IAS firms adopt IAS than before,
increasing by 0.11 from 0.15 to 0.26. Also consistent with predictions, the findings indicate that
R2 increases significantly by 1.10% from 0.85% to 1.95%. These findings suggest that IAS-
12 As noted in the prior footnote, finding that the bad (good) news R2 is higher (lower) for firms from common law (code law) countries is consistent with Ball, Kothari, and Robin (2003). 13 We repeated the analyses in table 6 using sample observations after 2005. Inferences are unchanged from those relating to the tabulated findings.
28
based net income is more comparable to US GAAP-based net income than is net income based
on non-US domestic standards.
Panel B presents analogous statistics relating to estimating equation (4) using subsamples
of firms based on common and code law legal origin. The findings indicate that inferences
relating to both subsamples are identical to those based on the full sample. The
coefficient increases significantly from the period before IAS adoption to after for common and
code law firms. The respective increases are 0.05 and 0.12. The analogous increases in R2 are
0.73% and 1.35%, each of which is significant.
In addition, untabulated findings also indicate that increases in both the
coefficient and R2 from when they applied non-US domestic standards to when they apply IAS
are significantly higher for firms from code law countries. These findings suggest that the effect
of IAS on comparability with US GAAP is more pronounced for firms from code law countries
than common law countries, which is consistent with the notion that IAS are more similar to
common law standards and, therefore, have more of an effect on firms from code law countries.
Panel C presents statistics relating to subsample estimations of equation (4) in which the
dependent variable is . The first pair (second pair) of columns presents findings
from partitionings of firm-years based on whether the IAS firm adopted IAS before or after 2005
(whether the firm-year observation for the IAS firm is before or after 2005). The findings from
both subsample analyses are similar. In particular, although the coefficient is
significantly positive for all four estimations, it does not change significantly for firms that
adopted IAS after 2005 and for firm-year observations after 2005. In contrast, the respective R2s
for firms that adopted IAS after 2005 and for firm-year observations after 2005 increase from
1.15 to 2.20 and from 1.11 to 2.30. Taken together, the findings in panel C indicate that there is

29
an increase in comparability in more recent years and for firms adopting IAS when it largely
became mandatory. However, as with the value relevance findings, the net income
comparability findings do not permit us to determine whether the increase in comparability in
more recent years is attributable to mandatory adoption of IAS or to other changes in IAS or its
application since 2005.
7. Summary and Concluding Remarks
The question we address is the extent to which IAS as applied by non-US firms results in
accounting amounts that are comparable to those resulting from US GAAP as applied by US
firms. We assess comparability using value relevance of equity book value and net income, and
the correlation between net incomes for the two groups of firms.
We find US firms applying US GAAP generally have higher value relevance of
accounting amounts. This finding suggests that despite recent trends towards convergence of
accounting standards, interpretation, auditing, and enforcement, financial reporting is not fully
comparable. Relative to when non-US firms applied domestic standards, value relevance is more
comparable based on price and return metrics but is less comparable based on the bad news
metric after they applied IAS. In addition, we find non-US firms have higher net income
comparability with US firms when non-US firms apply IAS than when they applied non-US
domestic standards. Collectively, these findings suggest that widespread application of IAS by
non-US firms is associated with financial reporting that is more comparable with US firms than
is application of non-US domestic standards. We also find value relevance and net income
comparability are higher for both IAS adoption and IAS sample years after 2005. The findings
suggest that the combination of mandatory adoption of IAS, greater convergence IAS and US
30
GAAP, and global improvements in consistency in auditing and enforcement enhanced
comparability.
Tests for differences in comparability based on the legal origins of the non-US firms’
countries indicate that value relevance is more comparable for firms in common law countries.
The tests also indicate that net income comparability is higher for both code and common law
firms when they apply IAS than when they applied non-US domestic standards. However, the
greater increase in comparability for code law firms suggests that IAS represents more of an
improvement in accounting standards for firms from code law countries than common law
countries, which is consistent with the notion that IAS are less similar to accounting standards as
traditionally applied in code law countries.
Taken together, our study’s findings suggest that widespread application of IAS by non-
US firms has enhanced financial reporting comparability with US firms, but that differences
remain.
31
REFERENCES
Alford, A., J. Jones, R. Leftwich, and M. Zmijewski, 1993. The Relative Information Content of
Accounting Disclosures in Different Countries. Journal of Accounting Research 31
(Supplement): 183-223.
Ball, R. 1995. Making Accounting More International: Why, How, and How Far Will It Go?
Journal of Applied Corporate Finance 8: 19-29.
Ball, R. 2006. International Financial Reporting Standards (IFRS): Pros and Cons for Investors.
Accounting Business Research International Accounting Policy Forum: 5-27.
Ball, R.; S.P. Kothari; and A. Robin. 2000. The Effect of International Institutional Factors on
Properties of Accounting Earnings.” Journal of Accounting and Economics 29: 1-51.
Ball, R.; A. Robin, and J.S. Wu. 2003. Incentives versus Standards: Properties of Accounting
Income in Four East Asian Countries.” Journal of Accounting and Economics 36: 235-270.
Barth, M.E., W.R. Landsman, and M. Lang. 2008. International Accounting Standards and
Accounting Quality. Journal of Accounting Research 46, 467-498.
Bartov, E., S. Goldberg, and M. Kim. 2005. Comparative Value Relevance among German, U.S.
and International Accounting Standards: A German Stock Market Perspective. Journal of
Accounting, Auditing and Finance 20: 95-119.
Basu, S., 1997, The Conservatism Principle and the Asymmetric Timeliness of Earnings, Journal
of Accounting and Economics 24, 3-37.
Bothwell, J.L. 2009. Adopting International Financial Reporting Standards for Use in the United
States: An Economic and Public Policy Perspective. FASB. Working paper
Bradshaw, M.T., and G.S. Miller. 2008. Will Harmonizing Accounting Standards Really
Harmonize Accounting? Evidence from Non-U.S. Firms Adopting US GAAP. Journal of
32
Accounting, Auditing and Finance 23: 233-263.
Cairns, D. 1999. Degrees of compliance. Accountancy International (September): 68-69.
Daske, H. 2006. Economic Benefits of Adopting IFRS or US-GAAP – Have the Expected Costs
of Equity Capital really decreased? Journal of Business, Finance, and Accounting 33: 329-
373.
Daske, H., L. Hail, C. Leuz, and R. Verdi. 2007. Adopting a Label: Heterogeneity in the
Economic Consequences of IFRS Adoptions. Working paper, Wharton School.
Daske, H., L. Hail, C. Leuz, and R. Verdi. 2008. Mandatory IFRS Reporting Around the World:
Early Evidence on the Economic Consequences. Journal of Accounting Research 46, 1085-
1142.
De Franco, G., S.P. Kothari, R.S. Verdi. 2008. The Value of Earnings Comparability. Working
paper, MIT Sloan School of Management.
Ewert, R., and A. Wagenhofer. 2005. Economic Effects of Tightening Accounting Standards to
Restrict Earnings Management. The Accounting Review 80: 1101-1124.
Financial Accounting Foundation. 2009. Comment letter on the SEC Roadmap, March 11.
Financial Accounting Standards Board and International Accounting Standards Board. 2008.
Completing the February 2006 Memorandum of Understanding: A Progress Report and
Timetable for Completion. Norwalk, CT. and London, UK, September.
Gordon, E.A., B.N. Jorgensen, and C.L. Linthicum. 2008. Could IFRS Replace US GAAP? A
Comparison of Earnings Attributes and Informativeness in the US Market. Working paper.
Hail, L., C. Leuz, and P. Wysocki. 2009. Global Accounting Convergence and the Potential
Adoption of IFRS by the United States: An Analysis of Economic and Policy Factors.
Working Paper, University of Pennsylvania.

33
Hayn, C. 1995. The Information Content of Losses. Journal of Accounting and Economics 20:
125-153.
Harris, M., and K. Muller. 1999. The Market Valuation of IAS versus US GAAP Accounting
Measures Using Form 20-F Reconciliations. Journal of Accounting and Economics 26: 285-
312.
Hughes, S.B., and J.F. Sander. 2008. The Implications of IFRS Adoption: The Extent of
Convergence and Consistency between IFRS and US GAAP Net Income. Working paper.
Hung, M. and K.R. Subramanyam. 2007. Financial Statement Effects of Adopting International
Accounting Standards: The Case of Germany. Review of Accounting Studies 12: 623-657.
International Accounting Standards Board. 2003a. Improvements to International Accounting
Standards. IASB, London.
International Accounting Standards Board. 2003b. IAS 32 Financial Instruments: Disclosure and
Presentation. IASB, London.
International Accounting Standards Board. 2003c. IAS 39 Financial Instruments: Recognition
and Measurement. IASB, London.
Land, J., and M. Lang. 2002. Empirical Evidence on the Evolution of International Earnings. The
Accounting Review 77: 115-134.
Lang, M., J. Raedy, and M. Yetman. 2003. How Representative are Firms that are Cross Listed
in the United States? An Analysis of Accounting Quality. Journal of Accounting Research
41: 363-386.
Lang, M., J. Raedy, and W. Wilson. 2006. Earnings Management and Cross Listing: Are
Reconciled Earnings Comparable to US Earnings? Journal of Accounting and Economics 42:
255-283.
34
La Porta, R., F. Lopez-de-Silanes, A. Shleifer, and R.W. Vishny. 1998. Law and Finance.
Journal of Political Economy 106: 1113-1155.
Leuz, C. 2003. IAS Versus U.S. GAAP: Information Asymmetry-based Evidence from
Germany’s New Market. Journal of Accounting Research 41: 445-472.
Leuz, C.; D. Nanda; and P. Wysocki. 2003. Earnings Management and Investor Protection: An
International Comparison. Journal of Financial Economics 69: 505-527.
Schipper, K. 2003. Principles-Based Accounting Standards. Accounting Horizons, March: 61-72.
Securities and Exchange Commission. 2007. Final Rule: Acceptance from Foreign Private
Issuers of Financial Statements Prepared in Accordance with International Financial
Reporting Standards without Reconciliation to U.S. GAAP.
Securities and Exchange Commission. 2008. Roadmap for the Potential Use of Financial
Statements Prepared in Accordance with International Financial Reporting Standards by
U.S. Issuers; Proposed Rule.
Street, D. and S. Gray. 2001. Observance of International Accounting Standards: Factors
Explaining Non-compliance. ACCA Research Report No. 74.
Van Tendeloo, B. and A. Vanstraelen. 2005. Earnings Management under German GAAP versus
IFRS. European Accounting Review 14:1, 155-180.
Watts, R. and J. Zimmerman. 1986. Positive Accounting Theory. Prentice-Hall, Upper Saddle
River, New Jersey.
35
TABLE 1 IAS Firm Sample Composition by Country, Industry, and Year of Adoption
Panel A: Composition by Country
Number of Firm-
Year Observations
Percentage of Firm-Year
Observations Number of
Firms Percentage of
Firms Australia 2,901 18.77 747 24.45 Austria 174 1.13 30 0.98 Belgium 303 1.96 58 1.90 Canada 16 0.10 4 0.13 Czech Republic 66 0.43 12 0.39 Denmark 541 3.50 92 3.01 Finland 549 3.55 99 3.24 France 1,734 11.22 340 11.13 Germany 1,543 9.98 312 10.21 Greece 140 0.91 47 1.54 Hong Kong 51 0.33 11 0.36 Hungary 19 0.12 7 0.23 Ireland 233 1.51 31 1.01 Israel 3 0.02 3 0.10 Italy 842 5.45 147 4.81 Netherlands 606 3.92 81 2.65 Norway 581 3.76 107 3.50 Peru 38 0.25 38 1.24 Philippines 16 0.10 16 0.52 Portugal 193 1.25 30 0.98 Singapore 31 0.20 5 0.16 Spain 16 0.10 8 0.26 Sweden 1,033 6.68 204 6.68 Switzerland 400 2.59 73 2.39 Turkey 60 0.39 28 0.92 United Kingdom 3,369 21.79 525 17.18 Totals 15,458 100.00 3,055 100.00
36
TABLE 1 IAS Firm Sample Composition by Country, Industry, and Year
Panel B: Composition by Industry
Number of Firm-Year
Observations
Percentage of Firm-Year
Observations Number of
Firms Percentage of
Firms Agriculture, Forestry and Fishing 81 0.52 16 0.52 Mining 1,134 7.34 242 7.92 Construction 1,142 7.39 176 5.76 Manufacturing 5,843 37.80 1,076 35.22 Utilities 491 3.18 89 2.91 Gas Distribution 57 0.37 11 0.36 Retail Trade 574 3.71 114 3.73 Finance, Insurance and Real Estate 2,307 14.92 501 16.40 Services 3,638 23.53 797 26.09 Public Administration 191 1.24 33 1.08 Totals 15,458 100.00 3,055 100.00
37
TABLE 1 IAS Firm Sample Composition by Country, Industry, and Year
Panel C: Composition by Year
Year of IAS Adoption Observation Year
Number of Firms
Percentage of
Firms
After IAS Adoption
Before IAS Adoption
1991 n/a n/a 0 1 1992 n/a n/a 0 2 1993 n/a n/a 0 7 1994 n/a n/a 0 29 1995 3 0.10 3 253 1996 6 0.20 8 450 1997 9 0.29 16 577 1998 17 0.56 29 671 1999 35 1.15 58 779 2000 31 1.01 70 880 2001 30 0.98 81 1,257 2002 49 1.60 117 1,529 2003 39 1.28 123 1,762 2004 83 2.72 169 1,944 2005 1,598 52.31 1,669 791 2006 1,155 37.81 2,183 0 Totals 3,055 100.00 4,526 10,932
The sample comprises non-US firms that adopted IAS between 1995 and 2006 (IAS firms).
38
TABLE 2 Descriptive Statistics: IAS Firms and US Firms
IAS Firms (N = 4,526) US Firms (N = 4,526)
Variables Mean Standard Deviation Mean
Standard Deviation
PS 8.87 13.26 21.37 17.70 BVES 6.09 12.31 9.06 7.74 NIS 0.74 1.36 0.78 1.37 RETURN 0.25 0.43 0.13 0.45 NI/P 0.06 0.15 0.05 0.10 ΔNI/P 0.02 0.06 0.01 0.08
PS is share-weighted stock price six months after fiscal year-end; BVES is share-weighted book value of equity per share; NIS is share-weighted net income per share; RETURN is annual stock return beginning nine months before and ending three months after fiscal year end; NI/P is net income per share scaled by beginning of year stock price; and Δ denotes annual change. The share weighting for each IAS country is the average number of shares outstanding for firms in that country divided by the average number of shares outstanding for firms in the pooled IAS sample. By convention, we set the share weight to one for US firms. The sample comprises non-US firms that adopted IAS between 1995 and 2006 (IAS firms) and a sample of US firms matched to the IAS firms on size and industry (US firms). All statistics are for IAS and US firms after IAS firms adopted IAS.
39
TABLE 3 Comparison of IAS and US Firms’ Value Relevance
Panel A. After IAS Adoption (Prediction: US > IAS)
Regression R2 IAS Firms
(N = 4,526) US Firms
(N = 4,526) Price 0.4319 0.5714* Return 0.1015 0.1119 Good News 0.0160 0.0043* Bad News 0.0650 0.1441*
Panel B. Before IAS Adoption (Prediction: US > IAS)
IAS Firms
(N = 10,932) US Firms
(N = 10,932) Price 0.2804 0.4960* Return 0.1028 0.1275* Good News 0.0015 0.0132* Bad News 0.0855 0.0885
Panel C. Change in Differences Before and After IAS Adoption (Prediction: After < Before)
Difference
After Adoption Difference
Before Adoption Change in Difference
After − Before Price 0.1395 0.2156 −0.0761* Return 0.0104 0.0247 −0.0143* Good News 0.0117 0.0117 0.0000 Bad News 0.0791 0.0030 0.0761*
* denotes difference between IAS and US firms’ metrics in panels A and B, and change in difference in panel C, is significant.
Price is the regression R2 from , where P* is the residual from a first-step regression of share-weighted stock price six months after fiscal year-end, Ps, on industry and country fixed effects. BVEs is share-weighted book value of equity per share and NIs is share-weighted net income per share. The share weighting for each IAS country is the average number of shares outstanding for firms in that country divided by the average number of
40
shares outstanding for firms in the pooled IAS sample. By convention, we set the share weight to one for US firms.
Return is the regression R2 from , where
RETURN* is the residual from a first-step regression of annual stock return, beginning nine months before and ending three months after fiscal year end, on industry and country fixed effects. NI/P is net income per share scaled by beginning of year stock price; LOSS is an indicator variable that equals one if NI/P is negative and zero otherwise; and Δ denotes annual change.
Good News and Bad News are the regression R2s from , where is the residual from the first-step regression of NI/P on country and industry fixed
effects. Good News (Bad News) is the R2 from the equation estimated using firms with positive (negative) RETURN. In each first-step regression, we estimate the regression separately for firms relevant to the comparison we make. For example, when we compare value relevance of IAS and US firms after the IAS firms adopt IAS, we estimate the first-step regression on the combined sample of IAS firms and their matched US firms for sample years after the IAS firms adopt IAS. i and t denote firm and year. To test for differences in R2, we estimate the equation 1,000 times, randomly assigning firms to the relevant partitions and base significance tests on the frequency of observing an R2 difference greater than or equal to the tabulated difference. The sample comprises non-US firms that adopted IAS between 1995 and 2006 (IAS firms) and a sample of US firms matched to the IAS firms on size and industry (US firms).
41
TABLE 4 Comparison of IAS and US Firms’ Value Relevance Partitioned on Adoption of IAS Before
and After 2005 Panel A. Before 2005 Adoption (Prediction: US > IAS)
Regression R2 IAS Firms (N = 798)
US Firms (N = 798)
Price 0.2163 0.5485* Return 0.0539 0.0788 Good News 0.0009 0.0307* Bad News 0.0247 0.1979*
Panel B. After 2005 Adoption (Prediction: US > IAS)
Regression R2 IAS Firms
(N = 3,728) US Firms
(N = 3,728) Price 0.4347 0.5755* Return 0.1151 0.1227 Good News 0.0214 0.0005* Bad News 0.0842 0.1316*
Panel C. Difference in Differences for Adoption Before and After 2005 (Prediction: After < Before)
Difference
After Difference
Before Difference in Difference
After − Before Price 0.1408 0.3322 −0.1914* Return 0.0076 0.0249 −0.0173 Good News 0.0209 0.0298 −0.0089 Bad News 0.0474 0.1732 −0.1258*
* denotes difference between IAS and US firms’ metrics in panels A and B, and difference in difference in panel C, is significant.
Price is the regression R2 from , where P* is the residual from a first-step regression of share-weighted stock price six months after fiscal year-end, Ps, on industry and country fixed effects. BVEs is share-weighted book value of equity per share and NIs is share-weighted net income per share. The share weighting for each IAS country is the
42
average number of shares outstanding for firms in that country divided by the average number of shares outstanding for firms in the pooled IAS sample. By convention, we set the share weight to one for US firms.
Return is the regression R2 from , where
RETURN* is the residual from a first-step regression of annual stock return, beginning nine months before and ending three months after fiscal year end, on industry and country fixed effects. NI/P is net income per share scaled by beginning of year stock price; LOSS is an indicator variable that equals one if NI/P is negative and zero otherwise; and Δ denotes annual change.
Good News and Bad News are the regression R2s from , where is the residual from the first-step regression of NI/P on country and industry fixed
effects. Good News (Bad News) is the R2 from the equation estimated using firms with positive (negative) RETURN. In each first-step regression, we estimate the regression separately for firms relevant to the comparison we make. For example, when we compare value relevance of IAS and US firms after the IAS firms adopt IAS, we estimate the first-step regression on the combined sample of IAS firms and their matched US firms for sample years after the IAS firms adopt IAS. i and t denote firm and year. To test for differences in R2, we estimate the equation 1,000 times, randomly assigning firms to the relevant partitions and base significance tests on the frequency of observing an R2 difference greater than or equal to the tabulated difference. The sample comprises non-US firms that adopted IAS between 1995 and 2006 (IAS firms) and a sample of US firms matched to the IAS firms on size and industry (US firms).
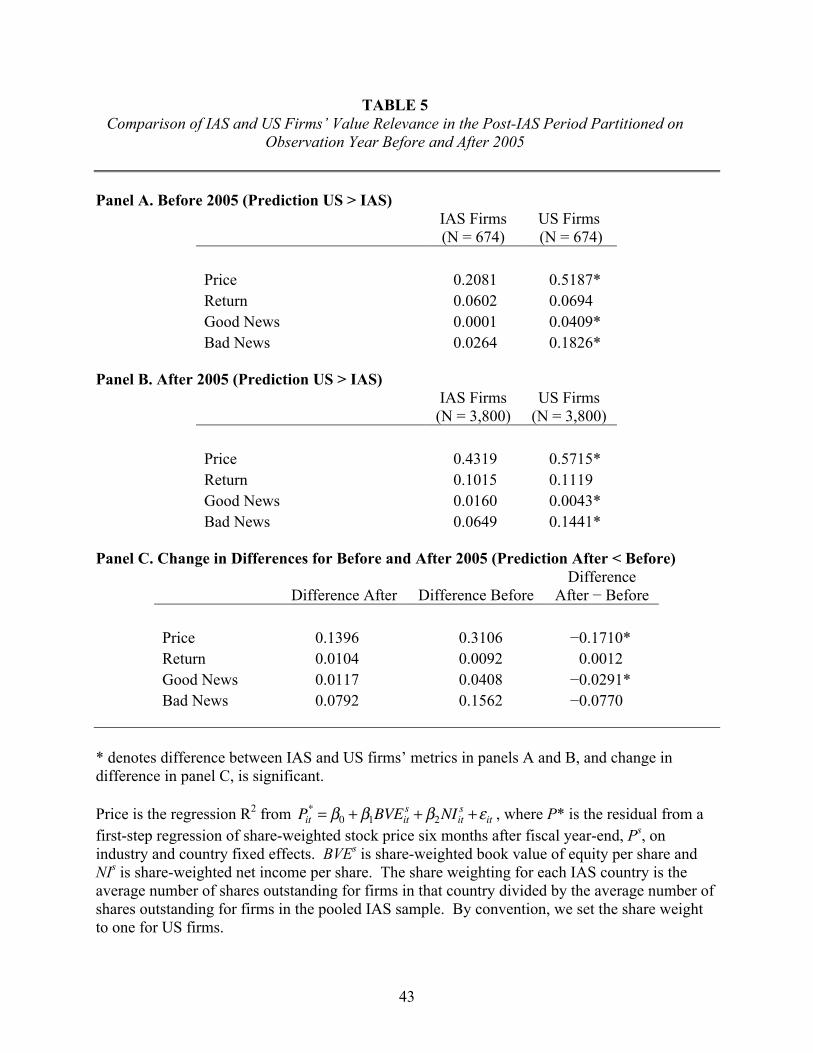
43
TABLE 5 Comparison of IAS and US Firms’ Value Relevance in the Post-IAS Period Partitioned on
Observation Year Before and After 2005 Panel A. Before 2005 (Prediction US > IAS)
IAS Firms (N = 674)
US Firms (N = 674)
Price 0.2081 0.5187* Return 0.0602 0.0694 Good News 0.0001 0.0409* Bad News 0.0264 0.1826*
Panel B. After 2005 (Prediction US > IAS)
IAS Firms
(N = 3,800) US Firms
(N = 3,800) Price 0.4319 0.5715* Return 0.1015 0.1119 Good News 0.0160 0.0043* Bad News 0.0649 0.1441*
Panel C. Change in Differences for Before and After 2005 (Prediction After < Before)
Difference After Difference Before Difference
After − Before Price 0.1396 0.3106 −0.1710* Return 0.0104 0.0092 0.0012 Good News 0.0117 0.0408 −0.0291* Bad News 0.0792 0.1562 −0.0770
* denotes difference between IAS and US firms’ metrics in panels A and B, and change in difference in panel C, is significant.
Price is the regression R2 from , where P* is the residual from a first-step regression of share-weighted stock price six months after fiscal year-end, Ps, on industry and country fixed effects. BVEs is share-weighted book value of equity per share and NIs is share-weighted net income per share. The share weighting for each IAS country is the average number of shares outstanding for firms in that country divided by the average number of shares outstanding for firms in the pooled IAS sample. By convention, we set the share weight to one for US firms.
44
Return is the regression R2 from , where
RETURN* is the residual from a first-step regression of annual stock return, beginning nine months before and ending three months after fiscal year end, on industry and country fixed effects. NI/P is net income per share scaled by beginning of year stock price; LOSS is an indicator variable that equals one if NI/P is negative and zero otherwise; and Δ denotes annual change.
Good News and Bad News are the regression R2s from , where is the residual from the first-step regression of NI/P on country and industry fixed
effects. Good News (Bad News) is the R2 from the equation estimated using firms with positive (negative) RETURN. In each first-step regression, we estimate the regression separately for firms relevant to the comparison we make. For example, when we compare value relevance of IAS and US firms after the IAS firms adopt IAS, we estimate the first-step regression on the combined sample of IAS firms and their matched US firms for sample years after the IAS firms adopt IAS. i and t denote firm and year. To test for differences in R2, we estimate the equation 1,000 times, randomly assigning firms to the relevant partitions and base significance tests on the frequency of observing an R2 difference greater than or equal to the tabulated difference. The sample comprises non-US firms that adopted IAS between 1995 and 2006 (IAS firms) and a sample of US firms matched to the IAS firms on size and industry (US firms).

45
TABLE 6 Comparison of IAS and US Firms’ Value Relevance Partitioned by Legal Origin After IAS
Adoption Panel A. Common Law (Prediction US > IAS)
IAS Firms
(N = 1,582) US Firms
(N = 1,582) Price 0.4779 0.5644 Return 0.1015 0.1314 Good News 0.0036 0.0001 Bad News 0.1058 0.1867*
Panel B. Code Law (Prediction US > IAS)
IAS Firms
(N = 2,087) US Firms
(N = 2,087) Price 0.3708 0.5741* Return 0.1018 0.1043 Good News 0.0251 0.0074* Bad News 0.0339 0.1134*
* denotes difference between IAS and US firms’ metrics is significant.
Price is the regression R2 from , where P* is the residual from a first-step regression of share-weighted stock price six months after fiscal year-end, Ps, on industry and country fixed effects. BVEs is share-weighted book value of equity per share and NIs is share-weighted net income per share. The share weighting for each IAS country is the average number of shares outstanding for firms in that country divided by the average number of shares outstanding for firms in the pooled IAS sample. By convention, we set the share weight to one for US firms.
Return is the regression R2 from , where
RETURN* is the residual from a first-step regression of annual stock return, beginning nine months before and ending three months after fiscal year end, on industry and country fixed effects. NI/P is net income per share scaled by beginning of year stock price; LOSS is an indicator variable that equals one if NI/P is negative and zero otherwise; and Δ denotes annual change.
46
Good News and Bad News are the regression R2s from , where is the residual from the first-step regression of NI/P on country and industry fixed
effects. Good News (Bad News) is the R2 from the equation estimated using firms with positive (negative) RETURN. In each first-step regression, we estimate the regression separately for firms relevant to the comparison we make. For example, when we compare value relevance of IAS and US firms after the IAS firms adopt IAS, we estimate the first-step regression on the combined sample of IAS firms and their matched US firms for sample years after the IAS firms adopt IAS. Common law firms are those from Australia, Canada, Hong Kong, Ireland, Singapore, South Africa, and the UK. Code law firm are those from Austria, Belgium, Denmark, Finland, France, Germany, Greece, Italy, Netherlands, Norway, Portugal, Spain, Sweden, and Switzerland. i and t denote firm and year. To test for differences in R2, we estimate the equation 1,000 times, randomly assigning firms to the relevant partitions and base significance tests on the frequency of observing an R2 difference greater than or equal to the tabulated difference. The sample comprises non-US firms that adopted IAS between 1995 and 2006 (IAS firms) and a sample of US firms matched to the IAS firms on size and industry (US firms).
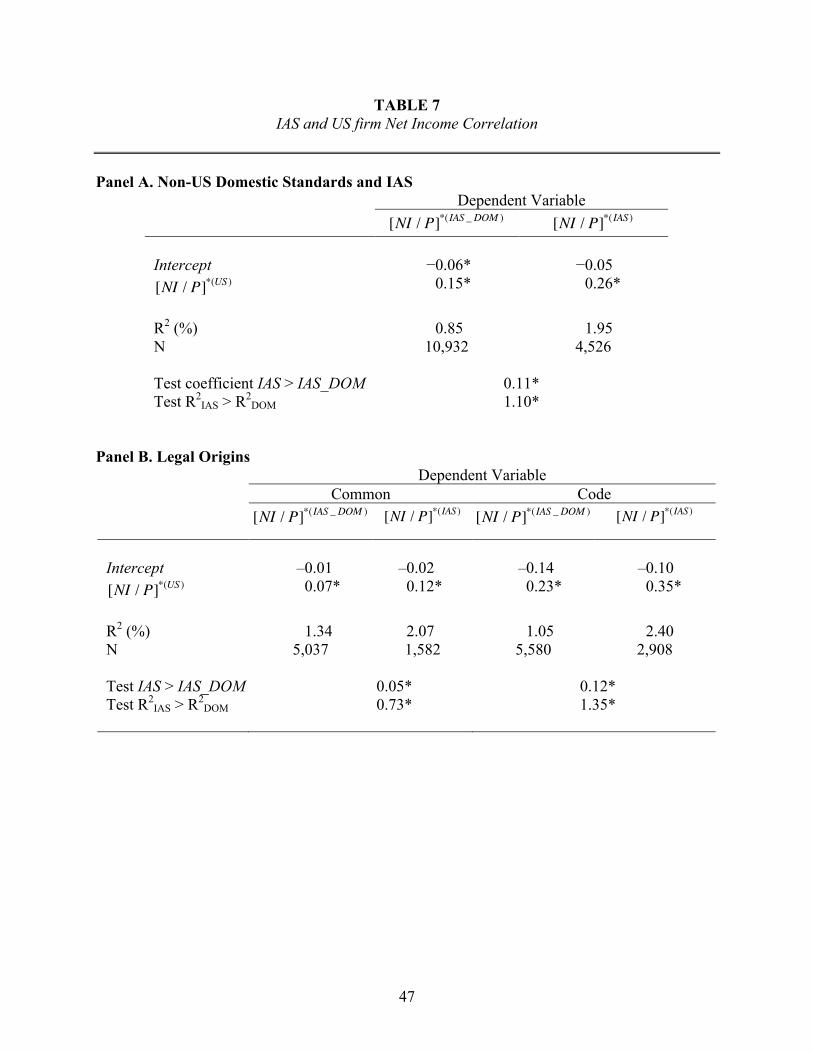
47
TABLE 7 IAS and US firm Net Income Correlation
Panel A. Non-US Domestic Standards and IAS
Dependent Variable
Intercept −0.06* −0.05 0.15* 0.26*
R2 (%) 0.85 1.95 N 10,932 4,526 Test coefficient IAS > IAS_DOM 0.11* Test R2
IAS > R2DOM 1.10*
Panel B. Legal Origins Dependent Variable
Common Code
Intercept –0.01 –0.02 –0.14 –0.10 0.07* 0.12* 0.23* 0.35*
R2 (%) 1.34 2.07 1.05 2.40 N 5,037 1,582 5,580 2,908 Test IAS > IAS_DOM 0.05* 0.12* Test R2
IAS > R2DOM 0.73* 1.35*
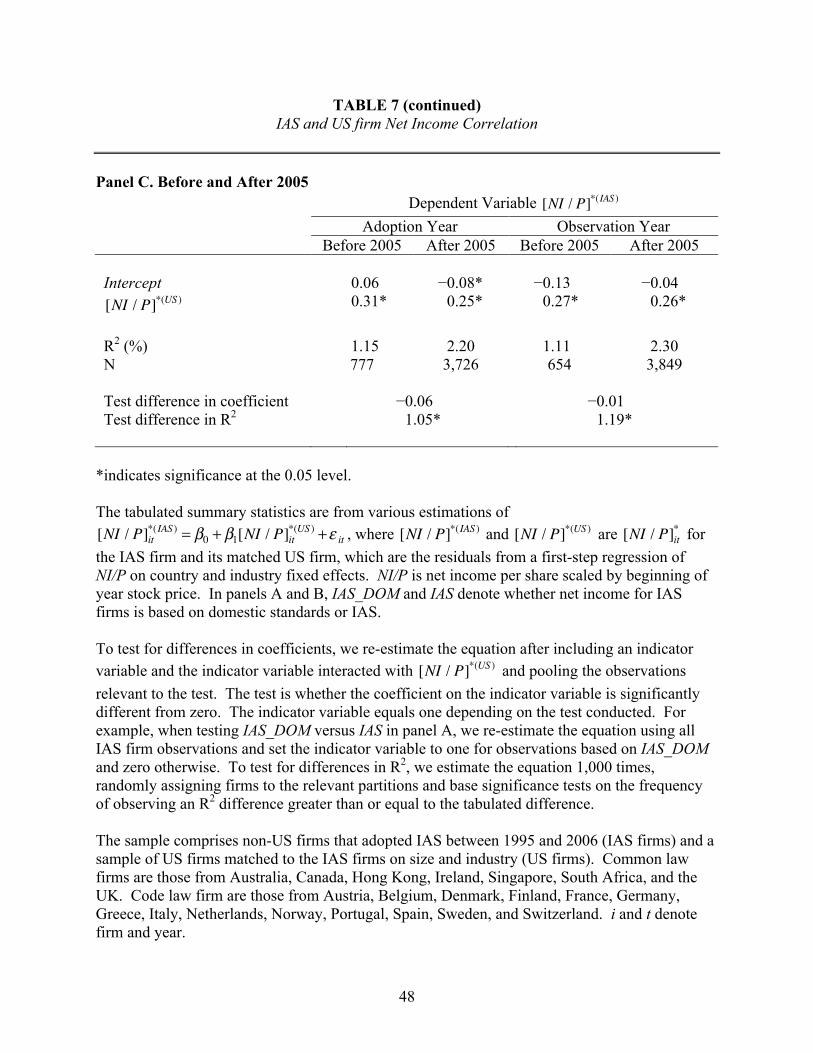
48
TABLE 7 (continued) IAS and US firm Net Income Correlation
Panel C. Before and After 2005 Dependent Variable
Adoption Year Observation Year Before 2005 After 2005 Before 2005 After 2005 Intercept 0.06 −0.08* −0.13 −0.04 0.31* 0.25* 0.27* 0.26*
R2 (%) 1.15 2.20 1.11 2.30 N 777 3,726 654 3,849 Test difference in coefficient −0.06 −0.01 Test difference in R2
1.05* 1.19* *indicates significance at the 0.05 level.
The tabulated summary statistics are from various estimations of
, where and are for the IAS firm and its matched US firm, which are the residuals from a first-step regression of NI/P on country and industry fixed effects. NI/P is net income per share scaled by beginning of year stock price. In panels A and B, IAS_DOM and IAS denote whether net income for IAS firms is based on domestic standards or IAS. To test for differences in coefficients, we re-estimate the equation after including an indicator variable and the indicator variable interacted with and pooling the observations relevant to the test. The test is whether the coefficient on the indicator variable is significantly different from zero. The indicator variable equals one depending on the test conducted. For example, when testing IAS_DOM versus IAS in panel A, we re-estimate the equation using all IAS firm observations and set the indicator variable to one for observations based on IAS_DOM and zero otherwise. To test for differences in R2, we estimate the equation 1,000 times, randomly assigning firms to the relevant partitions and base significance tests on the frequency of observing an R2 difference greater than or equal to the tabulated difference. The sample comprises non-US firms that adopted IAS between 1995 and 2006 (IAS firms) and a sample of US firms matched to the IAS firms on size and industry (US firms). Common law firms are those from Australia, Canada, Hong Kong, Ireland, Singapore, South Africa, and the UK. Code law firm are those from Austria, Belgium, Denmark, Finland, France, Germany, Greece, Italy, Netherlands, Norway, Portugal, Spain, Sweden, and Switzerland. i and t denote firm and year.

49


