Are great apes able to reason from multi-item samples to ...
14
Received: 28 May 2017 | Revised: 17 July 2017 | Accepted: 13 August 2017 DOI: 10.1002/ajp.22693 RESEARCH ARTICLE Are great apes able to reason from multi-item samples to populations of food items? Johanna Eckert 1,2 | Hannes Rakoczy 2 | Josep Call 1,3 1 Department of Developmental and Comparative Psychology, Max Planck Institute for Evolutionary Anthropology, Leipzig, Germany 2 Department of Developmental Psychology, University of Goettingen, Goettingen, Germany 3 School of Psychology and Neuroscience, University of St Andrews, St Andrews, United Kingdom Correspondence Johanna Eckert, Department of Developmental and Comparative Psychology, Max Planck Institute for Evolutionary Anthropology, Deutscher Platz 6, Leipzig 04103, Germany. Email: [email protected] Funding information Deutsche Forschungsgemeinschaft, Grant number: RA 2155/3-1 Inductive learning from limited observations is a cognitive capacity of fundamental importance. In humans, it is underwritten by our intuitive statistics, the ability to draw systematic inferences from populations to randomly drawn samples and vice versa. According to recent research in cognitive development, human intuitive statistics develops early in infancy. Recent work in comparative psychology has produced first evidence for analogous cognitive capacities in great apes who flexibly drew inferences from populations to samples. In the present study, we investigated whether great apes (Pongo abelii, Pan troglodytes, Pan paniscus, Gorilla gorilla) also draw inductive inferences in the opposite direction, from samples to populations. In two experiments, apes saw an experimenter randomly drawing one multi-item sample from each of two populations of food items. The populations differed in their proportion of preferred to neutral items (24:6 vs. 6:24) but apes saw only the distribution of food items in the samples that reflected the distribution of the respective populations (e.g., 4:1 vs. 1:4). Based on this observation they were then allowed to choose between the two populations. Results show that apes seemed to make inferences from samples to populations and thus chose the population from which the more favorable (4:1) sample was drawn in Experiment 1. In this experiment, the more attractive sample not only contained proportionally but also absolutely more preferred food items than the less attractive sample. Experiment 2, however, revealed that when absolute and relative frequencies were disentangled, apes performed at chance level. Whether these limitations in apes’ performance reflect true limits of cognitive competence or merely performance limitations due to accessory task demands is still an open question. KEYWORDS comparative cognition, intuitive statistics, non-human primates, numerical cognition, probabilistic reasoning 1 | INTRODUCTION Making general inferences from limited data is one of the key components of human inductive learning (see e.g., Denison & Xu, 2012; Holland, 1986; Tenenbaum, Griffiths, & Kemp, 2006; Skyrms, 1975). Traditionally, statistical reasoning was deemed to be difficult and error-prone (e.g., Cosmides & Tooby, 1996; Tversky & Kahneman, 1974, 1981) and dependent on language and formal education (e.g., Piaget & Inhelder, 1975). However, recent studies suggest that even very young human infants have an astonishingly broad understanding of statistical relations: They are able to generalize from small samples to larger populations (Denison, Reed, & Xu, 2013; Xu & Garcia, 2008), make predictions about single event probabilities (e.g., Téglás, Girotto, Gonzalez, & Bonatti, 2007) and use these predictions to guide their search for desired objects (Denison & Xu, 2010b, 2014; Feigenson, Carey, & Hauser, 2002). In one remarkable Am J Primatol. 2017;79:e22693 wileyonlinelibrary.com/journal/ajp © 2017 Wiley Periodicals, Inc. | 1 of 14 https://doi.org/10.1002/ajp.22693
Transcript of Are great apes able to reason from multi-item samples to ...

Received: 28 May 2017 | Revised: 17 July 2017 | Accepted: 13 August 2017
DOI: 10.1002/ajp.22693
RESEARCH ARTICLE
Are great apes able to reason from multi-item samples topopulations of food items?
Johanna Eckert1,2 | Hannes Rakoczy2 | Josep Call1,3
1Department of Developmental and
Comparative Psychology, Max Planck Institute
for Evolutionary Anthropology, Leipzig,
Germany
2Department of Developmental Psychology,
University of Goettingen, Goettingen,
Germany
3 School of Psychology and Neuroscience,
University of St Andrews, St Andrews, United
Kingdom
Correspondence
Johanna Eckert, Department of
Developmental and Comparative Psychology,
Max Planck Institute for Evolutionary
Anthropology, Deutscher Platz 6, Leipzig
04103, Germany.
Email: [email protected]
Funding information
Deutsche Forschungsgemeinschaft,
Grant number: RA 2155/3-1
Inductive learning from limited observations is a cognitive capacity of fundamental
importance. In humans, it is underwritten by our intuitive statistics, the ability to draw
systematic inferences from populations to randomly drawn samples and vice versa.
According to recent research in cognitive development, human intuitive statistics
develops early in infancy. Recent work in comparative psychology has produced first
evidence for analogous cognitive capacities in great apes who flexibly drew inferences
from populations to samples. In the present study, we investigatedwhether great apes
(Pongo abelii,Pan troglodytes,Pan paniscus,Gorilla gorilla) also draw inductive inferences
in theopposite direction, fromsamples topopulations. In twoexperiments, apes sawan
experimenter randomly drawing one multi-item sample from each of two populations
of food items. The populations differed in their proportion of preferred to neutral items
(24:6 vs. 6:24) but apes saw only the distribution of food items in the samples that
reflected the distribution of the respective populations (e.g., 4:1 vs. 1:4). Based on this
observation they were then allowed to choose between the two populations. Results
show that apes seemed to make inferences from samples to populations and thus
chose the population from which the more favorable (4:1) sample was drawn in
Experiment 1. In this experiment, the more attractive sample not only contained
proportionally but also absolutely more preferred food items than the less attractive
sample. Experiment 2, however, revealed that when absolute and relative frequencies
were disentangled, apes performed at chance level. Whether these limitations in apes’
performance reflect true limits of cognitive competence or merely performance
limitations due to accessory task demands is still an open question.
K E YWORD S
comparative cognition, intuitive statistics, non-human primates, numerical cognition,
probabilistic reasoning
1 | INTRODUCTION
Making general inferences from limited data is one of the key
components of human inductive learning (see e.g., Denison & Xu,
2012; Holland, 1986; Tenenbaum, Griffiths, & Kemp, 2006; Skyrms,
1975). Traditionally, statistical reasoning was deemed to be difficult
and error-prone (e.g., Cosmides & Tooby, 1996; Tversky & Kahneman,
1974, 1981) and dependent on language and formal education
(e.g., Piaget & Inhelder, 1975). However, recent studies suggest that
even very young human infants have an astonishingly broad
understanding of statistical relations: They are able to generalize
from small samples to larger populations (Denison, Reed, & Xu, 2013;
Xu & Garcia, 2008), make predictions about single event probabilities
(e.g., Téglás, Girotto, Gonzalez, & Bonatti, 2007) and use these
predictions to guide their search for desired objects (Denison & Xu,
2010b, 2014; Feigenson, Carey, & Hauser, 2002). In one remarkable
Am J Primatol. 2017;79:e22693 wileyonlinelibrary.com/journal/ajp © 2017 Wiley Periodicals, Inc. | 1 of 14
https://doi.org/10.1002/ajp.22693

study, for example, infants were confronted with two jars containing
mixtures of preferred and non-preferred types of candy (Denison&Xu,
2010b). After they had watched the experimenter randomly sampling
one piece of candy from each jar and placing it in an occluded cup,most
infants searched in the cup that contained a sample from the jar with a
higher proportion of their preferred candy (Denison & Xu, 2010b).
Hence, infants seem to have used the proportional information
provided by the populations to reason about the samples. Moreover,
infants can integrate probabilistic information with information from
other domains such as intuitive physics or intuitive psychology
(Denison, Trikutam, & Xu, 2014; Téglás, Vul, & Girotto, 2011; Denison
& Xu 2010a; Xu & Denison 2009). For example, infants understand
that a preference of the experimenter for a certain type of object can
turn a sampling process into a non-random event. If the same
experimenter, however, is blindfolded, infants expect the sampled
objects to reflect the proportions within populations (Xu & Denison
2009). These findings imply that at least at the age of 6 months,
humans already flexibly use intuitive statistics to predict the outcome
of events. Being apparently independent of language or formal
education, this raises the question whether these kinds of probabilistic
reasoning represent an evolutionary ancient trait that is shared with
other species.
Many species are capable of numerical cognition: For example,
great apes (e.g., Beran, McIntyre, Garland, & Evans, 2013; Boysen &
Berntson, 1989; Call, 2000; Hanus & Call, 2007), old- and new-world
monkeys (e.g., Barnard, Hughes, & Gerhardt, 2013; Beran, Evans,
Leighty, Harris, & Rice, 2008; Beran & Parrish, 2016), elephants
(Perdue, Talbot, Stone, & Beran, 2012), bears (Vonk & Beran, 2012),
raccoons (Davis, 1984), dogs (Ward & Smuts, 2007), cats (Pisa &
Agrillo, 2009), birds [e.g., Rugani, Cavazzana, Vallortigara, & Regolin,
2013], fish [e.g., Potrich, Sovrano, Stancher, & Vallortigara, 2015],
and even insects [bees: Dacke & Srinivasan, 2008; ants: Reznikova &
Ryabko, 2011] are able to compare quantities, suggesting that
representing numerosity is an evolutionary ancient trait. The
practical advantages of such a capacity are obvious: in the context
of foraging, for example, comparing quantities is a highly useful tool
to identify the most profitable feeding location [see e.g., Farnsworth
& Smolinski, 2006 and Hunt, Low, & Burns, 2008 for field
experiments on quantity discrimination in a foraging context]. In
the context of competition comparing ones own group size with that
of a rival group can help to estimate the chances of winning a
potential fight [e.g., Benson-Amram, Heinen, Dryer, & Holekamp,
2011; McComb, Packer, & Pusey, 1994; Wilson, Britton, & Franks,
2002]. Chimpanzees, for example, have been found to attack an
opponent group only if their own group outnumbers those of their
conspecifics by at least 1.5 (Wilson et al., 2002).
Relatedly, one can imagine that in some situations it would make
sense for an animal to be able tomake probability judgments instead of
straightforward quantity comparisons. Efficient foraging, for instance,
requires an individual to search for food in locations that most likely
provide the best payoff in relation to foraging time (Geary, Berch, &
Mann Koepke, 2015; for a review about optimal foraging theory see
example, Hamilton, 2010). One possibility to identify the best payoff
per time unit is to use the relative frequency of past successes in a
feeding location. Imagine a group of chimpanzees that has to decide in
the morning in which direction to go: Either toward feeding ground A
or toward feeding ground B. The apes might want to compare the
proportion of times they visited each feeding ground and obtained a
sufficient amount of food instead of simply comparing the absolute
number of times they were successful in each location. Hence, non-
human animals could clearly benefit from an ability exceeding a mere
estimation of absolute or relative numerosity, namely a sense for
probabilistic relations, that is, intuitive statistics. Future research will
need to investigate both when and due to which selection pressures
intuitive statistics evolved.
A recent comparative study investigated intuitive statistical
abilities in non-human great apes with the same kinds of methods
used in infancy research (Rakoczy, Clüver, & Saucke, 2014). Individuals
of four great ape species were presented with two populations of food
items. Both populations consisted of the same two types of food (one
type clearly preferred over the other) but with different relative
frequency distributions. The experimenter drew a one-object-sample
from each population and gave the subject a choice between the two
hidden samples. Hence, subjects had to infer which population was
more likely to yield a preferred food item as a sample. Interestingly,
individuals of all tested great ape species were able to form correct
expectations about the probability of the sampling events, even when
absolute and relative frequencies within the populations were
disentangled. Apes inferences were, therefore, not only based on
information about absolute frequency, but instead they were truly
based on probabilistic information. Most recently, another represen-
tative of the primate order was tested in the same paradigm: Capuchin
monkeys Sapajus sp (Tecwyn, Denison, Messer, & Buchsbaum, 2016).
In a series of four experiments, the monkeys were allowed to choose
between the randomly drawn samples of two populations of food
items with different proportions of preferred and non-preferred food.
Results revealed that a few individuals might have drawn probabilistic
inferences based on proportional information (control conditions
excluded the usage of simpler choice heuristics). However, monkeys
performance in a baseline control condition was unexpectedly low,
questioning whether they truly fully understood the procedure. It
remains, therefore, an open question whether primates other than
great apes are capable of intuitive statistics.
Although the findings of Rakoczy et al. (2014) raised the possibility
that apes and human infants may operate with the same cognitive
capacities for intuitive statistics, it leaves many open questions for
future research. One fundamentally important question is whether
apes’ intuitive statistics reveal the same kinds of flexibility and
generality as those found in human infants. In particular, does their
ability to form expectations about samples randomly drawn from
populations (inference population > sample; Rakoczy et al., 2014)
extend to the ability to reason from a given sample to the
corresponding population (inference sample > population)?
In human infants, this question was addressed using the violation
of expectation (VOE) looking-time paradigm (Denison et al., 2013; Xu
& Garcia, 2008). In one study (Xu & Garcia 2008) 8-month-old infants
2 of 14 | ECKERT ET AL.
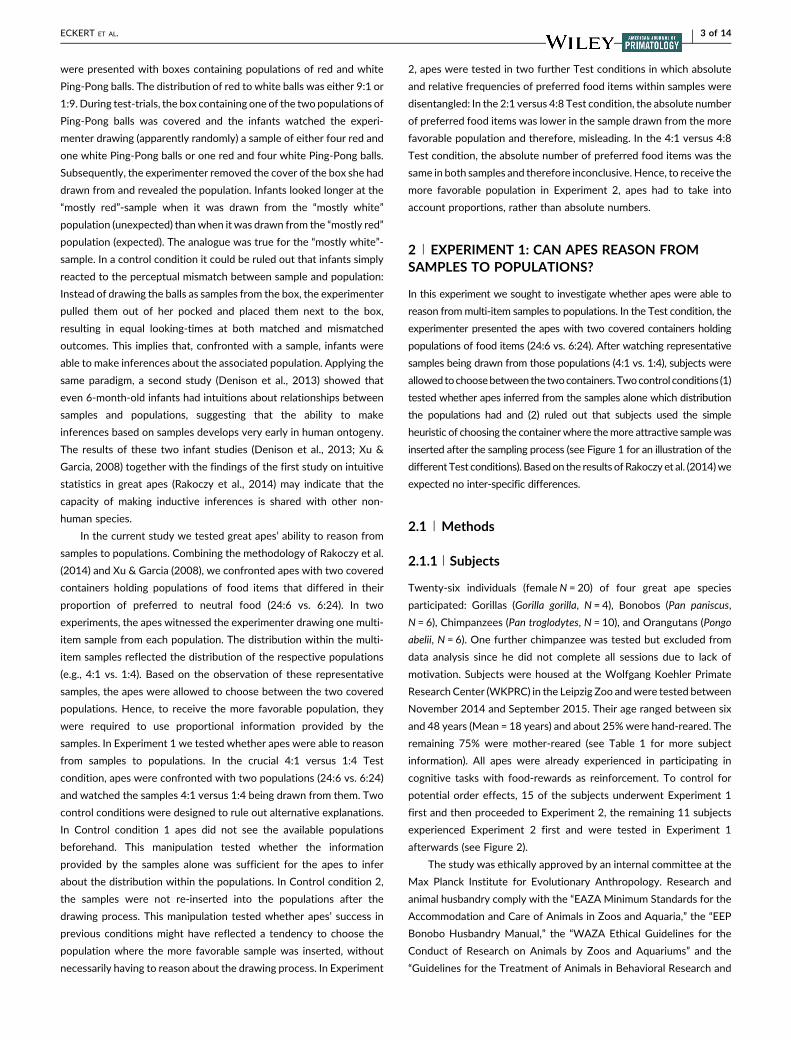
were presented with boxes containing populations of red and white
Ping-Pong balls. The distribution of red to white balls was either 9:1 or
1:9. During test-trials, the box containing one of the two populations of
Ping-Pong balls was covered and the infants watched the experi-
menter drawing (apparently randomly) a sample of either four red and
one white Ping-Pong balls or one red and four white Ping-Pong balls.
Subsequently, the experimenter removed the cover of the box she had
drawn from and revealed the population. Infants looked longer at the
“mostly red”-sample when it was drawn from the “mostly white”
population (unexpected) thanwhen it was drawn from the “mostly red”
population (expected). The analogue was true for the “mostly white”-
sample. In a control condition it could be ruled out that infants simply
reacted to the perceptual mismatch between sample and population:
Instead of drawing the balls as samples from the box, the experimenter
pulled them out of her pocked and placed them next to the box,
resulting in equal looking-times at both matched and mismatched
outcomes. This implies that, confronted with a sample, infants were
able to make inferences about the associated population. Applying the
same paradigm, a second study (Denison et al., 2013) showed that
even 6-month-old infants had intuitions about relationships between
samples and populations, suggesting that the ability to make
inferences based on samples develops very early in human ontogeny.
The results of these two infant studies (Denison et al., 2013; Xu &
Garcia, 2008) together with the findings of the first study on intuitive
statistics in great apes (Rakoczy et al., 2014) may indicate that the
capacity of making inductive inferences is shared with other non-
human species.
In the current study we tested great apes’ ability to reason from
samples to populations. Combining the methodology of Rakoczy et al.
(2014) and Xu & Garcia (2008), we confronted apes with two covered
containers holding populations of food items that differed in their
proportion of preferred to neutral food (24:6 vs. 6:24). In two
experiments, the apes witnessed the experimenter drawing one multi-
item sample from each population. The distribution within the multi-
item samples reflected the distribution of the respective populations
(e.g., 4:1 vs. 1:4). Based on the observation of these representative
samples, the apes were allowed to choose between the two covered
populations. Hence, to receive the more favorable population, they
were required to use proportional information provided by the
samples. In Experiment 1 we tested whether apes were able to reason
from samples to populations. In the crucial 4:1 versus 1:4 Test
condition, apes were confronted with two populations (24:6 vs. 6:24)
and watched the samples 4:1 versus 1:4 being drawn from them. Two
control conditions were designed to rule out alternative explanations.
In Control condition 1 apes did not see the available populations
beforehand. This manipulation tested whether the information
provided by the samples alone was sufficient for the apes to infer
about the distribution within the populations. In Control condition 2,
the samples were not re-inserted into the populations after the
drawing process. This manipulation tested whether apes’ success in
previous conditions might have reflected a tendency to choose the
population where the more favorable sample was inserted, without
necessarily having to reason about the drawing process. In Experiment
2, apes were tested in two further Test conditions in which absolute
and relative frequencies of preferred food items within samples were
disentangled: In the 2:1 versus 4:8 Test condition, the absolute number
of preferred food items was lower in the sample drawn from the more
favorable population and therefore, misleading. In the 4:1 versus 4:8
Test condition, the absolute number of preferred food items was the
same in both samples and therefore inconclusive. Hence, to receive the
more favorable population in Experiment 2, apes had to take into
account proportions, rather than absolute numbers.
2 | EXPERIMENT 1: CAN APES REASON FROMSAMPLES TO POPULATIONS?
In this experiment we sought to investigate whether apes were able to
reason frommulti-item samples to populations. In the Test condition, the
experimenter presented the apes with two covered containers holding
populations of food items (24:6 vs. 6:24). After watching representative
samples being drawn from those populations (4:1 vs. 1:4), subjects were
allowedtochoosebetween the twocontainers.Twocontrol conditions (1)
tested whether apes inferred from the samples alone which distribution
the populations had and (2) ruled out that subjects used the simple
heuristic of choosing the containerwhere themore attractive samplewas
inserted after the sampling process (see Figure 1 for an illustration of the
differentTest conditions). Basedon the results of Rakoczy et al. (2014)we
expected no inter-specific differences.
2.1 | Methods
2.1.1 | Subjects
Twenty-six individuals (femaleN = 20) of four great ape species
participated: Gorillas (Gorilla gorilla, N = 4), Bonobos (Pan paniscus,
N = 6), Chimpanzees (Pan troglodytes, N = 10), and Orangutans (Pongo
abelii, N = 6). One further chimpanzee was tested but excluded from
data analysis since he did not complete all sessions due to lack of
motivation. Subjects were housed at the Wolfgang Koehler Primate
Research Center (WKPRC) in the Leipzig Zoo andwere tested between
November 2014 and September 2015. Their age ranged between six
and 48 years (Mean = 18 years) and about 25%were hand-reared. The
remaining 75% were mother-reared (see Table 1 for more subject
information). All apes were already experienced in participating in
cognitive tasks with food-rewards as reinforcement. To control for
potential order effects, 15 of the subjects underwent Experiment 1
first and then proceeded to Experiment 2, the remaining 11 subjects
experienced Experiment 2 first and were tested in Experiment 1
afterwards (see Figure 2).
The study was ethically approved by an internal committee at the
Max Planck Institute for Evolutionary Anthropology. Research and
animal husbandry comply with the “EAZA Minimum Standards for the
Accommodation and Care of Animals in Zoos and Aquaria,” the “EEP
Bonobo Husbandry Manual,” the “WAZA Ethical Guidelines for the
Conduct of Research on Animals by Zoos and Aquariums” and the
“Guidelines for the Treatment of Animals in Behavioral Research and
ECKERT ET AL. | 3 of 14

Teaching” of the Association for the Study of Animal Behavior (ASAB).
This research adhered to the American Society of Primatologists
principles for the ethical treatment of primates.
2.1.2 | Materials
Subjects were tested individually in their sleeping cages or in
special test cages. A Plexiglas panel fitted on the cage mesh
separated ape and experimenter. The panel had two small holes (ø
2 cm; distance between holes 59 cm) through which subjects could
insert a finger to indicate a choice. Perpendicular to the Plexiglas
panel, a sliding table (45 × 79 cm) was mounted on the cage and
could be moved both toward the subject and the experimenter.
Underneath the table there were two small concealed compart-
ments in which food items could be hidden prior to each test trial
without the subject noticing it. To prevent subjects from watching,
for example, preparation of a trial, a screen (27 × 79 cm) could be
fixed via metal brackets at the end of the table closer to the ape's
side. During test trials, apes were presented with two transparent
Plexiglas containers (ø 8 cm), each containing a population of food
items, namely pieces of fruit pellets and pieces of carrots of roughly
equal shape and size. The containers could be covered with opaque
occluders of the same diameter that prevented subjects from
seeing the content of the containers (see Figure 3 for an illustration
of the setup).
2.1.3 | Design and procedure
Before the actual test started, subjects underwent a familiarization
session. Subsequently,we carried out one test and two control conditions
to investigate whether apes were able to reason frommulti-item samples
to populations. All conditions consisted of 12 test trials, divided into three
sessions. Each session startedwith twopreference trials with single pellet
and carrot pieces (see Preference trials section). Thus, each session
consisted of two preference trials and four test trials.
Familiarization
Each subject that had not experienced Experiment 2 before
received one session with six trials of familiarization. In this
session, the ape was confronted with one transparent container
holding a population of carrot and pellet pieces (distribution
12:12). The experimenter presented the container to the ape,
shook it several times to give a good overview of the population
and subsequently placed it in the center of the sliding table.
FIGURE 1 Schematic illustration of the different test conditions. Experiment 1 comprised one test and two control conditions. In Control1, the populations were not shown prior to the sampling process. In Control 2, the samples were not replaced after sampling. The populations(24:6 vs. 6:24) as well as the samples (4:1 vs. 1:4) remained the same in all conditions of Experiment 1. Experiment 2 comprised two testconditions with the samples 2:1 versus 4:8 and 4:1 versus 4:8, respectively. The procedure and the populations remained the same as in thetest condition of Experiment 1
4 of 14 | ECKERT ET AL.

During the first three trials the subject watched the experimenter
drawing a random sample (three to five items) out of the
population, presenting it on the palm of the hand, and re-inserting
it into the container. After that, the experimenter moved the
container to the edge of the table and pushed the sliding table
forward, so that the ape could point to the container.
Subsequently, the subject received the content of the container
as reward. During the last three trials of familiarization, the
procedure was the same as explained above, but this time the
container was placed in an opaque occluder after the ape had
seen the population. Thus, the subject did not see the population
during the sampling process and when pointing to it. The
familiarization should ensure that subjects were familiar with
the material and that they understood that “inserting a hand in an
occluded container” meant that a sample was drawn from the
contained population.
Preference trials
The preference trials aimed at assuring the apes’ constant
preference for one of the two single-item types and were conducted
prior to each of the test sessions. In each trial the experimenter
placed one pellet piece and one carrot piece on the sliding table close
to the Plexiglas panel, directly in front of the holes. The side on
which the pellet piece was positioned was counterbalanced. Apes
indicated their choice with their finger and immediately received the
selected food item as reinforcement. Subsequently, the test trials of
the respective condition were conducted. The criterion for an ape to
be included in the analysis was choosing the pellet piece in at least
75% of the trials.
Test trials
All apes participated in three conditions. To control for a possible
effect of order, 15 subjects were tested in the first order of conditions
TABLE 1 Detailed description of animals participating in this study
Subject Species Sex AgeRearinghistory Start with experiment Order of conditions Drop out, reason
Fimi Bonobo F 7 Mother 2 Second Yes, “covered population” follow-up
Gemena Bonobo F 9 Mother 2 Second No
Kuno Bonobo M 18 Nursery 2 Second No
Lexi Bonobo F 15 Nursery 1 First No
Luiza Bonobo F 10 Mother 1 First No
Yasa Bonobo F 18 Mother 1 First No
Alexandra Chimpanzee F 15 Nursery 2 Second No
Bangolo Chimpanzee M 6 Mother 1 First Yes, lack of motivation
Daza Chimpanzee F 28 Unknown 2 Second Yes, “open population” follow-up
Frodo Chimpanzee M 21 Mother 1 First No
Jahaga Chimpanzee F 22 Mother 2 Second No
Jeudi Chimpanzee F 48 Unknown 2 Second Yes, “covered population” follow-up
Kara Chimpanzee F 9 Mother 2 Second No
Lobo Chimpanzee M 10 Mother 1 First No
Riet Chimpanzee F 37 Nursery 1 First No
Robert Chimpanzee M 38 Nursery 2 Second Yes, lack of motivation
Sandra Chimpanzee F 21 Mother 1 First No
Tai Chimpanzee F 12 Mother 1 First No
Abeeku Gorilla M 15 Mother 1 First Yes, “covered population” follow-up
Kibara Gorilla F 10 Mother 1 First No
Kumili Gorilla F 10 Mother 1 First Yes, “covered population” follow-up
Viringika Gorilla F 19 Mother 1 First No
Bimbo Orangutan M 34 Nursery 2 Second No
Dokana Orangutan F 26 Mother 1 First No
Padana Orangutan F 17 Mother 1 First No
Pini Orangutan F 27 Mother 2 Second No
Raja Orangutan F 11 Mother 2 Second No
Suaq Orangutan M 6 Mother 1 First No
ECKERT ET AL. | 5 of 14
(Test condition—Control 1—Control 2). The remaining eleven subjects
were tested in the reverse order of conditions (Control 2—Control 1-
Test condition). When we decided to split up subjects in the two
groups of orders, all gorillas had already been tested in the first order of
conditions. Thus, order was counterbalanced across subjects for all
species except for the four gorillas, whichwere all tested in the original
order of conditions (see Table 1 for information about the order of
conditions each subject experienced). In all conditions, the populations
consisted of 30 items each: Population A was composed of 24 pellet
pieces and 6 carrot pieces; population B was composed of 6 pellet
pieces and 24 carrot pieces. (These ratios were chosen because
Rakoczy et al. (2014) showed that apes can reliably discriminate
betweenmultiples of the ratio 4:1 vs. 1:4. To not exceed the upper limit
of caloric intake recommended for the apes, we had to limit the
absolute number of food items to a certain extent. This limitation also
reduced the risk of satiation and thereby helped to keep up apes’
motivation over the course of trials).
Test 4:1 versus 1:4 In this condition the samples reflected the
distribution of the populations one-to-one. More specifically, the
sample apparently drawn from population A (24 pellets: 6 carrots)
consisted of 4 pellet and 1 carrot pieces, and the sample apparently
drawn from population B (6 pellets: 24 carrots) consisted of 1 pellet
and 4 carrot pieces. Before a trial started, the experimenter fixed the
screen on the table to prevent the subject from watching
preparations. Subsequently, she positioned the pre-prepared multi-
item samples in the small compartments underneath the table. The
two containers holding the populations were placed next to each
other in the center of the table and the two opaque occluders were
positioned over them.
The trial started when the screen was removed from the sliding
table unblocking the view over the table for the subject. The
experimenter simultaneously removed the two occluders from the
containers, and subsequently showed each population to the ape by
lifting the container, tilting it forward and shaking it slightly. After
the subject had seen both populations, the experimenter reposi-
tioned the occluders over the containers and put the screen back
into the metal brackets. Then she shuffled both containers. Hence,
subjects knew the two available populations, but did not know which
population was which. Revealing the populations at the beginning of
each trial ensured that apes were aware of both containers holding a
relatively high number of food items (higher than the number of
items subsequently drawn). During the shuffling process, the
experimenter reached into the two compartments underneath the
table, retrieved the hidden samples and put them into her fists to
make sure that the subject did not see them there. After removing
the screen again, the experimenter pretended to draw simulta-
neously out of each population by inserting her fists into the two
covered containers and moving them around while looking upwards
(maintaining a pretence of random drawing). While the subject was
watching, she simultaneously removed both hands out of the
containers and presented the samples on the palms of her hands
close to the Plexiglas panel saying “look!”. After the ape had seen
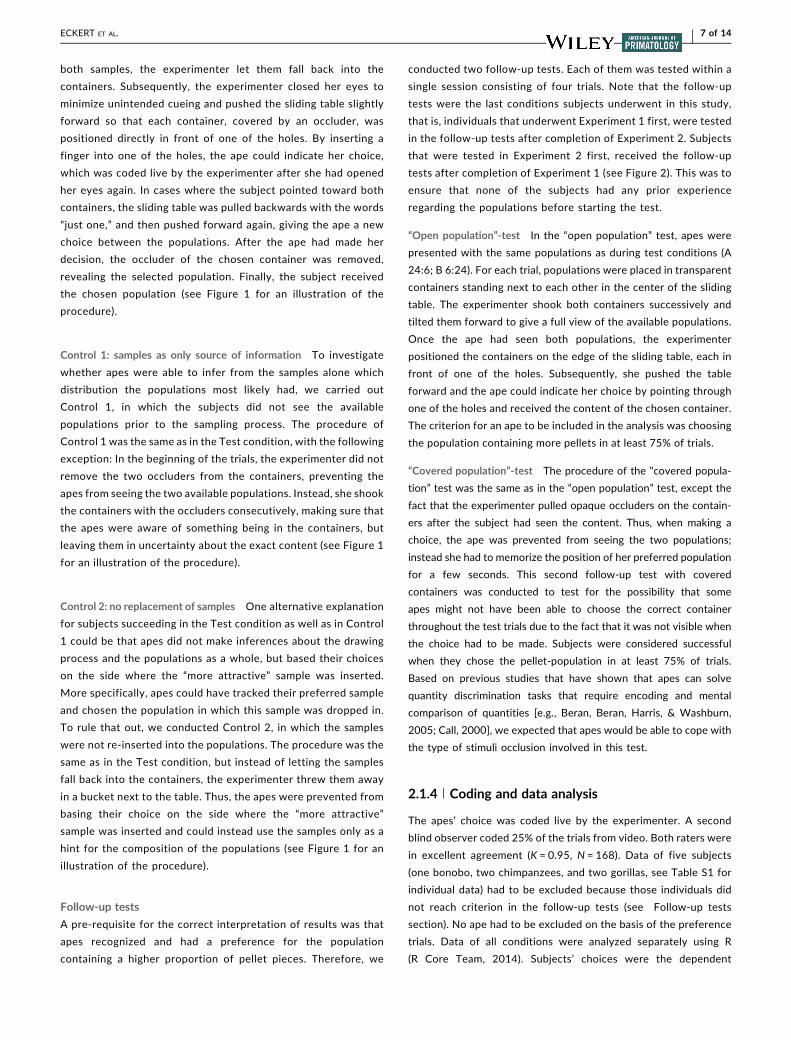
FIGURE 2 Schematic visualization of study design. Fifteen subjects were tested in the first order of conditions, starting with Experiment 1through to Experiment 2. Eleven subjects were tested in the second order, starting with Experiment 2 through to Experiment 1. Aftercompletion of both experiments, subjects proceeded to the follow-up tests
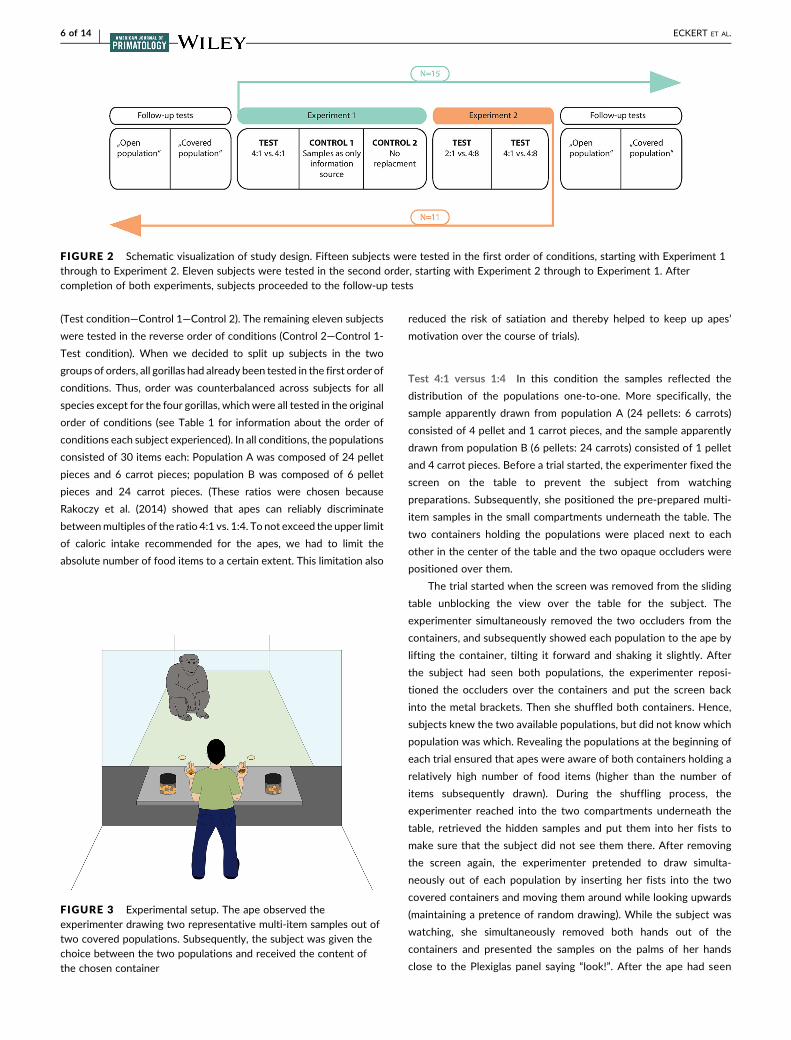
FIGURE 3 Experimental setup. The ape observed theexperimenter drawing two representative multi-item samples out oftwo covered populations. Subsequently, the subject was given thechoice between the two populations and received the content ofthe chosen container
6 of 14 | ECKERT ET AL.
both samples, the experimenter let them fall back into the
containers. Subsequently, the experimenter closed her eyes to
minimize unintended cueing and pushed the sliding table slightly
forward so that each container, covered by an occluder, was
positioned directly in front of one of the holes. By inserting a
finger into one of the holes, the ape could indicate her choice,
which was coded live by the experimenter after she had opened
her eyes again. In cases where the subject pointed toward both
containers, the sliding table was pulled backwards with the words
“just one,” and then pushed forward again, giving the ape a new
choice between the populations. After the ape had made her
decision, the occluder of the chosen container was removed,
revealing the selected population. Finally, the subject received
the chosen population (see Figure 1 for an illustration of the
procedure).
Control 1: samples as only source of information To investigate
whether apes were able to infer from the samples alone which
distribution the populations most likely had, we carried out
Control 1, in which the subjects did not see the available
populations prior to the sampling process. The procedure of
Control 1 was the same as in the Test condition, with the following
exception: In the beginning of the trials, the experimenter did not
remove the two occluders from the containers, preventing the
apes from seeing the two available populations. Instead, she shook
the containers with the occluders consecutively, making sure that
the apes were aware of something being in the containers, but
leaving them in uncertainty about the exact content (see Figure 1
for an illustration of the procedure).
Control 2: no replacement of samples One alternative explanation
for subjects succeeding in the Test condition as well as in Control
1 could be that apes did not make inferences about the drawing
process and the populations as a whole, but based their choices
on the side where the “more attractive” sample was inserted.
More specifically, apes could have tracked their preferred sample
and chosen the population in which this sample was dropped in.
To rule that out, we conducted Control 2, in which the samples
were not re-inserted into the populations. The procedure was the
same as in the Test condition, but instead of letting the samples
fall back into the containers, the experimenter threw them away
in a bucket next to the table. Thus, the apes were prevented from
basing their choice on the side where the “more attractive”
sample was inserted and could instead use the samples only as a
hint for the composition of the populations (see Figure 1 for an
illustration of the procedure).
Follow-up tests
A pre-requisite for the correct interpretation of results was that
apes recognized and had a preference for the population
containing a higher proportion of pellet pieces. Therefore, we
conducted two follow-up tests. Each of them was tested within a
single session consisting of four trials. Note that the follow-up
tests were the last conditions subjects underwent in this study,
that is, individuals that underwent Experiment 1 first, were tested
in the follow-up tests after completion of Experiment 2. Subjects
that were tested in Experiment 2 first, received the follow-up
tests after completion of Experiment 1 (see Figure 2). This was to
ensure that none of the subjects had any prior experience
regarding the populations before starting the test.
“Open population”-test In the “open population” test, apes were
presented with the same populations as during test conditions (A
24:6; B 6:24). For each trial, populations were placed in transparent
containers standing next to each other in the center of the sliding
table. The experimenter shook both containers successively and
tilted them forward to give a full view of the available populations.
Once the ape had seen both populations, the experimenter
positioned the containers on the edge of the sliding table, each in
front of one of the holes. Subsequently, she pushed the table
forward and the ape could indicate her choice by pointing through
one of the holes and received the content of the chosen container.
The criterion for an ape to be included in the analysis was choosing
the population containing more pellets in at least 75% of trials.
“Covered population”-test The procedure of the “covered popula-
tion” test was the same as in the “open population” test, except the
fact that the experimenter pulled opaque occluders on the contain-
ers after the subject had seen the content. Thus, when making a
choice, the ape was prevented from seeing the two populations;
instead she had to memorize the position of her preferred population
for a few seconds. This second follow-up test with covered
containers was conducted to test for the possibility that some
apes might not have been able to choose the correct container
throughout the test trials due to the fact that it was not visible when
the choice had to be made. Subjects were considered successful
when they chose the pellet-population in at least 75% of trials.
Based on previous studies that have shown that apes can solve
quantity discrimination tasks that require encoding and mental
comparison of quantities [e.g., Beran, Beran, Harris, & Washburn,
2005; Call, 2000], we expected that apes would be able to cope with
the type of stimuli occlusion involved in this test.
2.1.4 | Coding and data analysis
The apes’ choice was coded live by the experimenter. A second
blind observer coded 25% of the trials from video. Both raters were
in excellent agreement (K = 0.95, N = 168). Data of five subjects
(one bonobo, two chimpanzees, and two gorillas, see Table S1 for
individual data) had to be excluded because those individuals did
not reach criterion in the follow-up tests (see Follow-up tests
section). No ape had to be excluded on the basis of the preference
trials. Data of all conditions were analyzed separately using R
(R Core Team, 2014). Subjects’ choices were the dependent
ECKERT ET AL. | 7 of 14

measureandweredefinedas “correct” if thechosencontainercontained
the population with the more favorable ratio of pellets to carrots (24:6).
The apes’ overall performance (percent correct across trials) was tested
against chance level using a two-tailed one-sample t-test (R function t-
test). The effect sizeswereobtained applying thepackage “lsr” (Navarro,
2015). In addition, we tested apes’ first trial performance against chance
level using an exact binomial test (R function binom.test) to detect
potential learning effects. In order to testwhether performance differed
between species we used a one-wayANOVA (R function aov). This was
justified as residuals were normally distributed and homogenous as
verifiedbyvisual inspectionof residuals plottedagainst fitted values and
qqplot. For Tukey's post hoc test we used the R function TukeyHSD.
2.2 | RESULTS AND DISCUSSION
2.2.1 | Test 4:1 versus 1:4
Apes as a group chose the more favorable population on average in
72% of trials (see Figure 4 and supplementary material Table S1 for
individual data), significantly more often than predicted by chance (t
(20) = 6.12, p < 0.001, 95%CI [0.64, 0.79], N = 21; Cohen's d = 1.34).
This pattern was also visible in the first trial performance (Mean = 71
%; Binomial test: p = 0.04, N = 21; Cohen's g = 0.43). Hence, the apes’
performance seems to reflect an intuitive capacity rather than a
learning effect. We detected no difference between species (ANOVA:
F (3, 17) = 0.2, df = 3, p = 0.895). These results suggest that all tested
species of great apes were able to intuitively use the information
provided by the samples to receive the preferred population, therefore
giving a first hint toward apes being able to reason from samples to
populations.
2.2.2 | Control 1: samples as only source ofinformation
Apes as a group chose the more favorable population on average in
69% of trials (see Figure 4 and supplementary material Table S1 for
individual data), which is significantly above chance level (t (20) = 5.20,
p < 0.001, 95%CI [0.62, 0.77],N = 21; Cohen's d = 1.13). However, this
pattern was not found considering only the performance in the first
trial (Mean = 52%; Binomial test: p = 0.5, N = 21). This is perhaps best
explained by insecurity about the available populations. Control 1 was
the only condition in which subjects did not know the two possible
answers (i.e., the two available populations) before making their
decision. Hence, in the very first trial they could not be sure whether
both populations were of the same size or whether, for example, the
population associated with the “worse” sample contained many more
items than the population from which the “better” sample was drawn.
Potentially, apes had to experience during the first trial that, even
though they had not seen the containers’ content, there were two
different populations of food items with the same absolute quantity.
The first trial data suggest that subjects did not necessarily expect the
populations to be the same as in other conditions, making it unlikely
that subjects had learned and remembered the composition of the
populations during the previous session(s). We detected no difference
between species (ANOVA: F (3, 17) = 0.99, df = 3, p = 0.421). In sum,
these results show that the information provided by the samples was
sufficient for the apes to infer about the distribution within the
populations.
2.2.3 | Control 2: no replacement of samples
Apes as a group chose the more favorable population on average in
66 % of trials (see Figure 4 supplementary material Table S1 for
individual data), which is significantly more often than expected by
chance (t (20) = 4.97, p < 0.001, 95%CI [0.59, 0.73], N = 21; Cohen's
d = 1.08). This pattern was also reflected in the first trial performance
(Mean = 76%; Binomial test: p = 0.01, N = 21; Cohen's g = 0.52) and
thus cannot be due to learning. In this condition we detected
differences between species (ANOVA: F (3, 17) = 4.88, df = 3, p = 0.01,
R2= 0.46). Tukeymultiple comparison of means revealed that bonobos
performed significantly worse than gorillas (Mean bonobos = 53%,
N = 5;Mean gorillas = 88%,N = 2, p = 0.015). However, considering the
fact that we could only include the data of two gorillas (compared to
five bonobos) in the final analysis, it is questionable whether this result
truly reflects differences between species, or rather random variation
or individual differences between subjects. The findings of Control 2
rule out the possibility that the apes solved the task by means of a
simple heuristic: “choose the container where the more attractive
sample was inserted.” Instead, apes seem to have considered the
drawing process and inferred about the population as a whole.
In sum, the results of Experiment 1 show that all tested species
of great apes were able to use information provided by multi-item
samples to track their preferred populations, and they did so even
when they did not know the composition of the populations
beforehand (Control 1) and when samples were not replaced after
drawing (Control 2). These findings suggest that great apes might
engage in intuitive statistical inferences from samples to popula-
tions in a comparable way human infants do (Xu & Garcia 2008;
Denison et al., 2013). However, an alternative explanation for
these results could be that apes simply associated the preferable
sample (i.e., the sample containing absolutely more pellets), with
FIGURE 4 Mean proportion of trials (with standard errors) inwhich subjects chose the more favorable population. Dasheddepicts chance level (50%)
8 of 14 | ECKERT ET AL.

the container that it was drawn from. To address this alternative
explanation, we tested subjects in Experiment 2 with samples in which
absolute and relative frequencies of pellets were disentangled.
3 | EXPERIMENT 2: DO APES TAKE INTOACCOUNT RELATIVE, RATHER THANABSOLUTE FREQUENCIES?
Although results of Experiment 1 tentatively suggest that apes were
able to reason from multi-item samples to populations, it is an open
question to what extent the subjects relied on absolute quantities
rather than on proportions to solve the task. More specifically, in all
conditions of Experiment 1, absolute and relative frequencies were
confounded within the samples, that is, the sample which contained
the higher proportion of preferred food items than the alternative (4:1
vs. 1:4), also contained the higher absolute quantity of preferred food
items (4 vs. 1). Thus, Experiment 1 alone cannot tease apart whether
apes truly compared the proportion of pellets to carrots in both
samples (4:1 vs. 1:4), or if they based their choice on the absolute
amount of pellets (4 vs. 1) and used the heuristic: “choose the container
where more pellets were drawn from.” To address this question we
tested apes in Experiment 2 in two further conditions. In both of them,
absolute and relative frequencies within the samples were arranged in
such a way that apes could not perform above chance level if they
focused on absolute numbers only (see Figure 1 for an illustration of
the Test conditions).
3.1 | Methods
3.1.1 | Subjects
The same 26 individuals as in Experiment 1 participated in this
experiment. One additional chimpanzee was tested but excluded from
data analysis as he did not complete all sessions due to a lack of
motivation.
3.1.2 | Materials
We used the same materials as in Experiment 1 (see Figure 3 for an
illustration of the experimental setup).
3.1.3 | Design and procedure
The general procedurewas the same as in Experiment 1. To tease apart
whether apes truly compared the proportion of preferred to neutral
food items in both samples, or if they based their choice on the
absolute amount of preferred food, we tested apes in two conditions
with varying sample composition. Again, each condition consisted of
12 test trials, divided into three sessions. Prior to the test trials, two
preference trials with single pellet and carrot pieces were carried out.
Thus, each session consisted of two preference trials and four test
trials.
Familiarization
Each subject that had not experienced Experiment 1 before
received one session with six trials of familiarization. The
procedure of the familiarization phase was exactly as described
for Experiment 1.
Preference trials
The procedure of the preference trials was the same as in
Experiment 1.
Test trials
All apes participated in two Test conditions. To control for a
possible effect of order, 15 subjects were tested in the first order
of conditions, starting with the 2:1 versus 4:8 test, through to the
4:1 versus 4:8 test. The remaining eleven subjects were tested in
the reverse order of conditions (see Table 1 for information about
the order of conditions each subject experienced). Again, in all
conditions the populations consisted of 30 items each: Popula-
tion A was composed of 24 pellet pieces and 6 carrot pieces;
population B was composed of 6 pellet pieces and 24 carrot
pieces
Test 2:1 versus 4:8 The procedure was the same as described for
the Test condition of Experiment 1. However, the composition of
the samples was varied in such a way that choosing the container
from which the sample with the higher absolute number of pellets
was drawn, resulted in receiving the less attractive population. In
particular, the sample apparently drawn from population A (24
pellets: 6 carrots) consisted of 2 pellet and 1 carrot pieces, and
the sample apparently drawn from population B (6 pellets: 24
carrots) consisted of 4 pellet and 8 carrot pieces. Thus, even
though sample B contained double the amount of pellets
compared to sample A, the proportion of pellets to carrots was
more favorable in sample A. If apes’ choice was based on absolute
quantities, we expected them to choose the “wrong“ container
more often than the “correct” one. If they, however, took into
account the proportion of pellets to carrots, we expected them to
choose the “correct” container more often than the foil (see
Figure 1 for an illustration of the procedure).
6.4.2 | Test 4:1 versus 4:8
Again, the procedure was the same as described for the Test condition
of Experiment 1. However, here the composition of the samples was
varied in away that both samples contained the same absolute number
of pellets. More specifically, the sample apparently drawn from
population A (24 pellets: 6 carrots) consisted of 4 pellet and 1 carrot
pieces, and the sample apparently drawn from population B (6 pellets:
24 carrots) consisted of 4 pellet and 8 carrot pieces. Assuming that
apes based their choice on absolute quantities only, we expected them
to choose both containers at similar rates, as the absolute number of
ECKERT ET AL. | 9 of 14

pellets did not provide any conclusive information. If they instead
reasoned about the proportion of pellets to carrots, we predicted that
they chose the correct container more often than expected by chance
(see Figure 1 for an illustration of the procedure).
Follow-up tests
Those individuals that underwent Experiment 2 after Experiment 1
received the two follow-up tests. The procedure was exactly the same
as described for Experiment 1.
3.1.4 | Coding and data analysis
The apes’ choice was coded live by the experimenter. A second blind
observer coded 25% of the trials from video. Both raters were in
excellent agreement (K = 0.95, N = 120). Data of five subjects (one
bonobo, two chimpanzees, and two gorillas, see Table S1 for individual
data) had to be excluded because those individuals did not reach
criterion in the follow-up tests. No further ape had to be excluded on
the basis of the preference trials. Data analysis was the same as
described for Experiment 1.
3.2 | Results and discussion
3.2.1 | Test 2:1 versus 4:8
Apes as a group chose the more favorable population on average in
44% of trials (see Figure 4 and supplementary material Table S1 for
individual data). Though this pattern is not different from what was
expected by chance (t (20) = −1.84, p = 0.08, 95%CI [0.36, 0.51],
N = 21), it indicates a (non-significant) trend such that apes tended to
choose the less favorable population more often than the more
favorable one. We detected no differences between species
(ANOVA: F (3, 17) = 1.66, df = 3, p = 0.213). This pattern was also
reflected in the first trial performance (Mean = 47%; Binomial test:
p = 1, N = 21). Hence, all tested species of great apes were unable to
extrapolate from samples to populations, when the absolute number
of preferred food-items was misleading. Instead, they tended to
choose the population where the sample with the higher amount of
preferred food-items was drawn from. This finding gives a first hint
that the strategy applied by the apes might have been a comparison
of absolute numbers between samples, rather than an extrapolation
of proportions.
3.2.2 | Test 4:1 versus 4:8
Apes as a group chose the more favorable population on average in
51% of trials (see Figure 4 and supplementary material Table S1 for
individual data), which is not different from chance level (t (20) = 0.37,
p = 0.715, 95%CI [0.44, 0.58], N = 21). We detected no differences
between species (ANOVA: F (3, 17) = 1.35, df = 3, p = 0.292). The same
pattern was found considering only the performance in the first trial
(Mean = 43%; Binomial test: p = 0.664, N = 21). This implies that apes
failed to use the information provided by the samples to reason about
the populations and strengthens the theory that apesmight have relied
on absolute, rather than relative frequencies.
4 | GENERAL DISCUSSION
In Experiment 1, we investigatedwhether great apes are able to reason
from multi-item samples to populations of food items. Results showed
that great apes did extrapolate from samples to populations,
irrespective of whether they knew the composition of the available
populations beforehand or not (Control 1) and if samples were
replaced after drawing or not (Control 2). The results of Control 2 are
especially revealing, as they rule out the possibility of a simple
heuristic: “choose the container where the more attractive sample was
inserted”. Instead, apes seem to have considered the drawing process
and inferred about the population as a whole from the first trial
onwards. This implies that apes seem to possess similar kinds of
capacities as found in human infants (Xu &Garcia, 2008; Denison et al.,
2013). In fact, our findings even go one step further than those of the
two existing studies that tested infants’ ability to reason from sample
to population: While the apes in our study drew inferences from
samples to populations in an active choice paradigm, the human infants
in the above mentioned studies were only tested using the VOE
looking-time paradigm. There is some evidence that findings of studies
using the VOE looking time paradigm dissociate from findings of
studies using active choice measures [e.g., Ahmed & Ruffman, 1998;
Shinskey & Munakata, 2005; Charles & Rivera, 2009]. This is probably
due to the fact that a subject that is able to perceive something is not
necessarily able to act accordingly. As it is currently unknown whether
human infants would succeed in an active choice paradigm testing for
their capacities to reason from sample to population, we conclude that
great apes’ intuitive statistical abilities in this regard seem to be at least
at a comparable level as those of young human infants. However,
based on Experiment 1 alone it is impossible to rule out that apes used
alternative strategies based on the absolute number of preferred food
items. The aim of Experiment 2, therefore, was to investigate whether
great apes can successfully reason from samples to populations when
prevented from relying on absolute quantities. Apes performed at
chance level both when the sample drawn from the more favorable
population contained less preferred food items than the sample drawn
from the less favorable population, and when both samples contained
the same number of preferred food items. Thus, apes did not rely on
inferences from samples to populations in this experiment. There are at
least two interpretations for these findings.
One interpretation is that apes’ failure in Experiment 2 reflects
true limitations of their cognitive competences. The most obvious
difference between Experiment 1 and 2 is that only in the latter
subjects could not rely on absolute numbers of preferred food items.
Hence, one could conclude that apes are able to reason and draw
inferences about absolute, but not relative frequencies. Assuming that
apes simply compared the absolute quantity of pellets in both samples
and chose the population from which more pellets were drawn, we
expected the following pattern of results: When the number of pellets
10 of 14 | ECKERT ET AL.

in the samples was inconclusive (because it was the same in both
samples), apes should have chosen randomly between both
populations. When the number of pellets was misleading, that is,
higher in the sample drawn from the non-preferred population, apes
should have chosen the “wrong” population more often. While apes
indeed chose randomly between populations when the number of
pellets was the same in both samples, they also did so when the
number of pellets was misleading. Yet, it should be noted that even
though there was no significant effect in this condition (misleading
number of pellets in both samples), apes nevertheless revealed a
non-significant tendency to choose the more favorable population
less often than the more favorable one. Consequently, it cannot be
ruled out that apes mainly relied on absolute quantities in this
experiment.
This opens up an alternative explanation for the apes’ success in
Experiment 1: Subjects might have not drawn any inference from
sample to population, but instead simply associated the more
favorable sample (i.e., the one containing absolutely more preferred
items than the other) with the container it was drawn from, since it
was temporally and spatially most closely associated with that
container. In other words, apes might have followed a heuristic like
“chose the container where you saw something good (i.e., more
pellets) coming from.” Future studies need to determine whether
subjects truly relied on associating containers with “better” and
“worse,” or if they in fact perceived the samples as a representation
of populations. One possible way to disentangle the two explan-
ations would entail presenting apes with two opaque containers
filled with two populations of food items (similar to the current
study). Crucially, the experimenter would already have the samples
in her hands (i.e., pellets and carrots in 4:1 distribution in one hand,
1:4 in the other). She would then show the contents of her hands to
the ape, insert her hands into the containers and remove them again,
showing the same items as before. Subsequently, she would discard
the samples and give the apes the choice between the two
containers. If apes merely associated the two containers with
“good” or “bad” according to the distribution they had seen on each
side, we would expect them to choose the side where the sample
with absolutely more pellets was shown. In contrast, if they
recognized a randomly drawn sample as representation of the
population, they should pick both containers equally often since no
drawing took place, and therefore, no inference can be made.
Recall that Rakoczy et al. (2014) showed that great apes did take
proportions into account when reasoning the other way around, that is
from populations to samples, ruling out that subjects used a simple
association mechanism to solve the task. If our results reflected true
limitations in apes’ cognitive competences, they would, therefore,
suggest that nonhuman primates’ statistical abilities could be
unidirectional. This would question whether apes have a true
understanding of drawing processes and the relation between
populations and samples.
A different interpretation for the negative findings of Experi-
ment 2 is that they may merely reflect performance limitations
imposed by the task's cognitive demands, which may have masked
apes’ true competence. One of these task demands could be the
memory component required by our procedure. At the exact
moment when apes were asked to make a choice, the information
necessary to do so (i.e., the samples) was not available anymore.
Instead, apes had to memorize this information for a few seconds
and recall it to choose between the two populations. Note that this
was not the case in Rakoczy et al. (2014), where subjects were still
able to see the populations during their choice. Even though it may
seem trivial to remember information for a few seconds, results of
the follow-up test with covered populations showed that this was
indeed a crucial factor for some of the subjects: Four of the 26
subjects were not able to choose the more attractive population
when it was covered while the decision was made, even though
they showed a clear preference for that population during the
preference test with open populations. Furthermore, other studies
have shown the importance of working memory in different
problem solving tasks. For instance, in Seed, Seddon, Greene, and
Call (2012) four chimpanzees solved a tool-use task requiring
causal inferences when the time-span over which information had
to be memorized was minimized. By contrast, in a related previous
study (Povinelli, 2000) that involved a higher working memory load,
all chimpanzees failed to do so. Although working memory
demands, potentially in combination with lack of attention, may
have influenced the apes’ performance to a certain extent, working
memory alone cannot fully explain the fact that apes were not able
to use proportional information in this experiment. Recall that
those subjects who had difficulties remembering the populations’
position were excluded from the analysis and did therefore not bias
the results in a negative way. Moreover, Experiment 1 also
required a memory component, and still subjects succeeded.
Another factor that could have made this task more difficult
as compared to Rakoczy et al. (2014) is the type of inferences
required. Retrospective inferences seem to be harder than
prospective ones (Völter & Call, 2017). This means that going
from samples back to populations (retrospective) may be more
demanding than going from populations forward to samples
(prospective). The majority of knowledge that we have about the
origin and development of intuitive statistics derives from the
extensive study of pre-verbal infants. In the last decades,
numerous such studies have tested infants both for their abilities
in reasoning from populations to samples as well as from samples
to populations. As mentioned above, to our knowledge there is no
study testing pre-verbal infants for their ability to reason from
samples to populations in an active choice measure. This type of
methodology was, so far, only used in studies investigating
infants’ capacity to reason from population to sample (Feigenson
et al., 2002; Denison & Xu, 2010b; Denison & Xu, 2014). In these
studies, infants were allowed to choose between the covered
samples of two populations of preferred and non-preferred items
in different ratios. Control conditions disentangled absolute and
relative frequencies with the result that infants indeed used
proportional information, not a comparison of absolute quanti-
ties, to retrieve their preferred item. The two existing studies
ECKERT ET AL. | 11 of 14
investigating the reverse ability, that is, reasoning from samples
to populations (Xu & Garcia, 2008; Denison et al., 2013), both
used a VOE looking-time paradigm, a methodology that is less
comparable with the methodology applied for great apes.
Moreover, in both above-mentioned studies probability was
confounded with quantity, and no control condition tested for the
fact that infants could have used the shortcut of focusing on
absolute quantities only. As a consequence, it remains unclear
whether reasoning from samples to populations represents a
cognitively more challenging task than the other way around. It
would be of great interest to fill that gap of knowledge by
applying an active choice paradigm to investigate pre-verbal
infants’ ability to reason from samples to populations, including a
control condition for absolute versus relative information.
A third task demand that may havemasked apes’ true competence
in Experiment 2 is the poorer discriminability of the samples as
compared to the samples used in Experiment 1. As an index for
discriminability we calculated the ratio of ratios (hereafter: ROR) of the
two samples for each of the conditions in the following way [following
Drucker, Rossa, & Brannon, 2016]:
Ratio of pellets to carrots in the sample drawn from the preferred populationRatio of pellets to carrots in the sample drawn from the non‐preferred population
In all conditions of Experiment 1, the ROR was (4/1)/(1/
4) = 16 (in Rakoczy et al., 2014 the ROR was ≥16 in all conditions).
In Experiment 2, the ROR was (2/1)/(4/8) = 4 in the 2:1 versus 4:8
test, and (4/1)/(4/8) = 8 in the 4:1 versus 4:8 test. Thus, in both
conditions of Experiment 2, the ROR was less than or equal to half
the one used in Experiment 1. This discrepancy was caused by our
methodological constraints that prevented us from using larger
RORs. More specifically, a larger ROR would have required larger
samples and thus larger populations. As the apes received the
“whole” chosen population as reinforcement we had to minimize
the number of food items within the populations for the purpose
of not exceeding their allowed daily caloric intake. Moreover,
given that the food items were kept in the experimenters fist,
larger samples would have required a different sampling method
than the one applied here. As a consequence, in this study it was
not possible to disentangle absolute and relative information with
the same ROR as in Experiment 1. Recent research suggests that
indeed the magnitude of difference between two proportions is
crucial for non-human primates to discriminate probabilities.
Hanus & Call (2014) presented chimpanzees with two trays, each
of them with a different ratio of hidden food items to potential
hiding locations and therefore a different likelihood of finding
food. This study revealed that subjects’ performance was
influenced by the relative difference between the two probabili-
ties as soon as a certain threshold thereof was reached.
Moreover, the apes relied on the ratio between probabilities,
even in conditions where one tray depicted an absolute safe
option—a probability of finding food of 100%. This study
emphasizes the importance of the magnitude of difference
between the two ratios to be discriminated, rather than the
magnitude of difference within the single ratios.
With regard to the present study this means the following:
Although the quantities within one sample were presumably easy to
discriminate [for reviews about quantity discrimination see example,
Feigenson, Dehaene, & Spelke, 2004; Nieder, 2005], it was probably
the ratio between the ratios of both samples that influenced the
decision of the apes and it could well be that the present RORs were
simply below the threshold for discriminating two ratios and thus failed
to constitute notable differences. In a study using a touch screen setup
(Drucker et al., 2016) rhesus macaques (Macaca mulatta) were
presented with arrays containing different ratios of positive to
negative stimuli. The monkeys learned to choose those arrays with
the greater ratio of positive to negative stimuli and were able to
generalize to novel ratios. Similarly, as in the previously mentioned
study with chimpanzees (Hanus & Call, 2014), the performance was
directly influenced by the magnitude of difference between the two
ratios to be discriminated. Interestingly, just as human infants (McCrink
& Wynn, 2007), the two macaques tested were able to discriminate a
ROR of 2, which is much lower than those used in our experiments.
However, given the fact that those subjects received extensive training
in such discrimination tasks before the actual test, it remains unclear to
which extent those methods are comparable to the ones used here
with apes.
5 | CONCLUSIONS
The aim of the current study was to investigate whether apes can use
samples of items to infer the composition of the population from
where the samples came from. While apes performed competently
when the samples from the more favorable population were more
attractive than the samples from the less favorable population not only
in terms of relative but also in terms of absolute frequencies of
preferred over non-preferred food items, they failed to do so when
absolute and relative frequencies were disentangled. The present
study, therefore, cannot determine whether non-human primates
engage in intuitive statistical inferences from randomly drawn samples
to populations in a comparable way human infants have recently been
found to do (Denison et al., 2013; Xu & Garcia, 2008). It is an open
question for future research whether these limitations in apes’
performance reflect true limits of cognitive competence or merely
performance limitations due to accessory task demands.
ACKNOWLEDGMENTS
The work reported in this paper was supported by a research grant of
theGerman Science FoundationDFG (grant # RA2155/3-1) toHannes
Rakoczy and Josep Call. We would like to thank Hanna Petschauer,
Johannes Grossmann, Colleen Stephens, Julia Fischer, and all Zoo
keepers involved for their help at various stages of this project. Thank
you to Chloé Piot for preparing the figures and Ronja Runge for
reliability coding.
12 of 14 | ECKERT ET AL.

CONFLICT OF INTEREST
None.
ORCID
Johanna Eckert http://orcid.org/0000-0001-8161-0828
REFERENCES
Ahmed, A., & Ruffman, T. (1998). Why do infants make A not B errors in asearch task, yet show memory for the location of hidden objects in a
nonsearch task? Developmental Psychology, 34(3), 441–453.Barnard, A. M., Hughes, K. D., & Gerhardt, R. R., DiVincenti, L., Bovee, J. M.,
& Cantlon, J. F. (2013). Inherently analog quantity representations inolive baboons (Papio anubis). Frontiers in Psychology, 4, 253.
Benson-Amram, S., Heinen, V. K., Dryer, S. L., & Holekamp, K. E. (2011).Numerical assessment and individual call discrimination by wild spottedhyaenas, Crocuta Crotua. Animal Behaviour, 82, 743–752.
Beran, M. J., Beran, M. M., Harris, E. H., & Washburn, D. A. (2005). Ordinaljudgments and summation of nonvisible sets of food items by two
chimpanzees (Pan troglodytes) and a rhesus macaque (Macaca mulatta).Journal of Experimental Psychology: Animal Behavior Processes, 31,351–362.
Beran, M. J., Evans, T. A., Leighty, K. A., Harris, E. H., & Rice, D. (2008).Summation and quantity judgments of sequentially presented sets by
capuchin monkeys (Cebus apella). American Journal of Primatology, 70(2),191–194.
Beran, M. J., McIntyre, J. M., Garland, A., & Evans, T. A. (2013).What countsfor 'counting'? Chimpanzees, Pan troglodytes, respond appropriately torelevant and irrelevant information in a quantity judgment task. Animal
Behaviour, 85(5), 987–993.Beran, M. J., & Parrish, A. E. (2016). Capuchin monkeys (Cebus apella) treat
small and large numbers of items similarly during a relative quantityjudgment task. Psychonomic Bulletin and Review, 23(4), 1206–1213.
Boysen, S. T., & Berntson, G. G. (1989). Numerical competence in a
chimpanzee (Pan troglodytes). Journal of Comparative Psychology, 103(1),23–31.
Call, J. (2000). Estimating and operating on discrete quantities in orangutans(Pongo pygmaeus). Journal of Comparative Psychology, 114(2), 136–147.
Charles, E. P., & Rivera, S. M. (2009). Object permanence and method ofdisappearance: Looking measures further contradict reaching mea-sures. Developmental Science, 12(6), 991–1006.
Cosmides, L., & Tooby, J. (1996). Are humans good intuitive statisticiansafter all? Rethinking some conclusions from the literature on judgment
under uncertainty. Cognition, 58(1), 1–73.Dacke, M., & Srinivasan, M. V. (2008). Evidence for counting in insects.
Animal Cognition, 11(4), 683–689.Davis, H. (1984). Discrimination of the number three by a raccoon. Animal
Learning & Behavior, 12, 409–413.Denison, S., Reed, C., & Xu, F. (2013). The emergence of probabilistic
reasoning in very young infants: Evidence from 4.5- and 6-month-olds.Developmental Psychology, 49(2), 243–249.
Denison, S., Trikutam, P., & Xu, F. (2014). Probability versus representa-tiveness in infancy: Can infants use naive physics to adjust population
base rates in probabilistic inference? Developmental Psychology, 50(8),2009–2019.
Denison, S., & Xu, F. (2010a). Integrating physical constraints in statisticalinference by 11-month-old infants. Cognitive Science, 34(5), 885–908.
Denison, S., & Xu, F. (2010b). Twelve- to 14-month-old infants can predictsingle-event probability with large set sizes. Developmental Science,13(5), 798–803.
Denison, S., & Xu, F. (2012). Probabilistic inference in human infants.Advances in Child Development and Behavior, 43, 27–58.
Denison, S., & Xu, F. (2014). The origins of probabilistic inference in humaninfants. Cognition, 130(3), 335–347.
Drucker, C. B., Rossa, M. A., & Brannon, E. M. (2016). Comparison ofdiscrete ratios by rhesus macaques (Macaca mulatta). Animal Cognition,19(1), 75–89.
Farnsworth, G. L., & Smolinski, J. L. (2006). Numerical discrimination bywildnorthern mockingbirds. Condor, 108(4), 953–957.
Feigenson, L., Carey, S., & Hauser, M. (2002). The representationsunderlying infants' choice of more: Object files versus analogmagnitudes. Psychological Science, 13(2), 150–156.
Feigenson, L., Dehaene, S., & Spelke, E. (2004). Core systems of number.Trends in Cognitive Sciences, 8(7), 307–314.
Geary, D. C., Berch, B. B., & Mann Koepke, K. (2015). The evolution ofnumber systems. In D. C. Geary, D. B. Berch, & K. M. Koepke (Eds.),
Evolutionary origins and early development of number processing (pp.
335–353). San Diego, CA: Academic Press.Hamilton I. M., (2010). Foraging theory. In D. F. Westneat, & C. W. Fox,
(Eds.), Evolutionary behavioral ecology (pp. 177–193). New York: Oxford
University Press.Hanus, D., & Call, J. (2007). Discrete quantity judgments in the great apes
(Pan paniscus, Pan troglodytes, Gorilla gorilla, Pongo pygmaeus): The effectof presenting whole sets versus item-by-item. Journal of ComparativePsychology, 121(3), 241–249.
Hanus, D., & Call, J. (2014). When maths trumps logic: Probabilisticjudgements in chimpanzees. Biological Letters, 10, 20140892. https://doi.org/10.1098/rsbl.2014.0892
Holland, P. W. (1986). Statistics and causal inference. Journal of theAmerican Statistical Association, 81(396), 945–960.
Hunt, S., Low, J., & Burns, K. C. (2008). Adaptive numerical competency in afood-hoarding songbird. Proceedings of the Royal Society B: Biological
Sciences, 275(1649), 2373–2379.McComb, K., Packer, C., & Pusey, A. (1994). Roaring and numerical
assessment in contests between groups of female lions, Panthera leo.Animal Behaviour, 47(2), 379–387.
McCrink, K., & Wynn, K. (2007). Ratio abstraction by 6-month-old infants.Psychological Science, 18, 740–745. https://doi.org/10.1111/j.1467–9280.2007.01969.x
Navarro D. J. (2015). Learning statistics with R: A tutorial for psychologystudents and other beginners (Version 0.5). Adelaide, Australia: Universityof Adelaide.
Nieder, A. (2005). Counting on neurons: The neurobiology of numerical
competence. Nature Reviews Neuroscience, 6(3), 177–190.Perdue, B. M., Talbot, C. F., Stone, A. M., & Beran, M. J. (2012). Putting the
elephant back in the herd: Relative quantity judgments match those ofother species. Animal Cognition, 15, 955–961.
Piaget J., & Inhelder B. (1975). The origin of the idea of chance in children.
New York: Norton, (p. 251).Pisa, P., & Agrillo, C. (2009). Quantity discrimination in felines: A preliminary
investigation of the domestic cat (Felis silvestris catus). Journal ofEthology, 27(2), 289–293.
Potrich, D., Sovrano, V. A., Stancher, G., & Vallortigara, G. (2015). Quantity
discrimination by zebrafish (Danio rerio). Journal of ComparativePsychology, 129(4), 388–393.
Povinelli, D. J. (2000). Folk physics for apes: The chimpanzee's theory of howthe world works. Oxford University Press, Oxford: New York.
R Core Team, 2014. A language and environment for statistical computing.R Foundation for Statistical Computing, Vienna, Austria.
Rakoczy, H., Clüver, A., & Saucke, L., Stoffregen, N., Grabener, A.,Migura, J.,& Call, J. (2014). Apes are intuitive statisticians. Cognition, 131(1),
60–68.
Reznikova, Z., & Ryabko, B. (2011). Numerical competence in animals, withan insight from ants. Behaviour, 148(4), 405–434.
ECKERT ET AL. | 13 of 14

Rugani, R., Cavazzana, A., Vallortigara, G., & Regolin, L. (2013). One, two,three, four, or is there something more? Numerical discrimination inday-old domestic chicks. Animal Cognition, 16(4), 557–564.
Seed, A., Seddon, E., Greene, B., & Call, J. (2012). Chimpanzee 'folk physics':bringing failures into focus. Philosophical Transactions of the Royal Society BBiological Sciences, 367, 2743–2752. https://doi.org/10.1098/rstb.2012.0222
Shinskey, J. L., & Munakata, Y. (2005). Familiarity breeds searching —Infants reverse their novelty preferences when reaching for hiddenobjects. Psychological Science, 16(8), 596–600.
Skyrms B. (1975). Choice and chance: An introduction to inductive logic.Encino, CA: Dickenson Pub, (p. 220).
Tecwyn, E. C., Denison, S., Messer, E. J., & Buchsbaum, D. (2016). Intuitiveprobabilistic inference in capuchin monkeys. Animal Cognition, 130(3),335–347.
Téglás, E., Girotto, V., Gonzalez, M., & Bonatti, L. L. (2007). Intuitions ofprobabilities shape expectations about the future at 12 months and
beyond. Proceedings of the National Academy of Sciences USA, 104(48),19156–19159.
Téglás, E., Vul, E., Girotto, V., Gonzalez,M., Tenenbaum, J. B., &Bonatti, L. L.(2011). Pure reasoning in 12-month-old infants as probabilisticinference. Science, 332(6033), 1054–1059.
Tenenbaum, J. B., Griffiths, T. L., & Kemp, C. (2006). Theory-based Bayesianmodels of inductive learning and reasoning. Trends in Cognitive Sciences,10(7), 309–318.
Tversky, A., & Kahneman, D. (1974). Judgment under Uncertainty—Heuristics and biases. Science, 185(4157), 1124–1131.
Tversky, A., & Kahneman, D. (1981). The framing of decisions and thepsychology of choice. Science, 211(4481), 453–458.
Vonk, J., & Beran, M. J. (2012). Bears “count” too: Quantity estimation andcomparison in black bears, Ursus americanus. Animal Behaviour, 84,
231–238.
Völter, C. J., & Call, J. (2017). Causal and inferential reasoning inanimals. In G. M. Burghardt, I. M. Pepperberg, C. T. Snowdon, & T.
Zentall (Eds.), APA handbook of comparative psychology Vol 2:
Perception, learning, and cognition (pp. 643–671). US: AmericanPsychological Association.
Ward, C., & Smuts, B. B. (2007). Quantity-based judgments in the domesticdog (Canis lupus familiaris). Animal Cognition, 10(1), 71–80.
Wilson, M. L., Britton, N. F., & Franks, N. R. (2002). Chimpanzees and themathematics of battle. Proceedings of the Royal Society of London BBiological Sciences, 269, 1107–1112.
Xu, F., & Denison, S. (2009). Statistical inference and sensitivity to samplingin 11-month-old infants. Cognition, 112, 97–104.
Xu, F., & Garcia, V. (2008). Intuitive statistics by 8-month-old infants.Proceedings of the National Academy of Sciences USA, 105(13),5012–5015.
SUPPORTING INFORMATION
Additional Supporting Information may be found online in the
supporting information tab for this article.
How to cite this article: Eckert J, Rakoczy H, Call J. Are
great apes able to reason from multi-item samples to
populations of food items? Am J Primatol. 2017;79:e22693.
https://doi.org/10.1002/ajp.22693
14 of 14 | ECKERT ET AL.