Arctic river temperature dynamics in a changing climate
17
University of Birmingham Arctic river temperature dynamics in a changing climate Docherty, Catherine L.; Dugdale, Stephen J.; Milner, Alexander M.; Abermann, Jakob; Lund, Magnus; Hannah, David M. DOI: 10.1002/rra.3537 License: Creative Commons: Attribution (CC BY) Document Version Publisher's PDF, also known as Version of record Citation for published version (Harvard): Docherty, CL, Dugdale, SJ, Milner, AM, Abermann, J, Lund, M & Hannah, DM 2019, 'Arctic river temperature dynamics in a changing climate', River Research and Applications, vol. 35, no. 8, pp. 1212-1227. https://doi.org/10.1002/rra.3537 Link to publication on Research at Birmingham portal General rights Unless a licence is specified above, all rights (including copyright and moral rights) in this document are retained by the authors and/or the copyright holders. The express permission of the copyright holder must be obtained for any use of this material other than for purposes permitted by law. • Users may freely distribute the URL that is used to identify this publication. • Users may download and/or print one copy of the publication from the University of Birmingham research portal for the purpose of private study or non-commercial research. • User may use extracts from the document in line with the concept of ‘fair dealing’ under the Copyright, Designs and Patents Act 1988 (?) • Users may not further distribute the material nor use it for the purposes of commercial gain. Where a licence is displayed above, please note the terms and conditions of the licence govern your use of this document. When citing, please reference the published version. Take down policy While the University of Birmingham exercises care and attention in making items available there are rare occasions when an item has been uploaded in error or has been deemed to be commercially or otherwise sensitive. If you believe that this is the case for this document, please contact [email protected] providing details and we will remove access to the work immediately and investigate. Download date: 01. Mar. 2020
Transcript of Arctic river temperature dynamics in a changing climate
University of Birmingham
Arctic river temperature dynamics in a changingclimateDocherty, Catherine L.; Dugdale, Stephen J.; Milner, Alexander M.; Abermann, Jakob; Lund,Magnus; Hannah, David M.DOI:10.1002/rra.3537
License:Creative Commons: Attribution (CC BY)
Document VersionPublisher's PDF, also known as Version of record
Citation for published version (Harvard):Docherty, CL, Dugdale, SJ, Milner, AM, Abermann, J, Lund, M & Hannah, DM 2019, 'Arctic river temperaturedynamics in a changing climate', River Research and Applications, vol. 35, no. 8, pp. 1212-1227.https://doi.org/10.1002/rra.3537
Link to publication on Research at Birmingham portal
General rightsUnless a licence is specified above, all rights (including copyright and moral rights) in this document are retained by the authors and/or thecopyright holders. The express permission of the copyright holder must be obtained for any use of this material other than for purposespermitted by law.
•Users may freely distribute the URL that is used to identify this publication.•Users may download and/or print one copy of the publication from the University of Birmingham research portal for the purpose of privatestudy or non-commercial research.•User may use extracts from the document in line with the concept of ‘fair dealing’ under the Copyright, Designs and Patents Act 1988 (?)•Users may not further distribute the material nor use it for the purposes of commercial gain.
Where a licence is displayed above, please note the terms and conditions of the licence govern your use of this document.
When citing, please reference the published version.
Take down policyWhile the University of Birmingham exercises care and attention in making items available there are rare occasions when an item has beenuploaded in error or has been deemed to be commercially or otherwise sensitive.
If you believe that this is the case for this document, please contact [email protected] providing details and we will remove access tothe work immediately and investigate.
Download date: 01. Mar. 2020
Received: 9 April 2019 Revised: 9 August 2019 Accepted: 11 August 2019
DOI: 10.1002/rra.3537
S P E C I A L I S S U E P A P E R
Arctic river temperature dynamics in a changing climate
Catherine L. Docherty1,2 | Stephen J. Dugdale3 | Alexander M. Milner1,2,4 |
Jakob Abermann5,6 | Magnus Lund7 | David M. Hannah1
1School of Geography, Earth and
Environmental Science, University of
Birmingham, Birmingham, UK
2Department of Atmospheric Environment and
Aquatic Ecosystems, Institute of Mountain
Science, Shinshu University, Matsumoto, Japan
3School of Geography, University of
Nottingham, University Park, Nottingham, UK
4 Institute of Arctic Biology, University of
Alaska, Fairbanks, Alaska, USA
5Asiaq, Greenland Survey, Nuuk, Greenland
6Department of Geography and Regional
Science, University of Graz, HeinrichstraÃe
368010 Graz, Austria
7Department of Bioscience, Arctic Research
Centre, Aarhus University, Roskilde, Denmark
Correspondence
D. M. Hannah, School of Geography, Earth and
Environmental Science, University of
Birmingham, Birmingham B15 2TT, UK.
Email: [email protected]
Funding information
European Union Seventh Framework Pro-
gramme, Grant/Award Number: 262693; Nat-
ural Environment Research Council (NERC),
Grant/Award Number: NE/L501712/1
- - - - - - - - - - - - - - - - - - - - - - - - - - - - - - - - - - - - - - - -
This is an open access article under the terms of the
the original work is properly cited.
© 2019 The Authors. River Research and Applicati
River Res Applic. 2019;1–16.
Abstract
Climate change in the Arctic is expected to have a major impact on stream ecosys-
tems, affecting hydrological and thermal regimes. Although temperature is important
to a range of in‐stream processes, previous Arctic stream temperature research is lim-
ited—focused on glacierised headwaters in summer—with limited attention to snow-
melt streams and winter. This is the first high‐resolution study on stream
temperature in north‐east Greenland (Zackenberg). Data were collected from five
streams from September 2013 to September 2015 (24 months). During the winter,
streams were largely frozen solid and water temperature variability low. Spring ice‐
off date occurred simultaneously across all streams, but 11 days earlier in 2014 com-
pared with 2015 due to thicker snow insulation. During summer, water temperature
was highly variable and exhibited a strong relationship with meteorological variables,
particularly incoming shortwave radiation and air temperature. Mean summer water
temperature in these snowmelt streams was high compared with streams studied pre-
viously in Svalbard, yet was lower in Swedish Lapland, as was expected given latitude.
With global warning, Arctic stream thermal variability may be less in summer and
increased during the winter due to higher summer air temperature and elevated win-
ter precipitation, and the spring and autumn ice‐on and ice‐off dates may extend the
flowing water season—in turn affecting stream productivity and diversity.
KEYWORDS
Arctic, Greenland, hydrology, meltwater, river temperature, stream, thermal dynamics
1 | INTRODUCTION
In the last 100 years, the rise in air temperature in the Arctic has
been substantially more pronounced than the global average (2.9°C
compared with 0.8°C; Comiso & Hall, 2014; Overland et al., 2015).
This trend of increased air temperature in the Arctic will continue
alongside changes in precipitation and permafrost extent (Dyurgerov
& Meier, 2000; Foster, Robinson, Hall, & Estilow, 2008; White et al.,
2007), affecting both hydrology and thermal regimes (van Vliet et al.,
- - - - - - - - - - - - - - - - - - - - - - - - - -
Creative Commons Attribution Li
ons published by John Wiley & So
2013) and potentially having large consequences for freshwater
ecosystems.
Water temperature influences chemical, physical, and biological
processes in all stream ecosystems (Caissie, 2006; Cory, Crump,
Dobkowski, & Kling, 2013; McNamara, Kane, Hobbie, & Kling, 2008;
Rawlins et al., 2010; Webb, Hannah, Moore, Brown, & Nobilis,
2008). In terms of biochemical and physical processes, higher water
temperatures are known to increase weathering (Anderson, 2005)
and nutrient uptake rates (Blaen, Milner, Hannah, Brittain, & Brown,
- - - - - - - - - - - - - - - - - - - - - - - - - - - - - - - - - - - - - - - - - - - - - - - - - - - - - - - - - - - - - - -
cense, which permits use, distribution and reproduction in any medium, provided
ns Ltd.
wileyonlinelibrary.com/journal/rra 1
2 DOCHERTY ET AL.
2014). In terms of biological processes, warmer water temperature
causes higher metabolic demands of both individuals and ecosystems
as a whole (Brown, Gillooly, Allen, Savage, & West, 2004). In Arctic
and alpine regions, water temperature is the variable found to best
explain macroinvertebrate community composition (Friberg, Bergfur,
Rasmussen, & Sandin, 2013) and taxa richness (Castella et al., 2001;
Friberg, Milner, Svendsen, Lindegaard, & Larsen, 2001), and increased
water temperature can lead to a decrease in beta diversity (Finn,
Khamis, & Milner, 2013).
Atmospheric conditions have been identified as having the largest
control on water temperature dynamics in streams, particularly solar
radiation due to the heat flux at the air–water surface boundary
(Caissie, 2006; Evans, McGregor, & Petts, 1998; Khamis, Hannah,
Brown, & Milner, 2015) with air temperature being the strongest
explanatory variable. Nevertheless, there is evidence that snow
depth and local geomorphology influence the relationship between
air and water temperature in Arctic regions (Lisi, Schindler, Cline,
Scheuerell, & Walsh, 2015). The predicted Arctic‐wide increase in
air temperature and precipitation and decrease in sea‐ice extent by
the end of the century (Anisimov et al., 2007; Vaughan et al., 2013)
is likely to lead to large changes both in stream temperature
dynamics and in the relationship between water temperature and
atmospheric conditions. In the Zackenberg area of north‐east Green-
land, at approximately 60 km from the Greenland ice sheet, studies
predict a 60% increase in precipitation (Hinkler, Hansen, Tamstorf,
Sigsgaard, & Petersen, 2008; Rinke & Dethloff, 2008; Stendel,
Christiansen, & Petersen, 2008) with the proportion falling as rain
predicted to increase, affecting the relationship between air tempera-
ture and water temperature. Alongside this, air temperatures will
likely increase, particularly in winter (Stendel et al., 2008), and there
is predicted to be an 8‐ to 12‐cm increase in active layer thickness
(Hollesen, Elberling, & Jansson, 2011; Westermann et al., 2015).
The increased nivation processes and permafrost degradation associ-
ated with these changes will lead to a rise in sediment entering
streams and a decrease in channel stability, affecting water retention
time and stream albedo (Blaen, Hannah, Brown, & Milner, 2013;
Han, 1997; Richards & Moore, 2011), whereas increased snowmelt
inputs could act as a buffer on water temperature. The large
increase in Arctic air temperature expected during the winter
months due to the decrease in sea ice extent (Chapman & Walsh,
2007; Walsh, Overland, Groisman, & Rudolf, 2011) is expected to
have consequences on summer stream flow dynamics (Dahlke,
Stedinger, Rosquist, & Jansson, 2012), influencing water temperature
during peak productivity. This will be through decreases in river ice
cover (Vaughan et al., 2013; although this is more relevant to lower
arctic regions), changes to snowpack conditions, and increased rain‐
on‐snow events during the winter. Furthermore, an increase in
autumn and spring water temperatures will affect stream ice‐on and
ice‐off timing, extending the length of summer stream flow period
and highlighting the importance of full year studies on water
temperature.
Water temperature dynamics and their importance at high
latitudes and in alpine environments have been examined in past
literature (Adams, Crump, & Kling, 2010; Blaen et al., 2013; Brown,
Hannah, & Milner, 2005; Cadbury, Hannah, Milner, Pearson, & Brown,
2008; Comola, Schaefli, Rinaldo, & Lehning, 2015; Constantz, 1998;
Khamis et al., 2015; King, Neilson, Overbeck, & Kane, 2016; Lisi et
al., 2015; MacDonald, Boons, Byrne, & Silins, 2014; Madsen et al.,
2015; Mellor, Dugdale, Garner, Milner, & Hannah, 2016; Vincent &
Howard Williams, 1989). However, previous studies have often
focused on areas with a large glacial influence, and there has been
no high‐resolution research focused on Greenlandic stream tempera-
ture dynamics. Furthermore, most existing data from the Arctic focus
on the melt season, and Arctic winter stream water temperature
dynamics therefore remain largely unknown.
This paper details Greenlandic stream temperature dynamics for
the first time and builds on past stream water temperature studies
conducted in other Arctic areas. It addresses the paucity of informa-
tion on temperature dynamics in snowmelt streams, particularly
during the winter period. To address this research gap, we compiled
a high‐resolution water temperature data series over 24 months
from streams in north‐east Greenland. Through this, we aimed to
(a) characterize thermal variability in space and time, (b) infer key con-
trols and processes on stream temperature, and (c) consider the impli-
cations of the findings in the context of hydroclimatic change in the
Arctic.
2 | METHODS
2.1 | Study area
Field data were collected from around the Zackenberg research station
(74°28′N, 20°34′W), within the Northeast Greenland National Park in
the high Arctic climatic zone (Figure 1). The region is not connected to
the ice sheet, which is located approximately 60 km away. Altitude
within the study site varies between sea level and 1,450 m a.s.l. with
a glacial plateau occurring above 1,000 m a.s.l. and wide horizontal val-
leys caused by glacial erosion below (Mernild, Liston, & Hasholt, 2007).
The valley is in a zone of continuous permafrost and active layer thick-
ness varies between 0.4 and 0.8 m (Hollesen et al., 2011; Westermann
et al., 2015).
The geology is divided by the Zackenberg river and comprises Cal-
edonian gneiss and granite in the west and cretaceous and tertiary
sandstones and basalts in the east at higher altitudes of Palnatoke
and Aucella mountains. Loose and sometimes well‐developed soils
(Hasholt & Hagedorn, 2000; Mernild et al., 2007) occupy the valley
and lower slopes. Vegetation distribution is largely divided by the
area's geology (Elberling et al., 2008). In the west, bog bilberry
(Vaccinium uliginosum) heath is more abundant, among areas with
scattered boulders and fens with high species diversity. To the east,
lowland vegetation comprises Arctic white heather (Cassiope
tetragona) heaths, Arctic willow (Salix arctica) snow beds, grasslands,
and fens. At higher altitudes, between 150 and 300 m, mountain avens
(Dryas sp.) heath dominates (Bay, 1998).
[C
DOCHERTY ET AL. 3
The mean annual air temperature is −9.1°C. The warmest month is
July with a mean air temperature of 5.8°C and the coldest month is
February with a mean air temperature of −22.4°C. Annual precipitation
is 261 mm and falls mainly as snow (Hansen et al., 2008).
To date, hydrological research in this region has focused on sedi-
ment and solute transport of Zackenberg river and the regions streams
(Hasholt et al., 2008; Hasholt & Hagedorn, 2000; Ladegaard‐Pedersen
et al., 2016; Rasch, Elberling, Jakobsen, & Hasholt, 2000), while stream
thermal dynamics are unknown.
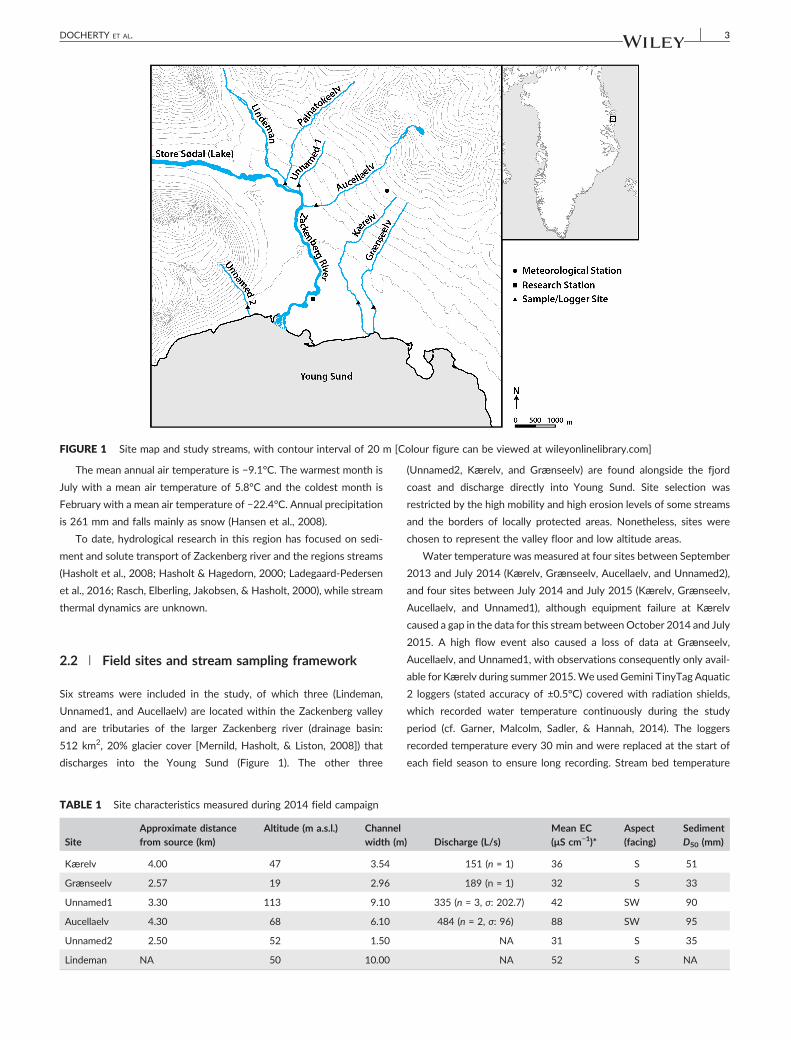
FIGURE 1 Site map and study streams, with contour interval of 20 m
2.2 | Field sites and stream sampling framework
Six streams were included in the study, of which three (Lindeman,
Unnamed1, and Aucellaelv) are located within the Zackenberg valley
and are tributaries of the larger Zackenberg river (drainage basin:
512 km2, 20% glacier cover [Mernild, Hasholt, & Liston, 2008]) that
discharges into the Young Sund (Figure 1). The other three
TABLE 1 Site characteristics measured during 2014 field campaign
SiteApproximate distancefrom source (km)
Altitude (m a.s.l.) Channelwidth (m
Kærelv 4.00 47 3.54
Grænseelv 2.57 19 2.96
Unnamed1 3.30 113 9.10
Aucellaelv 4.30 68 6.10
Unnamed2 2.50 52 1.50
Lindeman NA 50 10.00
(Unnamed2, Kærelv, and Grænseelv) are found alongside the fjord
coast and discharge directly into Young Sund. Site selection was
restricted by the high mobility and high erosion levels of some streams
and the borders of locally protected areas. Nonetheless, sites were
chosen to represent the valley floor and low altitude areas.
Water temperature was measured at four sites between September
2013 and July 2014 (Kærelv, Grænseelv, Aucellaelv, and Unnamed2),
and four sites between July 2014 and July 2015 (Kærelv, Grænseelv,
Aucellaelv, and Unnamed1), although equipment failure at Kærelv
caused a gap in the data for this stream betweenOctober 2014 and July
2015. A high flow event also caused a loss of data at Grænseelv,
Aucellaelv, and Unnamed1, with observations consequently only avail-
able for Kærelv during summer 2015.We used Gemini TinyTag Aquatic
2 loggers (stated accuracy of ±0.5°C) covered with radiation shields,
which recorded water temperature continuously during the study
period (cf. Garner, Malcolm, Sadler, & Hannah, 2014). The loggers
recorded temperature every 30 min and were replaced at the start of
each field season to ensure long recording. Stream bed temperature
olour figure can be viewed at wileyonlinelibrary.com]
) Discharge (L/s)Mean EC(μS cm−1)*
Aspect(facing)
SedimentD50 (mm)
151 (n = 1) 36 S 51
189 (n = 1) 32 S 33
335 (n = 3, σ: 202.7) 42 SW 90
484 (n = 2, σ: 96) 88 SW 95
NA 31 S 35
NA 52 S NA
4 DOCHERTY ET AL.
was measured at three sites (Kærelv, Grænseelv, and Lindeman) using
Campbell Scientific 107 temperature probes inserted at depths of
0.05, 0.25, and 0.40m. The probes were attached to a CR1000 data log-
gerwhich scanned every 10 s and recorded amean of these values every
15 min. All sensors were cross calibrated before deployment and inter-
nal clocks were synchronized.
In terms of hydromorphic conditions, Kærelv and Grænseelv
were composed of stable channels, whereas the other streams were
observed to be more dynamic. Aucellaelv was characteristed by its
braided, highly mobile stream bed and high suspended sediment
load. Site characteristics are presented in Table 1. Stream discharge
(measured during the summer field campaigns using the velocity–
area method) varied between sites, with the lowest values recorded
in Kærelv and Grænseelv during the field campaign in 2014 (151
and 189 L/s, respectively). Unnamed1 showed high variability with
the lowest measurement of 181 L/s and the highest of 622 L/s dur-
ing the field campaign in 2014 (Table 1). Discharge was higher at all
sites during the field campaign in 2015 compared with 2014.
Streambed sediment size (D50, obtained from measuring the b‐axis
of 100 clasts) ranged from 33 mm in Grænseelv to 95 mm in
Aucellaelv (Table 1).
2.3 | Meteorological observations
Meteorological variables were used to assess atmospheric influences
on water temperature. Air temperature and precipitation were
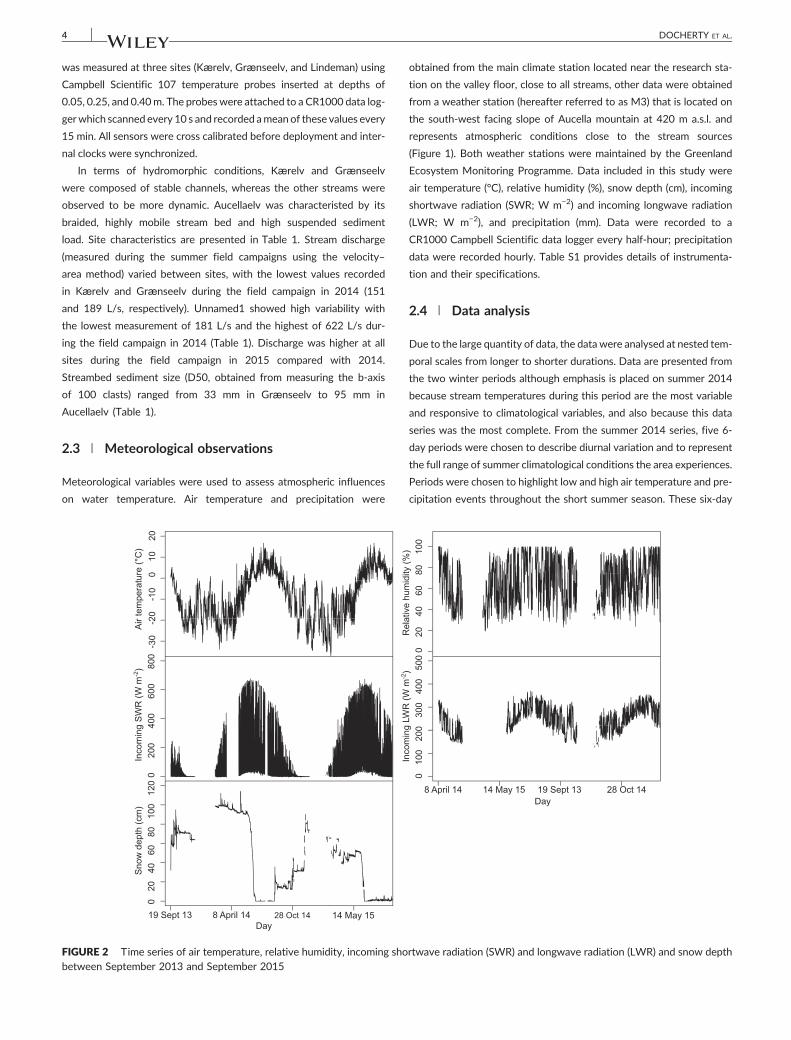
FIGURE 2 Time series of air temperature, relative humidity, incoming shobetween September 2013 and September 2015
obtained from the main climate station located near the research sta-
tion on the valley floor, close to all streams, other data were obtained
from a weather station (hereafter referred to as M3) that is located on
the south‐west facing slope of Aucella mountain at 420 m a.s.l. and
represents atmospheric conditions close to the stream sources
(Figure 1). Both weather stations were maintained by the Greenland
Ecosystem Monitoring Programme. Data included in this study were
air temperature (°C), relative humidity (%), snow depth (cm), incoming
shortwave radiation (SWR; W m−2) and incoming longwave radiation
(LWR; W m−2), and precipitation (mm). Data were recorded to a
CR1000 Campbell Scientific data logger every half‐hour; precipitation
data were recorded hourly. Table S1 provides details of instrumenta-
tion and their specifications.
2.4 | Data analysis
Due to the large quantity of data, the data were analysed at nested tem-
poral scales from longer to shorter durations. Data are presented from
the two winter periods although emphasis is placed on summer 2014
because stream temperatures during this period are the most variable
and responsive to climatological variables, and also because this data
series was the most complete. From the summer 2014 series, five 6‐
day periods were chosen to describe diurnal variation and to represent
the full range of summer climatological conditions the area experiences.
Periods were chosen to highlight low and high air temperature and pre-
cipitation events throughout the short summer season. These six‐day
rtwave radiation (SWR) and longwave radiation (LWR) and snow depth
DOCHERTY ET AL. 5
periods were decided to be a time frame large enough to highlight con-
ditions before and after climatic events. Descriptive statistics were cal-
culated on these six‐day periods and used to characterize water
temperature and meteorological conditions. One‐way analyses of vari-
ance (ANOVAs) were undertaken to analyse differences in water tem-
peratures between streams.
Descriptive statistics were also calculated for water temperature
and meteorological variables during all time periods to characterize
environmental conditions. Temperature duration curves were
established for three time periods (September 2013 to July 2014, July
2014 to July 2015, and July 11 to September 15, 2014) to represent
the two years' data and to allow for comparison of water temperature
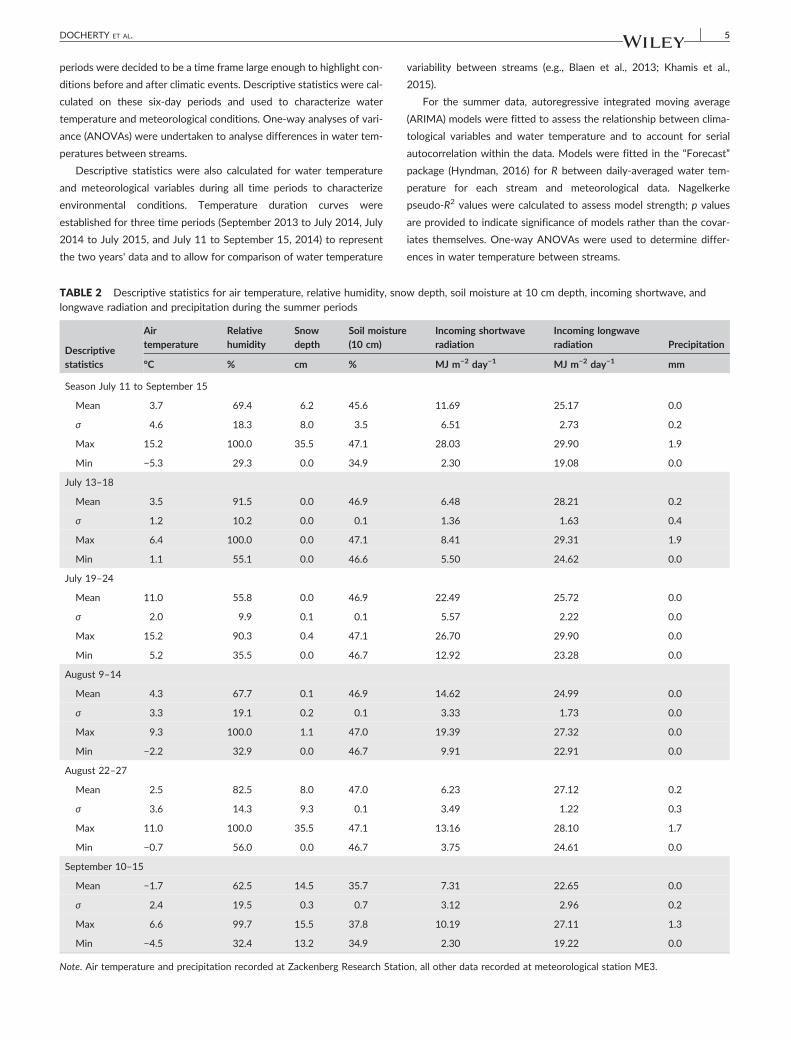
TABLE 2 Descriptive statistics for air temperature, relative humidity, snolongwave radiation and precipitation during the summer periods
Descriptivestatistics
Airtemperature
Relativehumidity
Snowdepth
Soil moisture(10 cm)
°C % cm %
Season July 11 to September 15
Mean 3.7 69.4 6.2 45.6
σ 4.6 18.3 8.0 3.5
Max 15.2 100.0 35.5 47.1
Min −5.3 29.3 0.0 34.9
July 13–18
Mean 3.5 91.5 0.0 46.9
σ 1.2 10.2 0.0 0.1
Max 6.4 100.0 0.0 47.1
Min 1.1 55.1 0.0 46.6
July 19–24
Mean 11.0 55.8 0.0 46.9
σ 2.0 9.9 0.1 0.1
Max 15.2 90.3 0.4 47.1
Min 5.2 35.5 0.0 46.7
August 9–14
Mean 4.3 67.7 0.1 46.9
σ 3.3 19.1 0.2 0.1
Max 9.3 100.0 1.1 47.0
Min −2.2 32.9 0.0 46.7
August 22–27
Mean 2.5 82.5 8.0 47.0
σ 3.6 14.3 9.3 0.1
Max 11.0 100.0 35.5 47.1
Min −0.7 56.0 0.0 46.7
September 10–15
Mean −1.7 62.5 14.5 35.7
σ 2.4 19.5 0.3 0.7
Max 6.6 99.7 15.5 37.8
Min −4.5 32.4 13.2 34.9
Note. Air temperature and precipitation recorded at Zackenberg Research Stati
variability between streams (e.g., Blaen et al., 2013; Khamis et al.,
2015).
For the summer data, autoregressive integrated moving average
(ARIMA) models were fitted to assess the relationship between clima-
tological variables and water temperature and to account for serial
autocorrelation within the data. Models were fitted in the “Forecast”
package (Hyndman, 2016) for R between daily‐averaged water tem-
perature for each stream and meteorological data. Nagelkerke
pseudo‐R2 values were calculated to assess model strength; p values
are provided to indicate significance of models rather than the covar-
iates themselves. One‐way ANOVAs were used to determine differ-
ences in water temperature between streams.
w depth, soil moisture at 10 cm depth, incoming shortwave, and
Incoming shortwaveradiation
Incoming longwaveradiation Precipitation
MJ m−2 day−1 MJ m−2 day−1 mm
11.69 25.17 0.0
6.51 2.73 0.2
28.03 29.90 1.9
2.30 19.08 0.0
6.48 28.21 0.2
1.36 1.63 0.4
8.41 29.31 1.9
5.50 24.62 0.0
22.49 25.72 0.0
5.57 2.22 0.0
26.70 29.90 0.0
12.92 23.28 0.0
14.62 24.99 0.0
3.33 1.73 0.0
19.39 27.32 0.0
9.91 22.91 0.0
6.23 27.12 0.2
3.49 1.22 0.3
13.16 28.10 1.7
3.75 24.61 0.0
7.31 22.65 0.0
3.12 2.96 0.2
10.19 27.11 1.3
2.30 19.22 0.0
on, all other data recorded at meteorological station ME3.
6 DOCHERTY ET AL.
3 | RESULTS
3.1 | Interannual and seasonal meteorologicalcontext
The winter of 2013–2014 was cooler (mean of −13.4°C) than winter
2014–2015 (mean of −11.6°C) and received greater snowfall (85 cm
vs. 43 cm). In both years, June is the month of peak snow melt and
is the first month of the year where mean air temperatures rise above
0°C (June 2014: 3.4°C, June 2015: 4.1°C). In both years, July was the
warmest month (mean temperature 2014: 5.6°C, 2015: 7.4°C), with
lowest temperatures recorded during February 2015 (−29.7°C;
Figure 2). Cooler air temperatures towards the end of the summer
period were associated with decreased shortwave and longwave radi-
ation and an increase in snow depth. (Figure 2; Table 2).
There was no observed seasonality in relative humidity throughout
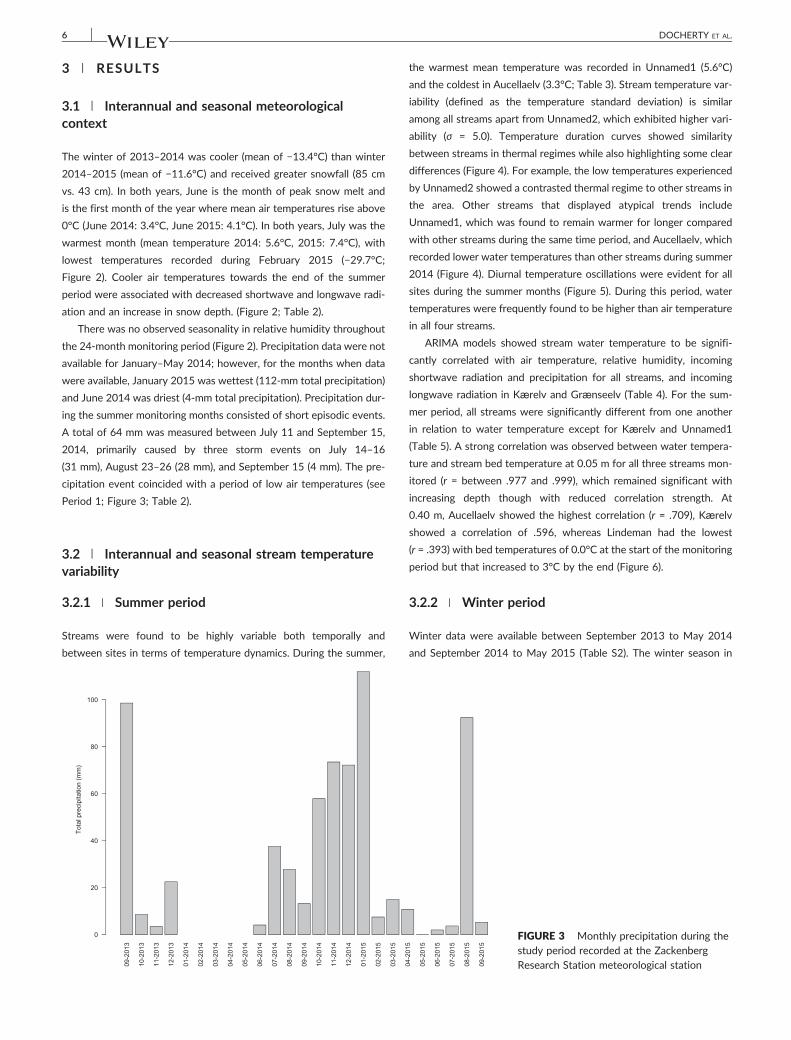
the 24‐month monitoring period (Figure 2). Precipitation data were not
available for January–May 2014; however, for the months when data
were available, January 2015 was wettest (112‐mm total precipitation)
and June 2014 was driest (4‐mm total precipitation). Precipitation dur-
ing the summer monitoring months consisted of short episodic events.
A total of 64 mm was measured between July 11 and September 15,
2014, primarily caused by three storm events on July 14–16
(31 mm), August 23–26 (28 mm), and September 15 (4 mm). The pre-
cipitation event coincided with a period of low air temperatures (see
Period 1; Figure 3; Table 2).
3.2 | Interannual and seasonal stream temperaturevariability
3.2.1 | Summer period
Streams were found to be highly variable both temporally and
between sites in terms of temperature dynamics. During the summer,
the warmest mean temperature was recorded in Unnamed1 (5.6°C)
and the coldest in Aucellaelv (3.3°C; Table 3). Stream temperature var-
iability (defined as the temperature standard deviation) is similar
among all streams apart from Unnamed2, which exhibited higher vari-
ability (σ = 5.0). Temperature duration curves showed similarity
between streams in thermal regimes while also highlighting some clear
differences (Figure 4). For example, the low temperatures experienced
by Unnamed2 showed a contrasted thermal regime to other streams in
the area. Other streams that displayed atypical trends include
Unnamed1, which was found to remain warmer for longer compared
with other streams during the same time period, and Aucellaelv, which
recorded lower water temperatures than other streams during summer
2014 (Figure 4). Diurnal temperature oscillations were evident for all
sites during the summer months (Figure 5). During this period, water
temperatures were frequently found to be higher than air temperature
in all four streams.
ARIMA models showed stream water temperature to be signifi-
cantly correlated with air temperature, relative humidity, incoming
shortwave radiation and precipitation for all streams, and incoming
longwave radiation in Kærelv and Grænseelv (Table 4). For the sum-
mer period, all streams were significantly different from one another
in relation to water temperature except for Kærelv and Unnamed1
(Table 5). A strong correlation was observed between water tempera-
ture and stream bed temperature at 0.05 m for all three streams mon-
itored (r = between .977 and .999), which remained significant with
increasing depth though with reduced correlation strength. At
0.40 m, Aucellaelv showed the highest correlation (r = .709), Kærelv
showed a correlation of .596, whereas Lindeman had the lowest
(r = .393) with bed temperatures of 0.0°C at the start of the monitoring
period but that increased to 3°C by the end (Figure 6).
3.2.2 | Winter period
Winter data were available between September 2013 to May 2014
and September 2014 to May 2015 (Table S2). The winter season in
FIGURE 3 Monthly precipitation during thestudy period recorded at the ZackenbergResearch Station meteorological station
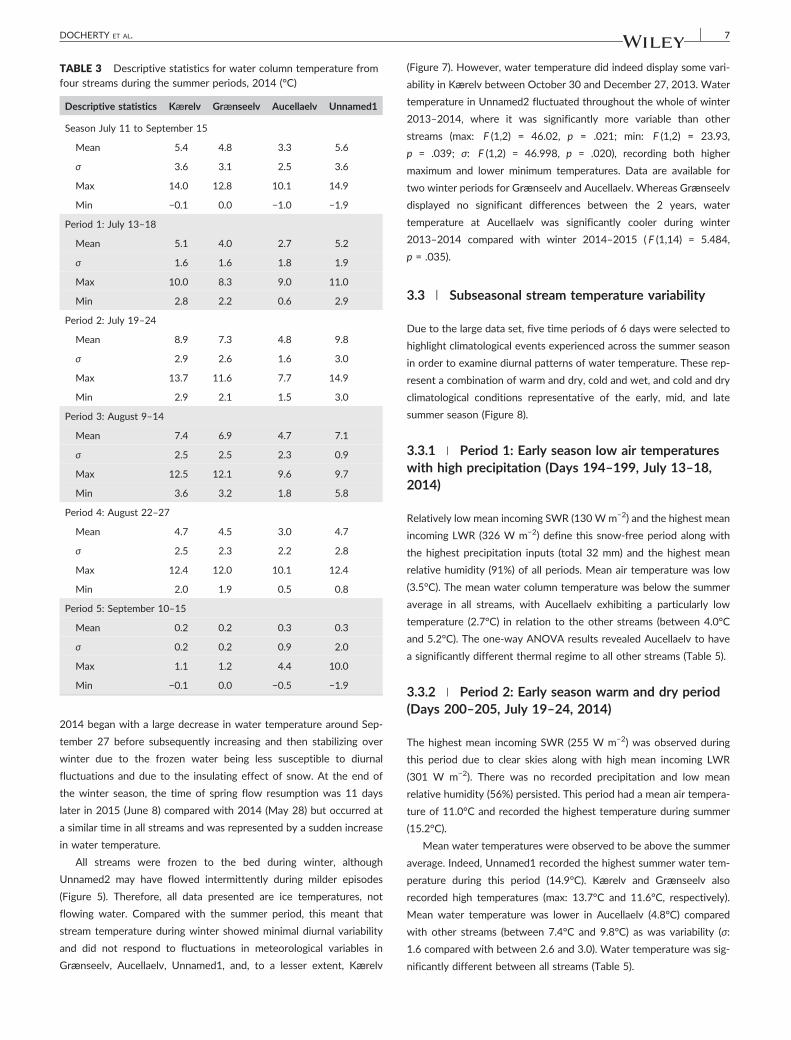
TABLE 3 Descriptive statistics for water column temperature fromfour streams during the summer periods, 2014 (°C)
Descriptive statistics Kærelv Grænseelv Aucellaelv Unnamed1
Season July 11 to September 15
Mean 5.4 4.8 3.3 5.6
σ 3.6 3.1 2.5 3.6
Max 14.0 12.8 10.1 14.9
Min −0.1 0.0 −1.0 −1.9
Period 1: July 13–18
Mean 5.1 4.0 2.7 5.2
σ 1.6 1.6 1.8 1.9
Max 10.0 8.3 9.0 11.0
Min 2.8 2.2 0.6 2.9
Period 2: July 19–24
Mean 8.9 7.3 4.8 9.8
σ 2.9 2.6 1.6 3.0
Max 13.7 11.6 7.7 14.9
Min 2.9 2.1 1.5 3.0
Period 3: August 9–14
Mean 7.4 6.9 4.7 7.1
σ 2.5 2.5 2.3 0.9
Max 12.5 12.1 9.6 9.7
Min 3.6 3.2 1.8 5.8
Period 4: August 22–27
Mean 4.7 4.5 3.0 4.7
σ 2.5 2.3 2.2 2.8
Max 12.4 12.0 10.1 12.4
Min 2.0 1.9 0.5 0.8
Period 5: September 10–15
Mean 0.2 0.2 0.3 0.3
σ 0.2 0.2 0.9 2.0
Max 1.1 1.2 4.4 10.0
Min −0.1 0.0 −0.5 −1.9
DOCHERTY ET AL. 7
2014 began with a large decrease in water temperature around Sep-
tember 27 before subsequently increasing and then stabilizing over
winter due to the frozen water being less susceptible to diurnal
fluctuations and due to the insulating effect of snow. At the end of
the winter season, the time of spring flow resumption was 11 days
later in 2015 (June 8) compared with 2014 (May 28) but occurred at
a similar time in all streams and was represented by a sudden increase
in water temperature.
All streams were frozen to the bed during winter, although
Unnamed2 may have flowed intermittently during milder episodes
(Figure 5). Therefore, all data presented are ice temperatures, not
flowing water. Compared with the summer period, this meant that
stream temperature during winter showed minimal diurnal variability
and did not respond to fluctuations in meteorological variables in
Grænseelv, Aucellaelv, Unnamed1, and, to a lesser extent, Kærelv
(Figure 7). However, water temperature did indeed display some vari-
ability in Kærelv between October 30 and December 27, 2013. Water
temperature in Unnamed2 fluctuated throughout the whole of winter
2013–2014, where it was significantly more variable than other
streams (max: F (1,2) = 46.02, p = .021; min: F (1,2) = 23.93,
p = .039; σ: F (1,2) = 46.998, p = .020), recording both higher
maximum and lower minimum temperatures. Data are available for
two winter periods for Grænseelv and Aucellaelv. Whereas Grænseelv
displayed no significant differences between the 2 years, water
temperature at Aucellaelv was significantly cooler during winter
2013–2014 compared with winter 2014–2015 ( F (1,14) = 5.484,
p = .035).
3.3 | Subseasonal stream temperature variability
Due to the large data set, five time periods of 6 days were selected to
highlight climatological events experienced across the summer season
in order to examine diurnal patterns of water temperature. These rep-
resent a combination of warm and dry, cold and wet, and cold and dry
climatological conditions representative of the early, mid, and late
summer season (Figure 8).
3.3.1 | Period 1: Early season low air temperatureswith high precipitation (Days 194–199, July 13–18,2014)
Relatively low mean incoming SWR (130 W m−2) and the highest mean
incoming LWR (326 W m−2) define this snow‐free period along with
the highest precipitation inputs (total 32 mm) and the highest mean
relative humidity (91%) of all periods. Mean air temperature was low
(3.5°C). The mean water column temperature was below the summer
average in all streams, with Aucellaelv exhibiting a particularly low
temperature (2.7°C) in relation to the other streams (between 4.0°C
and 5.2°C). The one‐way ANOVA results revealed Aucellaelv to have
a significantly different thermal regime to all other streams (Table 5).
3.3.2 | Period 2: Early season warm and dry period(Days 200–205, July 19–24, 2014)
The highest mean incoming SWR (255 W m−2) was observed during
this period due to clear skies along with high mean incoming LWR
(301 W m−2). There was no recorded precipitation and low mean
relative humidity (56%) persisted. This period had a mean air tempera-
ture of 11.0°C and recorded the highest temperature during summer
(15.2°C).
Mean water temperatures were observed to be above the summer
average. Indeed, Unnamed1 recorded the highest summer water tem-
perature during this period (14.9°C). Kærelv and Grænseelv also
recorded high temperatures (max: 13.7°C and 11.6°C, respectively).
Mean water temperature was lower in Aucellaelv (4.8°C) compared
with other streams (between 7.4°C and 9.8°C) as was variability (σ:
1.6 compared with between 2.6 and 3.0). Water temperature was sig-
nificantly different between all streams (Table 5).
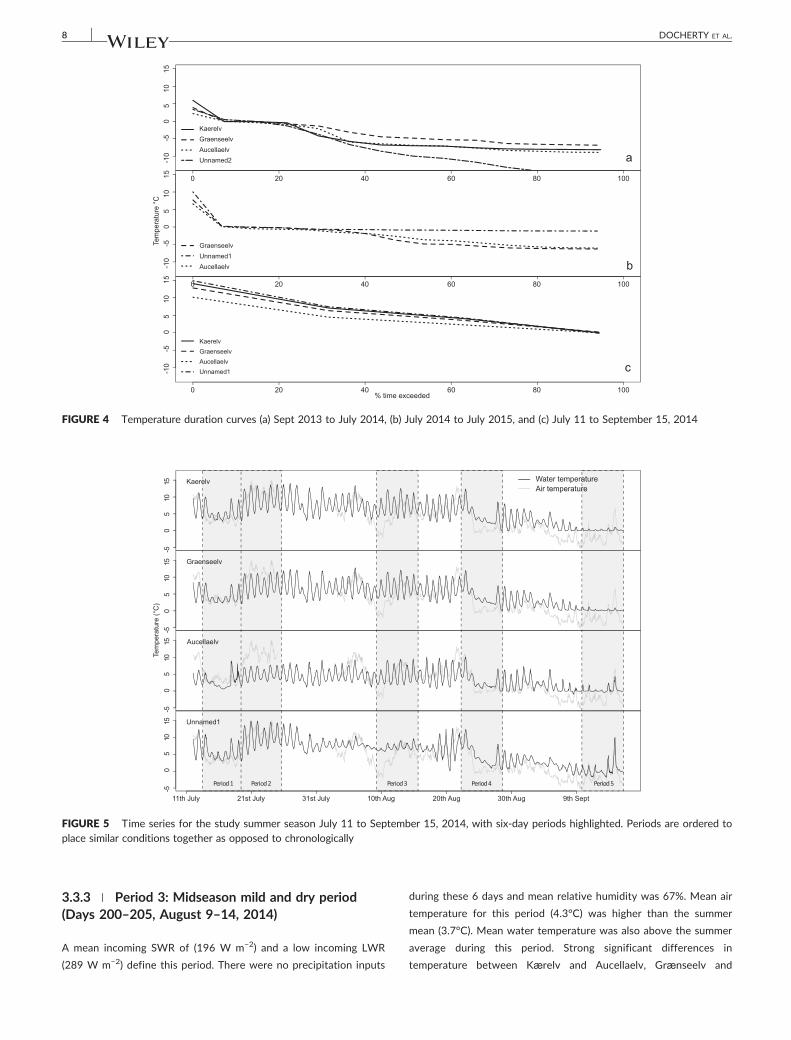
FIGURE 4 Temperature duration curves (a) Sept 2013 to July 2014, (b) July 2014 to July 2015, and (c) July 11 to September 15, 2014
FIGURE 5 Time series for the study summer season July 11 to September 15, 2014, with six‐day periods highlighted. Periods are ordered toplace similar conditions together as opposed to chronologically
8 DOCHERTY ET AL.
3.3.3 | Period 3: Midseason mild and dry period(Days 200–205, August 9–14, 2014)
A mean incoming SWR of (196 W m−2) and a low incoming LWR
(289 W m−2) define this period. There were no precipitation inputs
during these 6 days and mean relative humidity was 67%. Mean air
temperature for this period (4.3°C) was higher than the summer
mean (3.7°C). Mean water temperature was also above the summer
average during this period. Strong significant differences in
temperature between Kærelv and Aucellaelv, Grænseelv and
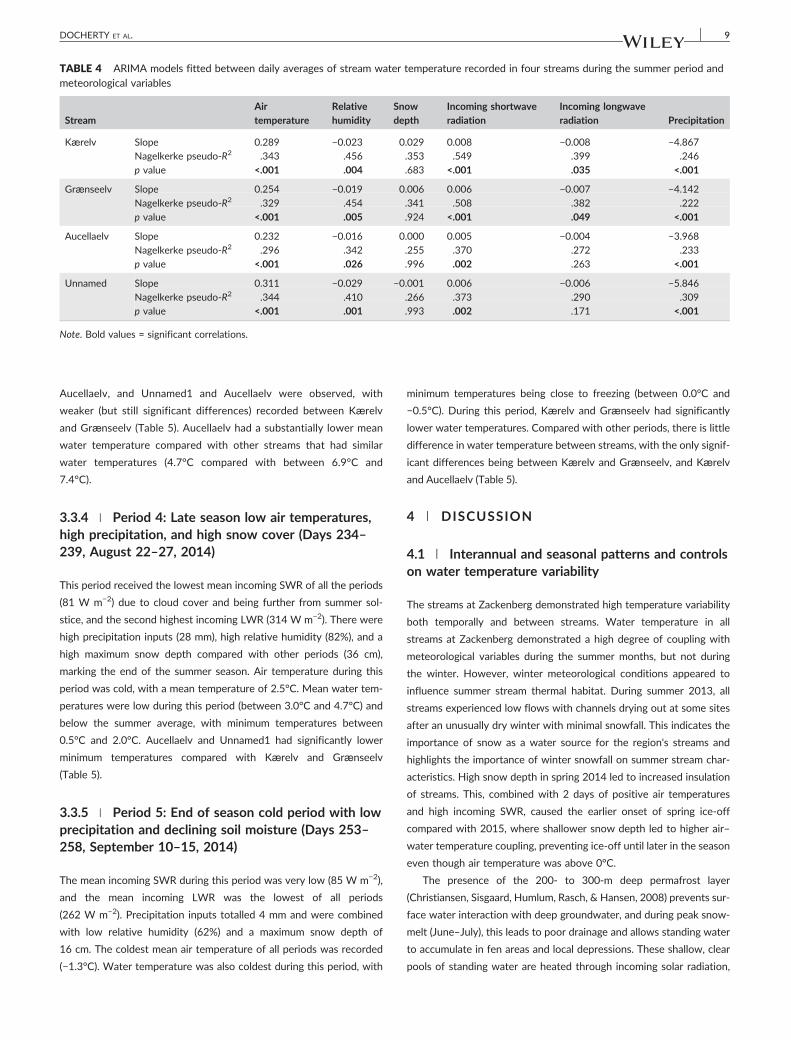
TABLE 4 ARIMA models fitted between daily averages of stream water temperature recorded in four streams during the summer period andmeteorological variables
StreamAirtemperature
Relativehumidity
Snowdepth
Incoming shortwaveradiation
Incoming longwaveradiation Precipitation
Kærelv Slope 0.289 −0.023 0.029 0.008 −0.008 −4.867
Nagelkerke pseudo‐R2 .343 .456 .353 .549 .399 .246
p value <.001 .004 .683 <.001 .035 <.001
Grænseelv Slope 0.254 −0.019 0.006 0.006 −0.007 −4.142
Nagelkerke pseudo‐R2 .329 .454 .341 .508 .382 .222
p value <.001 .005 .924 <.001 .049 <.001
Aucellaelv Slope 0.232 −0.016 0.000 0.005 −0.004 −3.968
Nagelkerke pseudo‐R2 .296 .342 .255 .370 .272 .233
p value <.001 .026 .996 .002 .263 <.001
Unnamed Slope 0.311 −0.029 −0.001 0.006 −0.006 −5.846
Nagelkerke pseudo‐R2 .344 .410 .266 .373 .290 .309
p value <.001 .001 .993 .002 .171 <.001
Note. Bold values = significant correlations.
DOCHERTY ET AL. 9
Aucellaelv, and Unnamed1 and Aucellaelv were observed, with
weaker (but still significant differences) recorded between Kærelv
and Grænseelv (Table 5). Aucellaelv had a substantially lower mean
water temperature compared with other streams that had similar
water temperatures (4.7°C compared with between 6.9°C and
7.4°C).
3.3.4 | Period 4: Late season low air temperatures,high precipitation, and high snow cover (Days 234–239, August 22–27, 2014)
This period received the lowest mean incoming SWR of all the periods
(81 W m−2) due to cloud cover and being further from summer sol-
stice, and the second highest incoming LWR (314 W m−2). There were
high precipitation inputs (28 mm), high relative humidity (82%), and a
high maximum snow depth compared with other periods (36 cm),
marking the end of the summer season. Air temperature during this
period was cold, with a mean temperature of 2.5°C. Mean water tem-
peratures were low during this period (between 3.0°C and 4.7°C) and
below the summer average, with minimum temperatures between
0.5°C and 2.0°C. Aucellaelv and Unnamed1 had significantly lower
minimum temperatures compared with Kærelv and Grænseelv
(Table 5).
3.3.5 | Period 5: End of season cold period with lowprecipitation and declining soil moisture (Days 253–258, September 10–15, 2014)
The mean incoming SWR during this period was very low (85 W m−2),
and the mean incoming LWR was the lowest of all periods
(262 W m−2). Precipitation inputs totalled 4 mm and were combined
with low relative humidity (62%) and a maximum snow depth of
16 cm. The coldest mean air temperature of all periods was recorded
(−1.3°C). Water temperature was also coldest during this period, with
minimum temperatures being close to freezing (between 0.0°C and
−0.5°C). During this period, Kærelv and Grænseelv had significantly
lower water temperatures. Compared with other periods, there is little
difference in water temperature between streams, with the only signif-
icant differences being between Kærelv and Grænseelv, and Kærelv
and Aucellaelv (Table 5).
4 | DISCUSSION
4.1 | Interannual and seasonal patterns and controlson water temperature variability
The streams at Zackenberg demonstrated high temperature variability
both temporally and between streams. Water temperature in all
streams at Zackenberg demonstrated a high degree of coupling with
meteorological variables during the summer months, but not during
the winter. However, winter meteorological conditions appeared to
influence summer stream thermal habitat. During summer 2013, all
streams experienced low flows with channels drying out at some sites
after an unusually dry winter with minimal snowfall. This indicates the
importance of snow as a water source for the region's streams and
highlights the importance of winter snowfall on summer stream char-
acteristics. High snow depth in spring 2014 led to increased insulation
of streams. This, combined with 2 days of positive air temperatures
and high incoming SWR, caused the earlier onset of spring ice‐off
compared with 2015, where shallower snow depth led to higher air–
water temperature coupling, preventing ice‐off until later in the season
even though air temperature was above 0°C.
The presence of the 200‐ to 300‐m deep permafrost layer
(Christiansen, Sisgaard, Humlum, Rasch, & Hansen, 2008) prevents sur-
face water interaction with deep groundwater, and during peak snow-
melt (June–July), this leads to poor drainage and allows standing water
to accumulate in fen areas and local depressions. These shallow, clear
pools of standing water are heated through incoming solar radiation,
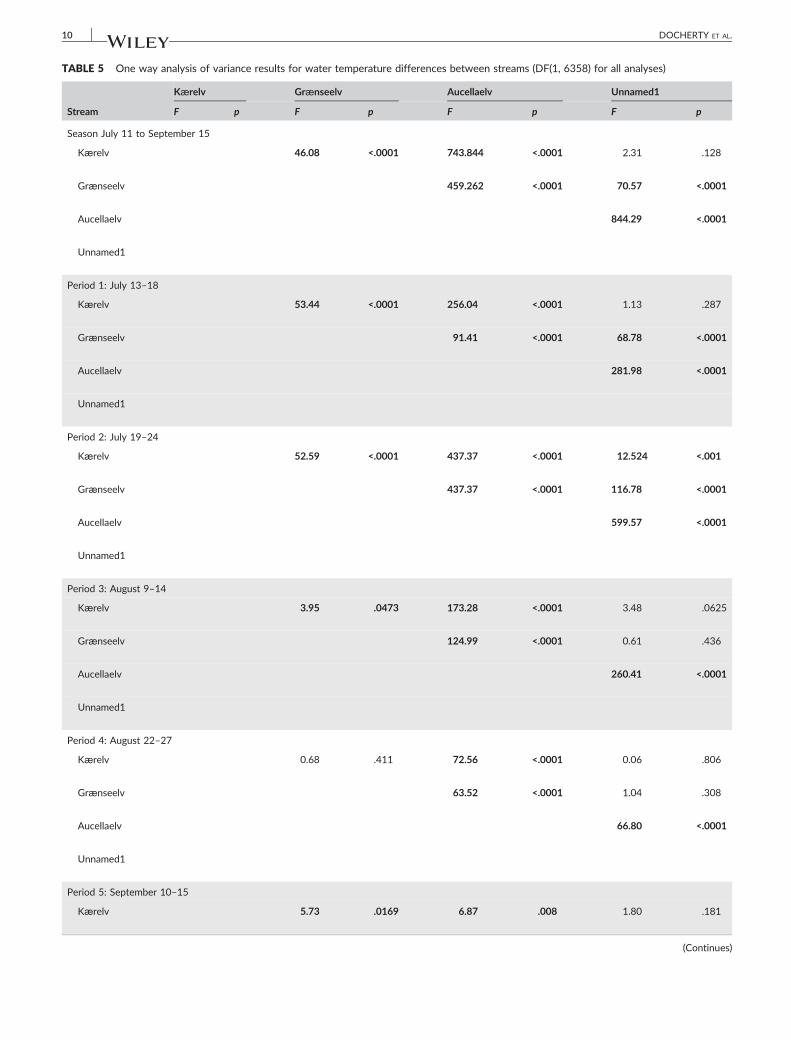
TABLE 5 One way analysis of variance results for water temperature differences between streams (DF(1, 6358) for all analyses)
Stream
Kærelv Grænseelv Aucellaelv Unnamed1
F p F p F p F p
Season July 11 to September 15
Kærelv 46.08 <.0001 743.844 <.0001 2.31 .128
Grænseelv 459.262 <.0001 70.57 <.0001
Aucellaelv 844.29 <.0001
Unnamed1
Period 1: July 13–18
Kærelv 53.44 <.0001 256.04 <.0001 1.13 .287
Grænseelv 91.41 <.0001 68.78 <.0001
Aucellaelv 281.98 <.0001
Unnamed1
Period 2: July 19–24
Kærelv 52.59 <.0001 437.37 <.0001 12.524 <.001
Grænseelv 437.37 <.0001 116.78 <.0001
Aucellaelv 599.57 <.0001
Unnamed1
Period 3: August 9–14
Kærelv 3.95 .0473 173.28 <.0001 3.48 .0625
Grænseelv 124.99 <.0001 0.61 .436
Aucellaelv 260.41 <.0001
Unnamed1
Period 4: August 22–27
Kærelv 0.68 .411 72.56 <.0001 0.06 .806
Grænseelv 63.52 <.0001 1.04 .308
Aucellaelv 66.80 <.0001
Unnamed1
Period 5: September 10–15
Kærelv 5.73 .0169 6.87 .008 1.80 .181
(Continues)
10 DOCHERTY ET AL.
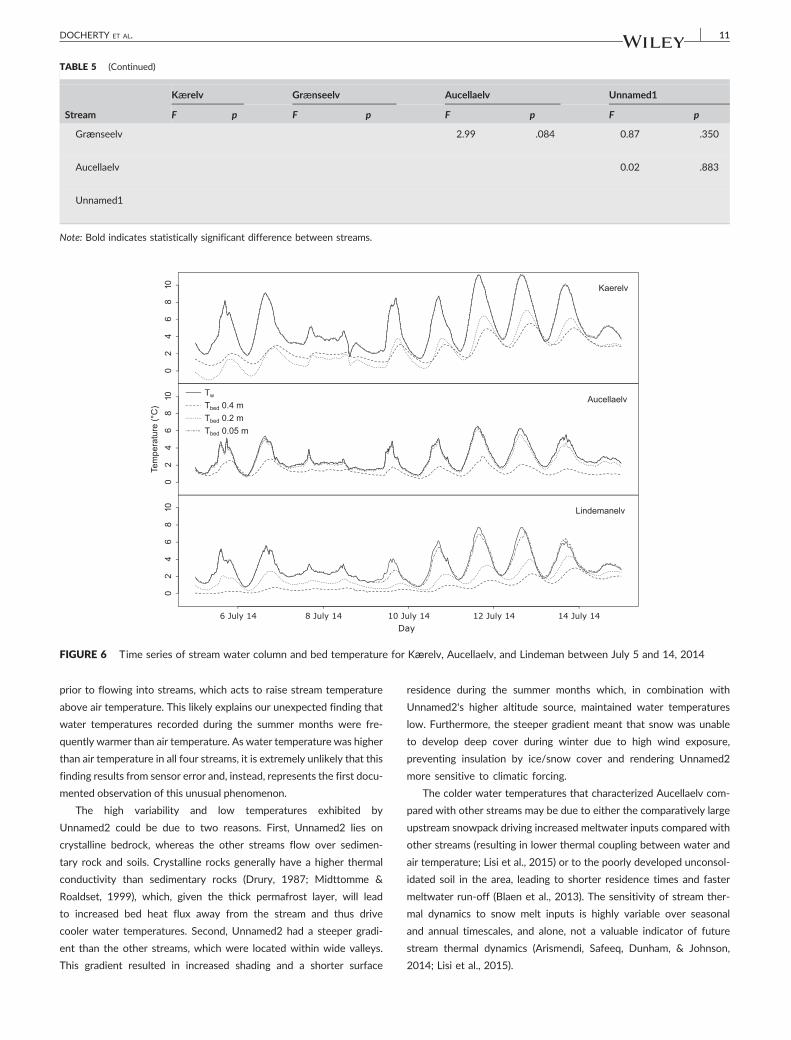
TABLE 5 (Continued)
Stream
Kærelv Grænseelv Aucellaelv Unnamed1
F p F p F p F p
Grænseelv 2.99 .084 0.87 .350
Aucellaelv 0.02 .883
Unnamed1
Note: Bold indicates statistically significant difference between streams.
FIGURE 6 Time series of stream water column and bed temperature for Kærelv, Aucellaelv, and Lindeman between July 5 and 14, 2014
DOCHERTY ET AL. 11
prior to flowing into streams, which acts to raise stream temperature
above air temperature. This likely explains our unexpected finding that
water temperatures recorded during the summer months were fre-
quently warmer than air temperature. As water temperature was higher
than air temperature in all four streams, it is extremely unlikely that this
finding results from sensor error and, instead, represents the first docu-
mented observation of this unusual phenomenon.
The high variability and low temperatures exhibited by
Unnamed2 could be due to two reasons. First, Unnamed2 lies on
crystalline bedrock, whereas the other streams flow over sedimen-
tary rock and soils. Crystalline rocks generally have a higher thermal
conductivity than sedimentary rocks (Drury, 1987; Midttomme &
Roaldset, 1999), which, given the thick permafrost layer, will lead
to increased bed heat flux away from the stream and thus drive
cooler water temperatures. Second, Unnamed2 had a steeper gradi-
ent than the other streams, which were located within wide valleys.
This gradient resulted in increased shading and a shorter surface
residence during the summer months which, in combination with
Unnamed2's higher altitude source, maintained water temperatures
low. Furthermore, the steeper gradient meant that snow was unable
to develop deep cover during winter due to high wind exposure,
preventing insulation by ice/snow cover and rendering Unnamed2
more sensitive to climatic forcing.
The colder water temperatures that characterized Aucellaelv com-
pared with other streams may be due to either the comparatively large
upstream snowpack driving increased meltwater inputs compared with
other streams (resulting in lower thermal coupling between water and
air temperature; Lisi et al., 2015) or to the poorly developed unconsol-
idated soil in the area, leading to shorter residence times and faster
meltwater run‐off (Blaen et al., 2013). The sensitivity of stream ther-
mal dynamics to snow melt inputs is highly variable over seasonal
and annual timescales, and alone, not a valuable indicator of future
stream thermal dynamics (Arismendi, Safeeq, Dunham, & Johnson,
2014; Lisi et al., 2015).
12 DOCHERTY ET AL.
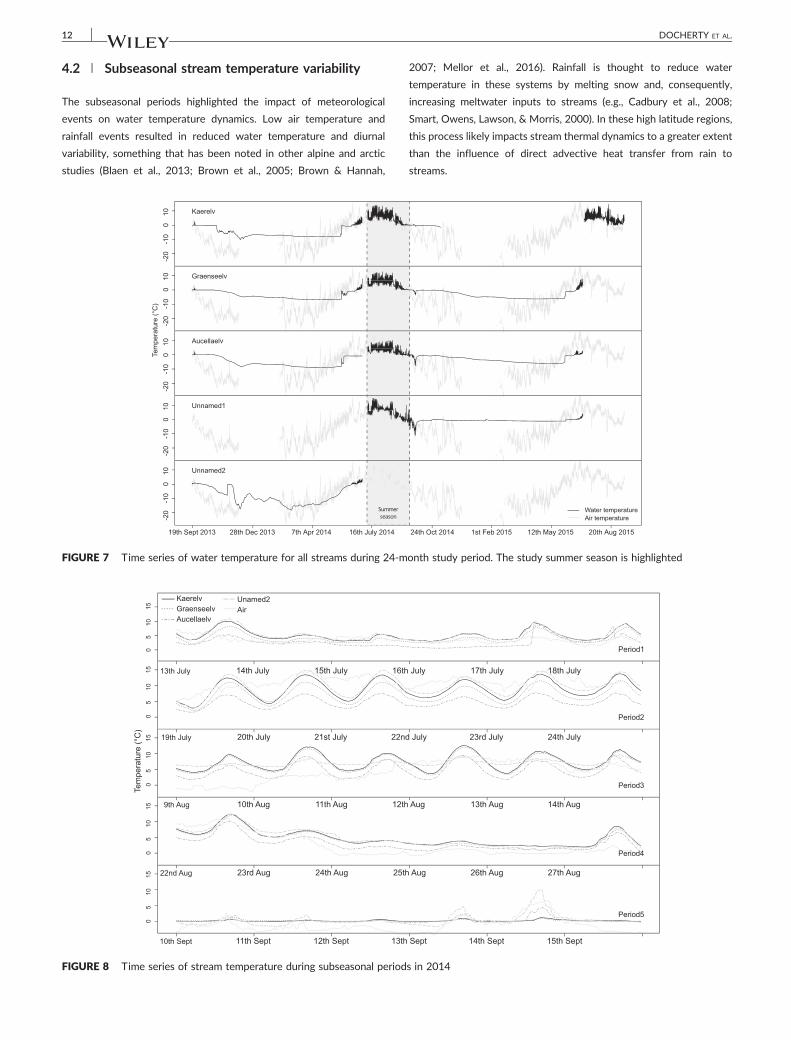
4.2 | Subseasonal stream temperature variability
The subseasonal periods highlighted the impact of meteorological
events on water temperature dynamics. Low air temperature and
rainfall events resulted in reduced water temperature and diurnal
variability, something that has been noted in other alpine and arctic
studies (Blaen et al., 2013; Brown et al., 2005; Brown & Hannah,
FIGURE 8 Time series of stream temperature during subseasonal period
FIGURE 7 Time series of water temperature for all streams during 24‐m
2007; Mellor et al., 2016). Rainfall is thought to reduce water
temperature in these systems by melting snow and, consequently,
increasing meltwater inputs to streams (e.g., Cadbury et al., 2008;
Smart, Owens, Lawson, & Morris, 2000). In these high latitude regions,
this process likely impacts stream thermal dynamics to a greater extent
than the influence of direct advective heat transfer from rain to
streams.
s in 2014
onth study period. The study summer season is highlighted
DOCHERTY ET AL. 13
Early in the summer season, water temperatures were predomi-
nantly controlled by the large snow melt inputs (Brown, Hannah, &
Milner, 2006; Blaen et al., 2013) where the advective fluxes from
these cold water inputs exceed surface energy exchanges (Leach &
Moore, 2014; Lisi et al., 2015). Coupling of water and air temperatures
is known to increase towards the end of summer with the decrease in
meltwater inputs (Blaen et al., 2013; Malard, Tockner, & Ward, 1999).
The largest difference in thermal regimes between streams was
during peak summer months, with streams became increasingly
thermally‐similar towards autumn and into winter (excluding
Unnamed2) as found in other studies (Caissie, Satish, & El‐Jabi,
2005). The air–water temperature coupling is known to break down
when air temperatures drop below 0°C, (Mohseni & Stefan, 1999).
August 28 marked the start of a steady decrease in water tempera-
tures, corresponding to reduced incoming SWR. During late summer,
the streambed could play an important role in stream temperature
dynamics whereby the residual ground heat accumulated over summer
results in a thermal gradient that heats the water column (Alexander,
MacQuarrie, Cassie, & Butler, 2003) and due also to the increased
importance of groundwater inputs caused by the active layer being
at its deepest (Rasch et al., 2000).
4.3 | Global context and implications of a changingclimate
The results from this study in Greenland fit into the growing body of
literature on high resolution stream temperature dynamics throughout
Arctic and Alpine regions. Zackenberg streams showed high temporal
variability in water temperature compared with sites in Svalbard (Blaen
et al., 2013), Swedish Lapland (Mellor et al., 2016), the New Zealand
Alps (Cadbury et al., 2008), and the European Pyrenees (Brown et al.,
2005). They also showed higher mean water temperatures compared
with groundwater and snowmelt streams studied at a similar latitude
(79°N) in Svalbard (Blaen et al., 2013).
The lower latitude of Zackenberg compared with Svalbard means
that streams receive higher SWR inputs. However, Zackenberg
receives lower SWR inputs when compared with alpine areas. The
higher variability in stream temperature at Zackenberg compared with
other areas could therefore be due to the reduced importance of
groundwater inputs, as seen by the low stream bed temperatures indi-
cating the very shallow active layer in some parts of the valley.
Groundwater inputs normally act to stabilize water temperature
(Constantz, 1998), and their absence or reduced importance could
therefore explain the variable stream temperatures observed in this
study.
Zackenberg streams are predicted to receive increased snowmelt
run‐off and groundwater inputs by the end of the century due to
increased snow depth and active layer thickness. This could potentially
engender a weaker coupling between water temperature and climatic
forcing. Streambed heat flux could become an increasingly important
factor influencing stream thermal dynamics due to warmer bed tem-
peratures and increased soil water influxes to stream environments.
This, combined with a shift towards lower channel stability, could lead
to reduced summer water temperature variability, causing thermal
dynamics in Zackenberg streams to be increasingly similar to those in
other Arctic and Alpine regions where groundwater inputs moderate
temperature dynamics. Conversely, the predicted increase in summer
rainfall events could lead to more frequent short‐term cool spells. Dur-
ing the winter, an increase in air temperature and the number of thaw
days could see increased water temperature variability.
Changes in water temperature regimes could have ecosystem‐wide
implications. Previous studies have found water temperature changes
to impact in‐stream processes such as nutrient uptake (Blaen et al.,
2014) as well as causing changes to biological community structure,
abundance, and diversity (Adams et al., 2010; Brown, Hannah, &
Milner, 2007; Jacobsen, Milner, Brown, & Dangles, 2012; Madsen et
al., 2015; Milner, Brittain, Castella, & Petts, 2001; Vincent & Howard
Williams, 1989). Given this, research on Arctic water temperature
dynamics and drivers is vital in order to better understand changes
to wider ecosystem processes under a changing climate.
Future studies on water temperature in the Zackenberg region
would benefit from more frequent discharge measurements, which
are lacking in the present study. These data would allow better com-
parison between streams and of seasonal variability, taking stream size
into account when comparing water temperature dynamics.
5 | CONCLUSION
This paper contributes to the growing body of literature on Arctic
stream thermal dynamics by providing insights into Greenlandic
streams, particularly snowmelt‐dominated systems that are currently
underrepresented in the literature and by providing a detailed descrip-
tion of thermal dynamics during the winter months for the first time.
Spatial and temporal variation in stream thermal dynamics is largely
related to a combination of climatological conditions, geology, and
local geomorphology. With the projected change in climate,
Zackenberg streams will be subjected to increased snowmelt run‐off
and groundwater inputs due to increased snow depth and active layer
thickness, possibly leading to a weaker coupling between water tem-
perature and climatic forcing. Changes in water temperature regimes
could impact in‐stream processes such as nutrient uptake as well as
causing changes to biological community structure, abundance, and
diversity. Although stream temperature was highly coupled with mete-
orological variables during the summer months, during the winter,
streams were mainly frozen to the stream bed or did not flow. Further
research into the relationship between snow depth and water temper-
ature in Arctic streams as well as on the meteorological drivers of
spring flow resumption and autumn freeze‐up in streams is necessary
to fully understand the impact of a changing climate on these sensitive
systems.
Data availability statement
Data that support the findings of this study are available from the cor-
responding author upon reasonable request.
14 DOCHERTY ET AL.
ACKNOWLEDGEMENTS
Catherine Docherty was funded by a Natural Environment Research
Council (NERC) studentship (NE/L501712/1). Fieldwork to
Zackenberg was funded through the European Union Seventh Frame-
work Programme (FP7/2007–2013) under grant 262693 (INTERACT).
Climate data from the Greenland Ecosystem Monitoring Programme
were provided by Asiaq ‐ Greenland Survey and the Department of
Bioscience, Aarhus University, Denmark in collaboration with Depart-
ment of Geosciences and Natural Resource Management, Copenhagen
University, Denmark. The authors thank Biobasis, Geobasis and
Zackenberg logistics for all of their field assistance. We thank Chantal
Jackson for Figure 1. We appreciated the considered and constructive
comments of the two anonymous reviewers. Professor Geoff Petts
provided huge inspiration as exceptional academic, mentor, and friend,
and he kindled some of the authors' interest in river water tempera-
ture and cold region hydroecology.
ORCID
Stephen J. Dugdale https://orcid.org/0000-0003-3561-4216
David M. Hannah https://orcid.org/0000-0003-1714-1240
REFERENCES
Adams, H. E., Crump, B. C., & Kling, G. W. (2010). Temperature controls on
aquatic bacterial production and community dynamics in arctic lakes
and streams. Environmental Microbiology, 12, 1319–1333. https://doi.org/10.1111/j.1462‐2920.2010.02176.x
Alexander, M.N., MacQuarrie, K.T.B., Cassie, D. & Butler, K.E. (2003). The
thermal regime of shallow groundwater and a small Atlantic salmon
stream bordering a clearcut with a forested streamside buffer, In:
Annual Conference of the Canadian Society for Civil Engineering,
Moncton, NB, June 4–7, 2003, GCL‐343, 10p. Canadian Society for
Civil Engineering, Montreal, Quebec, (Canada).
Anderson, S. P. (2005). Glaciers show direct linkage between erosion rate
and chemical weathering fluxes. Geomorphology, 67, 147–157.https://doi.org/10.1016/j.geomorph.2004.07.010
Anisimov, O. A., Vaughan, D. G., Callaghan, T. V., Furgal, C., Marchant, H.,
Prowse, T. D., … Walsh, J. E. (2007). Polar regions (Arctic and Antarctic).
Climate Change 2007: Impacts, adaptation and vulnerability. In M. L.
Parry, O. F. Canziani, J. P. Palutikof, P. J. van der Linden, & C. E. Hanson
(Eds.), Contribution of Working Group II to the Fourth Assessment Report
of the Intergovernmental Panel on Climate Change (pp. 653–685). Cam-
bridge: Cambridge University Press.
Arismendi, I., Safeeq, M., Dunham, J. B., & Johnson, S. L. (2014). Can air
temperatures be used to project influences of climate change on
stream temperature. Environmental Research Letters, 9, 1–12.
Bay, C. (1998). Vegetation mapping of Zackenberg Valley, Northeast
Greenland. Danish Polar Center & Botanical Museum, University of
Copenhagen, 1–29.
Blaen, P. J., Hannah, D. M., Brown, L. E., & Milner, A. M. (2013). Water tem-
perature dynamics in high Arctic river basins. Hydrological Processes, 27
(20), 2958–2972.
Blaen, P. J., Milner, A. M., Hannah, D. M., Brittain, J. E., & Brown, L. E.
(2014). Impact of changing hydrology on nutrient uptake in high Arctic
rivers. River Research and Applications, 30, 1073–1083.
Brown, J. H., Gillooly, J. F., Allen, A. P., Savage, V. M., & West, G. B. (2004).
Toward a metabolic theory of ecology. Ecology, 85(7), 1771–1789.https://doi.org/10.1890/03‐9000
Brown, L. E., & Hannah, D. M. (2007). Alpine stream temperature response
to storm events. Journal of Hydrometeorology, 8, 952–967. https://doi.org/10.1175/JHM597.1
Brown, L. E., Hannah, D. M., & Milner, A. M. (2005). Spatial and temporal
water column and streambed temperature dynamics within an alpine
catchment: Implications for benthic communities. Hydrological Pro-
cesses, 19, 1585–1610. https://doi.org/10.1002/hyp.5590
Brown, L. E., Hannah, D. M., & Milner, A. M. (2006). Thermal variability and
stream flow permanency in an alpine river system. River Research and
Applications, 22, 493–501. https://doi.org/10.1002/rra.915
Brown, L. E., Hannah, D. M., & Milner, A. M. (2007). Vulnerability of alpine
stream biodiversity to shrinking glaciers and snowpacks. Global Change
Biology, 13, 958–966. https://doi.org/10.1111/j.1365‐2486.2007.01341.x
Cadbury, S. L., Hannah, D. M., Milner, A. M., Pearson, C. P., & Brown, L. E.
(2008). Stream temperature dynamics within a New Zealand glacierized
river basin. River Research and Applications, 24, 68–89.
Caissie, D. (2006). The thermal regime of rivers: A review. Freshwater Biol-
ogy, 51, 1389–1406. https://doi.org/10.1111/j.1365‐2427.2006.01597.x
Caissie, D., Satish, M. G., & El‐Jabi, N. (2005). Predicting river water tem-
peratures using the equilibrium temperature concept with application
on Miramichi River catchments (New Brunswick, Canada). Hydrological
Processes, 19, 2137–2159. https://doi.org/10.1002/hyp.5684
Castella, E., Adalsteinsson, H., Brittain, J. E., Gislasson, G. M., Lehmann, A.,
Lencioni, V., … Snook, D. L. (2001). Macrobenthic invertebrate richness
and composition along a latitudinal gradient of European glacier‐fedstreams. Freshwater Biology, 46, 1811–1831. https://doi.org/10.1046/j.1365‐2427.2001.00860.x
Chapman, W. L., & Walsh, J. E. (2007). Simulations of Arctic temperature
and pressure by global coupled models. Journal of Climate, 20,
609–632. https://doi.org/10.1175/JCLI4026.1
Christiansen, H. H., Sisgaard, C., Humlum, O., Rasch, M., & Hansen, B.
(2008). Permafrost and Periglacial Geomorphology at Zackenberg.
Advances in Ecological Research, High‐Arctic Ecosystem Dynamics in a
Changing Climate, 40, 151–174. https://doi.org/10.1016/S0065‐2504(07)00007‐4
Comiso, J. C., & Hall, D. K. (2014). Climate trends in the Arctic as observed
from space. Wiley Interdisciplinary Reviews: Climate Change, 5, 389–409.https://doi.org/10.1002/wcc.277
Comola, F., Schaefli, B., Rinaldo, A., & Lehning, M. (2015). Thermodynamics
in the hydrologic response: Travel time formulation and application to
Alpine catchments. Water Resources Research, 51, 1671–1687.https://doi.org/10.1002/2014WR016228
Constantz, J. (1998). Interaction between stream temperature, streamflow,
and groundwater exchanges in alpine streams. Water Resources
Research, 34, 1609–1615. https://doi.org/10.1029/98WR00998
Cory, R. M., Crump, B. C., Dobkowski, J. A., & Kling, G. W. (2013). Surface
exposure to sunlight stimulates CO2 release from permafrost soil car-
bon in the Arctic. Proceedings of the National Academy of Sciences of
the United States of America, 110, 3429–3434. https://doi.org/
10.1073/pnas.1214104110
Dahlke, H. E., Stedinger, J. R., Rosquist, G., & Jansson, P. (2012). Contrast-
ing trends in floods for two sub‐arctic catchments in northern Sweden
—Does glacier presence matter? Hydrology and Earth System Sciences,
16, 2123–2141. https://doi.org/10.5194/hess‐16‐2123‐2012
DOCHERTY ET AL. 15
Drury, M. J. (1987). Thermal diffusivity of some crystalline rocks.
Geothermics, 16, 105–115. https://doi.org/10.1016/0375‐6505(87)90059‐9
Dyurgerov, M. B., & Meier, M. F. (2000). Twentieth century climate change:
Evidence from small glaciers. Proceedings of the National Academy of
Sciences of the United States of America, 97, 1406–1411.
Elberling, B., Tamstrof, M. P.,Michelsen, A., Arndal, M. F., Sigsgaard, C., Illeris,
L., … Jakobsen, B. H. (2008). Soil and plant community—Characteristics
and dynamics at Zackenberg. Advances in Ecological Research, 40,
223–248. https://doi.org/10.1016/S0065‐2504(07)00010‐4
Evans, E. C., McGregor, G. R., & Petts, G. E. (1998). River energy budgets
with special reference to river bed processes. Hydrological Processes,
12, 575–595. https://doi.org/10.1002/(SICI)1099‐1085(19980330)12:4<575::AID‐HYP595>3.0.CO;2‐Y
Finn, D. S., Khamis, K., & Milner, A. M. (2013). Loss of small glaciers will
diminish beta diversity in Pyrenean streams at two levels of biological
organisation. Global Ecology and Biogeography, 22, 40–51. https://doi.org/10.1111/j.1466‐8238.2012.00766.x
Foster, J. L., Robinson, D., Hall, D. K., & Estilow, T. W. (2008). Spring snow
melt timing and changes over Arctic lands. Polar Geography, 31,
145–157. https://doi.org/10.1080/10889370802580185
Friberg, N., Bergfur, J., Rasmussen, J., & Sandin, L. (2013). Changing North-
ern catchments: Is altered hydrology, temperature or both going to
shape future stream communities and ecosystem processes? Hydrolog-
ical Processes, 27, 734–740. https://doi.org/10.1002/hyp.9598
Friberg, N., Milner, A. M., Svendsen, L. M., Lindegaard, C., & Larsen, S. E.
(2001). Macroinvertebrate stream communities along regional and
physico‐chemical gradients in Western Greenland. Freshwater Biology,
46, 1753–1764. https://doi.org/10.1046/j.1365‐2427.2001.00857.x
Garner, G., Malcolm, I. A., Sadler, J. P., & Hannah, D. M. (2014). What
causes cooling water temperature gradients in a forested stream reach?
Hydrology and Earth System Science, 18, 5361–5376. https://doi.org/10.5194/hess‐18‐5361‐2014
Han, L. (1997). Spectral reflectance with varying suspended sediment con-
centrations in clear and algae‐laden waters. Photogrammetric
Engineering and Remote Sensing, 63, 701–705.
Hansen, B. U., Sigsgaard, C., Rasmussen, L., Cappelen, J., Hinkler, J., Mernild,
S. H., … Hasholt, B. (2008). Present‐day climate at Zackenberg. In High
Arctic Ecosystem Dynamics in a Changing Climate (Vol. 40). Advances in
Ecological Research. (pp. 111–147). London: Academic Press.
Hasholt, B., & Hagedorn, B. (2000). Hydrology and geochemistry of river‐borne material in a high arctic drainage system, Zackenberg, Northeast
Greenland. Arctic, Antarctic, and Alpine Research, 32, 84–94. https://doi.org/10.1080/15230430.2000.12003342
Hasholt, B., Mernild, S. H., Sigsgaard, C., Elberling, B., Petersen, D.,
Jakobsen, B. J., … Søgaard, H. (2008). Hydrology and transport of sed-
iment and solutes at Zackenberg. In High‐Arctic ecosystem dynamics in a
changing climate (Vol. 40). Advances in Ecological Research. (pp.
197–220). London: Academic Press.
Hinkler, J., Hansen, B. U., Tamstorf, M. P., Sigsgaard, C., & Petersen, D.
(2008). Snow and snow‐cover in central Northeast Greenland. In
High‐Arctic Ecosystem Dynamics in a Changing Climate (Vol. 40).
Advances in Ecological Research. (pp. 175–195). London: Academic
Press.
Hollesen, J., Elberling, B., & Jansson, P. E. (2011). Future active layer
dynamics and carbon dioxide production from thawing permafrost
layers in Northeast Greenland. Global Change Biology, 17, 911–926.https://doi.org/10.1111/j.1365‐2486.2010.02256.x
Hyndman, R. J. (2016). Forecast: Forecasting functions for time series and
linear models. Available from: http://cran.r‐project.org/web/packages/
forecast/index.html
Jacobsen, D., Milner, A. M., Brown, L. E., & Dangles, O. (2012). Biodiversity
under threat in glacier‐fed river systems. Nature Climate Change, 2,
361–364. https://doi.org/10.1038/nclimate1435
Khamis, K., Hannah, D. M., Brown, L. E., & Milner, A. M. (2015). Heat
exchange processes and thermal dynamics of a glacier‐fed alpine
stream. Hydrological Processes, 29, 3306–3317. https://doi.org/
10.1002/hyp.10433
King, T. V., Neilson, B. T., Overbeck, L. D., & Kane, D. L. (2016). Water tem-
perature controls in low arctic rivers. Water Resources Research, 52,
4358–4376.
Ladegaard‐Pedersen, P., Sigsgaard, C., Kroon, A., Abermann, J., Skov, K., &
Elberling, B. (2016). Suspended sediment in a high‐Arctic river: An
appraisal of flux estimation methods. Science of the Total Environment,
580, 582–592.
Leach, J. A., & Moore, R. D. (2014). Winter stream temperature in the rain‐on‐snow zone of the Pacific Northwest: Influences of hillslope runoff
and transient snow cover. Hydrology and Earth System Sciences, 18,
819–838. https://doi.org/10.5194/hess‐18‐819‐2014
Lisi, P. J., Schindler, D. E., Cline, T. J., Scheuerell, M. D., & Walsh, P. B.
(2015). Watershed geomorphology and snowmelt control stream ther-
mal sensitivity to air temperature. Geophysical Research Letters, 42,
3380–3388. https://doi.org/10.1002/2015GL064083
MacDonald, R. J., Boons, S., Byrne, J. M., & Silins, U. (2014). A comparison
of surface and subsurface controls on summer temperature in a head-
water stream. Hydrological Processes, 28, 2338–2347. https://doi.org/10.1002/hyp.9756
Madsen, P. B., Morabowen, A., Andino, P., Espinosa, R., Cauvy‐Fraunié, S.,Dangles, O., & Jacobsen, D. (2015). Altitudinal distribution limits of
aquatic macroinvertebrates: an experiemntal test in a tropical alpine
stream. Ecological Entomology, 40, 629–638. https://doi.org/10.1111/een.12232
Malard, F., Tockner, K., & Ward, J. V. (1999). Shifting dominance of
subcatchment water sources and flow paths in a glacial floodplain,
Val Roseg, Switzerland. Arctic, Antarctic, and Alpine Research, 31,
135–150. https://doi.org/10.1080/15230430.1999.12003291
McNamara, J. P., Kane, D. L., Hobbie, J. E., & Kling, G. W. (2008). Hydro-
logic and biogeochemical controls on the spatial and temporal
patterns of nitrogen and phosphorus in the Kuparuk River, arctic
Alaska. Hydrological Processes, 22, 3294–3309.
Mellor, C. J., Dugdale, S. J., Garner, G., Milner, A. M., & Hannah, D. M.
(2016). Controls on Arctic glacier‐fed river water temperature. Hydro-
logical Sciences Journal, 62, 499–514.
Mernild, S. H., Hasholt, B., & Liston, G. E. (2008). Climatic control on river
discharge simulations, Zackenberg River drainage basin, northeast
Greenland. Hydrological Processes, 22, 1932–1948.
Mernild, S. H., Liston, G. E., & Hasholt, B. (2007). Snow‐distribution and
melt modelling for glaciers in Zackenberg river drainage basin, north‐eastern Greenland. Hydrological Processes, 21, 3249–3263. https://
doi.org/10.1002/hyp.6500
Midttomme, K., & Roaldset, E. (1999). Thermal conductivity of sedimentary
rocks: uncertainties in measurement and modelling. In A. C. Aplin, A. J.
Fleet, & J. H. S. Macquaker (Eds.), Muds and mudstones: Physical and
fluid flow properties (Vol. 158). Geologial Society, London, Special Publica-
tions. (pp. 45–60). https://doi.org/10.1144/GSL.SP.1999.158.01.04
Milner, A. M., Brittain, J. E., Castella, E., & Petts, G. E. (2001). Trends of
macroinvertebrate community structure in glacier‐fed rivers in relation
to environmental conditions: a synthesis. Freshwater Biology, 46,
1833–1847. https://doi.org/10.1046/j.1365‐2427.2001.00861.x
Mohseni, O., & Stefan, A. G. (1999). Stream temperature/air temperature
relationship: A physical interpretation. Journal of Hydrology, 218,
128–141.
16 DOCHERTY ET AL.
Overland, J. E., Hanna, E., Hanssen‐Bauer, I., Kim, S.‐J., Walsh, J. E., Wang,
M., … Thoman, R. L. (2015). Surface air temperature. In M. O. Jeffries, J.
Richter‐Menge, & J. E. Overland (Eds.), Arctic report card 2015 (pp.
10–16). Silver Spring, MD: National Oceanic and Atmospheric
Administration.
Rasch, M., Elberling, B., Jakobsen, B. H., & Hasholt, B. (2000). High resolu-
tion measurements of water discharge, sediment and solute transport
in the River Zackenbergelven, Northeast Greenland. Arctic, Antarctic,
and Alpine Research, 32, 336–345. https://doi.org/10.1080/
15230430.2000.12003372
Rawlins, M. A., Steele, M., Holland, M. M., Adam, J. C., Cherry, J. E., Francis,
J. A., … Zhang, T. (2010). Analysis of the Arctic system for freshwater
cycle intensification: Observations and expectations. Journal of Climate,
23, 5715–5737. https://doi.org/10.1175/2010JCLI3421.1
Richards, J., & Moore, R. D. (2011). Discharge dependence of stream
albedo in a steep proglacial channel. Hydrological Processes, 25,
4154–4158. https://doi.org/10.1002/hyp.8343
Rinke, A., & Dethloff, K. (2008). Simulated circum‐Arctic climate changes
by the end of the 21st century. Global and Planetary Change, 62,
173–186. https://doi.org/10.1016/j.gloplacha.2008.01.004
Smart, C. C., Owens, I. F., Lawson, W., & Morris, A. L. (2000). Exceptional
ablation arising from rainfall‐induced slushflows: Brewster Glacier,
New Zealand. Hydrological Processes, 14, 1045–1052. https://doi.org/10.1002/(SICI)1099‐1085(20000430)14:6<1045::AID‐HYP995>3.0.
CO;2‐9
Stendel, M., Christiansen, J. H., & Petersen, D. (2008). Arctic climate and
climate change with a focus on Greenland. In High Arctic Ecosystem
Dynamics in a Changing Climate (Vol. 40). Advances in Ecological
Research. (pp. 13–39). London: Academic Press.
Vaughan, D. G., Comiso, J. C., Allison, I., Carrasco, J., Kaser, G., Kwok, R., …Zhang, T. (2013). Observations: Cryosphere. InT. F. Stocker, D. Qin, G.‐K. Plattner, M. Tignor, S. K. Allen, J. Boschung, et al. (Eds.), Climate
change 2013: The physical science basis. Contribution of Working Group
I to the Fifth Assessment Report of the Intergovernmental Panel on Climate
Change. Cambridge, United Kingdom and New York, NY, USA: Cam-
bridge University Press.
Vincent, W. F., & Howard Williams, C. (1989). Microbial communities in
southern Victoria Land streams (Antarctica) II. The effects of low tem-
perature. Hydrobiologia, 172, 39–49.
van Vliet, M. T. H., Franssen, W. H. P., Yarsley, J. R., Ludwig, F., Haddeland,
I., Lettenmaier, D. P., & Kabat, P. (2013). Global river discharge and
water temperature under climate change. Global Environmental Change,
23, 450–464. https://doi.org/10.1016/j.gloenvcha.2012.11.002
Walsh, J. E., Overland, J. E., Groisman, P. Y., & Rudolf, B. (2011). Ongoing
climate change in the Arctic. Ambio, 40, 6–16. https://doi.org/
10.1007/s13280‐011‐0211‐z
Webb, B. W., Hannah, D. M., Moore, R. D., Brown, L. E., & Nobilis, F. (2008).
Recent advances in stream and river temperature research. Hydrological
Processes, 22, 902–918. https://doi.org/10.1002/hyp.6994
Westermann, S., Elberling, B., Højlund Pedersen, S., Stendel, M., Hansen, B.
U., & Liston, G. E. (2015). Future permafrost conditions along environ-
mental gradients in Zackenberg, Greenland. Cryosphere, 9, 719–735.https://doi.org/10.5194/tc‐9‐719‐2015
White, D., Hinzman, L., Alessa, L., Cassano, J., Chambers, M., Falkner, K., …Zhang, T. (2007). The arctic freshwater system: Changes and impacts.
Journal of Geophysical Research, 112, 1–21.
SUPPORTING INFORMATION
Additional supporting information may be found online in the
Supporting Information section at the end of the article.
How to cite this article: Docherty CL, Dugdale SJ, Milner AM,
Abermann J, Lund M, Hannah DM. Arctic river temperature
dynamics in a changing climate. River Res Applic. 2019.
https://doi.org/10.1002/rra.3537