Architecture Decisions and Risk Management€“ Too many fault messages results in information...
52
Patricia McNair & Lizabeth Markewicz Date: October 27, 2011 Architecture Decisions and Risk Management Copyright © 2010 Raytheon Company. All rights reserved. Customer Success Is Our Mission is a registered trademark of Raytheon Company.
Transcript of Architecture Decisions and Risk Management€“ Too many fault messages results in information...
Patricia McNair & Lizabeth Markewicz
Date: October 27, 2011
Architecture
Decisions and Risk
Management
Copyright © 2010 Raytheon Company. All rights reserved.
Customer Success Is Our Mission is a registered trademark of Raytheon Company.
Architecture Decisions and Risk Management
2
Agenda
Design Heuristics and Principles
Evaluating an Architecture
Evaluating an Architecture with DFSS
3
Design Heuristics and Principles
4

Common Challenges in Architecture
Architecture is a long-term investment, while projects often have aggressive short-term goals
Projects that suffer from schedule compression implicitly prioritize functional requirements over the non-functional requirements We often under-spend on architecture to meet delivery commitments
5
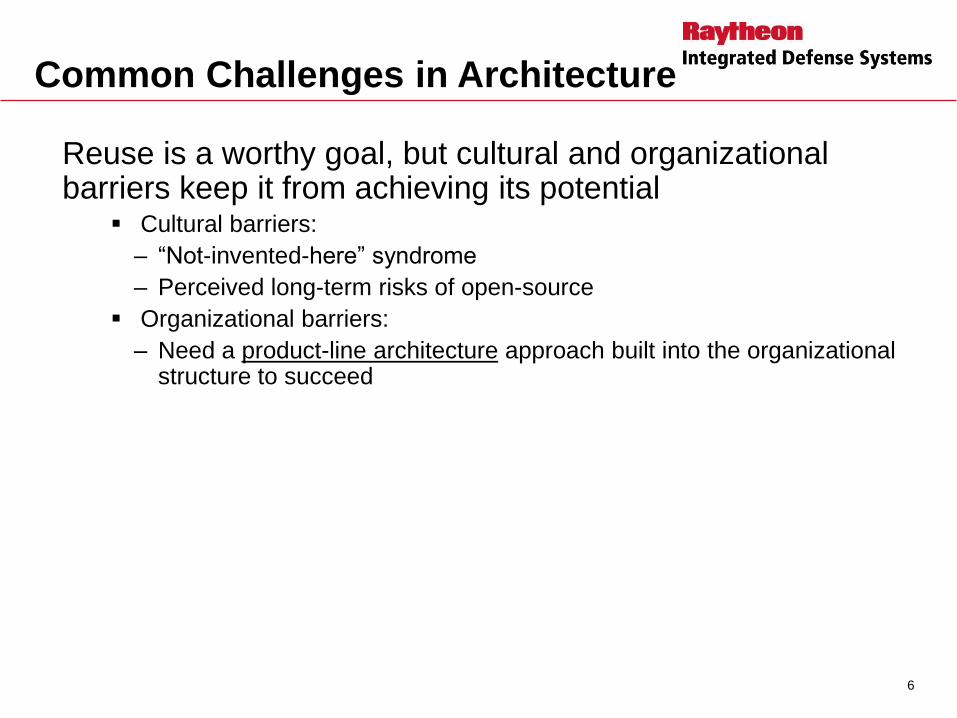
Common Challenges in Architecture
Reuse is a worthy goal, but cultural and organizational barriers keep it from achieving its potential
Cultural barriers:
– “Not-invented-here” syndrome
– Perceived long-term risks of open-source
Organizational barriers:
– Need a product-line architecture approach built into the organizational structure to succeed
6

Common Pitfalls in Architecture
Performance – Not understanding the relative
priorities between performance and other quality attributes
Security – Not being up to speed on modern
techniques
– Not having an architecture roadmap for a product
– Not thinking from hacker‟s perspective
Usability – Allowing for some customer
configuration with excessive parameterization
– Lack of backwards compatibility
Availability
– Creating single points of failure
– Artificially tight constraints
Modifiability
– Excessive reliance on third party
products
– Overshooting on reusability
– Not thinking enough about
reusability
– Not investing in refactoring
– Excessive reliance on experts
instead of documentation
Testability
– Too many fault messages results
in information overload
– Not considering the cost of defect
characterization
7
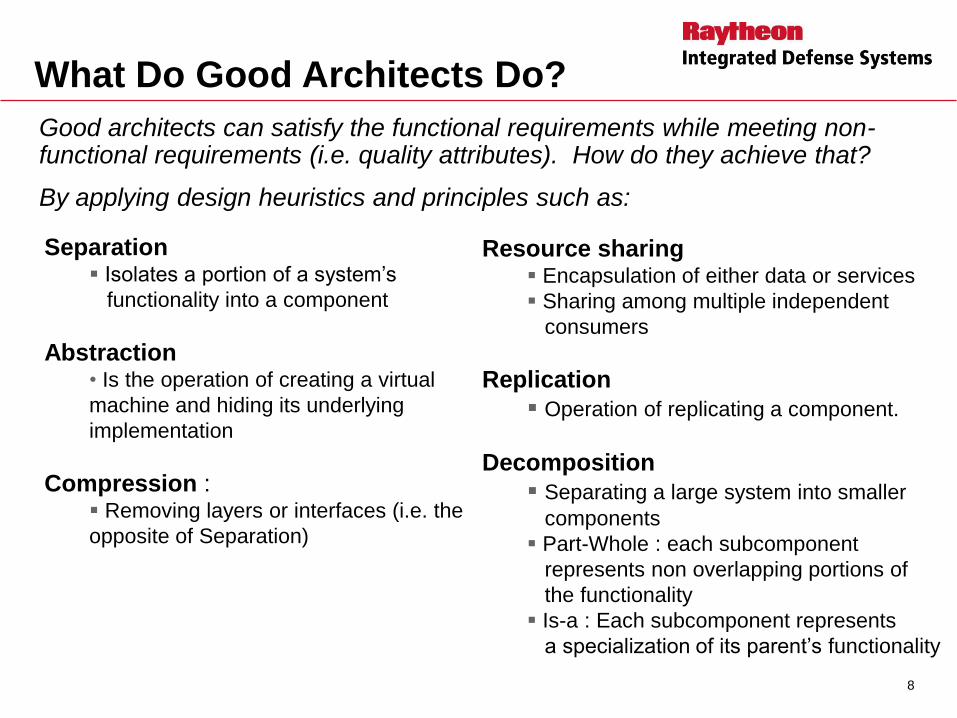
Good architects can satisfy the functional requirements while meeting non-functional requirements (i.e. quality attributes). How do they achieve that?
By applying design heuristics and principles such as:
Separation Isolates a portion of a system‟s
functionality into a component
Abstraction • Is the operation of creating a virtual
machine and hiding its underlying
implementation
Compression : Removing layers or interfaces (i.e. the
opposite of Separation)
What Do Good Architects Do?
Resource sharing Encapsulation of either data or services
Sharing among multiple independent
consumers
Replication
Operation of replicating a component.
Decomposition
Separating a large system into smaller
components
Part-Whole : each subcomponent
represents non overlapping portions of
the functionality
Is-a : Each subcomponent represents
a specialization of its parent‟s functionality
8
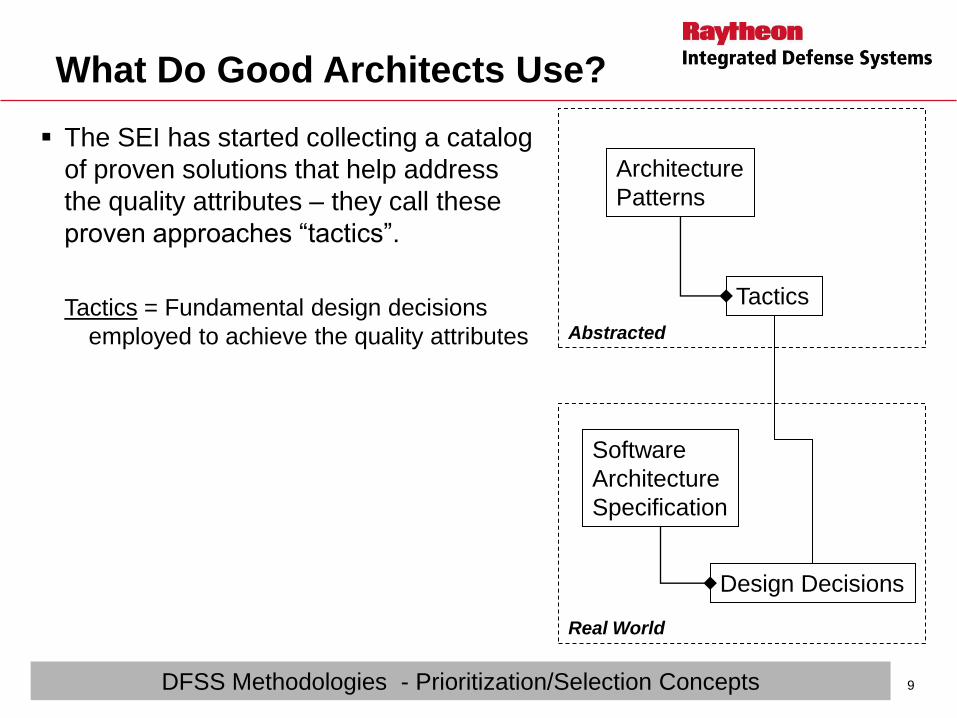
What Do Good Architects Use?
The SEI has started collecting a catalog
of proven solutions that help address
the quality attributes – they call these
proven approaches “tactics”.
Tactics = Fundamental design decisions
employed to achieve the quality attributes
Software
Architecture
Specification
Design Decisions
Tactics
Architecture
Patterns
Real World
Abstracted
DFSS Methodologies - Prioritization/Selection Concepts 9
Good Architects Never Stop Learning
Good architects are continuously learning
Good architects stay on top of industry trends
Good architects balance the risk of change against the
value of the new ideas they may apply to a product
Good architects maintain the architecture documentation
to help the next generation of architects to learn
Good architects strive to optimize the system behavior,
not the product behavior
– Or, similarly, optimize the product more than the component…
10

Evaluating an Architecture
11
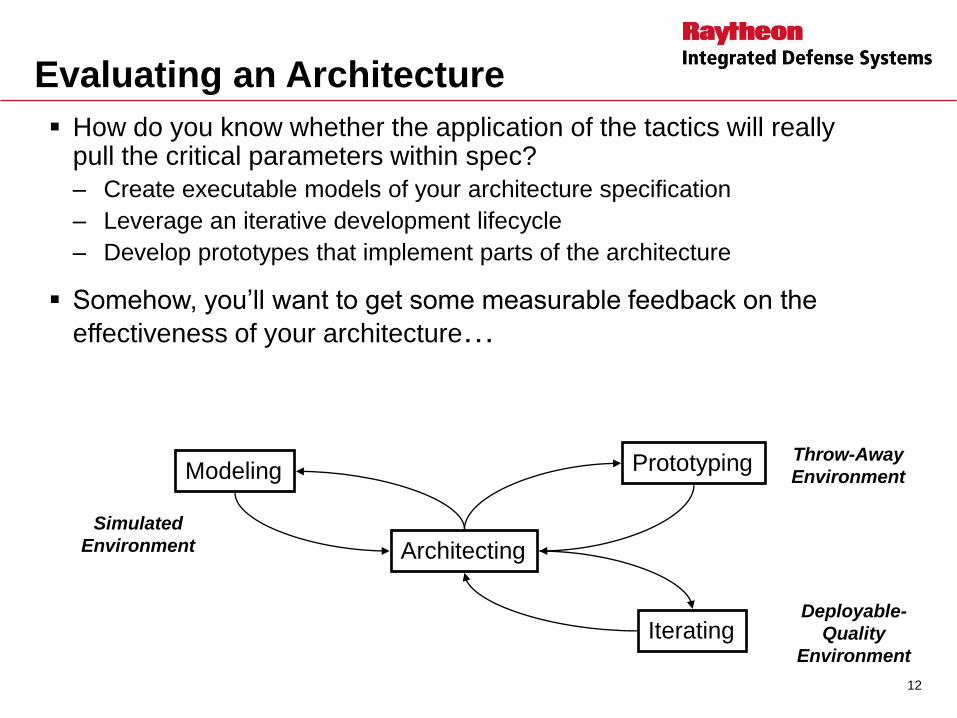
Evaluating an Architecture
How do you know whether the application of the tactics will really pull the critical parameters within spec?
– Create executable models of your architecture specification
– Leverage an iterative development lifecycle
– Develop prototypes that implement parts of the architecture
Somehow, you‟ll want to get some measurable feedback on the
effectiveness of your architecture…
Architecting
Modeling
Iterating
Prototyping Throw-Away
Environment
Deployable-
Quality
Environment
Simulated
Environment
12
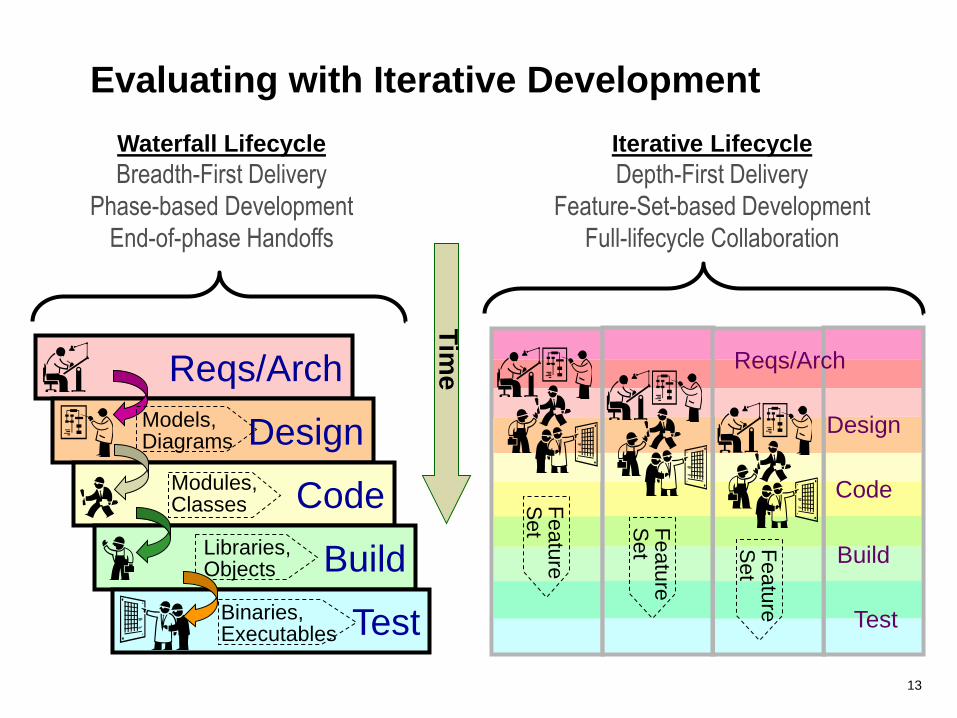
Waterfall Lifecycle
Breadth-First Delivery
Phase-based Development
End-of-phase Handoffs
Iterative Lifecycle
Depth-First Delivery
Feature-Set-based Development
Full-lifecycle Collaboration
Reqs/Arch
Design
Code
Build
Test
Tim
e
Featu
re
Set
Fea
ture
S
et
Featu
re
Set
Design
Code
Build
Test
Reqs/Arch
Evaluating with Iterative Development
Binaries, Executables
Libraries, Objects
Modules, Classes
Models, Diagrams
13

Evaluating with Prototyping
Outline
Requirements
& CPs
Evolutionary
Design
Delivered
System
Throw-away
Prototype
after design
selection
Design
Attributes
Evolutionary Design
An initial prototype is produced
and refined
Iterate through a number
of stages to the final system
Throw-away prototyping
A prototype is produced to help discover attributes associated
with a concept
The results are discarded when design selection is completed.
Resist management's tendency to use/release the throw away
prototype
For Analyze, Use
Throw-away
techniques
Never change a Throw-away prototype to an Evolutionary Design
Create
Prototyping
14
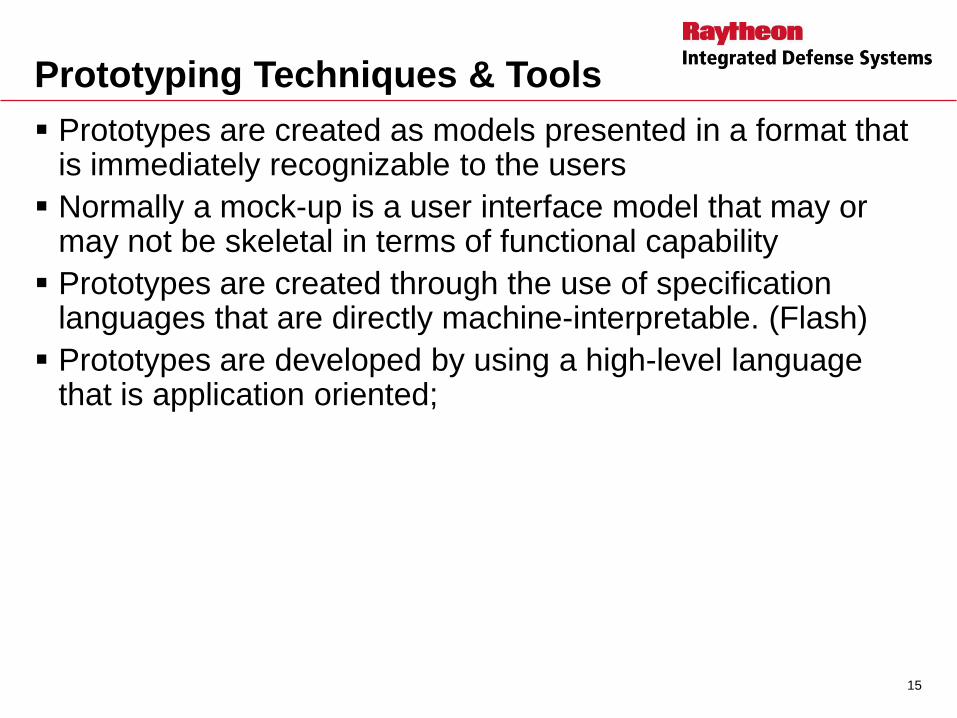
Prototyping Techniques & Tools
Prototypes are created as models presented in a format that is immediately recognizable to the users
Normally a mock-up is a user interface model that may or may not be skeletal in terms of functional capability
Prototypes are created through the use of specification languages that are directly machine-interpretable. (Flash)
Prototypes are developed by using a high-level language that is application oriented;
15
16
Evaluating using Risk Analysis
17
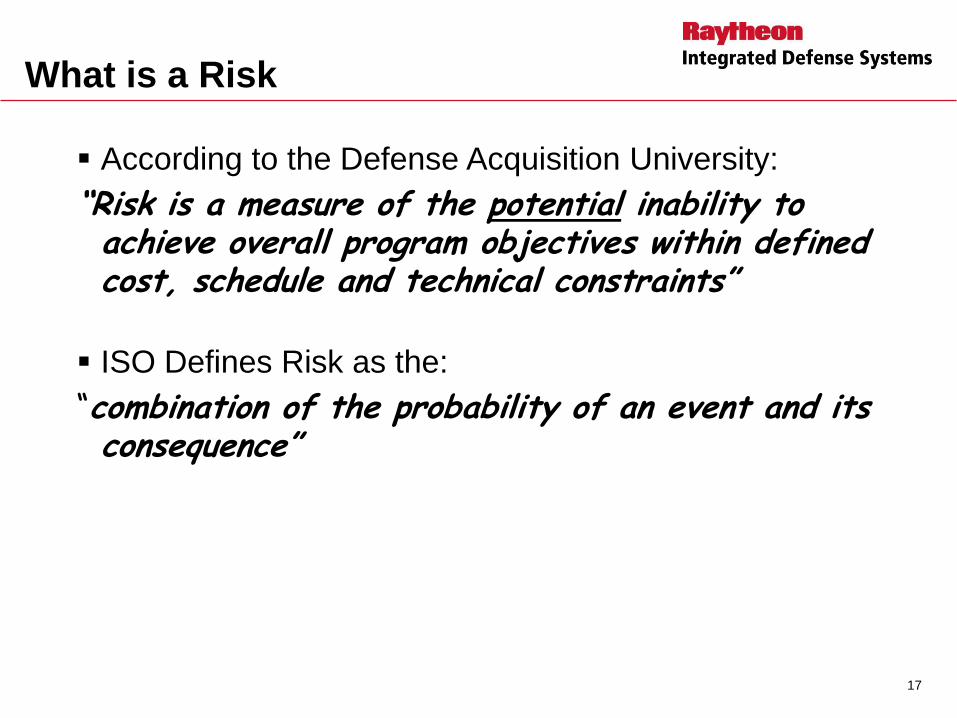
According to the Defense Acquisition University:
“Risk is a measure of the potential inability to achieve overall program objectives within defined cost, schedule and technical constraints”
ISO Defines Risk as the:
“combination of the probability of an event and its consequence”
What is a Risk
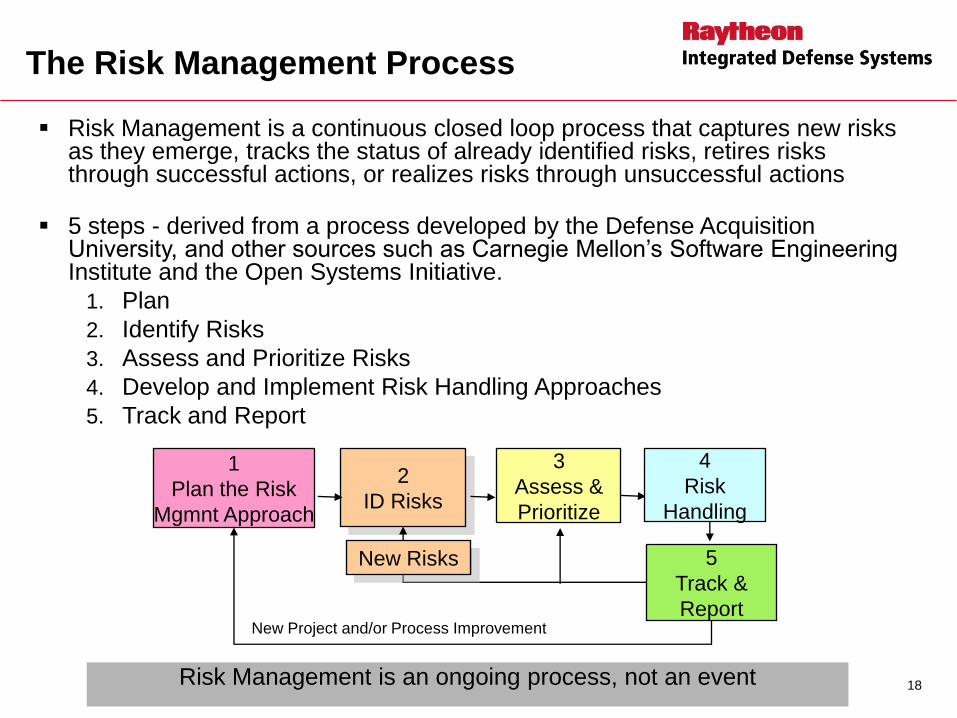
The Risk Management Process
Risk Management is a continuous closed loop process that captures new risks as they emerge, tracks the status of already identified risks, retires risks through successful actions, or realizes risks through unsuccessful actions
5 steps - derived from a process developed by the Defense Acquisition University, and other sources such as Carnegie Mellon‟s Software Engineering Institute and the Open Systems Initiative.
1. Plan
2. Identify Risks
3. Assess and Prioritize Risks
4. Develop and Implement Risk Handling Approaches
5. Track and Report
Risk Management is an ongoing process, not an event
1
Plan the Risk
Mgmnt Approach
2
ID Risks
3
Assess &
Prioritize
5
Track &
Report New Project and/or Process Improvement
18
New Risks
4
Risk
Handling
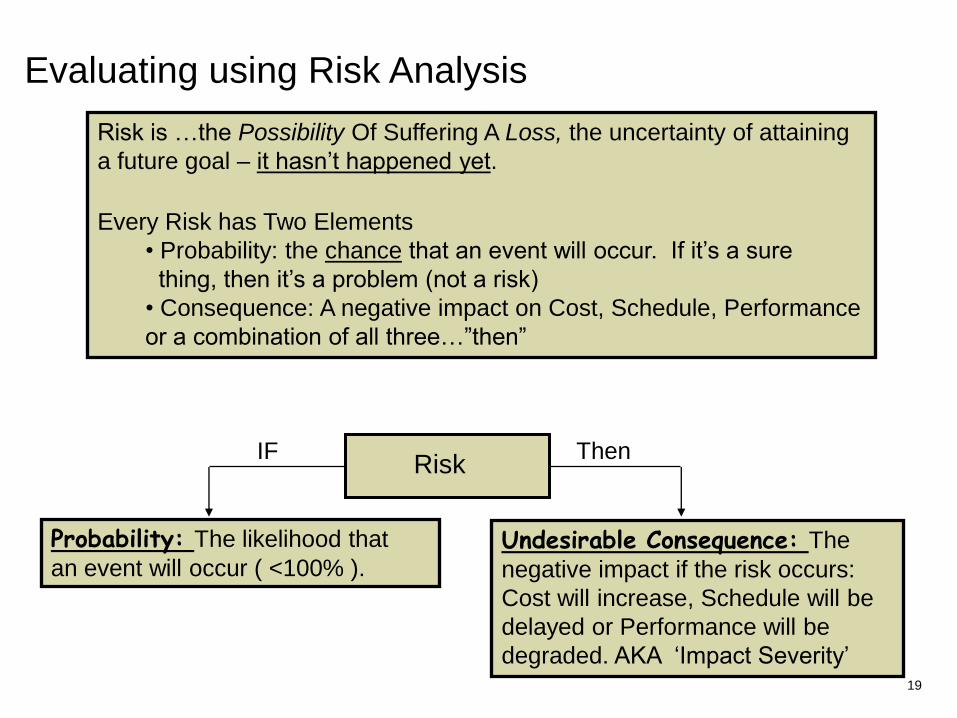
Risk is …the Possibility Of Suffering A Loss, the uncertainty of attaining
a future goal – it hasn‟t happened yet.
Every Risk has Two Elements
• Probability: the chance that an event will occur. If it‟s a sure
thing, then it‟s a problem (not a risk)
• Consequence: A negative impact on Cost, Schedule, Performance
or a combination of all three…”then”
Probability: The likelihood that
an event will occur ( <100% ). Undesirable Consequence: The
negative impact if the risk occurs:
Cost will increase, Schedule will be
delayed or Performance will be
degraded. AKA „Impact Severity‟
Risk IF Then
Evaluating using Risk Analysis
19
Risk Assessment
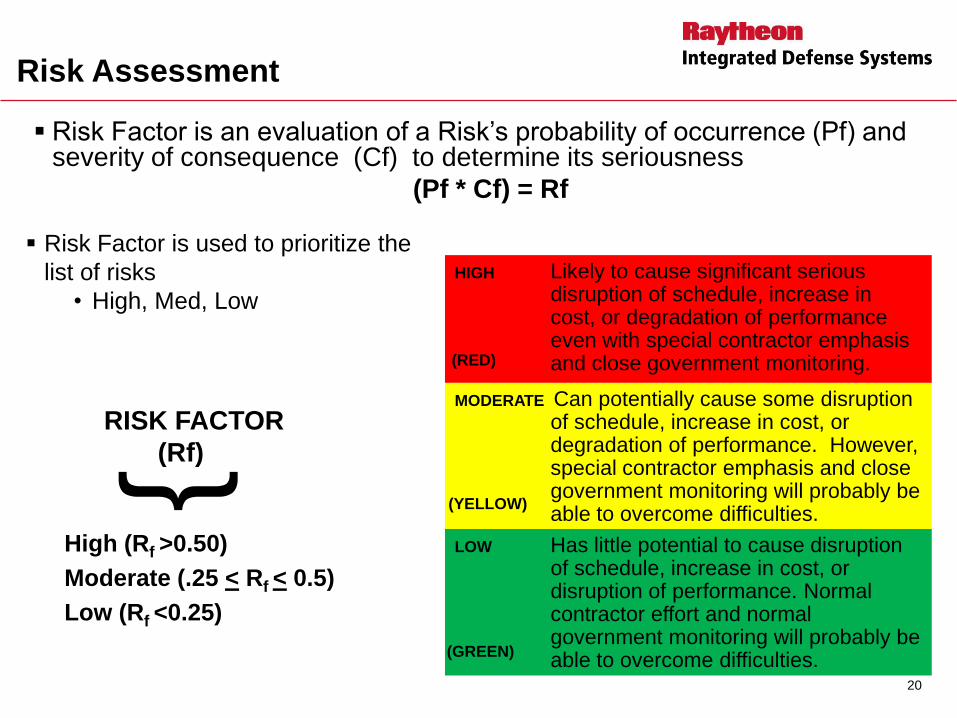
Risk Factor is an evaluation of a Risk‟s probability of occurrence (Pf) and severity of consequence (Cf) to determine its seriousness
(Pf * Cf) = Rf
High (Rf >0.50)
Moderate (.25 < Rf < 0.5)
Low (Rf <0.25)
{
RISK FACTOR
(Rf)
HIGH Likely to cause significant serious disruption of schedule, increase in cost, or degradation of performance even with special contractor emphasis and close government monitoring.
MODERATE Can potentially cause some disruption of schedule, increase in cost, or degradation of performance. However, special contractor emphasis and close government monitoring will probably be able to overcome difficulties.
LOW Has little potential to cause disruption of schedule, increase in cost, or disruption of performance. Normal contractor effort and normal government monitoring will probably be able to overcome difficulties.
Risk Factor is used to prioritize the
list of risks
• High, Med, Low
(RED)
(YELLOW)
(GREEN)
20

Rf Action Guidelines Table
# Pf C
f R
f Recommendation
1 Low Low Low Do Nothing
2 Medium Low Low Do Nothing
3 High Low Medium Reduce likelihood or
establish contingency
4 Low Medium Medium Monitor, take action if
needed
5 Medium Medium Medium Take action if needed
6 High Medium Medium Take action to reduce
likelihood
7 Low High Medium Develop cost effective
mitigation plan
8 Medium High High Take action
9 High High High Take action
High
Sig
Mod
Minor
Low
Low Minor Mod Sig High
1
2
3
4
5
7
8
9 6
(GREEN)
(RED)
(YELLOW)
6
21
PR
OB
AB
ILIT
Y
IMPACT

Evaluating using Risk Analysis
Risk area Risk Prob† Impact† Risk
Rqmt Stability If requirements change, then High X Med = Med
architecture design will slip; fixed need
date prevents meeting users‟ need
Design Perform If throughput rqmts are not Low X Med = Med
achievable with COTS S/W;
then schedule will slip
Rqmt Scale If effort is larger than expected, Med X Low = Low
then will not be able to staff
causing extensive slips
Risk list
Ranked risk list
• Risk analysis should clarify the possible outcomes and assign values to the probabilities and impacts
†Prob – High: 1>P>0.7, Med: 0.7>P>0.4, Low: 0.4>P>0.1, None: 0.1>P Impact – High: >$1M or slip>3 months, Med: ...
22

Using Tactics To Reduce Risk
Technical
Risks
Tactics
Lower Risks
Quality
Attribute
Analysis
Simulation/
Modeling/
Prototyping
Activities
Critical Parameters Modeled CP
• Performance
• Modifiability
• Availability
• Security
• Testability
• Usability
• ML Designer
• Monte Carlo Schedule Analysis
• MS Threat Modeling Tool
• Prototyping (e.g. RUP:Initiation)
• Customer Demos
Software
Architecture
Specification
DFSS
Architecture
Risk Analysis
Gaps
Software
Development
23
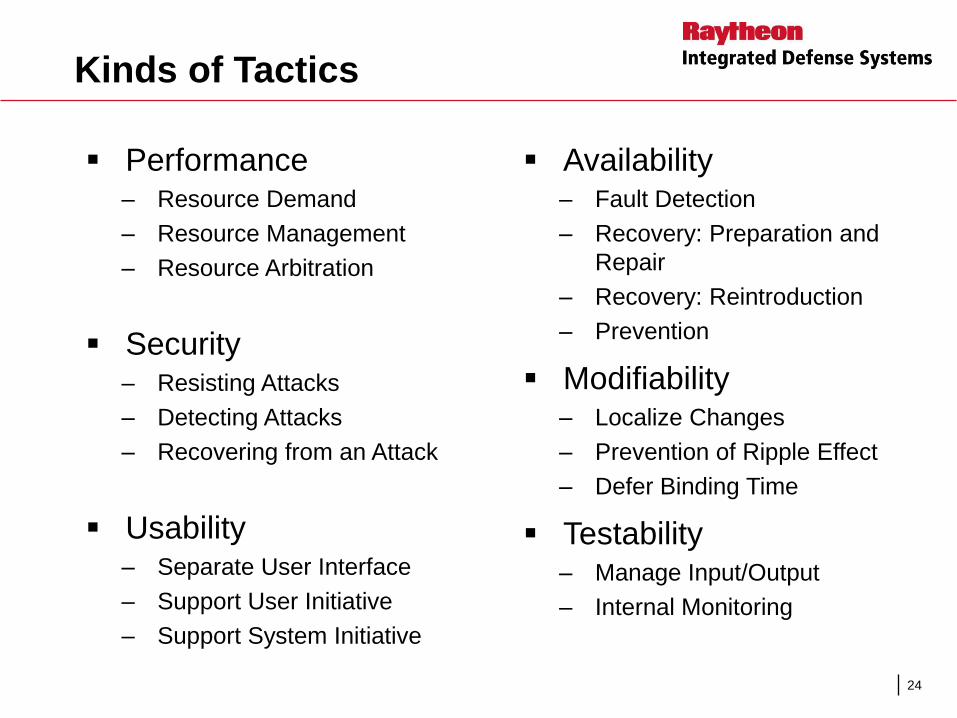
Kinds of Tactics
Performance – Resource Demand
– Resource Management
– Resource Arbitration
Security – Resisting Attacks
– Detecting Attacks
– Recovering from an Attack
Usability – Separate User Interface
– Support User Initiative
– Support System Initiative
Availability – Fault Detection
– Recovery: Preparation and
Repair
– Recovery: Reintroduction
– Prevention
Modifiability – Localize Changes
– Prevention of Ripple Effect
– Defer Binding Time
Testability – Manage Input/Output
– Internal Monitoring
24

Examples of Tactics
Performance – FIFO
– Leaky Bucket
Security – Trusted Computing Base
– Authenticate Users
– Authorize Users
Usability
– Parameter Hiding
– Undo
– Clearly Marked Exits
Availability – Trusted Computing Base
– FIFO
– Leaky Bucket
– Garbage Collection
Modifiability – Abstract Common Services
– Anticipate Expected Changes
– Runtime Registration
Testability – Record/Playback
– Built-in Monitors
25

Example: Trusted Computing Base
Let‟s say we‟re developing an architecture for a phone.
The gap analysis of the quality attributes revealed that the security response of the phone is a critical parameter
– Desired Response: Keep Mean-Time-To-Detect within 5 minutes (i.e. to detect an attack)
What design decisions can we make to achieve this?
– Leverage a tactic called “Trusted Computing Base”
Design decision:
– Choose an architectural boundary, within which, the data is trusted.
– Note that this decision could result in a degradation of performance response. Tactics will often support one attribute, but at the expense of another.
DFSS Method & Tool: Security Patterns 26
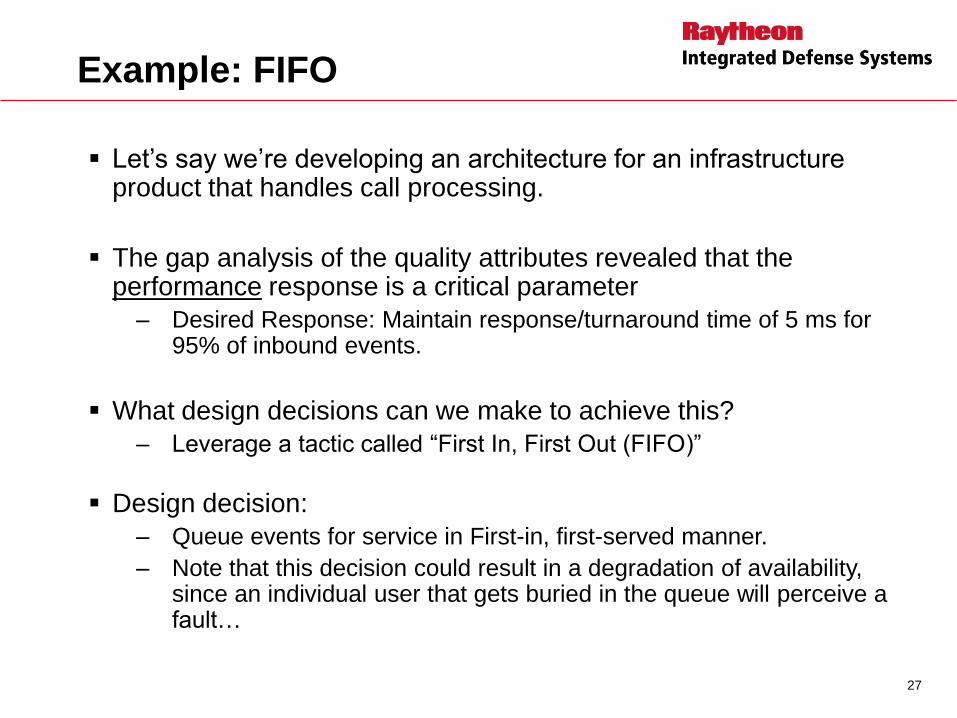
Example: FIFO
Let‟s say we‟re developing an architecture for an infrastructure product that handles call processing.
The gap analysis of the quality attributes revealed that the performance response is a critical parameter
– Desired Response: Maintain response/turnaround time of 5 ms for 95% of inbound events.
What design decisions can we make to achieve this?
– Leverage a tactic called “First In, First Out (FIFO)”
Design decision:
– Queue events for service in First-in, first-served manner.
– Note that this decision could result in a degradation of availability, since an individual user that gets buried in the queue will perceive a fault…
27
Example: Anticipate Expected Changes
The gap analysis of the quality attributes revealed that the modifiability response is a critical parameter.
– Desired Response: Changing the audio transport model from circuit-switch to packet-based routing some time in the future should cost no more than 5 SM (Staff Months).
What design decisions can we make to achieve this?
– Leverage tactics called “Anticipate Expected Changes”
Design decision:
– Keep the transport-specific details isolated in an audio programming layer, distinct from the call processing control logic.
28
Example: Parameter Hiding
The gap analysis of the quality attributes revealed that the
usability response is a critical parameter – Desired Response: Keep the number of configurable parameters below a
threshold value (e.g. 20 fields).
What design decisions can we make to achieve this? – Leverage a tactic called “Parameter Hiding”
Design decision: – Make a wider set of configurable parameters available to a select user base
(e.g. beta/field personnel) for performance tuning, but not to the general users.
29
Risk Assessment Summary
Disciplined risk management can be applied to all business
aspects
Use the process correctly.
– Don‟t skip steps in an ill-founded attempt to speed up the process.
Train key business personnel as coaches/facilitators
Hold regular risk reviews
– Work the process through the program, not just at the Risk
Assessment Session.
Manage available information to:
– Use what we know
– Understand what we don‟t know
– Minimize what we don‟t know we don‟t know!
Share lessons learned across businesses
30
Evaluating Architecture Using DFSS
Techniques
31

Design Trade Off Analysis Overview
1. Quality Tradeoffs
Changing an existing product‟s architecture is risky…
2. Design* Tradeoffs
Prioritization Matrix
Pugh Matrix
Monte Carlo analysis
3. Economic Tradeoffs
Cost Benefit Analysis Model (CBAM)
Developing architecture roadmaps for a product
* In this context, “Design” refers to
making choices when architecting…
32
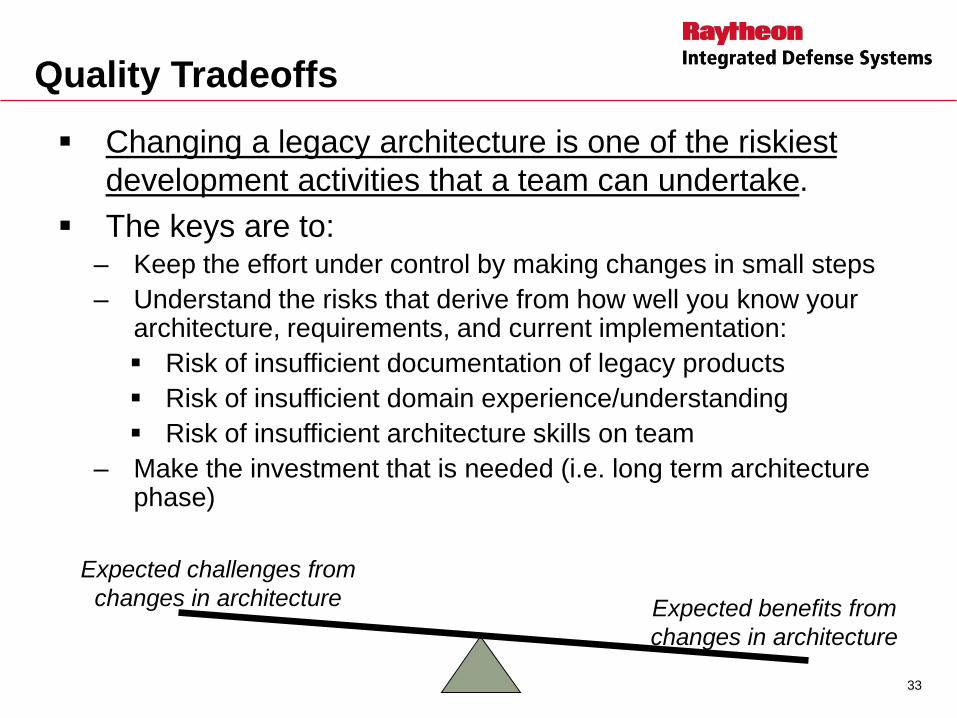
Expected challenges from
changes in architecture Expected benefits from
changes in architecture
Quality Tradeoffs
Changing a legacy architecture is one of the riskiest
development activities that a team can undertake.
The keys are to: – Keep the effort under control by making changes in small steps
– Understand the risks that derive from how well you know your architecture, requirements, and current implementation:
Risk of insufficient documentation of legacy products
Risk of insufficient domain experience/understanding
Risk of insufficient architecture skills on team
– Make the investment that is needed (i.e. long term architecture phase)
33
Introduction to Design Trade-off Analysis
The ability to make decisions is a vital skill, both in our personal and our professional lives. – What am I going to have for lunch?
– What kind of computer should I buy next?
– What display and keypad should Motorola use to meet a customer‟s need for a robust design?
To make a decision you need to know: – What are the possible choices?
– What criteria distinguish the choices?
If only one criteria is important, the decision is easy: – I want the quickest lunch.
– I want the cheapest computer.
34

List Architecture Needs
Architecture Needs QA Type
User needs a response to an inbound call request within
400 ms.
Performance Use Case/AR
Denial of service attacks must be identified and thwarted in
95% of the cases.
Security Use Case/AR
The system must deliver a mean-time-to-failure of 24 hours
or better.
Availability Use Case/AR
The cost to add new system objects to the NM interface
must be less than 5 SM.
Modifiability Use Case/AR
User must be able to configure a new site subsystem within
5 commands.
Usability Use Case/AR
System will need to be able to add Phase 2 security
standards within 18 months.
Security Change/Growth
System must remain operational with traffic bursts of up to
4M users per hour.
Performance Extreme/Stress
35
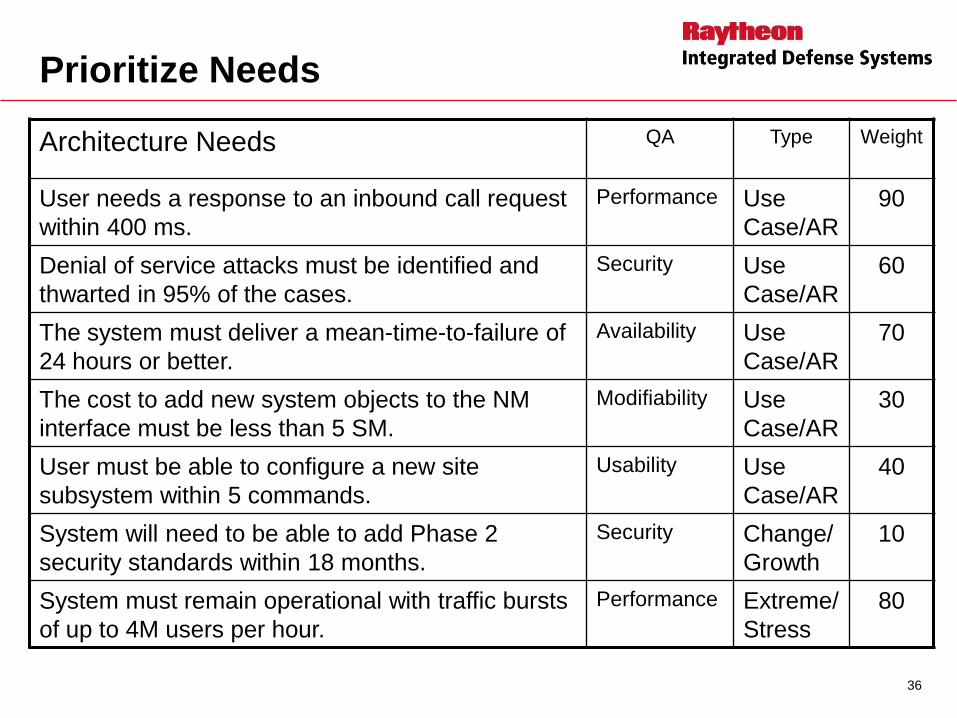
Prioritize Needs
Architecture Needs QA Type Weight
User needs a response to an inbound call request
within 400 ms.
Performance Use
Case/AR
90
Denial of service attacks must be identified and
thwarted in 95% of the cases.
Security Use
Case/AR
60
The system must deliver a mean-time-to-failure of
24 hours or better.
Availability Use
Case/AR
70
The cost to add new system objects to the NM
interface must be less than 5 SM.
Modifiability Use
Case/AR
30
User must be able to configure a new site
subsystem within 5 commands.
Usability Use
Case/AR
40
System will need to be able to add Phase 2
security standards within 18 months.
Security Change/
Growth
10
System must remain operational with traffic bursts
of up to 4M users per hour.
Performance Extreme/
Stress
80
36
Introduction to Design Tradeoff Analysis
Usually, there are many choices and many selection criteria. To
select a restaurant for lunch, you might consider:
*distance *price *variety of entrees
*cuisine *service *previous experience
For a computer, price would seldom be the only criteria:
*display *package deal *amount of RAM
*intended use *size *mobile technology
Note that selection criteria seldom point to a perfect choice, because
the perfect fit may not exist. To get the perfect cuisine, for example,
you might have to drive further.
37
Design Tradeoff Analysis Tools & Methods
38
Common steps in Design Tradeoff Tools
1. List the choices, options, or alternatives.
2. List the selection criteria (e.g. critical parameters).
3. Score each choice against each criteria.
4. Score the choices against each other.
5. Document which choice scores the highest.
Design Tradeoff Tools & Methods to be presented:
– Prioritization Matrix
– Pugh Matrix
– Cost Benefit Analysis Method (CBAM)
Design Tradeoff tools help you select & document the best choice.
DFSS Tradeoff Tools
What do we need in a tradeoff tool to help us make
architecture decisions?
– Analysis support to help us sort through the many choices and
conflicting criteria
– A disciplined approach that helps remove emotion and politics from
the decision-making process
Consider these examples of architecture decision-making:
1. Choosing between a few alternatives when designing the primary
components (architecture elements) in the product architecture
2. Selecting one among many 3rd party products
3. Choosing between two algorithms for a queuing model
4. Creating an architecture roadmap for a product that prioritizes a set
of architecture changes by economic value
39

Tradeoff Example 1
Choosing between a few design alternatives: – Captured as an open issue
with a few alternative solutions
with pros and cons for each alternative
Use a Prioritization Matrix when you need to: – accommodate both qualitative and quantitative data
– apply criteria weighting
40
Prioritization Matrix
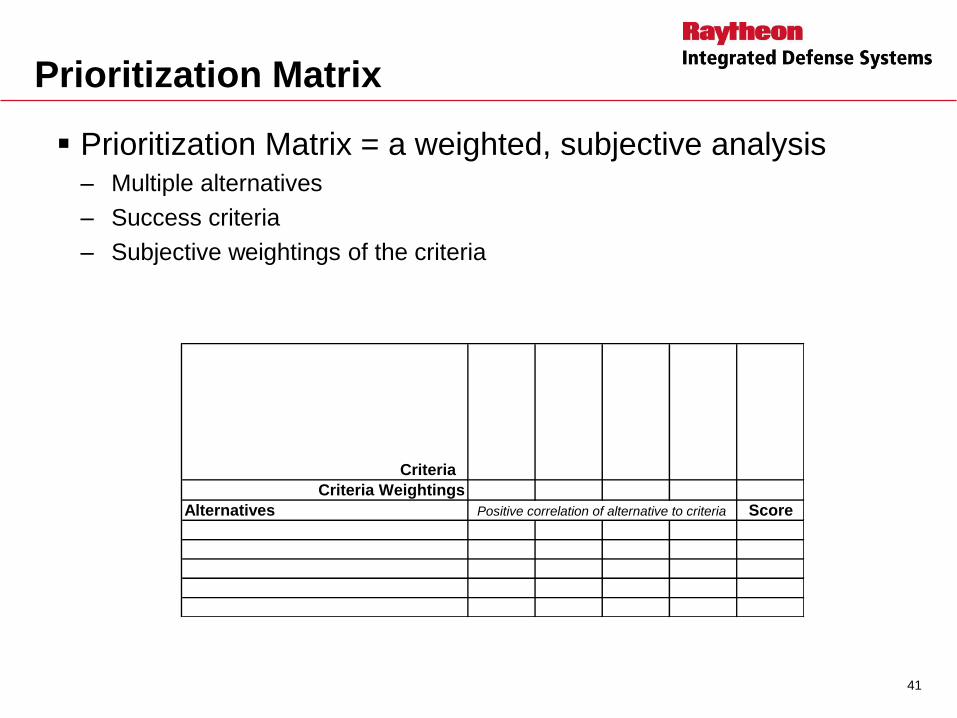
Prioritization Matrix = a weighted, subjective analysis – Multiple alternatives
– Success criteria
– Subjective weightings of the criteria
Criteria
Criteria Weightings
Alternatives ScorePositive correlation of alternative to criteria
41
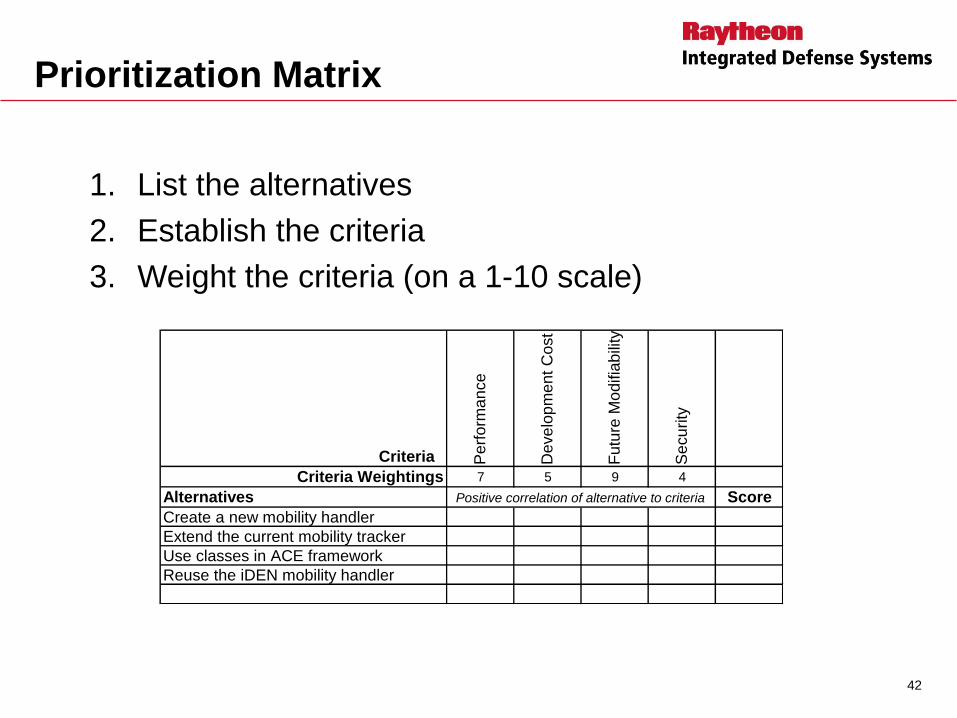
Prioritization Matrix
1. List the alternatives
2. Establish the criteria
3. Weight the criteria (on a 1-10 scale)
Criteria Pe
rfo
rma
nce
De
ve
lop
me
nt
Co
st
Fu
ture
Mo
difia
bili
ty
Se
cu
rity
Criteria Weightings 7 5 9 4
Alternatives Score
Create a new mobility handler
Extend the current mobility tracker
Use classes in ACE framework
Reuse the iDEN mobility handler
Positive correlation of alternative to criteria
42

Prioritization Matrix
4. Rate each alternative against each criteria (1-10 scale)
5. Rank the alternatives by score
6. If no clear winner emerges, consider adding criteria
Criteria Pe
rfo
rma
nce
De
ve
lop
me
nt
Co
st
Fu
ture
Mo
difia
bili
ty
Se
cu
rity
Criteria Weightings 7 5 9 4
Alternatives Score
Create a new mobility handler 8 2 6 8 152
Extend the current mobility tracker 5 6 3 3 104
Use classes in ACE framework 3 4 7 9 140
Reuse the iDEN mobility handler 6 5 3 2 102
Positive correlation of alternative to criteria
43

DFSS Tradeoff Example 2
Selecting one among many 3rd party products: – Captured as a list of 3rd party offerings
with costs and benefits for each offering
Use a Pugh Matrix when you need to: – do a quick qualitative assessment
– determine if there is an obvious winning concept
– get a quick feel for concept comparison
– down-select from many concepts to the most promising few
44
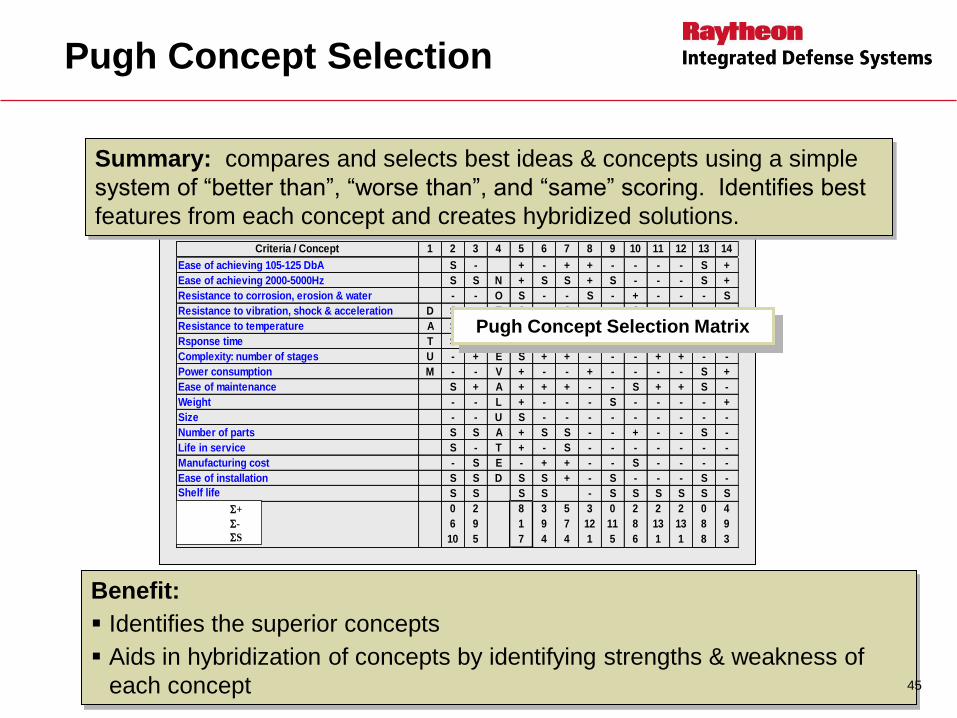
Pugh Concept Selection
Benefit:
Identifies the superior concepts
Aids in hybridization of concepts by identifying strengths & weakness of
each concept
Criteria / Concept 1 2 3 4 5 6 7 8 9 10 11 12 13 14
Ease of achieving 105-125 DbA S - + - + + - - - - S +
Ease of achieving 2000-5000Hz S S N + S S + S - - - S +
Resistance to corrosion, erosion & water - - O S - - S - + - - - S
Resistance to vibration, shock & acceleration D S - T S - S - - S - - - -
Resistance to temperature A S - S - - - S S - - S S
Rsponse time T S - + - - - - S - - - -
Complexity: number of stages U - + E S + + - - - + + - -
Power consumption M - - V + - - + - - - - S +
Ease of maintenance S + A + + + - - S + + S -
Weight - - L + - - - S - - - - +
Size - - U S - - - - - - - - -
Number of parts S S A + S S - - + - - S -
Life in service S - T + - S - - - - - - -
Manufacturing cost - S E - + + - - S - - - -
Ease of installation S S D S S + - S - - - S -
Shelf life S S S S - S S S S S S
0
6
10
2
9
5
8
1
7
3
9
4
5
7
4
3
12
1
0
11
5
2
8
6
2
13
1
2
13
1
0
8
8
4
9
3
+
-
S
Summary: compares and selects best ideas & concepts using a simple
system of “better than”, “worse than”, and “same” scoring. Identifies best
features from each concept and creates hybridized solutions.
Pugh Concept Selection Matrix
45
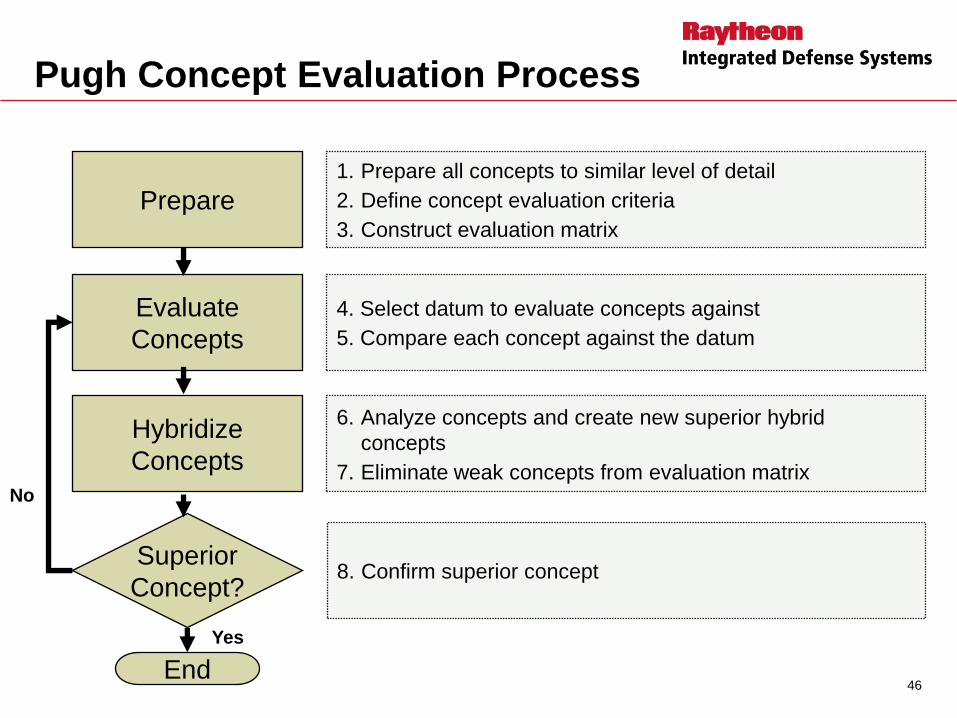
Pugh Concept Evaluation Process
1. Prepare all concepts to similar level of detail
2. Define concept evaluation criteria
3. Construct evaluation matrix
4. Select datum to evaluate concepts against
5. Compare each concept against the datum
6. Analyze concepts and create new superior hybrid
concepts
7. Eliminate weak concepts from evaluation matrix
Prepare
Evaluate
Concepts
Hybridize
Concepts
Superior
Concept?
End
No
Yes
8. Confirm superior concept
46

Select the Datum – Step 1
1. Choose one of the alternatives to be the straw man, or “datum” Rather than comparing each concept against the others, all concepts
are compared against the datum
─ The datum “takes the heat” thus rendering a focus for all other concepts to beat
Datum for Initial Evaluation
− Benchmarked best-in-class design in the context of your product requirements and competitive environment
− If no best-in-class design exists, the datum is the concept that the team believes is the strongest among the alternatives
Datum for Subsequent Evaluation Iterations
− Select the strongest concept that is present in the matrix (either the initial datum or a concept that has emerged as stronger)
47
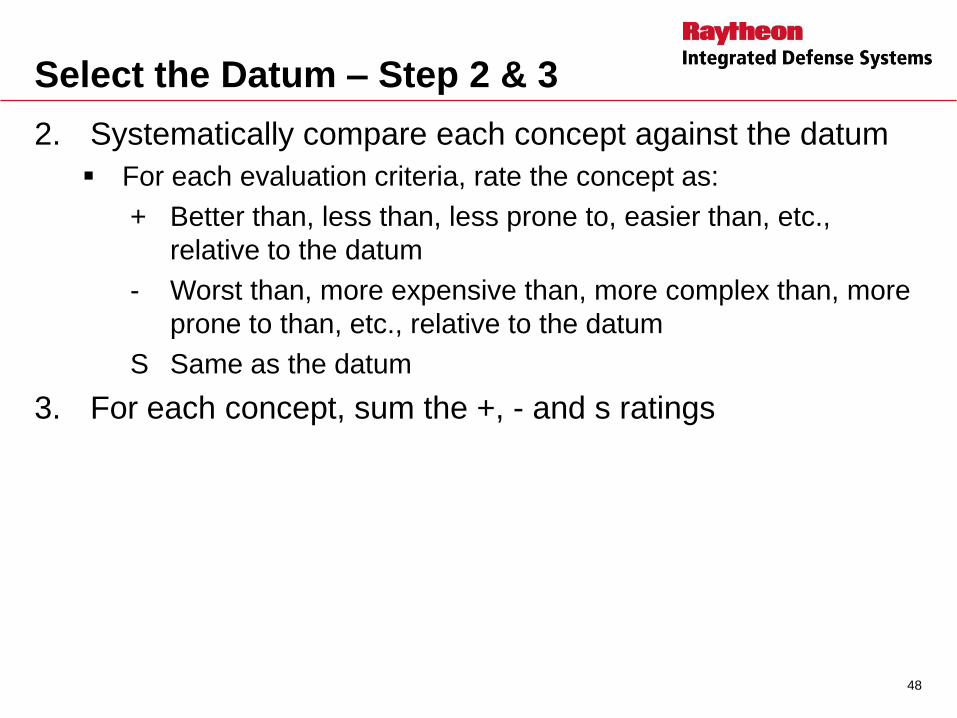
Select the Datum – Step 2 & 3
2. Systematically compare each concept against the datum
For each evaluation criteria, rate the concept as:
+ Better than, less than, less prone to, easier than, etc.,
relative to the datum
- Worst than, more expensive than, more complex than, more
prone to than, etc., relative to the datum
S Same as the datum
3. For each concept, sum the +, - and s ratings
48
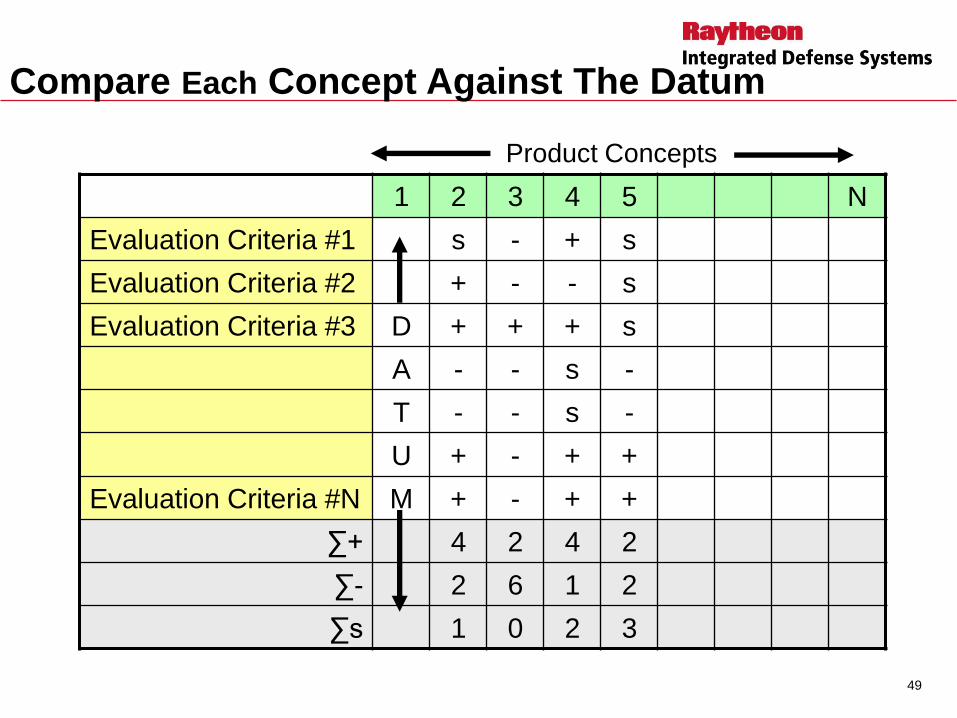
Compare Each Concept Against The Datum
1 2 3 4 5 N
Evaluation Criteria #1 s - + s
Evaluation Criteria #2 + - - s
Evaluation Criteria #3 D + + + s
A - - s -
T - - s -
U + - + +
Evaluation Criteria #N M + - + +
∑+ 4 2 4 2
∑- 2 6 1 2
∑s 1 0 2 3
Product Concepts
49

DFSS Tradeoff Example 3
Choosing between two algorithms for a queuing model:
– Two alternative approaches to handling inter-process communications
within the product‟s concurrency model
each algorithm has different advantages and weaknesses
there is variability on the traffic patterns
the requirements are stated as a range of acceptable utilization %
Use Monte Carlo Analysis* when you need to:
– handle variability in the inputs
– do sophisticated statistical modeling
– determine whether the results fall within acceptable ranges
*[Refer to “Applying DFSS to Software and Hardware Systems, Maass & McNair,
Prentice-Hall, 2009]
50
Summary of Architecture Evaluation Techniques
A comprehensive set of scenarios was presented to assist in
a complete evaluation of the architecture.
Methods were defined to help measure the architecture so
an evaluation could be performed. Using capability flow up,
flow down along with simulation or models provides a very
powerful metrics based evaluation technique.
51
Patricia McNair
IDS Deputy Director of Six Sigma
Raytheon Co.
978-858-5456
Email: [email protected]
Liz Markewicz
Risk Manager
Raytheon Co.
978.470.9923
Email:[email protected]
11/4/2011 52