
ARAPAHOE/DOUGLAS REGIONAL WORKFORCE BOARD · Aurora Workforce Center 15400 E. 14th Place Aurora,...
28
www.adworks.org Arapahoe County Centennial Workforce Center 6964 S. Lima Street Centennial, Colorado 80112 Phone: 303.636.1160 Fax: 303.636.1250 Arapahoe County Aurora Workforce Center 15400 E. 14 th Place Aurora, Colorado 80011 Phone: 303.636.2013 Fax: 303.636.2020 Economic Impact of Workforce Centers, Economy and Workforce Profile Colorado Central Planning Region Prepared by Arapahoe/Douglas Workforce Development Board Patrick Holwell, Workforce Economist Dawn Gardner, Sector Coordinator January 2018
Transcript of ARAPAHOE/DOUGLAS REGIONAL WORKFORCE BOARD · Aurora Workforce Center 15400 E. 14th Place Aurora,...

www.adworks.org
Arapahoe County Centennial Workforce Center
6964 S. Lima Street Centennial, Colorado 80112
Phone: 303.636.1160 Fax: 303.636.1250
Arapahoe County Aurora Workforce Center
15400 E. 14th Place Aurora, Colorado 80011
Phone: 303.636.2013 Fax: 303.636.2020
Economic Impact of Workforce Centers, Economy and Workforce Profile
Colorado Central Planning Region
Prepared by
Arapahoe/Douglas Workforce Development Board
Patrick Holwell, Workforce Economist Dawn Gardner, Sector Coordinator
January 2018

Report published February 2018

Background This report was prepared for the Colorado Central Planning Region, which is made up of Adams, Arapahoe, Boulder, Broomfield, Clear Creek, Denver, Douglas, Gilpin, Jefferson and Larimer counties. There are seven federally funded Workforce Development Centers that serve this region. It profiles the economy and workforce in the 10-county region, and highlights topics important to businesses, economic developers, postsecondary educators and other stakeholders in continued prosperity and growth. Profile: Regional Economy The Colorado Central Planning Region’s economy is robust and diversified. Its labor force of over 1.9 million makes up nearly 67% of Colorado’s total labor force. In 2016, the Central Planning Region’s Gross Regional Product (GRP) was slightly over $226.9 billion, which was over 72% of the state’s total GRP.
The table shows jobs, average earnings per job and sales. In 2016, 45% of the $420.7 billion in industry sales were exported. For government, ‘total sales’ is revenue spent in the region.
Several drivers, or key industry sectors, are recognized in the region. Note there is some overlap, for example aerospace/aviation includes some manufacturing and broadband, as well as engineering services:
• Aerospace/Aviation • Biosciences • Broadband • Engineering Services
• Finance & Insurance • Health Care • Information Technology • Manufacturing
NAICS Description 2017 JobsAvg.
Earnings Per Job
2016 Total Sales
11 Agriculture, Forestry, Fishing and Hunting 6,485 $34,505 $1,332,541,65621 Mining, Quarrying, and Oil and Gas Extraction 10,467 $182,782 $8,704,557,77022 Utilities 4,280 $136,690 $2,524,293,65623 Construction 126,458 $65,702 $21,522,118,95731 Manufacturing 102,995 $89,418 $39,712,666,83942 Wholesale Trade 83,608 $95,065 $22,305,510,58944 Retail Trade 180,977 $36,951 $16,035,203,89548 Transportation and Warehousing 60,118 $66,742 $12,448,726,87451 Information 59,578 $121,695 $34,053,174,84652 Finance and Insurance 86,974 $114,285 $36,374,923,26953 Real Estate and Rental and Leasing 40,945 $63,968 $24,382,546,53554 Professional, Scientific, and Technical Services 190,968 $100,850 $36,351,341,89455 Management of Companies and Enterprises 32,593 $149,592 $10,573,036,18256 Administrative and Support and Waste Management and Remediation Services 120,956 $46,682 $12,139,894,74361 Educational Services 43,922 $39,024 $3,128,383,85462 Health Care and Social Assistance 205,655 $60,443 $23,714,277,12371 Arts, Entertainment, and Recreation 36,658 $42,978 $4,581,075,45872 Accommodation and Food Services 175,497 $24,614 $12,008,872,36581 Other Services (except Public Administration) 90,037 $34,199 $6,853,726,41690 Government 285,602 $69,604 $91,956,642,347
Totals for Central Planning Region 1,944,775 $67,605 $420,703,515,268
Jobs, Earnings & Sales, Colorado Central Planning Region
Source: EMSI 2017.4 QCEW, Non-QCEW & Self-Employed Class of Worker
REGIONAL PROFILE ● 1

Historic Trends This combination graph shows ten-year historical growth of jobs and payrolled business locations (establishments) in the region. In the five-year period between 2011 and 2016, the number of jobs grew by 280,000 (16.9% or 3.38% annually). This is rapid growth.
The number of establishments grew during the same period by 18,600. This is a 17.5% five-year growth rate, or 3.5% annually. Growth in the number of establishments outpaced job growth, suggesting it was a good period for small business growth.
Venture Capital Investment The combination graph was compiled using venture capital investment statistics obtained from the Price Waterhouse Cooper Money Tree Report. Venture capital investment grows businesses and creates new jobs. During the five-year period from 2011 through 2016, estimated venture capital investment in the
Colorado Central Planning Region grew from $24.2 billion to nearly $41 billion. This represents a 69.2% increase over the five-year period, which equates to an annual growth rate in venture capital investment of 13.83%. This growth rate considerably outpaced overall jobs and establishment growth rates in the period.
Projected Growth by Industry Group The table on the next page shows growth projections by major industry group. The number of jobs is expected to grow 10.2% over the five-year period between 2017 and 2022. This projected annual growth rate of 2.1% per year represents a substantial slow-down from the 3.4% annual growth in jobs between 2011 and 2016.

The fastest growth is expected in healthcare and social assistance and professional, scientific and technical services. These two broad sectors represent in large part the intellectual and service infrastructure of the region’s economy. The professional, scientific and technical group includes a substantial portion of the IT sector, law and accounting offices, engineering and related services and consulting firms. These groups must be present and thriving for continued growth and competitiveness in a diversified economy such as exists in the Colorado Central Planning Region.
Quality Labor Force Colorado is known nationally and internationally as a good place to live, work, recreate and do business. It has a high quality of life, with clean air, clean water, adequate transportation infrastructure, good K-12 and postsecondary institutions, plenty of recreational opportunities and a sophisticated, technically savvy labor force. These things have elevated the counties that make up the Colorado Central Planning Region to the short-list for national and international businesses who are considering a relocation or expansion. According to the Metro Denver Economic Development Corporation, the region boasts a variety of high rankings:
• Colorado is the second most highly educated state in the United States, behind only Massachusetts.
• Colorado is second in the nation in civilian aerospace employment. • Forbes rates greater metro Denver as the best place for business and careers and ranks Colorado
as the fifth best state in which to do business. • U.S. News & World Report ranks greater metro Denver as the second-best place to live in the
United States. • Business Insider ranks Colorado as the third best economy in the United States.
NAICS Code
Description 2017 Jobs 2018 Jobs 2019 Jobs 2020 Jobs 2021 Jobs 2022 Jobs ChangeAnnual Growth
Rate
National Location Quotient
Payrolled Business Locations
90 Government 285,602 294,487 302,307 309,385 315,919 320,864 35,262 2.5% 0.96 1,04562 Health Care and Social Assistance 205,655 215,744 224,645 232,728 240,238 245,926 40,271 3.9% 0.84 11,50554 Professional, Scientific, and Technical Services 190,968 198,389 204,819 210,557 215,679 219,530 28,562 3.0% 1.54 26,19344 Retail Trade 180,977 185,243 189,064 192,576 195,843 198,492 17,515 1.9% 0.90 10,33572 Accommodation and Food Services 175,497 181,841 187,248 192,000 196,268 199,145 23,648 2.7% 1.06 7,92923 Construction 126,458 130,499 134,109 137,422 140,512 142,970 16,512 2.6% 1.20 10,334
56Administrative and Support and Waste Management and Remediation Services
120,956 123,888 126,438 128,722 130,820 132,331 11,375 1.9% 1.00 7,372
31 Manufacturing 102,995 105,133 106,893 108,385 109,647 110,415 7,420 1.4% 0.67 3,72081 Other Services (except Public Administration) 90,037 92,535 94,719 96,682 98,398 99,811 9,774 2.2% 0.96 10,59452 Finance and Insurance 86,974 89,342 91,458 93,401 95,256 96,671 9,697 2.2% 1.15 7,67642 Wholesale Trade 83,608 85,812 87,752 89,508 91,128 92,359 8,751 2.1% 1.14 9,94748 Transportation and Warehousing 60,118 61,674 62,992 64,141 65,098 65,829 5,711 1.9% 0.89 2,20451 Information 59,578 60,255 60,880 61,468 62,010 62,514 2,936 1.0% 1.64 2,60461 Educational Services 43,922 45,694 47,200 48,519 49,671 50,481 6,559 3.0% 0.88 2,12353 Real Estate and Rental and Leasing 40,945 41,979 42,877 43,680 44,395 44,941 3,996 2.0% 1.27 6,76571 Arts, Entertainment, and Recreation 36,658 37,727 38,634 39,429 40,127 40,612 3,954 2.2% 1.10 1,83555 Management of Companies and Enterprises 32,593 33,787 34,794 35,670 36,449 36,951 4,358 2.7% 1.19 1,66421 Mining, Quarrying, and Oil and Gas Extraction 10,467 10,717 10,962 11,203 11,438 11,672 1,205 2.3% 1.39 72311 Agriculture, Forestry, Fishing and Hunting 6,485 6,683 6,849 6,993 7,128 7,202 717 2.2% 0.28 33522 Utilities 4,280 4,325 4,357 4,379 4,390 4,391 111 0.5% 0.63 133
Totals 1,944,775 2,005,754 2,058,996 2,106,845 2,150,414 2,183,107 205,639 2.1% 125,034
Regional Industry Growth Projections, Colorado Central Planning Region
Source: EMSI 2017.4 – QCEW Employees, Non-QCEW Employees & Self-Employed Class of Worker
REGIONAL PROFILE ● 3

Educational Attainment The bar graph shows that educational attainment levels in the Colorado Central Planning Region are significantly above the national average at all levels. The table shows the number of working age people in the region by field of bachelor’s degree.
Field of Degree Total 25-39 Years 40-64 Years
Science & Engineering 329,587 141,698 187,889Science & Engineering Related 62,564 24,713 37,851Business 174,145 69,844 104,301Education 56,227 17,219 39,008Arts, Humanities & Other 201,561 94,625 106,936Totals 824,084 348,099 475,985
Labor Force Entry Dynamics by Field of Degree, Colorado Central Planning Region
Source: US Census, American Community Survey

High In-Migration Rates The three major metropolitan areas in the Colorado Central Planning Region, Fort Collins, Boulder and greater metro Denver have among the highest in-migration rates in the United States. For example, for Boulder, we would read that 10.3% of Boulder’s total population lived somewhere besides Boulder County during the prior year.
Again, of the top six cities in the United States, five are on Colorado’s urban Front Range. The reader should not confuse in-migration, which is the number of people coming in, with net migration, which is the number coming in minus the number going out. As will be seen at a later point in this paper, net job to job migration is much lower. Workforce Demographics Age Bands A useful way to look at the labor force, whether by occupational or industry grouping, or as a whole, is by age band. The reader can readily see by this bar graph that the age groupings in the Central Planning
Region are imbalanced, with fewer young people and a greater proportion of older workers.
We can then estimate the number of people leaving the labor force each year, versus the number entering.
Entering Labor Force 33,880Leaving Labor Force 41,845Annual Surplus/Shortfall (7,965)Source: EMSI 2017.4 QCEW, Non-QCEW & Self-Employed
Annual Change
REGIONAL PROFILE ● 5
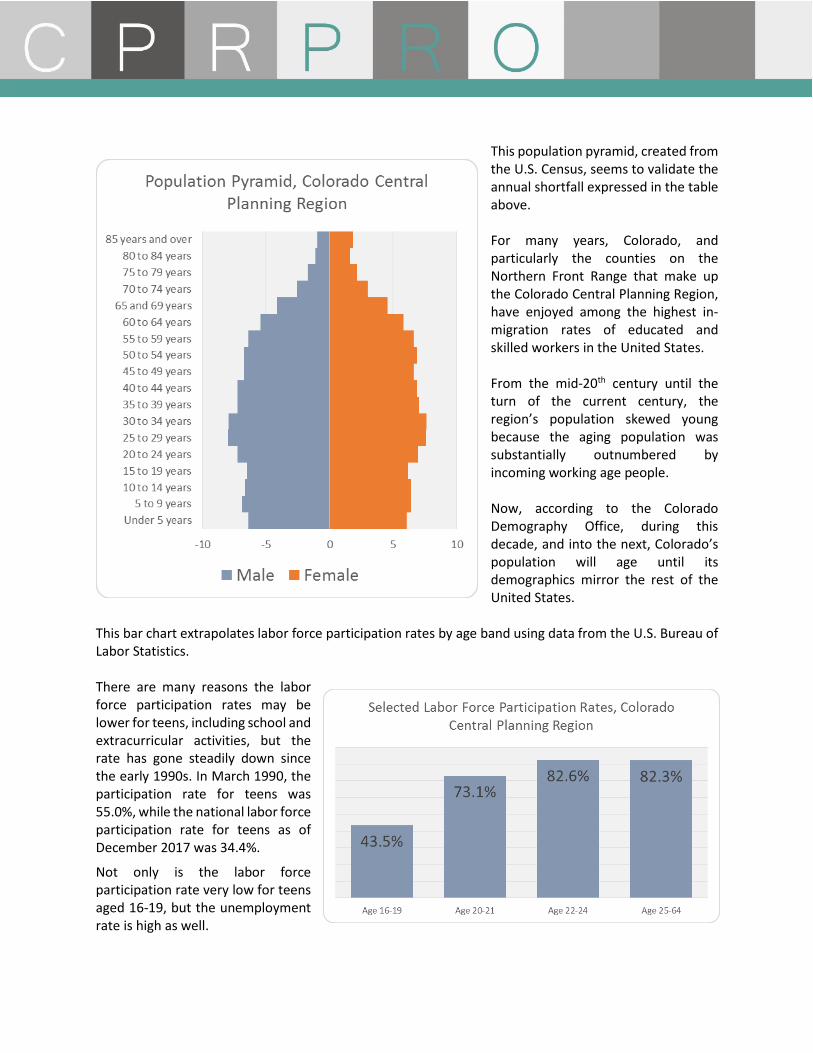
This population pyramid, created from the U.S. Census, seems to validate the annual shortfall expressed in the table above. For many years, Colorado, and particularly the counties on the Northern Front Range that make up the Colorado Central Planning Region, have enjoyed among the highest in-migration rates of educated and skilled workers in the United States. From the mid-20th century until the turn of the current century, the region’s population skewed young because the aging population was substantially outnumbered by incoming working age people. Now, according to the Colorado Demography Office, during this decade, and into the next, Colorado’s population will age until its demographics mirror the rest of the United States.
This bar chart extrapolates labor force participation rates by age band using data from the U.S. Bureau of Labor Statistics. There are many reasons the labor force participation rates may be lower for teens, including school and extracurricular activities, but the rate has gone steadily down since the early 1990s. In March 1990, the participation rate for teens was 55.0%, while the national labor force participation rate for teens as of December 2017 was 34.4%.
Not only is the labor force participation rate very low for teens aged 16-19, but the unemployment rate is high as well.

Since the labor force is considered to consist of the employed plus the unemployed, this chart shows that a significant portion of older teens (10.5%) who wish to work cannot find work. There may be a number of factors contributing; lack of jobs close to home, lack of work and/or job search skills, access to transportation, and family needs.
While it may be expected that wages for teens just entering the labor force are lower, this chart shows that young adults in the 22-24 earn significantly less than those over age 25. According to that National Student Loan Data System, the average student in the Class of 2016 had $37,172 in student loan debt. This is up 6% from the prior academic year, and the average monthly student loan payment (for borrower aged 20 to 30 years) was $351. This may be one of the prime factors contributing to the fact that the millennial generation has not been able to build wealth at the same levels baby boomers had when they were that age.
REGIONAL PROFILE ● 7

Engaging Youth Numerous programs exist that attempt to engage youth in the labor force, and there is a growing sense that collaboration between K-12, postsecondary education, workforce development, employers and other stakeholders must be increased in more systematic ways throughout the region. Here is one example: Arapahoe Community College is building a collaborative campus in the town of Castle Rock in Douglas County. Collaboration on this campus will take place between local businesses, Douglas County School District, and Colorado State University. The idea is that young people can begin to engage in meaningful jobs that are related to what they are learning in the classroom as early as their junior year in high school, and upon graduation will have the necessary skills to enter full-time employment at a livable wage. The $40 million Castle Rock Collaboration Campus will be built on a 14-acre site in the Meadows, located in northern Castle Rock (shown on map). This two-phase project will consist of 2 buildings of 54,000 sq. ft. each, with an estimated opening of phase-one in the fall of 2019. When finished, this campus will house a workforce center office, as well.
The age data presented here suggests a need within the Central Planning Region to better and more meaningfully engage younger workers in the labor force, increase access to resources for success in the labor force, and address issues around the cost of postsecondary education.

Gender The labor force in the Colorado Central Planning Region is fairly evenly distributed by gender, with men outnumbering women by just over 87,000.
Industry groups with highest male concentrations are construction (83%), utilities (77%), and transportation & warehousing (73%). Industry groups with the highest female concentrations are healthcare & social assistance (76%), educational services (64%), and other services, except public administration (57%). (Source: EMSI 2017.4 QCEW, Non-QCEW & Self-Employed Class of Worker). According to the U.S. Census American Community Survey, the average woman working full-time in the
region earns an annual salary of $45,826, where the average man earns $56,504. Thus, in the Colorado Central Planning Region, women earn $0.81 for every dollar men earn, which follows the national trend. Race/Ethnicity This data, from EMSI Developer, shows racial and ethnic groupings among people actually working in 2017 within the Colorado Central Planning Region. The total percentage of racial and ethnic minorities in the region’s general population is higher (32.8%) versus percentages among those working in 2017 (25.0%).
Race/Ethnicity NumberPercent in
Labor ForcePercent in Population
Native Hawaiian or Other Pacific Islander 2,763 0.1% 0.1%
American Indian or Alaska Native 9,010 0.5% 0.5%Two or More Races 26,105 1.3% 2.3%Asian 64,789 3.3% 4.1%Black or African American 86,890 4.5% 4.7%Hispanic or Latino 297,460 15.3% 21.2%White 1,457,758 75.0% 67.2%Totals 1,944,775 100.0% 100.0%Source: EMSI 2017.4 QCEW, Non-QCEW & Self-Employed Class of Worker
Race/Ethnicity of Workforce, Colorado Central Planning Region
As they grow in their careers, graduates from the Castle Rock Collaboration Campus will be able return to the campus as needed to upgrade their skills for access to a greater number of career paths offering salary growth and additional opportunity for advancement. This campus will be completed by 2019, but local employers are already engaged and are working vigorously with educators to begin serving students.
REGIONAL PROFILE ● 9

Data from the U.S. Census shows that unemployment rates are higher, and wages lower for racial and ethnic minority groups in the Colorado Central Planning Region. At the same time representation in the labor force by racial and ethnic minorities is growing each year, we see a serious disparity in educational attainment rates for all racial and ethnic minority groups except Asian, particularly in the percent at or above the baccalaureate level. Policy makers must address these disparate attainment levels in order to ensure that regional employers continue to have access to the skilled and educated workers they need to remain competitive, particularly since net in-migration is lessening.
Group CCPRCivilian Population (All) 2.7%White 2.4%Black/African American 4.7%Asian 2.0%Hispanic/Latino 3.2%
Unemployment by Race and Ethnicity, Colorado Central Planning Region
Source: US Bureau Labor Statistics

The Colorado Paradox For many years, Metro Denver has relied on a substantial influx of new skilled workers. According to the Colorado Demographer, this in-migration will decrease over the next decades.
Only 27% of the people in Colorado with postsecondary education are natives while 73% came here from other places. There is a serious disparity in educational outcomes for minorities; by 2050 the Colorado Workforce Development Council
projects that ethnic and racial minorities will make up 48% of Colorado’s labor force.
Structural Labor Force Issues (Gaps in Workforce Development) There are basically two ways employers find workers with the critical skills they need. Rapid growth has exposed gaps in each.
1. The regional training pipeline, particularly as related to output in critical occupations a. Low youth participation rate suggests need to engage youth in meaningful work at an
earlier age, and provide educational opportunities allowing greater access to career pathways
b. Training pipeline shortfalls require postsecondary educators to work with employers to ensure adequate labor supply in key areas
c. Expand access to business relevant training opportunities 2. In-migration
a. Capitalize on high in-migration rates along the Front Range by supporting policies that maintain high quality of life and economic opportunity
b. Outreach to regions that have surpluses of graduates in critical occupations not adequately supplied by the regional training pipeline
REGIONAL PROFILE ● 11

Net Job-to-Job Migration
As mentioned earlier, the urban Front Range, which includes the counties in the Colorado Central Planning Region, have among the highest in-migration rates in the United States. However, this is mitigated by increasing out-migration. This table clearly shows that while large numbers of skilled and educated workers are moving into Colorado, at the same time nearly as many skilled and educated workers are moving out of the state. This increasing out-migration may be taking place for a variety of reasons, including a perception that opportunities are greater or quality of life better in other states. Two possible reasons that have been advanced are increased congestion in the transportation grid and growing lack of affordable housing. Both of these factors will be explored in a subsequent section, but in the meantime, the reader can readily see that net job-to-job migration is insignificant in the face of current economic growth.
SectorInto
ColoradoOut of
ColoradoNet
MigrationAccommodation and Food Services 16,542 15,834 708 Retail Trade 12,442 11,995 447 Health Care and Social Assistance 9,696 9,262 434 Professional, Scientific, and Technical Services 6,812 6,417 395 Manufacturing 3,806 3,472 334 Educational Services 3,708 3,482 226 Administrative & Support, Waste Management & Remediation 12,587 12,362 225 Finance and Insurance 2,986 2,836 150 Other Services (except Public Administration) 2,810 2,678 132 Wholesale Trade 3,067 2,940 127 Agriculture, Forestry, Fishing and Hunting 684 617 67 Information 1,921 1,873 48 Public Administration 1,664 1,622 42 Transportation and Warehousing 2,923 2,885 38 Real Estate and Rental and Leasing 1,734 1,708 26 Utilities 161 141 20 Mining, Quarrying, and Oil and Gas Extraction 1,232 1,219 13 Management of Companies and Enterprises 1,350 1,341 9 Arts, Entertainment, and Recreation 2,868 2,901 (33)Construction 6,024 6,187 (163)Totals 95,017 91,772 3,245
Net Migration of Workers by Industry Sector, 2nd Quarter 2015 through 1st Quarter 2016
Source: US Census, Longitudinal Employer-Household Dynamics, Job-to-Job Explorer
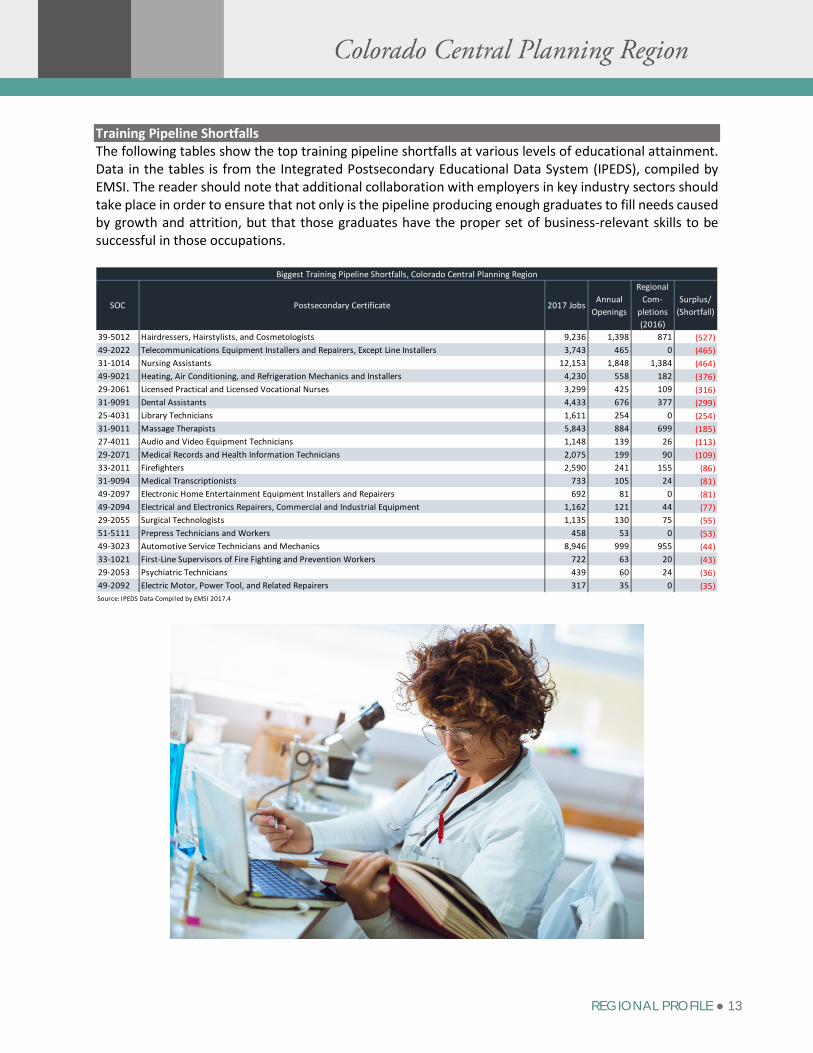
Training Pipeline Shortfalls The following tables show the top training pipeline shortfalls at various levels of educational attainment. Data in the tables is from the Integrated Postsecondary Educational Data System (IPEDS), compiled by EMSI. The reader should note that additional collaboration with employers in key industry sectors should take place in order to ensure that not only is the pipeline producing enough graduates to fill needs caused by growth and attrition, but that those graduates have the proper set of business-relevant skills to be successful in those occupations.
SOC Postsecondary Certificate 2017 JobsAnnual
Openings
Regional Com-
pletions (2016)
Surplus/ (Shortfall)
39-5012 Hairdressers, Hairstylists, and Cosmetologists 9,236 1,398 871 (527)49-2022 Telecommunications Equipment Installers and Repairers, Except Line Installers 3,743 465 0 (465)31-1014 Nursing Assistants 12,153 1,848 1,384 (464)49-9021 Heating, Air Conditioning, and Refrigeration Mechanics and Installers 4,230 558 182 (376)29-2061 Licensed Practical and Licensed Vocational Nurses 3,299 425 109 (316)31-9091 Dental Assistants 4,433 676 377 (299)25-4031 Library Technicians 1,611 254 0 (254)31-9011 Massage Therapists 5,843 884 699 (185)27-4011 Audio and Video Equipment Technicians 1,148 139 26 (113)29-2071 Medical Records and Health Information Technicians 2,075 199 90 (109)33-2011 Firefighters 2,590 241 155 (86)31-9094 Medical Transcriptionists 733 105 24 (81)49-2097 Electronic Home Entertainment Equipment Installers and Repairers 692 81 0 (81)49-2094 Electrical and Electronics Repairers, Commercial and Industrial Equipment 1,162 121 44 (77)29-2055 Surgical Technologists 1,135 130 75 (55)51-5111 Prepress Technicians and Workers 458 53 0 (53)49-3023 Automotive Service Technicians and Mechanics 8,946 999 955 (44)33-1021 First-Line Supervisors of Fire Fighting and Prevention Workers 722 63 20 (43)29-2053 Psychiatric Technicians 439 60 24 (36)49-2092 Electric Motor, Power Tool, and Related Repairers 317 35 0 (35)
Biggest Training Pipeline Shortfalls, Colorado Central Planning Region
Source: IPEDS Data Compiled by EMSI 2017.4
REGIONAL PROFILE ● 13
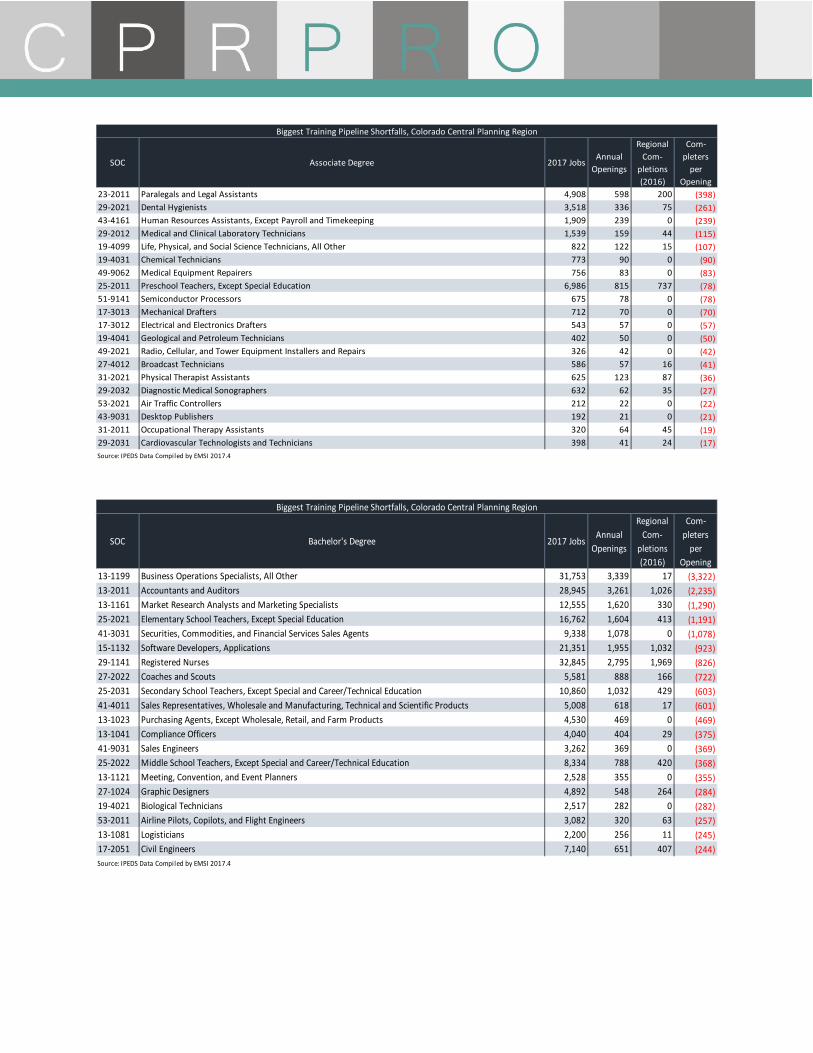
SOC Associate Degree 2017 JobsAnnual
Openings
Regional Com-
pletions (2016)
Com-pleters
per Opening
23-2011 Paralegals and Legal Assistants 4,908 598 200 (398)29-2021 Dental Hygienists 3,518 336 75 (261)43-4161 Human Resources Assistants, Except Payroll and Timekeeping 1,909 239 0 (239)29-2012 Medical and Clinical Laboratory Technicians 1,539 159 44 (115)19-4099 Life, Physical, and Social Science Technicians, All Other 822 122 15 (107)19-4031 Chemical Technicians 773 90 0 (90)49-9062 Medical Equipment Repairers 756 83 0 (83)25-2011 Preschool Teachers, Except Special Education 6,986 815 737 (78)51-9141 Semiconductor Processors 675 78 0 (78)17-3013 Mechanical Drafters 712 70 0 (70)17-3012 Electrical and Electronics Drafters 543 57 0 (57)19-4041 Geological and Petroleum Technicians 402 50 0 (50)49-2021 Radio, Cellular, and Tower Equipment Installers and Repairs 326 42 0 (42)27-4012 Broadcast Technicians 586 57 16 (41)31-2021 Physical Therapist Assistants 625 123 87 (36)29-2032 Diagnostic Medical Sonographers 632 62 35 (27)53-2021 Air Traffic Controllers 212 22 0 (22)43-9031 Desktop Publishers 192 21 0 (21)31-2011 Occupational Therapy Assistants 320 64 45 (19)29-2031 Cardiovascular Technologists and Technicians 398 41 24 (17)
Biggest Training Pipeline Shortfalls, Colorado Central Planning Region
Source: IPEDS Data Compiled by EMSI 2017.4
SOC Bachelor's Degree 2017 JobsAnnual
Openings
Regional Com-
pletions (2016)
Com-pleters
per Opening
13-1199 Business Operations Specialists, All Other 31,753 3,339 17 (3,322)13-2011 Accountants and Auditors 28,945 3,261 1,026 (2,235)13-1161 Market Research Analysts and Marketing Specialists 12,555 1,620 330 (1,290)25-2021 Elementary School Teachers, Except Special Education 16,762 1,604 413 (1,191)41-3031 Securities, Commodities, and Financial Services Sales Agents 9,338 1,078 0 (1,078)15-1132 Software Developers, Applications 21,351 1,955 1,032 (923)29-1141 Registered Nurses 32,845 2,795 1,969 (826)27-2022 Coaches and Scouts 5,581 888 166 (722)25-2031 Secondary School Teachers, Except Special and Career/Technical Education 10,860 1,032 429 (603)41-4011 Sales Representatives, Wholesale and Manufacturing, Technical and Scientific Products 5,008 618 17 (601)13-1023 Purchasing Agents, Except Wholesale, Retail, and Farm Products 4,530 469 0 (469)13-1041 Compliance Officers 4,040 404 29 (375)41-9031 Sales Engineers 3,262 369 0 (369)25-2022 Middle School Teachers, Except Special and Career/Technical Education 8,334 788 420 (368)13-1121 Meeting, Convention, and Event Planners 2,528 355 0 (355)27-1024 Graphic Designers 4,892 548 264 (284)19-4021 Biological Technicians 2,517 282 0 (282)53-2011 Airline Pilots, Copilots, and Flight Engineers 3,082 320 63 (257)13-1081 Logisticians 2,200 256 11 (245)17-2051 Civil Engineers 7,140 651 407 (244)Source: IPEDS Data Compiled by EMSI 2017.4
Biggest Training Pipeline Shortfalls, Colorado Central Planning Region

Issues Relevant to Workforce Development Strategy Systematic Labor Shortage
This table, taken from the U.S. Bureau of Labor Local Area Unemployment Statistics shows historic lows in unemployment throughout the Colorado Central Planning Region. The Colorado State Demography Office points out that for many years, Colorado’s population was young relative to that of the United States as a whole. However, during
this decade, Colorado’s population will age to the point where the state’s population mirrors that of the nation.
SOC Master's Degree 2017 JobsAnnual
Openings
Regional Com-
pletions (2016)
Com-pleters
per Opening
21-1014 Mental Health Counselors 3,580 492 245 (247)29-1122 Occupational Therapists 1,965 170 74 (96)25-4021 Librarians 1,490 168 79 (89)21-1012 Educational, Guidance, School, and Vocational Counselors 2,717 357 271 (86)29-1071 Physician Assistants 2,102 190 105 (85)29-1127 Speech-Language Pathologists 2,414 196 148 (48)21-1022 Healthcare Social Workers 1,661 238 192 (46)19-1041 Epidemiologists 265 26 25 (1)
SOC Doctoral or Professional Degree 2017 JobsAnnual
Openings
Regional Com-
pletions (2016)
Com-pleters
per Opening
29-1123 Physical Therapists 3,342 276 159 (117)23-1011 Lawyers 11,755 692 595 (97)29-1011 Chiropractors 898 49 24 (25)29-1041 Optometrists 757 48 24 (24)29-1066 Psychiatrists 299 18 0 (18)29-1081 Podiatrists 283 37 24 (13)
Biggest Training Pipeline Shortfalls, Colorado Central Planning Region
Source: IPEDS Data Compiled by EMSI 2017.4
Biggest Training Pipeline Shortfalls, Colorado Central Planning Region
Source: IPEDS Data Compiled by EMSI 2017.4
Employers in key sectors are increasingly addressing these shortfalls with postsecondary educators or by creating apprenticeships that yield industry-recognized credentials. For example, several new apprenticeships have been developed in IT, advanced manufacturing and healthcare.
County Labor Force Employed UnemployedUnemploy-ment Rate
Adams 264,480 256,368 8,112 3.1%Arapahoe 357,266 346,996 10,270 2.9%Boulder 191,647 186,913 4,734 2.5%Broomfield 38,121 37,087 1,034 2.7%Clear Creek 5,910 5,764 146 2.5%Denver 401,319 390,000 11,319 2.8%Douglas 184,513 179,952 4,561 2.5%Gilpin 3,624 3,547 77 2.1%Jefferson 330,097 321,297 8,800 2.7%Larimer 200,029 195,119 4,910 2.5%Total 1,977,006 1,923,043 53,963 2.7%
Unemployment Rate, November 2017, Colorado Central Planning Region
Source: US Bureau Labor Statistics, Local Area Unemployment Statistics
REGIONAL PROFILE ● 15

In the meantime, labor force experts from the Bureau of Labor Statistics, the Federal Reserve, Moody’s Analytics and a variety of the nation’s universities are all pointing to systematic labor shortages over the next 20 to 25 years because too few young people are replacing older workers leaving the workplace. Mark Zandi, the Chief Economist at Moody’s Analytics was quoted by Eduardo Porter of the New York Times in a September 19, 2017 article saying, “The problem going forward isn’t going to be unemployment. Over the next 20 to 25 years, a labor shortage is going to put a binding constraint on growth.” According to the Bureau of Labor Statistics, labor force participation has gone down from a high of 67.3% in January 2000 to 62.7% in December 2017. Because of these factors, the main strategic challenge in regional workforce development is how to draw more people into the labor force, ensure they are trained in business-relevant skills, and address issues which may be causing increased out-migration. Top Central Planning Region Occupations This staffing pattern table shows the top 20 occupations by percent of total employment in the region.
SOC Code Description 2017 Jobs 2022 Jobs Change % Change% Total Employ-
ment
Median Hourly
EarningsTypical Entry Level Education
41-2031 Retail Salespersons 57,375 63,249 5,874 10% 3.0% $11.32 No formal educational credential35-3021 Combined Food Preparation and Serving Workers, Including Fast Food 44,253 51,477 7,224 16% 2.3% $9.72 No formal educational credential43-6014 Secretaries and Administrative Assistants, Except Legal, Medical, and Executive 37,616 41,736 4,120 11% 1.9% $17.90 High school diploma or equivalent41-2011 Cashiers 36,812 40,127 3,315 9% 1.9% $10.21 No formal educational credential35-3031 Waiters and Waitresses 35,747 39,589 3,842 11% 1.8% $9.34 No formal educational credential43-9061 Office Clerks, General 35,480 40,253 4,773 13% 1.8% $17.74 High school diploma or equivalent29-1141 Registered Nurses 32,843 38,759 5,916 18% 1.7% $33.98 Bachelor's degree43-4051 Customer Service Representatives 32,097 35,935 3,838 12% 1.7% $16.76 High school diploma or equivalent13-1199 Business Operations Specialists, All Other 31,752 34,263 2,511 8% 1.6% $36.25 Bachelor's degree11-1021 General and Operations Managers 30,458 34,261 3,803 12% 1.6% $56.00 Bachelor's degree37-2011 Janitors and Cleaners, Except Maids and Housekeeping Cleaners 29,857 33,176 3,319 11% 1.5% $11.93 No formal educational credential13-2011 Accountants and Auditors 28,943 32,503 3,560 12% 1.5% $33.38 Bachelor's degree53-7062 Laborers and Freight, Stock, and Material Movers, Hand 25,271 28,246 2,975 12% 1.3% $13.22 No formal educational credential41-4012 Sales Representatives, Wholesale and Manufacturing, Except Technical and Scientific Products 24,339 26,402 2,063 8% 1.3% $29.12 High school diploma or equivalent43-5081 Stock Clerks and Order Fillers 22,842 25,121 2,279 10% 1.2% $12.03 No formal educational credential35-2014 Cooks, Restaurant 21,793 25,023 3,230 15% 1.1% $12.12 No formal educational credential25-1099 Postsecondary Teachers 21,769 24,888 3,119 14% 1.1% $32.84 Doctoral or professional degree15-1132 Software Developers, Applications 21,350 24,309 2,959 14% 1.1% $49.53 Bachelor's degree41-3099 Sales Representatives, Services, All Other 20,666 22,736 2,070 10% 1.1% $27.55 High school diploma or equivalent39-9021 Personal Care Aides 20,562 25,148 4,586 22% 1.1% $10.69 No formal educational credential
Sector Staffing Patterns, Colorado Central Planning Region
Source: EMSI 2017.4 QCEW Employees, Non-QCEW Employees & Self-Employed Class of Worker
Today’s main strategic challenge in regional workforce development is how to draw more people with business-relevant skills into the Front Range labor force, and at the same time retain the skilled workers we have.

Difficulty to Hire Real time labor market information is very useful in determining overall workforce development strategies moving forward. By looking at the relationship between the number of individual job listings versus average monthly hires, we are able to determine which occupations are most difficult to hire. This table shows difficulty to hire for the top 20 occupations in the region. This approach is less effective for sectors who don’t list many jobs online, such as construction.
Competitive Wage Analysis An increasingly short labor supply is beginning to drive wages up, as well as increasing benefits offered. Companies are increasingly strategizing ways to retain their existing labor force in the face of unemployment under 3%. This table shows where wage offers may have to fall to attract and retain workers based on estimated labor supply. The number of available applicants is estimated using Local Area Unemployment Statistics from the U.S. Bureau of Labor Statistics. This is then used in conjunction
with the projected number of annual openings (adjusted to reflect projected demand for one month) to create a point-in-time estimate of labor supply.
SOC Code DescriptionNumber
Jobs Annual
OpeningsAvailable
Applicants
Applicants per Job
Opening
Median Wage
10th Percentile
Wage
25th Percentile
Wage
Average Wage
75th Percentile
Wage
90th Percentile
Wage35-3021 Combined Food Preparation and Serving Workers, Including Fast Food 44,256 10,064 1,145 1.37 $9.72 $8.43 $8.90 $10.30 $11.00 $12.3935-3031 Waiters and Waitresses 35,749 7,797 925 1.42 $9.34 $8.53 $8.86 $11.45 $10.50 $18.2741-2011 Cashiers 36,815 7,797 953 1.47 $10.21 $8.72 $9.23 $10.92 $11.74 $14.1839-9021 Personal Care Aides 20,564 4,103 532 1.56 $10.69 $8.77 $9.63 $11.44 $12.33 $15.2035-2014 Cooks, Restaurant 21,794 3,880 564 1.74 $12.12 $9.46 $10.45 $12.77 $14.51 $17.4041-2031 Retail Salespersons 57,375 9,746 1,485 1.83 $11.32 $8.72 $9.59 $13.66 $14.56 $21.1453-7062 Laborers and Freight, Stock, and Material Movers, Hand 25,273 4,192 654 1.87 $13.22 $9.49 $10.80 $14.00 $16.62 $19.1937-2011 Janitors and Cleaners, Except Maids and Housekeeping Cleaners 29,858 4,679 773 1.98 $11.93 $9.07 $10.14 $13.08 $14.80 $19.5743-4051 Customer Service Representatives 32,094 5,029 831 1.98 $16.76 $11.05 $13.35 $17.74 $21.18 $26.0243-5081 Stock Clerks and Order Fillers 22,842 3,463 591 2.05 $12.03 $9.10 $10.08 $13.76 $16.61 $20.4143-9061 Office Clerks, General 35,482 5,327 918 2.07 $17.74 $10.61 $13.60 $19.17 $23.41 $29.7941-3099 Sales Representatives, Services, All Other 20,670 2,965 535 2.16 $27.55 $12.72 $18.52 $32.90 $40.55 $59.05
43-6014Secretaries and Administrative Assistants, Except Legal, Medical, and Executive
37,615 5,013 973 2.33 $17.90 $11.54 $14.39 $18.46 $22.36 $26.71
41-4012Sales Representatives, Wholesale and Manufacturing, Except Technical and Scientific Products
24,340 2,944 630 2.57 $29.12 $14.66 $20.82 $34.50 $40.04 $61.35
13-2011 Accountants and Auditors 28,945 3,371 749 2.67 $33.38 $21.38 $26.08 $37.86 $44.47 $58.3811-1021 General and Operations Managers 30,459 3,336 788 2.84 $56.00 $23.49 $35.33 $66.85 $86.98 $127.1825-1099 Postsecondary Teachers 21,769 2,377 563 2.84 $32.84 $16.25 $21.87 $38.96 $49.86 $66.0813-1199 Business Operations Specialists, All Other 31,753 3,432 822 2.87 $36.25 $20.84 $26.93 $38.66 $47.60 $60.9015-1132 Software Developers, Applications 21,351 2,022 553 3.28 $49.53 $31.12 $38.68 $50.27 $61.13 $73.3929-1141 Registered Nurses 32,845 2,960 850 3.45 $33.98 $25.39 $28.52 $34.60 $39.67 $46.54
Competitive Wage Analysis, Top 20 Occupations by Number Employed, Colorado Central Planning Region
Source: EMSI 2017.4 QCEW Employees, Non-QCEW Employees & Self-Employed Class of Worker
OccupationAvg Monthly
Postings Avg Monthly
HiresHires Per
ListingDifficulty to
HireRegistered Nurses 5,521 1,595 0.29 Very DifficultSoftware Developers, Applications 2,585 907 0.35 Very DifficultStock Clerks and Order Fillers 2,020 1,637 0.81 Very DifficultCustomer Service Representatives 2,251 1,918 0.85 Very DifficultSales Representatives, Services, All Other 1,285 1,295 1.01 DifficultAccountants and Auditors 1,292 1,620 1.25 DifficultRetail Salespersons 3,495 4,657 1.33 DifficultPostsecondary Teachers 689 1,028 1.49 DifficultSales Representatives, Wholesale and Manufacturing, Except Technical and Scientific Products 727 1,091 1.50 DifficultGeneral and Operations Managers 1,049 1,966 1.87 DifficultBusiness Operations Specialists, All Other 654 1,577 2.41 DifficultCashiers 1,133 3,279 2.89 DifficultCooks, Restaurant 867 2,710 3.13 MediumSecretaries and Administrative Assistants, Except Legal, Medical, and Executive 735 2,333 3.17 MediumCombined Food Preparation and Serving Workers, Including Fast Food 1,327 5,378 4.05 MediumLaborers and Freight, Stock, and Material Movers, Hand 505 2,505 4.96 MediumPersonal Care Aides 330 1,766 5.35 MediumJanitors and Cleaners, Except Maids and Housekeeping Cleaners 457 2,634 5.76 MediumWaiters and Waitresses 648 4,471 6.90 MediumOffice Clerks, General 270 2,362 8.74 Very Easy
Difficulty to Hire, Top Occupations, Colorado Central Planning Region
Source: EMSI 2017.4 QCEW Employees, Non-QCEW Employees & Self-Employed Class of Worker
REGIONAL PROFILE ● 17

Real Time Labor Market Information The following tables are generated through CEB Talent Neuron (formerly Wanted Analytics, now owned by Gartner, a research and advisory firm providing information technology related insight for IT and other business leaders located across the world. Its headquarters are in Stamford, Connecticut, United States.). This tool allows for analysis of real-time labor market information through aggregations of online job listings.
This data validates a vibrant, diverse and growing economy, with labor force becoming more competitive.
Occupation Occupation Code VolumeSame Period
Prior YearRegistered Nurses 29114100 7,004 7,983 Heavy and Tractor-Trailer Truck Drivers 53303200 5,124 4,584 Software Developers, Applications 15113200 4,392 3,558 Retail Salespersons 41203100 3,892 4,442 Network and Computer Systems Administrators 15114200 3,493 3,134 First-Line Supervisors of Food Preparation and Serving Workers 35101200 3,259 3,930 First-Line Supervisors of Office and Administrative Support Workers 43101100 3,247 3,503 Customer Service Representatives 43405100 3,144 3,998 First-Line Supervisors of Retail Sales Workers 41101100 3,013 3,299 Computer User Support Specialists 15115100 2,740 3,003 Maintenance and Repair Workers, General 49907100 2,633 2,825 Accountants 13201101 2,437 2,327 Light Truck or Delivery Services Drivers 53303300 2,384 2,380 Bookkeeping, Accounting, and Auditing Clerks 43303100 2,264 2,035 Marketing Managers 11202100 2,159 2,201 Combined Food Preparation and Serving Workers, Including Fast Food 35302100 2,148 2,139 Computer Systems Analysts 15112100 2,041 2,109 Maids and Housekeeping Cleaners 37201200 1,989 2,194 Web Developers 15113400 1,978 2,306 Security Guards 33903200 1,931 1,819
Top Jobs Currently Listed, Colorado Central Planning Region, Last 120 Days
Source: CEB Talent Neuron
Workplace Skills Core Skills CertificationsQuality Assurance Oral and written communication Basic Life Support (BLS)Java Integrity Scaled Agile Framework (SAFe)Linux Creativity Certified Registered Nurse (RNC)Python Detail oriented Certification in Cariopulmonary Resuscitation (CPR)Customer relationship management (CRM) Problem solving Secret ClearanceStructured Query Language (SQL) Marketing Commercial Driver's License (CDL)Technical Support Microsoft Office Advanced Cardiac Life Support (ACLS)Quality Control Customer service oriented OSHA CertificationPediatrics Team-oriented, teamwork Continued Education (CE)Preventive Maintenance Self-starting, self-motivated First Aid Certification
Top Skills & Certifications in Demand, Colorado Central Planning Region
Source: CEB Talent Neuron

Transportation This table shows the commute matrix for the ten Central Planning Region counties. For instance, when considering the 194,492 workers who live in Adams County, it is important for policy makers to note that of these, only 60,672 (31.2%) work in Adams County. The remaining 133,820 workers residing in Adams County commute elsewhere to work.
LIVE INCounty Adams Arapahoe Boulder Broomfield Clear Creek Denver Douglas Gilpin Jefferson Larimer
Adams 60,672 22,063 14,050 7,210 92 56,328 4,899 687 25,537 2,954Arapahoe 25,810 102,858 4,786 1,733 97 88,344 23,162 318 20,301 2,795Boulder 6,475 5,189 75,481 4,288 52 12,018 1,781 104 7,320 4,022Broomfield 4,812 1,855 7,358 3,838 19 5,908 497 49 3,767 474Clear Creek 254 302 125 38 740 614 90 101 812 67Denver 29,400 55,383 8,045 3,094 162 142,630 12,459 628 30,962 2,635Douglas 7,003 43,313 2,724 993 74 33,343 37,252 98 13,514 1,535Gilpin 119 125 381 21 29 236 38 682 342 24Jefferson 24,011 34,860 12,485 5,462 585 72,089 10,016 1,786 90,461 3,356Larimer 4,514 4,186 8,569 732 58 6,927 1,483 13 3,861 86,785
WORK IN
Source: US Census, Longitudinal Employer-Household Dynamics, On the Map
Commute Matrix, Colorado Central Planning Region
Top Companies Listing Positions, Colorado Central Planning Region
Number Listings
Same Period
Last YearRobert Half International 3,247 2,185 HCA - The Healthcare Company 3,171 2,448 University Of Colorado 2,753 1,464 SCL Health 2,680 297 Target Corporation 1,705 1,041 Spectrum 1,607 481 Colorado State Gov 1,434 871 City & County of Denver 1,065 456 Capital Markets Placement 1,065 0 Centura Health 1,039 1,472 BROOKDALE 959 919 Lockheed Martin 897 693 Aerotek 891 932 UC Health 878 215 Children's Hospital Colorado 829 527 The University of Colorado at Denver 788 792 Marriott 779 359 Randstad 764 751 Comcast Corporation 729 592 Ball Aerospace 706 516 Source: CEB Talent Neuron
REGIONAL PROFILE ● 19
In addition to CEB Talent Neuron, EMSI is now owned by Career Builder, and also offers insight into real-time labor market data from online job listings. EMSI has pioneered a concept called ‘listing intensity,’ which is how many different places a unique job opening must be listed in order to fill the position. At this writing, eight job postings are required to fill one unique job.

Between 2007 and 2016, the number of jobs in the region grew by 280,000 (16.9%) and the economy in the region is projected to add another 205,000 (10.2%) through 2022. The transportation infrastructure has not grown capacity at the same rate, and increased transportation gridlock adds to commute times and detracts from quality of life. On December 3, 2017, Aldo Svaldi of the Denver Post noted in an article titled, ‘More Coloradans moving out as population growth brings traffic headaches, higher home prices,’ that “those who are leaving in increasing numbers say they were driven away by rising housing prices, jobs that don’t pay enough and traffic jams.”
Affordable Housing - Rental As the Central Planning Region’s economy and population have grown rapidly, the availability of affordable housing has gone down. As a result, the median rents have risen significantly, and much of the multi-family rental development has taken place along the light rail corridor where rents demand premium prices. For example, a 2-bedroom apartment at the newly built Camden Lincoln Station complex will cost between $1,359 and $1,999 per month to rent.
The bar graph, taken from the most recent U.S. Census American Community Survey, combined with wage data from EMSI, shows the percent of people who cannot afford to rent a home in the county where they are working. The problem with lack of affordable housing is especially acute in Douglas and Gilpin counties.
Affordable Housing - Purchasing The millennial generation, which now outnumbers baby boomers in the labor force, is especially affected
by high home prices. Many millennials are now starting families, and finding to their dismay that even with two incomes, the American Dream of home ownership is increasingly out of their reach. This table, compiled using data from Trulia and Zillow, shows the money necessary for a 5% down payment, and estimated Principle, Interest, Tax and Insurance (PITI) payment based on current interest rates.
“Those who are leaving Colorado in increasing numbers say they were driven away by rising housing prices, jobs that don’t pay enough and traffic jams.” Denver Post
CountyMedian Listing Price (Trulia)
5% Down Payment
Estimated Monthly PITI at Current Interest
Rates (Zillow)
Annual Wage Necessary at 28% Debt-to-Income Ratio
Boulder $434,966 $21,748 $2,450 $105,000 Douglas $424,250 $21,213 $2,389 $102,386 Denver $380,000 $19,000 $2,148 $92,057 Jefferson $365,000 $18,250 $2,066 $88,543 Broomfield $350,000 $17,500 $1,984 $85,029 Clear Creek $322,500 $16,125 $1,833 $78,557 Arapahoe $320,000 $16,000 $1,820 $78,000 Larimer $310,000 $15,500 $1,765 $75,643 Gilpin $299,950 $14,998 $1,710 $73,286 Adams $265,000 $13,250 $1,532 $65,657
Purchasing a Home, Colorado Central Planning Region
Sources: Trulia and Zil low. The current mortgage interest rate at time of writing was 3.907%.

Other Issues Affecting Regional Workforce Development • Affordable & accessible postsecondary training opportunities are especially lacking for the
economically disadvantaged in the region. For example, the Temporary Aid to Needy Families (TANF)/Colorado Works and Supplemental Nutritional Aid Program (SNAP) Employment & Training program are set up to provide rapid attachment to work. However, many of the people who are receiving basic cash and food assistance in the region aren’t working because they lack business relevant skills, and find it difficult when they do find work to afford additional training, so they can access career paths that would allow them to fill critical jobs and become economically self-sufficient. Generally, there are two types of training opportunities:
o Work-Based – Denver, Arapahoe/Douglas and El Paso/Teller Workforce Development Areas are participating in the new Colorado Works Subsidized Training and Employment Program (STEP) grant initiative, which will create work-based learning opportunities where basic skills recipients can learn critical skills on the job, so they can achieve self-sufficiency while at the same time developing those business-relevant skills necessary to the continued competitiveness of key regional industries.
o Classroom – In 2017, national funding for Pell Grants was down to $3.9 billion. At the same time, federal funds have been reduced across the board for Adult Basic Education, English Language Proficiency and job training programs. In the meantime, according to Doug Webber at 538, between 2000 and 2014, tuition for higher education in Colorado rose at the highest rate in the United States. In the study, Webber says that, “by far the single biggest driver of rising tuitions for public colleges has been declining state funding for higher education.”
• Childcare – Many millennials are at the stage in their lives where they are starting families.
According to a 2014 Brief by Qualistar, the Women’s Foundation of Colorado, and the Colorado Children’s Campaign, childcare for an infant can cost $12,000 to $15,000 per year, and for a preschooler, range between $10,000 and $11,000 per year.
REGIONAL PROFILE ● 21

Conclusion One of the things that makes Colorado, and the Central Planning Region, unique, is our ability to work together to address issues and get things done. Many of the issues outlined above have been partisan issues. Now, because of the increasing acuteness of the labor shortage, leaders along the Front Range must come together and strategize real solutions. When we look at the economic development history of the region, we see that visionaries have created the groundwork for today’s regional economic prosperity. It is also increasingly apparent that current leaders must come together to grapple with issues affecting economic vitality and set new visions for the future that provide solutions for these issues. At this point, the region’s rapid economic growth has outstripped much of the infrastructure. In order to continue the economic growth and prosperity to which we have become accustomed in the region, we must work out strategies that take transportation, affordable housing, affordable and accessible postsecondary training opportunities, childcare and other quality of life issues into account.
Data Sources EMSI (Economic Modeling Systems, Incorporated) Developer was used for most workforce analysis. EMSI is based in Moscow, ID, and aggregates data from Colorado Department of Labor and Employment, the US Bureaus of Labor Statistics, Economic Analysis and Census, the U.S. Department of Education, and Career Builder. CEB Talent Neuron, (formerly Wanted Analytics, and now a Gartner affiliate), aggregates real-time labor market data from Indeed.com and allows a variety of analyses, including top skills, soft skills and certificates requested, top occupations posted, top companies posting, and job posting volume.
Now, because of the increasing acuteness of the labor shortage, leaders along the Front Range must come together and strategize real solutions that take transportation, affordable housing, access and affordability of business-relevant training, and other quality of life issues into account.

Colorado State Demography Office Metro Denver Economic Development Corporation Price Waterhouse Cooper Money Tree Venture Capital Report U.S. Bureau of Labor Statistics
• Local Area Unemployment Statistics • Employment Situation • Consumer Expenditure Survey
U.S. Census America Community Survey U.S. Census Longitudinal Employer-Household Dynamics
• On the Map • Quarterly Workforce Indicators • J2J (Job to Job)
U.S. Department of Education, National Student Loan Data System Other Sources Josuweit, Andy, “2017 Student Loan Debt Statistics: A comprehensive look at the student loan situation in the United States — backed by numbers and data,” Student Loan Hero.com, 2017. Staff, “Child Care Prices and Affordability: A Struggle for Colorado Families and Providers,” Qualistar, the Women’s Foundation of Colorado, and the Colorado Children’s Campaign, June 2014. Svaldi, Aldo, “More Coloradans moving out as population growth brings traffic headaches, higher home prices,” Denver Post, December 3, 2017. Webber, David, “Fancy Dorms Aren’t the Main Reason Tuition Rates are Skyrocketing,” Five Thirty Eight.com, September 13, 2016.
ECONOMIC IMPACT & REGIONAL PROFILE ● 27
REGIONAL PROFILE ● 23

Acknowledgements The research, writing and design for this paper was done by Patrick Holwell, Workforce Economist, Dawn Gardner, Sector Coordinator, and Tanya Muniz, Supervisor, Arapahoe/Douglas Workforce Development Board Staff. The paper was peer-reviewed by the Central Planning Region Data Group, which includes:
• Judy Emery, Director, Colorado Urban Workforce Alliance • Amanda Repella, Larimer County Economic Development • Todd Nielsen, Denver Workforce Services, Office of Economic Development • Greg McBoat, Adams County Workforce and Business Center • Kyle Allbright, Jefferson County Business and Workforce Center • Barbara Larsen, Workforce Boulder County • Vanessa Oldham-Barton, Broomfield Workforce Center • Petra Chavez, Arapahoe/Douglas Works!


