Arai presentation
15
Perception of Objects in Technical Illustrations: A Challenge in Technical Communication s1170002 Yu Arai CLR Technical Communication Laboratory Supervised by Prof. Debopriyo Roy 2/14/2013 1
-
Upload
debopriyo-roy -
Category
Technology
-
view
107 -
download
2
Transcript of Arai presentation

Perception of Objects in Technical Illustrations: A Challenge in Technical Communication
s1170002 Yu Arai CLR Technical Communication Laboratory Supervised by Prof. Debopriyo Roy 2/14/2013
1
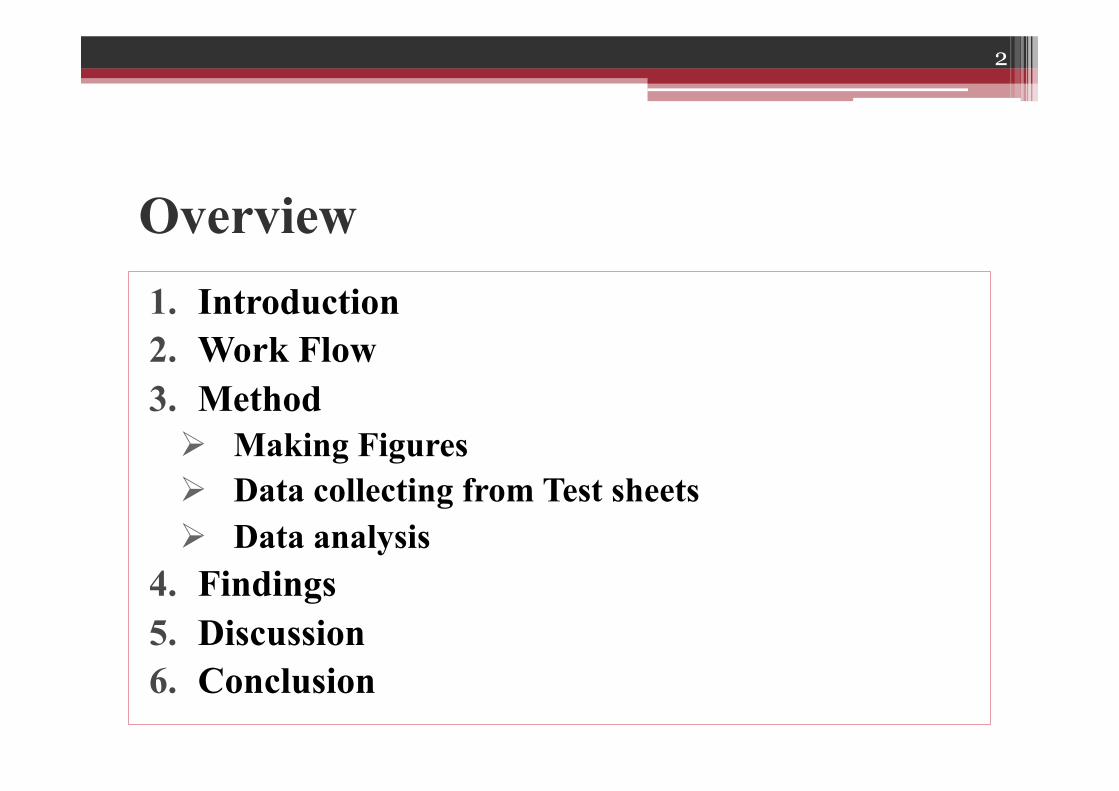
Overview 1. Introduction 2. Work Flow 3. Method Ø Making Figures Ø Data collecting from Test sheets Ø Data analysis
4. Findings 5. Discussion 6. Conclusion
2
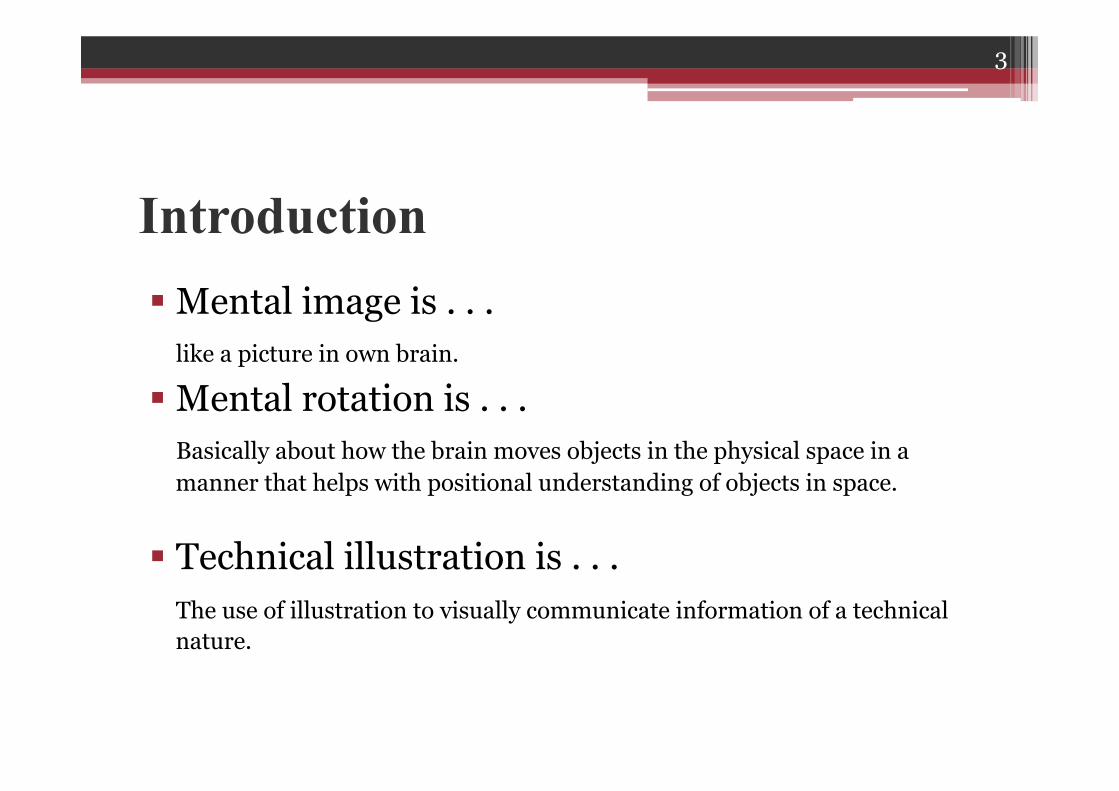
Introduction § Mental image is . . . like a picture in own brain.
§ Mental rotation is . . . Basically about how the brain moves objects in the physical space in a manner that helps with positional understanding of objects in space.
§ Technical illustration is . . . The use of illustration to visually communicate information of a technical nature.
3

Work Flow Make Figures ↓ Top view version figures ↓ Make Test seats ↓ Take test ↓ Data collect ↓ Analysis ↓ SPSS ↓ Discussions ↓ Conclusions
4

Method – Making Figures (POSER) Heights a. Chest height b. Waist height
Activities a. Holding a Ball b. Throwing a Ball
Camera Positions 1. Front – 0degree 2. 1/3rd Side – 30 degrees 3. Side – 90 degrees 4. 1/3rd Back – 120 degrees 5. Back – 180 degrees
5
B : Top of view
A : Basic View

Method – Data collecting ü 41 students who are non-native English speaker participated in this study. ü Having 20 test sheets.
6
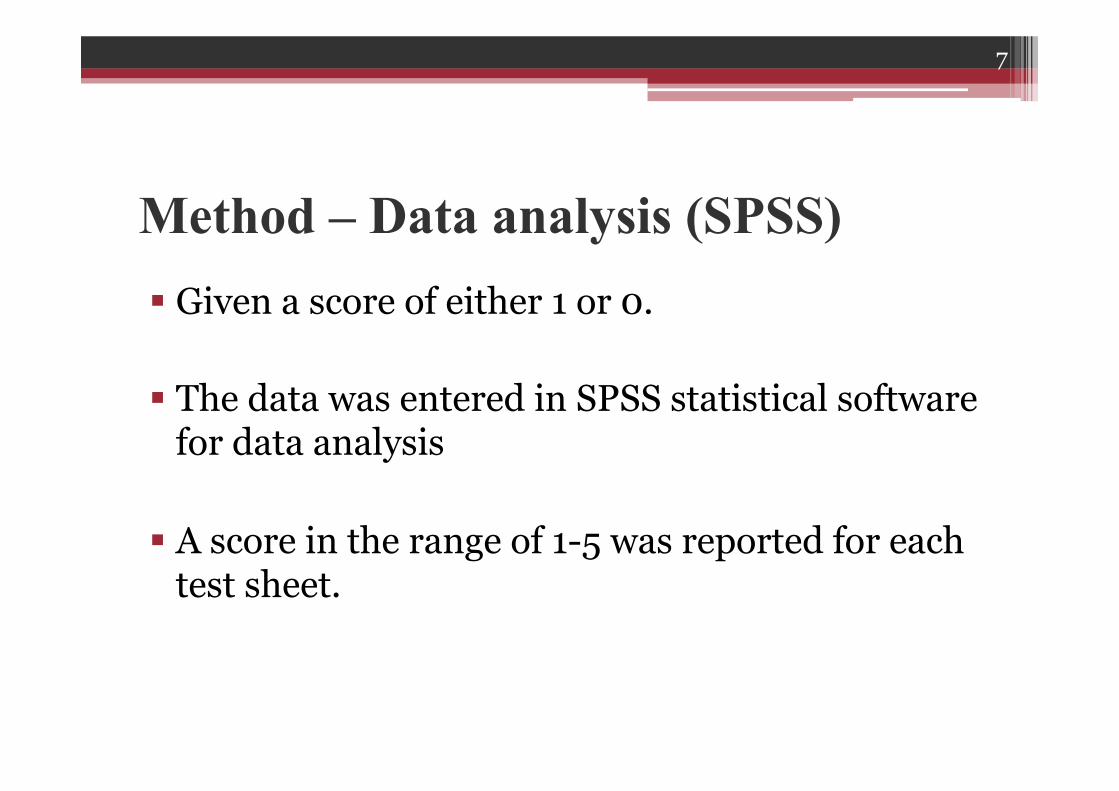
Method – Data analysis (SPSS) § Given a score of either 1 or 0.
§ The data was entered in SPSS statistical software for data analysis
§ A score in the range of 1-5 was reported for each test sheet.
7

Finding – Cochran Test • Correct Answer : 1 • Incorrect Answer : 0 • Q = 17.968 Asymp.sig. = .525 • P > .05
8

Chest height – Confidence data
3.80
3.68
3.80 3.80
3.73
3.53
3.63
3.70
3.85
3.73
3.30
3.40
3.50
3.60
3.70
3.80
3.90
Front 1/3 side Side 1/3 back Back
Holding
Throwing
9

Waist height – Confidence data
3.93 3.93
3.80
3.90
3.73
3.95
3.78 3.78 3.80
3.83
3.60
3.65
3.70
3.75
3.80
3.85
3.90
3.95
4.00
Front 1/3 side Side 1/3 back Back
Holding
Throwing
10

Finding – Friedman test • 20 body positions/ height/ action
ü Chi-square = 25.172 ü Asymp.sig. = .115 > .05
11

Finding – Confidence level Correlations Between Personal Value Sig. Value
Throwing Chest Back .514** .001
Throwing Waist Side .474** .002
Holding Waist Back .439** .005
Holding Waist Front .429** .006
Throwing Waist 1/3rd Back .406** .009
12
Significant Correlations between Mean Accuracy Scores and Confidence Scores
Significant Correlations between Mean Accuracy Scores and Confidence Scores Significant Correlations between Mean Accuracy Scores and Confidence Scores
Discussion Ø Body height/rotation/action § When compared with a plan view, it becomes
more various visual cues. • Accuracy score around the 85 – 95% level
Ø Similarity body height – action - rotation § 20 body position – insignificant difference § Height/Action combinations – insignificant
difference
13

Conclusion and Future research § Explored the effect of Body rotation, height and
action ü Increased the accuracy levels ü reader’s interesting approach
§ In the future research… o The level of correctness should be analyzed carrying out
time observation.
14

Thank you
15