Ar Budgetrev 2007
41
Board of Governors of the Federal Reserve System 2007
-
Upload
fraser-federal-reserve-archive -
Category
Documents
-
view
218 -
download
0
Transcript of Ar Budgetrev 2007
Board of Governors of the Federal Reserve System
2007
Board of Governors of the Federal Reserve System
2007

April 2007
This publication is available from Publications Fulfillment, MS-127, Board of Governors of the Federal Reserve System, Washington, DC 20551. It is also available on the Board’s web site, www.federalreserve.gov.
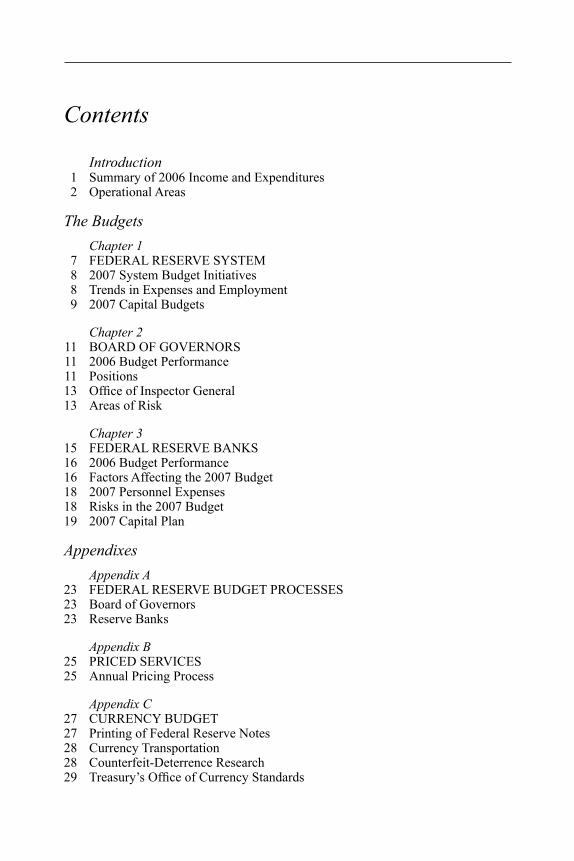
Contents
Introduction 1 Summary of 2006 Income and Expenditures
2 Operational Areas
The Budgets Chapter 1
7 FEDERAL RESERVE SYSTEM
8 2007 System Budget Initiatives8 Trends in Expenses and Employment9 2007 Capital Budgets
Chapter 2 11 BOARD OF GOVERNORS 11 2006 Budget Performance 11 Positions 13 Office of Inspector General 13 Areas of Risk
Chapter 3 15 FEDERAL RESERVE BANKS 16 2006 Budget Performance 16 Factors Affecting the 2007 Budget 18 2007 Personnel Expenses 18 Risks in the 2007 Budget 19 2007 Capital Plan
Appendixes Appendix A
23 FEDERAL RESERVE BUDGET PROCESSES 23 Board of Governors 23 Reserve Banks
Appendix B 25 PRICED SERVICES 25 Annual Pricing Process
Appendix C 27 CURRENCY BUDGET 27 Printing of Federal Reserve Notes 28 Currency Transportation 28 Counterfeit-Deterrence Research 29 Treasury’s Office of Currency Standards
Appendix D 31 EXPENSES AND EMPLOYMENT AT THE BOARD OF GOVERNORS
Appendix E 35 EXPENSES AND EMPLOYMENT AT THE FEDERAL RESERVE BANKS
40 MAPS OF THE FEDERAL RESERVE SYSTEM
Introduction 1
Introduction
The Federal Reserve System—the nation’s central bank—consists of the Board of Governors in Washington, D.C., the twelve Federal Reserve Banks with their twenty-five Branches distributed throughout the nation, the Federal Open Market Committee (FOMC), and three advisory groups—the Federal Advisory Council, the Consumer Advisory Council, and the Thrift Institutions Advisory Council. The System was created in 1913 by Congress to establish a safe and flexible monetary and banking system. Over the years, Congress has given the Federal Reserve more authority and responsibility for achieving broad national economic and financial objectives.
The duties of the Federal Reserve fall into four general areas: (1) conducting the nation’s monetary policy by infl uencing the monetary and credit conditions in the economy in pursuit of maximum employment, stable prices, and moderate long-term interest rates; (2) supervising and regulating banking institutions to ensure the safety and soundness of the nation’s banking and financial system and to protect the credit rights of consumers; (3) maintaining the stability of the financial system and containing systemic risk that may arise in financial markets; and (4) providing financial services to depository institutions, the U.S. government, and foreign official institutions.
The Federal Reserve System plays a major role in the nation’s payment mechanism. The Reserve Banks distribute currency and coin; process Fedwire, automated clearinghouse, and securities transfers; and collect checks. In addition, the Federal Reserve Banks serve as the fiscal agents of the United States and provide a variety of financial services for the Treasury, other government agen
cies, and other fiscal principals. For a fuller discussion of the Federal Reserve’s responsibilities, see the Board publication
The Federal Reserve System: Purposes and Functions.
Summary of 2006 Income and Expenditures
In carrying out its responsibilities in 2006, the Federal Reserve System incurred an estimated $1.6 billion in net operating expenses. Total spending of an estimated $3.1 billion was offset by an estimated $1.5 billion in revenue from priced services, claims for reimbursements, and other income.
The major source of Federal Reserve Bank income is earnings from the portfolio of U.S. government securities in the System Open Market Account, estimated at $36.5 billion in 2006. Earnings in excess of expenses, dividends, and surplus are transferred to the U.S. Treasury—in 2006 an estimated $28.5 billion. (These earnings are treated as receipts in the U.S. budget accounting system and as anticipated earnings projected by the Office of Management and Budget in the U.S. budget.)
The information for 2006 is based on expense estimates developed as part of the budget process. Total 2006 expenses were $3,058.3 million, a decrease of $24.1 million, or 0.8 percent, from the 2006 estimate of $3,082.4 million.1
1. Beginning with the 1998–99 budget, the Board of Governors has operated on a two-year budget cycle and a four-year planning cycle. Given their current business needs, the Federal Reserve Banks maintain an annual budget cycle. For more information on the budget processes, see appendix A.
2 Annual Report: Budget Review, 2007
Operational Areas
In 2006 the Federal Reserve System accounted for costs using the following categories: monetary and economic policy, supervision and regulation of financial institutions, services to financial institutions and the public, services to the U.S. Treasury and other government agencies, and System policy direction and oversight.
Monetary and Economic Policy
The monetary and economic policy operational area encompasses Federal Reserve actions to influence the availability and cost of money and credit in the nation’s economy. In 2006, the FOMC held eight regularly scheduled meetings and adjusted the federal funds rate four times.
A vast amount of banking and financial data flows through the Reserve Banks to the Board, where the data are compiled and made available to the public. The research staffs at the Board and the Reserve Banks use these data, along with information collected by other public and private institutions, to assess the state of the economy and the relationships between the financial markets and economic activity. Staff members provide background information for the Board of Governors and for each meeting of the FOMC by preparing detailed economic and financial analyses and projections for the domestic economy and international markets. The Board and the FOMC use these analyses and projections in setting reserve requirements, setting the discount rate (which affects the cost of borrowing), and conducting open market operations. Staff members also conduct longer-run economic studies on regional, national, and international issues.
Supervision and Regulation
The Federal Reserve System plays a major role in the supervision and regulation of banks and bank holding companies. The Board of Governors adopts regulations to carry out statutory directives and establishes System supervisory and regulatory policies. The Reserve Banks conduct on-site examinations and inspections of state member banks and bank holding companies; review applications for mergers, acquisitions, and changes in control from banks and bank holding companies; and take formal supervisory actions. In 2006, the Federal Reserve conducted 500 examinations of state member banks (some of them jointly with state agencies) and 557 inspections and 3,257 risk assessments of bank holding companies; it acted on 1,378 proposals, representing 3,171 individual applications involving bank holding company formations and acquisitions, bank mergers, and other transactions.
The Board also enforces state member banks’ and certain foreign banking organizations’ compliance with the federal laws protecting consumers in their use of credit and deposit products. Between July 1, 2005, and June 30, 2006, the System conducted 321 consumer compliance examinations: 303 covering state member banks and 18 covering foreign banking organizations. Additionally, during the 2005 reporting period, the System performed 276 Community Reinvestment Act examinations.
The Board’s supervisory responsibilities also extend to the foreign operations of U.S. banks and, under the International Banking Act, to the U.S. operations of foreign banks. Beyond these activities, the Federal Reserve System maintains continuous oversight of the banking industry to ensure the overall safety and soundness of the fi nancial system. This broader responsibility is reflected in the
Introduction 3
System’s presence in fi nancial markets, through open market operations, and in its role as lender of last resort.
Services to Financial Institutions and the Public
The Federal Reserve System plays a central role in the nation’s payment systems by ensuring that enough currency and coin are in circulation to meet the public’s demand. The Bureau of Engraving and Printing prints currency and the U.S. Mint mints coin, which the Reserve Banks distribute to the public through depository institutions. Reserve Banks also receive deposits of currency and coin from depository institutions, identify suspect currency that they forward to the U.S. Secret Service, and destroy currency that is unfit for circulation. In 2006, the Reserve Banks received approximately $689.1 billion in currency and $5.8 billion in coin from depository institutions, distributed approximately $711.2 billion in currency and $6.9 billion in coin, and destroyed $84.7 billion in unfit currency.
The Reserve Banks also play a central role in the nation’s payment systems by collecting checks and providing a variety of electronic services for depository institutions. In 2006, the Reserve Banks collected approximately 11.0 billion commercial checks, with a total value of about $13.6 trillion. The Reserve Banks’ automated clearinghouse (ACH) service allows depository institutions to send or receive credit and debit payment transactions. ACH payments are typically used for check payments, such as payroll, dividend, mortgage, and bill payments. In 2006, the Reserve Banks processed approximately 9.2 billion ACH transactions, valued at about $16.6 trillion. Approximately 11 percent of the transactions were for the federal gov
ernment; the rest were for commercial establishments.
The Reserve Banks’ Fedwire Funds Service allows depository institutions to draw on their reserve or clearing balances at the Reserve Banks and to transfer funds to other institutions that maintain accounts at the Reserve Banks. In 2006, the Reserve Banks processed more than 134 million Fedwire funds transfers, valued at more than $573 trillion.
The Reserve Banks’ National Settlement Service allows participants in private clearing arrangements to settle transactions through their Federal Reserve accounts. Approximately 54 local and national private arrangements, primarily check clearinghouse associations but also other types of arrangements, use the National Settlement Service. In 2006, the Reserve Banks processed over 470,000 settlement entries for these arrangements.
The Reserve Banks’ Fedwire Securities Service provides securities services for the handling of book-entry (computerbased) securities. The service allows participants to electronically transfer to other participants securities issued by the Treasury, federal government agencies, and other approved entities. In 2006, participants originated approximately 23 million transfers valued at about $386 trillion.
Services to the U.S. Treasury and Other Government Agencies
Pursuant to the Federal Reserve Act, the Reserve Banks provide fiscal agency and depository services to the U.S. government and other fiscal principals. These services relate to securities custody and transfer, payments, deposits, and customer support. The federal government and other fiscal principals reimburse the Reserve Banks for the cost to provide
4 Annual Report: Budget Review, 2007
these services. In 2006, Reserve Banks sought reimbursement of approximately $426 million. Reimbursement was received or is expected for all of the expenses incurred.2
2. The Reserve Banks are required by the Federal Reserve Act to serve as fiscal agents and depositories of the United States. By statute, the Department of the Treasury is permitted, but not required, to pay for these services.
Reserve Banks issue, service, and redeem marketable Treasury securities and savings bonds and process secondary-market Fedwire securities transfers. In 2006, the Reserve Banks processed 148,000 commercial tenders for Treasury securities and printed and mailed nearly 29 million savings bonds. The Reserve Banks operate two book-entry (computer-based) securities systems for the custody of Treasury securities—the Fedwire securities service and a separate computer application designed for retail investors who plan to hold these securities until maturity. Almost all book-entry Treasury securities are maintained on Fedwire, which is also the nation’s principal securities transfer mechanism.
Reserve Banks collect and disburse funds on behalf of the federal government. The Reserve Banks maintain the Treasury’s bank account, accept deposits, pay checks drawn on the Treasury’s account, and make Fedwire and automated clearinghouse payments for the Treasury. In 2006, the Reserve Banks continued to assist Treasury in its efforts to receive and make payments electronically. For example, the Reserve Banks operate the Pay.gov Internet portal, which permits the public to pay Treasury and agencies over the Internet.
The Federal Reserve Bank of St. Louis, on behalf of the Federal Reserve System,
invests excess Treasury balances with approximately 1,000 depository institutions, which pay interest to the Treasury for the use of the funds. In 2006, the Federal Reserve invested approximately $1.3 trillion of Treasury balances through the program and collected over one billion dollars in interest. Of these funds, $309.2 billion are callable on demand and pay interest equal to the federal funds rate less 25 basis points; $508 billion were placed with depository institutions for a set term, with the interest rate set at auction. In addition, $478.9 billion of these Treasury funds were placed with depository institutions through reverse repurchase agreements at an agreed-on interest rate.
The Reserve Banks also provide fiscal agency and depository services to other domestic and international entities. Depending on the authority under which the services are provided, the Reserve Banks may maintain book-entry accounts of securities, provide custody for the stock of unissued, definitive (physical) securities, maintain and update balances of outstanding book-entry and definitive securities for issuers, and maintain related funds accounts.
System Policy Direction and Oversight
This operational area encompasses activities by the Board of Governors in supervising Board and Reserve Bank programs. At the System level, the expenses for these activities are considered overhead and are therefore allocated across the other operational areas. At the Board level, these expenses are not treated as overhead or allocated to other operational areas.

The Budgets
Federal Reserve System 7
Chapter 1
Federal Reserve System
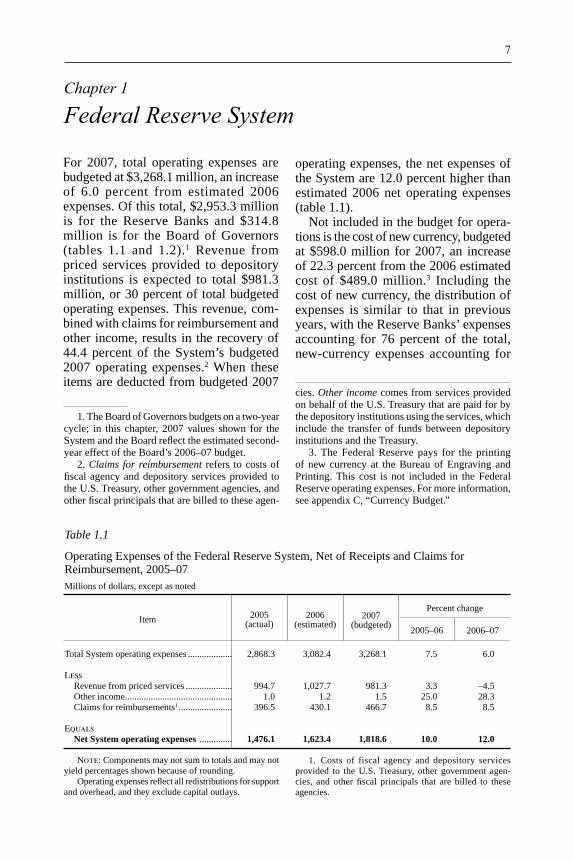
For 2007, total operating expenses are budgeted at $3,268.1 million, an increase of 6.0 percent from estimated 2006 expenses. Of this total, $2,953.3 million is for the Reserve Banks and $314.8 million is for the Board of Governors (tables 1.1 and 1.2).1
1. The Board of Governors budgets on a two-year cycle; in this chapter, 2007 values shown for the System and the Board reflect the estimated second-year effect of the Board’s 2006–07 budget.
Revenue from priced services provided to depository institutions is expected to total $981.3 million, or 30 percent of total budgeted operating expenses. This revenue, combined with claims for reimbursement and other income, results in the recovery of 44.4 percent of the System’s budgeted 2007 operating expenses.2
2. Claims for reimbursement refers to costs of fiscal agency and depository services provided to the U.S. Treasury, other government agencies, and other fiscal principals that are billed to these agen
cies.
-
Other income comes from services provided on behalf of the U.S. Treasury that are paid for by the depository institutions using the services, which include the transfer of funds between depository institutions and the Treasury.
When these items are deducted from budgeted 2007
operating expenses, the net expenses of the System are 12.0 percent higher than estimated 2006 net operating expenses (table 1.1).
Table 1.1
Operating Expenses of the Federal Reserve System, Net of Receipts and Claims for Reimbursement, 2005–07
Item 2005 (actual)
2006 (estimated)
2007 (budgeted)
Percent change
2005–06 2006–07
Total System operating expenses
LessRevenue from priced servicesOther incomeClaims for reimbursements1
Equals Net System operating expenses
2,868.3
994.7 1.0
396.5
1,476.1
3,082.4
1,027.7 1.2
430.1
1,623.4
3,268.1
981.31.5
466.7
1,818.6
7.5 6.0
3.3 –4.5 25.0 28.38.5 8.5
10.0 12.0
1. Costs of fiscal agency and depository services provided to the U.S. Treasury, other government agen-cies, and other fiscal principals that are billed to these agencies.
Note: Components may not sum to totals and may not yield percentages shown because of rounding.
Operating expenses reflect all redistributions for support and overhead, and they exclude capital outlays.
...................
....................
.............................................. .......................
..............
Millions of dollars, except as noted
Not included in the budget for operations is the cost of new currency, budgeted at $598.0 million for 2007, an increase of 22.3 percent from the 2006 estimated cost of $489.0 million.
3
3. The Federal Reserve pays for the printing of new currency at the Bureau of Engraving and Printing. This cost is not included in the Federal Reserve operating expenses. For more information, see appendix C, “Currency Budget.”
Including the cost of new currency, the distribution of expenses is similar to that in previous years, with the Reserve Banks’ expenses accounting for 76 percent of the total, new-currency expenses accounting for
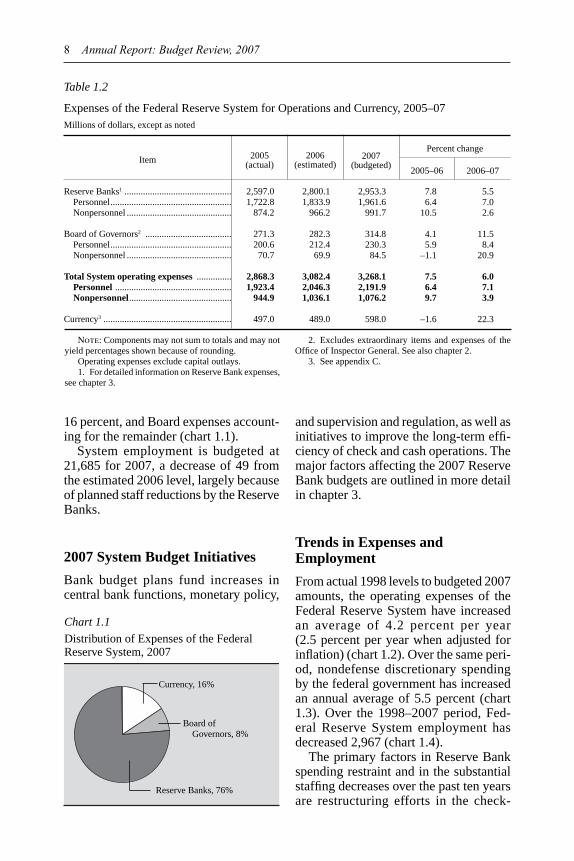
8 Annual Report: Budget Review, 2007
Table 1.2
Expenses of the Federal Reserve System for Operations and Currency, 2005–07
Millions of dollars, except as noted
Item 2005 (actual)
2006 (estimated)
2007 (budgeted)
Percent change
2005–06 2006–07
Reserve Banks1 .............................................. Personnel .................................................... Nonpersonnel .............................................
Board of Governors2 ..................................... Personnel .................................................... Nonpersonnel . ............................................
Total System operating expenses ...............Personnel .................................................. Nonpersonnel............................................
Currency3 .......................................................
2,597.0 1,722.8
874.2
271.3 200.6 70.7
2,868.3 1,923.4
944.9
497.0
2,800.1 1,833.9
966.2
282.3 212.4 69.9
3,082.4 2,046.3 1,036.1
489.0
2,953.3 1,961.6
991.7
314.8 230.3 84.5
3,268.1 2,191.9 1,076.2
598.0
7.8 5.5 6.4 7.0
10.5 2.6
4.1 11.5 5.9 8.4
–1.1 20.9
7.5 6.0 6.4 7.19.7 3.9
–1.6 22.3
Note: Components may not sum to totals and may not yield percentages shown because of rounding.
Operating expenses exclude capital outlays. 1. For detailed information on Reserve Bank expenses,
see chapter 3.
2. Excludes extraordinary items and expenses of the Office of Inspector General. See also chapter 2.
3. See appendix C.
16 percent, and Board expenses accounting for the remainder (chart 1.1).
Chart 1.1
Distribution of Expenses of the Federal Reserve System, 2007
Currency, 16%
Board of Governors, 8%
Reserve Banks, 76%
System employment is budgeted at 21,685 for 2007, a decrease of 49 from the estimated 2006 level, largely because of planned staff reductions by the Reserve Banks.
2007 System Budget Initiatives
Bank budget plans fund increases in central bank functions, monetary policy,
and supervision and regulation, as well as initiatives to improve the long-term efficiency of check and cash operations. The major factors affecting the 2007 Reserve Bank budgets are outlined in more detail in chapter 3.
Trends in Expenses and Employment
From actual 1998 levels to budgeted 2007 amounts, the operating expenses of the Federal Reserve System have increased an average of 4.2 percent per year (2.5 percent per year when adjusted for inflation) (chart 1.2). Over the same period, nondefense discretionary spending by the federal government has increased an annual average of 5.5 percent (chart 1.3). Over the 1998–2007 period, Federal Reserve System employment has decreased 2,967 (chart 1.4).
The primary factors in Reserve Bank spending restraint and in the substantial staffing decreases over the past ten years are restructuring efforts in the check
Federal Reserve System 9
Chart 1.2
Operating Expenses of the Federal Reserve System, 1998–2007 Excludes special projects
1998 2000 2002 2004 2006
Current dollars
2000 dollars1
Billions of dollars
1.0
3.0
2.0
Note: For 2006, estimated; for 2007, budgeted. 1. Calculated with the GDP price defl ator.
Chart 1.3
Cumulative Change in Federal Reserve System Expenses and Federal Government Expenses, 1998–2007 Includes special projects
1998 2000 2002 2004 2006
Percent
Federal government
Federal Reserve
60
40
20
Note: Federal government expenses are discretionary spending less expenditures on defense.
For 2006, estimated; for 2007, budgeted.
Chart 1.4
Employment in the Federal Reserve System, 1998–2007 Includes special projects
1998 2000 2002 2004 2006
Thousands of persons
25
23
21
Note: For 2006, estimated; for 2007, budgeted.
processing function and efficiency measures in support and overhead functions. Over the same ten-year period, check costs increased 0.8 percent and staffing levels declined 7.1 percent. Local support
and overhead costs increased 1.6 percent and staffing levels declined 3.9 percent.
2007 Capital Budgets
The capital budget for the Reserve Banks and the Board totals $607.5 million, with $591.6 million budgeted for Reserve Banks and Federal Reserve Information Technology (FRIT) and $15.9 million budgeted for the Board. As in previous years, the 2007 capital budgets include funding for projects that support the strategic direction outlined by the individual Reserve Banks, System business leaders, and the Board. These strategic goals focus on investments that improve operational efficiencies and services to Bank customers and on providing a safe, quality work environment. More detailed discussions of the Board and Reserve Bank capital budgets are included in chapters 2 and 3, respectively.
Board of Governors 11
Chapter 2
Board of Governors
The Board of Governors operates under a two-year budget. In December 2005, the Board approved the 2006–07 budget. During the two-year budget cycle, minor changes occur within the budget, which are captured in an operating plan for each division. Any increase to the overall budget must be approved by the Board.
The Board’s 2006–07 budget consists of $609.5 million for operations, $31.4 million for capital, and $10.2 million for the Office of Inspector General. The operations budget includes $9.0 million for extraordinary items; these items include the two surveys administered by the Board every three years: the Survey of Small Business and the Survey of Consumer Finances. (See table 2.1.)
2006 Budget Performance
The Board’s operations budget supports four broadly defined operational areas: (1) monetary and economic policy; (2) supervisory, regulatory, and legal services; (3) Federal Reserve System policy direction; and (4) support and security services (tables 2.1 and 2.2). In 2006, estimated operating expenses were $282.5 million, or 46.3 percent of the two-year budget.
The Board’s budget is composed of expenses for personnel, goods and services, and capital. Estimated 2006 personnel expenses, which represent about three-quarters of budgeted operating expenses, were $212.4 million, or 47.5 percent of the two-year personnel services budget. Personnel expenses were less than budgeted because the Board experienced higher-than-expected vacancy rates, which resulted in lower-than-expected salary and benefits expenses. The job market for many of the Board’s economist,
analytical, legal, and technical positions is very competitive, and the Board seeks to hire high-caliber individuals. Therefore, the Board’s human resources function continuously evaluates its recruitment efforts and tools relative to the Board’s competitors. Although recruitment challenges have not kept the Board’s operational areas from accomplishing their missions, they have resulted in increased staff workload. By the end of the two-year budget cycle, the Board expects personnel costs to approximate budgeted costs.
Estimated goods and services expenses for 2006 were $70.0 million, or 43.1 percent of the two-year goods and services budget. The underage was due to delays in acquiring certain contractual professional services and purchasing furniture and equipment, which will shift some expenses into the second year of the budget. In addition, expenses for some consulting work have been lower than budgeted. The postponement of some building repairs and capital improvements also contributed to the lower-than-expected expenses.
The Board’s 2006–07 capital budget is $31.4 million. In 2006, estimated capital expenditures were $8.8 million, or 28.0 percent of the two-year capital budget. The rate of expenditures in 2006 was consistent with the planned timing of capital projects for the period. Capital expenditures needed to support operations are primarily related to facilities improvements and acquisitions of computer hardware and software. Such expenditures generally are not incurred equally throughout the budget period.
Positions
Since the beginning of the 2006–07 budget period, the number of authorized
12 Annual Report: Budget Review, 2007
Table 2.1
Expenses of the Board of Governors for Operational Areas, Extraordinary Items, Capital, and the Office of Inspector General, 2004–07 Millions of dollars, except as noted
Operational area or Office of Inspector General
2004–05 (budgeted)
2004–05 (actuals)
2006–07 (budgeted)
2006 actual expenses as a percent of the
2006–07 budget
Monetary and economic policy ...............................Supervisory, regulatory, and legal services .............Federal Reserve System policy direction ................Support and security services ..................................Extraordinary items .................................................
Total, Board operations .......................................
Total, capital ..........................................................
Office of Inspector General .....................................
129.5 173.2 52.6
171.9 10.0
537.2
34.0
8.5
129.5 172.0
51.6 172.1
9.4
534.6
31.3
8.1
143.1 206.4
55.6 195.4
9.0
609.5
31.4
10.2
46.6 46.7 49.6 46.4 10.1
46.3
28.0
43.5
Note: Components may not sum to totals and may not yield percentages shown because of rounding.
Table 2.2
Positions Authorized at the Board of Governors for Operational Areas, Extraordinary Items, and the Office of Inspector General, 2004–07
Operational area or Office of Inspector General
2004–05 (initial)
2004–05 (ending)
2006–07 (initial)
2006–07 (midbiennial)
Monetary and economic policy ................................ Supervisory, regulatory, and legal services ..............Federal Reserve System policy direction ................. Support and security services1 ................................. Extraordinary items ..................................................
Total, Board operations .........................................
Office of Inspector General ......................................
459 540 172 724 . . .
1,895
31
465 562 172 759 . . .
1,958
31
466 567 173 770 . . .
1,976
36
467 573 174 788 . . .
2,002
36
1. Includes summer interns and youth positions and the Home Mortgage Disclosure Act and the Community positions that support the Federal Financial Institutions Reinvestment Act. Examination Council for processing data collected under
Board of Governors 13
positions increased by twenty-six, bringing the total to 2,002 positions. These new positions were necessitated by increases in staff workload, including work related to the Board’s compliance with the Federal Information Security Management Act (FISMA) and its voluntary compliance with the principles of the Sarbanes-Oxley Act. The largest single increase was in the Division of Information Technology, which added ten new positions, eight of which were for FISMA-related work. The Management Division added eight new positions, five of which were to assist with FISMA and human resources compliance efforts.
Office of Inspector General
In keeping with its statutory independence, the Office of Inspector General (OIG) prepares its proposed budget apart from the Board’s budget and presents it directly to the Chairman of the Board for the Board’s consideration. The 2006–07 OIG budget is $10.2 million. In 2006, estimated expenses were $4.5 million, or 43.5 percent of the two-year budget. The number of authorized positions in the OIG remained unchanged at thirty-six.
Areas of Risk
Despite a careful and coordinated planning effort, future developments, such as the following, could require resources beyond what is currently approved:
• a higher-than-expected rate of increase in health insurance costs
• changes to turnover assumptions due to demographics and the estimated salaries of successors
• pressure in key areas requiring additional salary or benefit packages in order for the Board to remain competitive
• significant changes in or shocks to the economy or financial system that create a material increase in workload
• terrorist activity requiring additional security and contingency enhancements
• increased workload created by laws or decisions to expand or modify central bank operations
• changes to the position-vacancy-rate assumptions used in developing the salary budget and a need for additional office space if the staff increases.
Federal Reserve Banks 15
Chapter 3
Federal Reserve Banks
The 2007 operating budgets of the twelve Reserve Banks total $2,953.3 million.1
1. These expenses include those budgeted by Federal Reserve Information Technology (FRIT) and the Office of Employee Benefits (OEB) that are chargeable to the Reserve Banks.
The 2007 total is $153.2 million, or 5.5 percent, above estimated 2006 expenses. This increase is largely the result of increases in the Treasury, information security, protection, and check areas. These increases are offset slightly by reductions in the cash function.
Nearly half of Reserve Bank expenses in the 2007 budget are offset by revenues from priced services (33 percent) and reimbursable claims for services provided to the Treasury and other agencies (16 percent).2
2. Reimbursable claims include costs of fiscal agency and depository services provided to the U.S. Treasury, other government agencies, and other fiscal principals that are billed to these agencies.
Budgeted 2007 revenue is
lower than the 2006 estimated level, primarily as a result of declining check volume. Reimbursable claims will increase 8.6 percent in 2007, refl ecting additional efforts by the Reserve Banks on behalf of the Treasury. (See table 3.1.)
Table 3.1
Expenses of the Federal Reserve Banks, Net of Receipts and Claims for Reimbursement, 2006 and 2007 Millions of dollars except as noted
Item 2006 (estimated)
2007 (budgeted)
Change
Amount Percent
Operations .............................................................................
Less Revenue from priced services ...........................................
Other income. .................................................................... Claims for reimbursement1 ...............................................
Equals Net expenses . ...................................................................
2,800.1
1,027.7 1.2
430.1
1,341.1
2,953.3
981.3 1.5
466.7
1,503.8
153.2 5.5
–46.4 –4.50.3 28.3
36.6 8.6
162.6 12.1
Note: Excludes capital outlays. Includes expensesbudgeted by FRIT and OEB. Expenses from these entities have been charged to the Reserve Banks, as appropriate, and included in their budgets. Components may not sum to totals and may not yield percentages shown because of rounding.
Operating expenses reflect all redistributions for support and allocations for overhead.
1. Costs of fiscal agency and depository services provided to the U.S. Treasury, other government agencies, and other fiscal principals that are billed to these agencies.
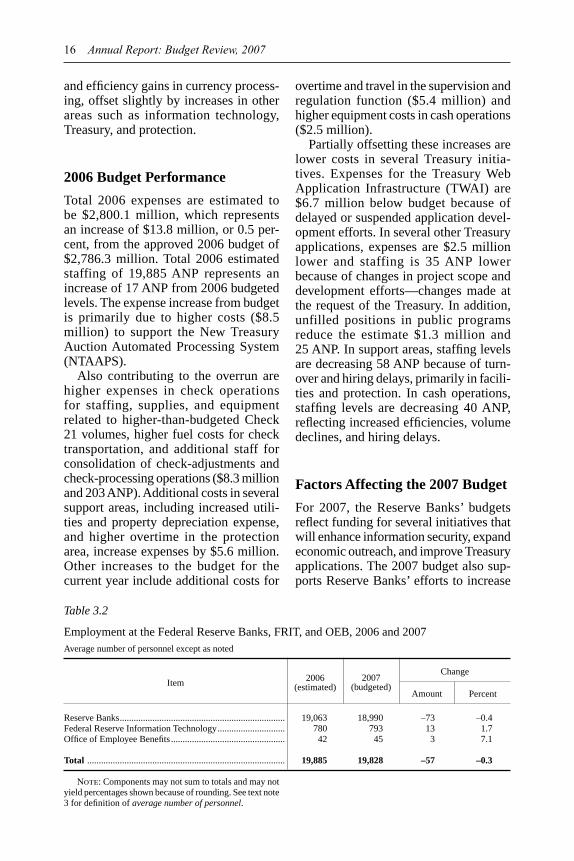
Total 2007 projected average number of personnel (ANP) for the Reserve Banks, FRIT, and OEB is 19,828, a decrease of 57 ANP, or 0.3 percent, from 2006 estimated staff levels (table 3.2).3
3. ANP is the average number of employees in terms of full-time positions for the period. For instance, a full-time employee who works one-half of the year counts as 0.5 ANP for that calendar year; two half-time employees who work the full year count as 1 ANP.
The 2007 staffing decrease continues the trend of workforce reductions that began in the late 1990s. The 2007 budgeted staff reduction reflects the effect of infrastructure changes and volume declines in check operations
16 Annual Report: Budget Review, 2007
and efficiency gains in currency processing, offset slightly by increases in other areas such as information technology, Treasury, and protection.
Table 3.2
Employment at the Federal Reserve Banks, FRIT, and OEB, 2006 and 2007 Average number of personnel except as noted
Item 2006 (estimated)
2007 (budgeted)
Change
Amount Percent
Reserve Banks ....................................................................... Federal Reserve Information Technology ............................. Office of Employee Benefi ts .................................................
Total .....................................................................................
19,063 18,990 –73 –0.4 780 793 13 1.7 42 45 3 7.1
19,885 19,828 –57 –0.3
Note: Components may not sum to totals and may not yield percentages shown because of rounding. See text note 3 for defi nition of average number of personnel.
2006 Budget Performance
Total 2006 expenses are estimated to be $2,800.1 million, which represents an increase of $13.8 million, or 0.5 percent, from the approved 2006 budget of $2,786.3 million. Total 2006 estimated staffing of 19,885 ANP represents an increase of 17 ANP from 2006 budgeted levels. The expense increase from budget is primarily due to higher costs ($8.5 million) to support the New Treasury Auction Automated Processing System (NTAAPS).
Also contributing to the overrun are higher expenses in check operations for staffing, supplies, and equipment related to higher-than-budgeted Check 21 volumes, higher fuel costs for check transportation, and additional staff for consolidation of check-adjustments and check-processing operations ($8.3 million and 203 ANP). Additional costs in several support areas, including increased utilities and property depreciation expense, and higher overtime in the protection area, increase expenses by $5.6 million. Other increases to the budget for the current year include additional costs for
overtime and travel in the supervision and regulation function ($5.4 million) and higher equipment costs in cash operations ($2.5 million).
Partially offsetting these increases are lower costs in several Treasury initiatives. Expenses for the Treasury Web Application Infrastructure (TWAI) are $6.7 million below budget because of delayed or suspended application development efforts. In several other Treasury applications, expenses are $2.5 million lower and staffing is 35 ANP lower because of changes in project scope and development efforts—changes made at the request of the Treasury. In addition, unfilled positions in public programs reduce the estimate $1.3 million and 25 ANP. In support areas, staffing levels are decreasing 58 ANP because of turnover and hiring delays, primarily in facilities and protection. In cash operations, staffing levels are decreasing 40 ANP, reflecting increased efficiencies, volume declines, and hiring delays.
Factors Affecting the 2007 Budget
For 2007, the Reserve Banks’ budgets reflect funding for several initiatives that will enhance information security, expand economic outreach, and improve Treasury applications. The 2007 budget also supports Reserve Banks’ efforts to increase
Federal Reserve Banks 17
efficiency and reduce costs and includes funding of several initiatives to improve long-term operational efficiencies in both cash and check operations.
Central Bank Services
In the central bank area—which includes monetary policy, public programs, supervision and regulation, and cash operations—expenses are increasing $94.1 million, or 5.9 percent, in 2007. Total costs for monetary policy and economic research are increasing $21.0 million, or 6.5 percent. Staffing levels are increasing 10 ANP, in part because of the full-year effect of several Banks’ efforts initiated in 2006. Expenses in public programs are increasing $15.8 million, or 10.7 percent, and staffing levels are increasing 32 ANP. During 2007, Reserve Banks will focus resources on regional outreach expansion, economic education, and financial literacy efforts. In recent years, Reserve Banks have devoted more resources to these efforts, particularly in regions where there is a limited Reserve Bank presence.
Expenses in the supervision and regulation area are increasing $45.4 million, or 8.2 percent, in the 2007 budget as a result of the full-year effect of 2006 hires and higher compensation for current staff. Staffing levels are increasing 18 ANP.
Expenses in cash operations are increasing $0.9 million, or 0.2 percent. The relatively flat cost in this area reflects several factors—including lower costs for cash-processing equipment maintenance, projected recoveries from the recirculation policy, and productivity improvements—that together account for $5.0 million.4
4. Under the new recirculation policy, the Reserve Banks will charge depository institutions a fee to deposit large amounts of fit $10 and $20 notes and order the same denomination within the same week.
The recognition in 2006 of $2.2 million in one-time costs to
restructure currency operations across Reserve Banks also reduces the 2007 budget. These reductions to the cash budget largely offset the area’s compensation program ($7.7 million) and other initiatives, including expenses and staff to prepare for a new cash automation platform ($1.0 million and 8 ANP) and several long-term initiatives under way in the cash area ($1.2 million and 5 ANP).
Treasury-Related Functions
Total costs to provide services to the Treasury are increasing $33.7 million, or 8.2 percent. Staffing levels are increasing 19 ANP. The increase is driven by growth in two software applications maintained for the Treasury. Costs for developing and implementing NTAAPS are increasing $10.1 million and 4 ANP. The TWAI project, which provides a dedicated web environment that supports several Treasury applications and millions of registered users, continues to grow as new applications are added. The 2007 budget includes an increase of $10.1 million for additional applications to be added to the TWAI environment.
Growth in other Treasury applications accounts for increases of $3.0 million and 14 ANP. These applications include the Government-wide Accounting (GWA) program and International Treasury Services (ITS), ongoing development of the Treasury’s General Account Deposit Reporting Network (TGANet) application, and software to process government electronic payments (eGovernment). These increases are partially offset by the transfer of the Transaction Reporting System to a private company ($4.9 million).
Check Services
Total expenses for check services are increasing $11.0 million, or 1.7 percent,
18 Annual Report: Budget Review, 2007
reflecting higher costs for Check 21– related supplies and equipment, as well as additional resources necessary to facilitate further consolidation into five regional check-adjustments sites. The 2007 budget also includes additional funding for several check initiatives, including further restructuring of check operations.
These reductions are offset slightly by the full-year effect of check-process-ing infrastructure changes in 2006 and additional changes planned for 2007, declining paper-check volume, and fewer check-adjustments staff in nonregional sites. These reductions result in a decrease of 347 ANP.
Support Services
Support costs are increasing $46.7 million, or 5.8 percent. The increase is primarily due to additional costs for information security and protection. Expenses for information technology are increasing $15.8 million, primarily for security and infrastructure-related initiatives to upgrade and enhance secuity throughout the System. Protection costs are increasing $8.7 million and 18 ANP, reflecting personnel costs related to filling open positions and higher depre-iation expense for physical security projects.
-
2007 Personnel Expenses
Budgeted officer and employee salaries and other personnel expenses total $1.5 billion, which is 4.7 percent higher than the 2006 estimate. This includes an increase of $78.3 million, or 5.3 percent,
to fund salary administration programs for officers and employees.
-
5
5. Salary administration represents the budgeted funds that are available to increase compensation to officers and employees in the upcoming year. It does not include adjustments for changes in staffing levels and composition, turnover and lag in hiring, overtime, severance, and outside agency expense.
These expenses are offset primarily by reductions of $17.5 million in severance payments and outside agency expenses. Reserve Bank average merit pools are budgeted at 4.0 percent for officers and employees, slightly higher than in 2006.
Variable pay programs are increasing $10.0 million in 2007. In total, incentive payments make up slightly more than 60 percent of the total variable pay program. Banks plan to use these additional funds to address market pressures and retain highly skilled staff in specific areas of the Bank.
Of the projected 2,165 ANP leaving the Reserve Banks, FRIT, and OEB in 2007, an estimated 17 percent will not be replaced, primarily because of planned staff reductions associated with check infrastructure changes and anticipated lower check volumes. Turnover in 2007 is expected to be lower than the turnover of 2,356 ANP in 2006, in large part because of efforts to retain staff in critical areas and lower staffing reductions associated with reengineering efforts.
Retirement and other benefit expenses are anticipated to increase by approximately $61.8 million, or 14.7 percent,in 2007. This increase is primarily attributable to a $40.3 million one-time adjustment in post-retirement medical benefits.
-
Risks in the 2007 Budget
The projected declines in paper-check items processed, the rapid increase inCheck 21 volumes, changes in the planned restructuring of check operations, and variances in assumptions concerning check transportation pose risks to the budget in 2007. In addition, several Banks cited the implementation of the cash recirculation policy, and its effects on volumes and recoveries, as a budget risk.
Federal Reserve Banks 19
Changes in the scope or direction of the various Treasury projects and continued unbudgeted Treasury requests also pose a risk for the Banks in 2007. Finally, Banks cite possible shortfalls in the budgeted recoveries associated with tenant rental income as a risk.
The check service continues to be an area where Banks have identified a considerable amount of risk. Volumes are projected to decline 9.6 percent in 2007, reflecting the continued decline of legacy paper items and the rapid growth of Check 21 items. If the budgeted decrease in legacy paper volumes fails to materialize, the Banks would incur costs for higher-than-planned staffing levels. The continued rapid growth of Check 21 items could present operational challenges and, if the adoption of Fed Receipt—a service in which the paying bank agrees to the electronic receipt of Check 21 items—is slower than anticipated, the Banks would require additional staffing, equipment, and supplies beyond those budgeted.
Phase IV of the check consolidations has been announced, but final dates for the four consolidations have not yet been finalized. Although the Retail Payments Office budgeted for restructuring and other check initiatives in the 2007 budget, additional funding may be required if consolidation and transportation assumptions vary significantly from plan.
The implementation of the new currency recirculation policy and the Future Cash Automation software development effort pose significant risks for the 2007 budget. The fee component of the new currency recirculation policy is scheduled for implementation in mid-2007. Budgeted assumptions may vary depending on how aggressively cash customers adjust their currency usage and practices to avoid these fees. Costs associated with implementation of the Presidential Dollar Coin Act have also been identified as a risk.
As in the past, unforeseen requests from the Treasury or changes in scope and direction would add costs and could
require additional resources in 2007. In addition, the Treasury’s plans for reengineering its collection and cash management processes and systems are not yet fully defined. The effect of this initiative has not been factored into Bank budgets.
In addition, many Banks are facing the retirement of a significant number of officers within the next several years. Several Banks have identified succession planning and retention as a high-priority objective and have programs under way to address this issue.
2007 Capital Plan
The 2007 capital budget submitted by the Reserve Banks, FRIT, and OEB totals $591.6 million—a $139.9 million, or 31 percent, increase from the 2006 estimated levels. The increase from the 2006 estimate is primarily from projected outlays in 2007 for Kansas City’s new headquarters building.
As in previous years, the 2007 capital budget includes funding for projects that support the strategic direction outlined in the individual Reserve Bank and System plans. These strategies focus on investing to improve operational efficiencies and services to Bank customers and providing a safe and quality work environment. In support of these strategies, the 2007 budget identifies six major categories of capital outlays: building projects and facility improvements, security enhancements, automation and communication initiatives, payment system improvements, cash services initiatives, and Treasury initiatives.
The proposed capital budget includes $314.5 million for building-related projects and facility improvements. The total includes $140.3 million in outlays for the Kansas City new-building project and $23.1 million for the Seattle new-building project. In addition, the St. Louis capital budget includes $38.8 million for
expansion and enhancement of its head office, and New York’s budget includes $35.3 million for projects in the Bank’s main building and at the East Rutherford Operations Center.
Another $126.4 million is included for initiatives related to payment systems, cash, and Treasury initiatives. Payment system initiatives account for $61.6 million and consist mainly of capital needed to support the rapid growth in Check 21 volume. The budget includes $39.7 million for Treasury initiatives—primarily TWAI, NTAAPS, and e-Government initiatives. In addition, the budget includes outlays of $25.2 million for various cash initiatives.
20 Annual Report: Budget Review, 2007
The Reserve Banks, FRIT, and OEB included $76.1 million in funding for major automation and communication initiatives. These initiatives do not include the automation components of building or payment systems initiatives discussed previously. Of the total automation-related outlays, FRIT projects and acquisitions account for $28.2 million. The New York budget includes $18.9 million for routine replacement of server equipment, PBX telephone equipment, and other network equipment. The budget also includes $69.4 million for security enhancements in support of Reserve Banks’objectives to comply with System security standards.

Appendixes
Federal Reserve Budget Process 23
Appendix A
Federal Reserve Budget Processes
This appendix is an overview of the separate budgets and budgeting processes followed by the Board of Governors and the Reserve Banks.
Board of Governors
The Board’s budget covers a two-year period. Following is a summary of the budget process:
• The Board’s divisions examine their operating environments and consider whether any adjustments to their mission, priorities, activities, and associated resources might improve the efficiency and effectiveness of the Board’s operations. Individual division budget objectives are prepared on the basis of Boardwide priorities and planning assumptions.
• The divisions give the results to the Staff Planning Group (SPG), a group composed of senior-level officers, which develops a preliminary budget objective. The Board’s Committee on Board Affairs (CBA) reviews the preliminary budget objective, clarifies outstanding planning issues with senior officials, and submits the budget objective to the Board for its consideration.
• Once approved, the divisions use the budget objective to prepare their budgets, which are combined to form a budget for the entire Board. The CBA, under authority delegated by the Chairman, oversees this process.
• The CBA presents the budget to the Board for approval.
The Board’s Office of Inspector General (OIG), in keeping with its statutory independence, prepares its proposed bud
get apart from the Board’s budget. The OIG presents its two-year budget directly to the Chairman for action by the Board.
Reserve Banks
Each year, the Federal Reserve Banks establish major operating goals for the coming year, devise strategies to attain those goals, estimate required resources, and monitor results. The Banks’ budgets are structured by operational area, with support and overhead attributable to each area charged to that area.
The operations and financial performance of the Reserve Banks are monitored throughout the year through a cost-accounting system, the Planning and Control System (PACS). Under PACS, the costs of all Reserve Bank services, both priced and nonpriced, are grouped by operational area, and the associated costs of support and overhead are charged to these areas accordingly. PACS makes it possible to compare budgets with actual expenses and facilitates comparison of the financial and operating performances of the Reserve Banks. During the budget year, the Banks must submit proposals for major purchases of assets to the Board for further review and approval.
Following is a summary of the budget process:
• The business leaders in each functional area develop their budget guidance. This information is used to develop a preliminary budget projection, called the Reserve Bank budget outlook. Each Bank then develops its own budget using the business-leader guidance.
• The Committee on Federal Reserve Bank Affairs at the board then reviews

24 Annual Report: Budget Review, 2007
the budgets, both individually and in the context of Systemwide issues and the plans of the other Banks.
• The budgets are then presented to the Board of Governors for final action.
Priced Services 25
Appendix B
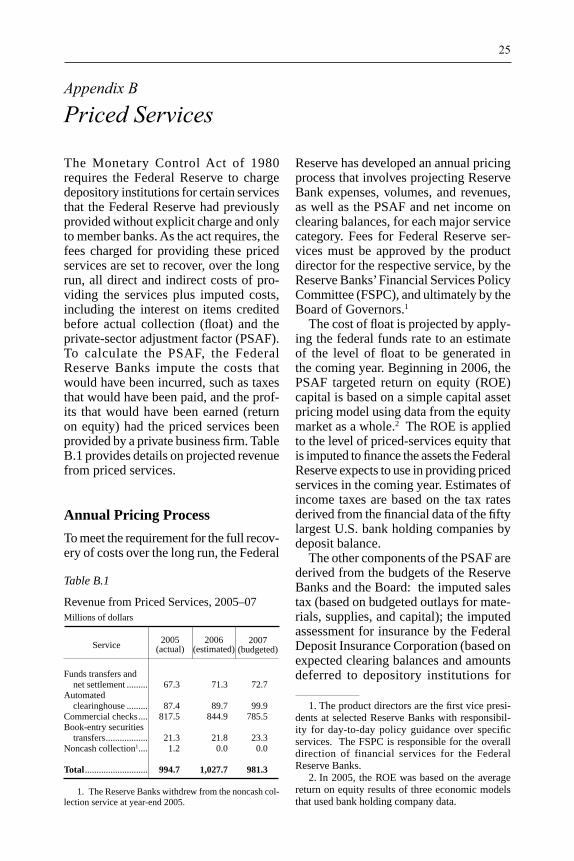
Priced Services
The Monetary Control Act of 1980 requires the Federal Reserve to charge depository institutions for certain services that the Federal Reserve had previously provided without explicit charge and only to member banks. As the act requires, the fees charged for providing these priced services are set to recover, over the long run, all direct and indirect costs of providing the services plus imputed costs, including the interest on items credited before actual collection (float) and the private-sector adjustment factor (PSAF). To calculate the PSAF, the Federal Reserve Banks impute the costs that would have been incurred, such as taxes that would have been paid, and the profits that would have been earned (return on equity) had the priced services been provided by a private business firm. Table B.1 provides details on projected revenue from priced services.
Table B.1
Revenue from Priced Services, 2005–07 Millions of dollars
Service 2005 (actual)
2006 (estimated)
2007 (budgeted)
Funds transfers and net settlement ......... 67.3 71.3 72.7 Automated clearinghouse ......... 87.4 89.7 99.9 Commercial checks .... 817.5 844.9 785.5 Book-entry securities transfers .................. 21.3 21.8 23.3 Noncash collection1 .... 1.2 0.0 0.0
Total........................... 994.7 1,027.7 981.3
1. The Reserve Banks withdrew from the noncash collection service at year-end 2005.
Annual Pricing Process
To meet the requirement for the full recovery of costs over the long run, the Federal
Reserve has developed an annual pricing process that involves projecting Reserve Bank expenses, volumes, and revenues, as well as the PSAF and net income on clearing balances, for each major service category. Fees for Federal Reserve services must be approved by the product director for the respective service, by the Reserve Banks’ Financial Services Policy Committee (FSPC), and ultimately by the Board of Governors.
1
1. The product directors are the first vice presidents at selected Reserve Banks with responsibility for day-to-day policy guidance over specific services. The FSPC is responsible for the overall direction of financial services for the Federal Reserve Banks.
The cost of float is projected by applying the federal funds rate to an estimate of the level of float to be generated in the coming year. Beginning in 2006, the PSAF targeted return on equity (ROE) capital is based on a simple capital asset pricing model using data from the equity market as a whole.2
2. In 2005, the ROE was based on the average return on equity results of three economic models that used bank holding company data.
The ROE is applied to the level of priced-services equity that is imputed to finance the assets the Federal Reserve expects to use in providing priced services in the coming year. Estimates of income taxes are based on the tax rates derived from the financial data of the fifty largest U.S. bank holding companies by deposit balance.
The other components of the PSAF are derived from the budgets of the Reserve Banks and the Board: the imputed sales tax (based on budgeted outlays for materials, supplies, and capital); the imputed assessment for insurance by the Federal Deposit Insurance Corporation (based on expected clearing balances and amounts deferred to depository institutions for

26 Annual Report: Budget Review, 2007
items deposited for collection with the Reserve Banks); and the portion of the expenses of the Board of Governors directly related to providing priced services.
Investment income is imputed and netted with related direct costs associated with clearing balances to estimate net income on clearing balances.
Currency Budget 27
Appendix C
Currency Budget
Federal Reserve Banks issue new and fit currency to the public through depository institutions and destroy currency already in circulation as it becomes unfit or when a new design is issued. Each year, under authority delegated by the Board, the director of the Division of Reserve Bank Operations and Payment Systems orders new currency from the U.S. Department of Treasury’s Bureau of Engraving and Printing (BEP). Upon reviewing the order, the BEP establishes billing rates for new currency, which the Board staff uses to prepare the annual budget for new currency. Once the Board approves the new currency budget, it assesses each Federal Reserve Bank through an accounting procedure similar to that used in assessing the Banks for the Board’s operating expenses.
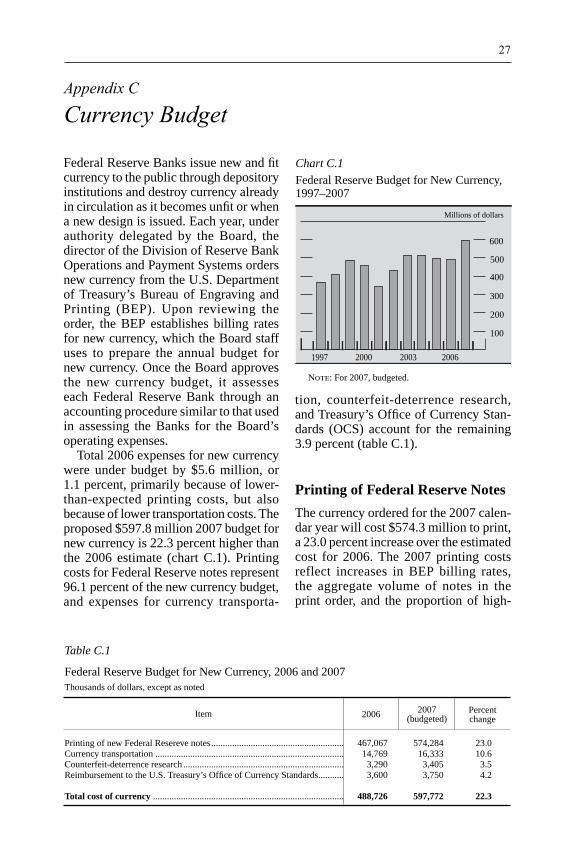
Total 2006 expenses for new currency were under budget by $5.6 million, or 1.1 percent, primarily because of lower-than-expected printing costs, but also because of lower transportation costs. The proposed $597.8 million 2007 budget for new currency is 22.3 percent higher than the 2006 estimate (chart C.1). Printing costs for Federal Reserve notes represent 96.1 percent of the new currency budget, and expenses for currency transporta
tion, counterfeit-deterrence research, and Treasury’s Office of Currency Standards (OCS) account for the remaining 3.9 percent (table C.1).
-
Chart C.1
Federal Reserve Budget for New Currency, 1997–2007
1997 2000 2003 2006
400
300
200
100
Millions of dollars
500
600
Note: For 2007, budgeted.
Table C.1
Federal Reserve Budget for New Currency, 2006 and 2007 Thousands of dollars, except as noted
Item 2006 2007 (budgeted)
Percent change
Printing of new Federal Resereve notes .........................................................Currency transportation ................................................................................. Counterfeit-deterrence research ..................................................................... Reimbursement to the U.S. Treasury’s Office of Currency Standards ...........
Total cost of currency ...............
467,067 14,769 3,290 3,600
488,726
574,284 16,333 3,4053,750
597,772
23.0 10.6 3.5 4.2
22.3
...................................................................
Printing of Federal Reserve Notes
The currency ordered for the 2007 calendar year will cost $574.3 million to print, a 23.0 percent increase over the estimated cost for 2006. The 2007 printing costs reflect increases in BEP billing rates, the aggregate volume of notes in the print order, and the proportion of high-
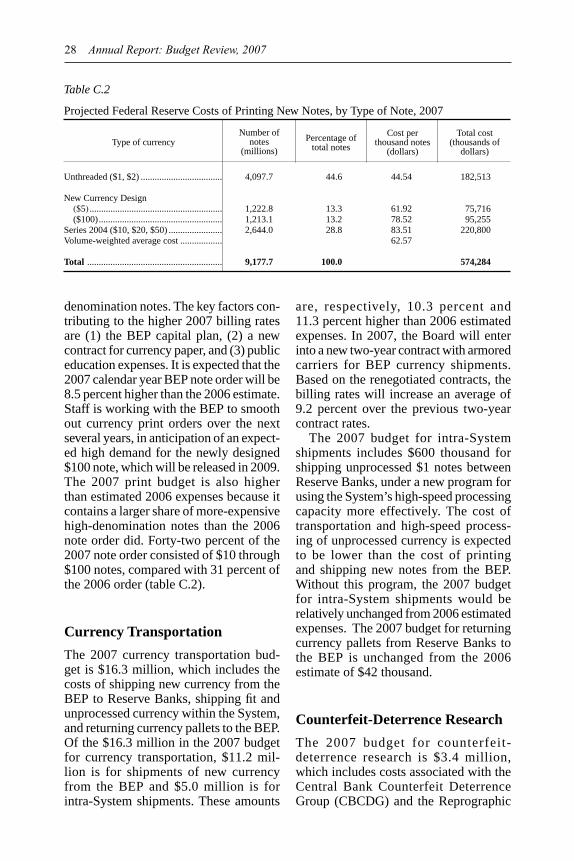
denomination notes. The key factors contributing to the higher 2007 billing rates are (1) the BEP capital plan, (2) a new contract for currency paper, and (3) public education expenses. It is expected that the 2007 calendar year BEP note order will be 8.5 percent higher than the 2006 estimate. Staff is working with the BEP to smooth out currency print orders over the next several years, in anticipation of an expected high demand for the newly designed $100 note, which will be released in 2009. The 2007 print budget is also higher than estimated 2006 expenses because it contains a larger share of more-expensive high-denomination notes than the 2006 note order did. Forty-two percent of the 2007 note order consisted of $10 through $100 notes, compared with 31 percent of the 2006 order (table C.2).
Table C.2
Projected Federal Reserve Costs of Printing New Notes, by Type of Note, 2007
28 Annual Report: Budget Review, 2007
Type of currency Number of
notes (millions)
Percentage of total notes
Cost per thousand notes
(dollars)
Total cost (thousands of
dollars)
Unthreaded ($1, $2) ................................... 4,097.7 44.6 44.54 182,513
New Currency Design ($5) ......................................................... 1,222.8 13.3 61.92 75,716 ($100) ..................................................... 1,213.1 13.2 78.52 95,255 Series 2004 ($10, $20, $50) ....................... 2,644.0 28.8 83.51 220,800 Volume-weighted average cost .................. 62.57
Total .......................................................... 9,177.7 100.0 574,284
Currency Transportation
The 2007 currency transportation budget is $16.3 million, which includes the costs of shipping new currency from the BEP to Reserve Banks, shipping fit and unprocessed currency within the System, and returning currency pallets to the BEP. Of the $16.3 million in the 2007 budget for currency transportation, $11.2 million is for shipments of new currency from the BEP and $5.0 million is for intra-System shipments. These amounts
are, respectively, 10.3 percent and 11.3 percent higher than 2006 estimated expenses. In 2007, the Board will enter into a new two-year contract with armored carriers for BEP currency shipments. Based on the renegotiated contracts, the billing rates will increase an average of 9.2 percent over the previous two-year contract rates.
The 2007 budget for intra-System shipments includes $600 thousand for shipping unprocessed $1 notes between Reserve Banks, under a new program for using the System’s high-speed processing capacity more effectively. The cost of transportation and high-speed processing of unprocessed currency is expected to be lower than the cost of printing and shipping new notes from the BEP. Without this program, the 2007 budget for intra-System shipments would be relatively unchanged from 2006 estimated expenses. The 2007 budget for returning currency pallets from Reserve Banks to the BEP is unchanged from the 2006 estimate of $42 thousand.
Counterfeit-Deterrence Research
The 2007 budget for counterfeit-deterrence research is $3.4 million, which includes costs associated with the Central Bank Counterfeit Deterrence Group (CBCDG) and the Reprographic
Currency Budget 29
Research Center (RRC). The CBCDG operates under the auspices of the G-10 central bank governors to combat digital counterfeiting and includes 27 central banks. The Board’s $3.4 million share of the 2007 CBCDG budget constitutes 99 percent of the Federal Reserve’s counterfeit-deterrence budget and is 2.9 percent higher than the 2006 estimate. The RRC payment of $35 thousand represents the remaining 1 percent of the counterfeit-deterrence research budget. The RRC is a state-of-the-art facility hosted by the National Bank of Denmark that 12 member central banks use for adversarial testing of banknote designs and counterfeit-deterrence features.
Treasury’s Office of Currency Standards
The 2007 budget to reimburse the U.S. Department of the Treasury for OCS expenses is $3.8 million. The OCS develops Reserve Bank standards for cancellation and destruction of unfit currency and for note accountability, and it reviews Reserve Bank cash operations for compliance with its standards. As a public service, the OCS also processes claims for the redemption of damaged or mutilated currency.
Board Expenses and Employment 31
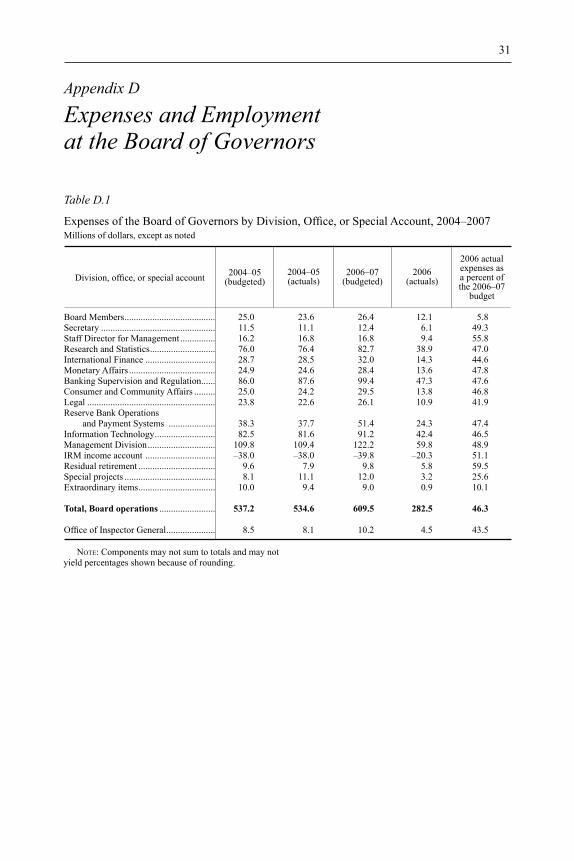
Appendix D
Expenses and Employment at the Board of Governors
Table D.1
Expenses of the Board of Governors by Division, Office, or Special Account, 2004–2007 Millions of dollars, except as noted
Division, office, or special account 2004–05 (budgeted)
2004–05 (actuals)
2006–07 (budgeted)
2006 (actuals)
2006 actual expenses asa percent ofthe 2006–07
budget
Board Members .......................................Secretary .................................................Staff Director for Management ............... Research and Statistics ............................International Finance ..............................Monetary Affairs .....................................Banking Supervision and Regulation ......Consumer and Community Affairs .........Legal .......................................................Reserve Bank Operations
and Payment Systems ....................Information Technology .......................... Management Division .............................IRM income account .............................. Residual retirement ................................. Special projects .......................................Extraordinary items .................................
Total, Board operations ........................
Office of Inspector General .....................
25.0 23.6 11.5 11.1 16.2 16.8 76.0 76.4 28.7 28.5 24.9 24.6 86.0 87.6 25.0 24.2 23.8 22.6
38.3 37.7 82.5 81.6
109.8 109.4 –38.0 –38.0
9.6 7.9 8.1 11.1
10.0 9.4
537.2 534.6
8.5 8.1
26.4 12.1 12.4 6.1 16.8 9.4 82.7 38.9 32.0 14.3 28.4 13.6 99.4 47.3 29.5 13.8 26.1 10.9
51.4 24.3 91.2 42.4
122.2 59.8 –39.8 –20.3
9.8 5.8 12.0 3.2 9.0 0.9
609.5 282.5
10.2 4.5
5.8 49.3 55.8 47.0 44.6 47.8 47.6 46.8 41.9
47.4 46.5 48.9 51.1 59.5 25.6 10.1
46.3
43.5
NOTE: Components may not sum to totals and may not yield percentages shown because of rounding.
32 Annual Report: Budget Review, 2007
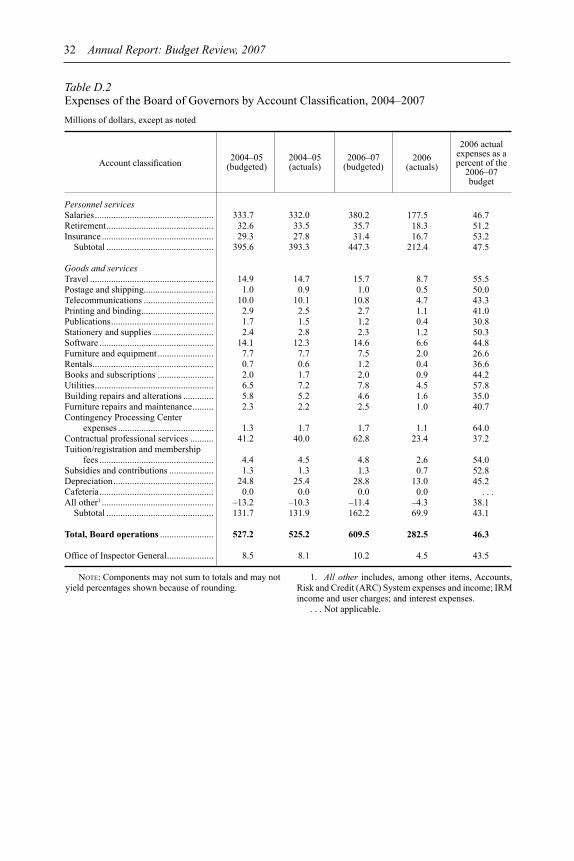
Table D.2 Expenses of the Board of Governors by Account Classification, 2004–2007 Millions of dollars, except as noted
Account classification 2004–05 (budgeted)
2004–05 (actuals)
2006–07 (budgeted)
2006 (actuals)
2006 actual expenses as apercent of the
2006–07 budget
Personnel services Salaries ...................................................Retirement ..............................................Insurance ................................................
Subtotal ..............................................
Goods and services Travel ..................................................... Postage and shipping ..............................Telecommunications ..............................Printing and binding ...............................Publications ............................................Stationery and supplies ..........................Software ................................................. Furniture and equipment ........................ Rentals .................................................... Books and subscriptions ........................Utilities ...................................................Building repairs and alterations ............. Furniture repairs and maintenance ......... Contingency Processing Center
expenses ......................................... Contractual professional services ..........Tuition/registration and membership
fees ................................................. Subsidies and contributions ...................Depreciation ...........................................Cafeteria ................................................. All other1 ................................................
Subtotal ..............................................
Total, Board operations .......................
Office of Inspector General ....................
333.7 32.6 29.3
395.6
14.9 1.0
10.0 2.9 1.7 2.4
14.1 7.7 0.7 2.0 6.5 5.8 2.3
1.3 41.2
4.4 1.3
24.8 0.0
–13.2 131.7
527.2
8.5
332.0 33.5 27.8
393.3
14.7 0.9
10.1 2.5 1.5 2.8
12.3 7.7 0.6 1.7 7.2 5.2 2.2
1.7 40.0
4.5 1.3
25.4 0.0
–10.3 131.9
525.2
8.1
380.2 35.7 31.4
447.3
15.7 1.0
10.8 2.7 1.2 2.3
14.6 7.5 1.2 2.0 7.8 4.6 2.5
1.7 62.8
4.8 1.3
28.8 0.0
–11.4 162.2
609.5
10.2
177.5 18.3 16.7
212.4
8.7 0.5 4.7 1.1 0.4 1.2 6.6 2.0 0.4 0.9 4.5 1.6 1.0
1.1 23.4
2.6 0.7
13.0 0.0
–4.3 69.9
282.5
4.5
46.7 51.2 53.2 47.5
55.5 50.0 43.3 41.0 30.8 50.3 44.8 26.6 36.6 44.2 57.8 35.0 40.7
64.0 37.2
54.0 52.8 45.2
. . . 38.1 43.1
46.3
43.5
NOTE: Components may not sum to totals and may not yield percentages shown because of rounding.
1. All other includes, among other items, Accounts, isk and Credit (ARC) System expenses and income; IRM
ncome and user charges; and interest expenses. Ri
. . . Not applicable.
Board Expenses and Employment 33
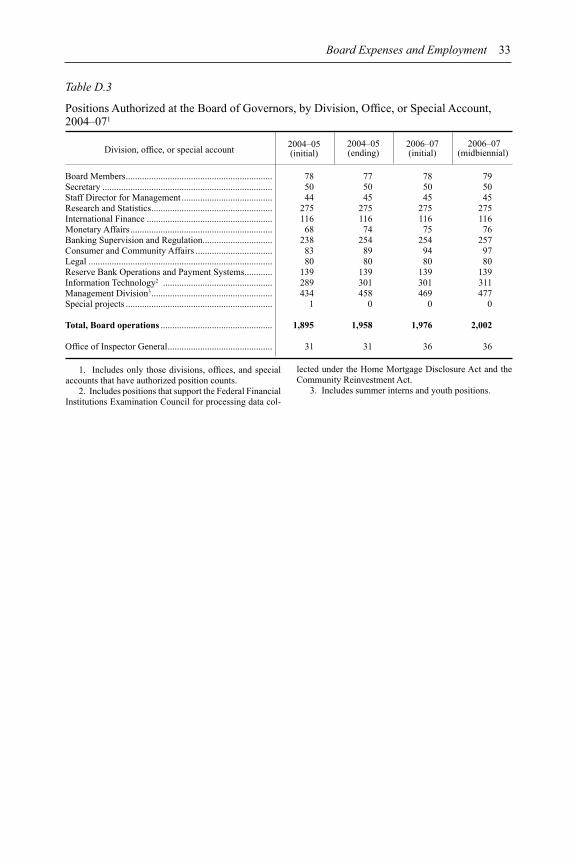
Table D.3
Positions Authorized at the Board of Governors, by Division, Office, or Special Account, 2004–071
Division, office, or special account 2004–05 (initial)
2004–05 (ending)
2006–07 (initial)
2006–07 (midbiennial)
Board Members ............................................................... Secretary ......................................................................... Staff Director for Management ....................................... Research and Statistics ....................................................International Finance ...................................................... Monetary Affairs .............................................................Banking Supervision and Regulation ..............................Consumer and Community Affairs ................................. Legal ...............................................................................Reserve Bank Operations and Payment Systems ............ Information Technology2 ...............................................Management Division3.................................................... Special projects ...............................................................
Total, Board operations ................................................
Office of Inspector General .............................................
78 50 44
275 116 68
238 83 80
139 289 434
1
1,895
31
77 78 50 50 45 45
275 275 116 116
74 75 254 254 89 94 80 80
139 139 301 301 458 469
0 0
1,958 1,976
31 36
79 50 45
275 116 76
257 97 80
139 311 477
0
2,002
36
lected under the Home Mortgage Disclosure Act and the Community Reinvestment Act.
2. Includes positions that support the Federal Financial Institutions Examination Council for processing data col-
3. Includes summer interns and youth positions.
1. Includes only those divisions, offices, and special accounts that have authorized position counts.
Bank Expenses and Employment 35
Appendix E
Expenses and Employment at the Federal Reserve Banks
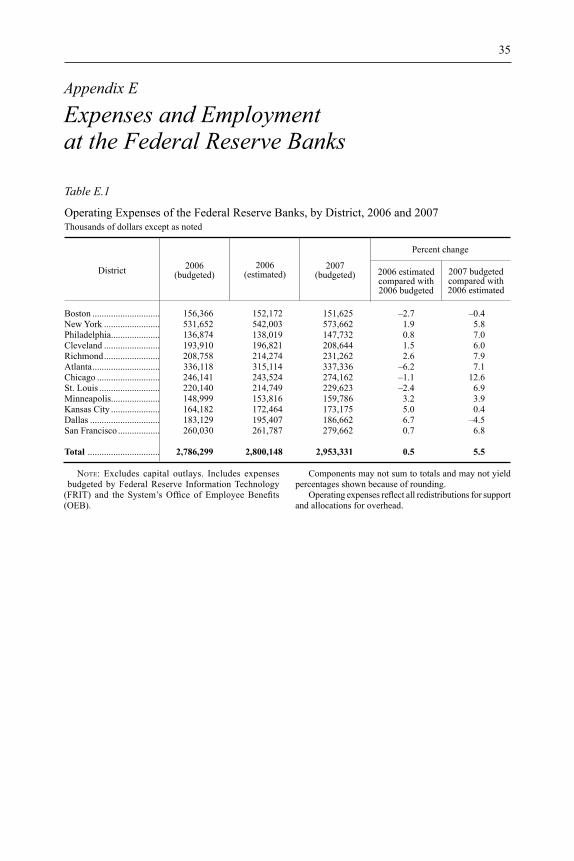
Table E.1
Operating Expenses of the Federal Reserve Banks, by District, 2006 and 2007 Thousands of dollars except as noted
District 2006 (budgeted)
2006 (estimated)
2007 (budgeted)
Percent change
2006 estimated compared with2006 budgeted
2007 budgetedcompared with2006 estimated
Boston ............................. New York ........................ Philadelphia ..................... Cleveland ........................ Richmond ........................ Atlanta .............................Chicago ........................... St. Louis .......................... Minneapolis ..................... Kansas City ..................... Dallas ..............................San Francisco ..................
Total ...............................
156,366 531,652 136,874 193,910 208,758
336,118 246,141 220,140 148,999 164,182 183,129 260,030
2,786,299
152,172 542,003 138,019 196,821 214,274
315,114 243,524 214,749 153,816 172,464 195,407 261,787
2,800,148
151,625 573,662 147,732 208,644 231,262 337,336 274,162 229,623 159,786 173,175 186,662 279,662
2,953,331
–2.7 –0.4 1.9 5.8 0.8 7.0 1.5 6.0 2.6 7.9
–6.2 7.1 –1.1 12.6 –2.4 6.9 3.2 3.9 5.0 0.4 6.7 –4.5 0.7 6.8
0.5 5.5
NOTE: Excludes capital outlays. Includes expenses budgeted by Federal Reserve Information Technology (FRIT) and the System’s Office of Employee Benefits (OEB).
Components may not sum to totals and may not yield percentages shown because of rounding.
Operating expenses reflect all redistributions for support and allocations for overhead.
36 Annual Report: Budget Review, 2007
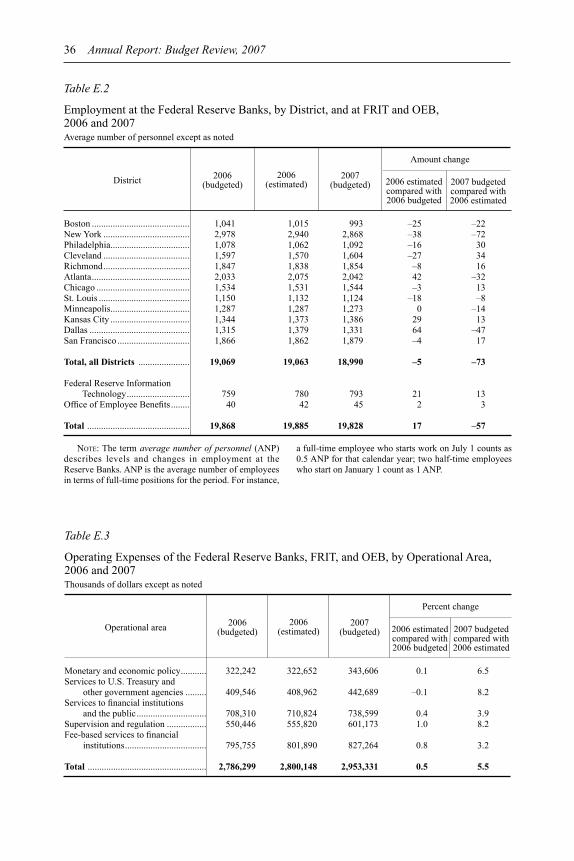
Table E.2
Employment at the Federal Reserve Banks, by District, and at FRIT and OEB, 2006 and 2007 Average number of personnel except as noted
District 2006 (budgeted)
2006 (estimated)
2007 (budgeted)
Amount change
2006 estimated compared with 2006 budgeted
2007 budgeted compared with 2006 estimated
Boston .......................................... New York ..................................... Philadelphia .................................. Cleveland ..................................... Richmond ..................................... Atlanta ..........................................Chicago ........................................St. Louis ....................................... Minneapolis ..................................Kansas City .................................. Dallas ...........................................San Francisco ...............................
Total, all Districts ......................
Federal Reserve Information Technology ...........................
Office of Employee Benefits ........
Total ............................................
1,041 2,978 1,078 1,597 1,847 2,033 1,534 1,150 1,287 1,344 1,315 1,866
19,069
759 40
19,868
1,015 2,940 1,062 1,570 1,838 2,075 1,531 1,132 1,287 1,373 1,379 1,862
19,063
780 42
19,885
993 2,868 1,092 1,604 1,854 2,042 1,544 1,124 1,273 1,386 1,331 1,879
18,990
793 45
19,828
–25 –22 –38 –72 –16 30 –27 34 –8 16 42 –32 –3 13
–18 –8 0 –14
29 13 64 –47 –4 17
–5 –73
21 13 2 3
17 –57
NOTE: The term average number of personnel (ANP) a full-time employee who starts work on July 1 counts as describes levels and changes in employment at the 0.5 ANP for that calendar year; two half-time employees Reserve Banks. ANP is the average number of employees who start on January 1 count as 1 ANP. in terms of full-time positions for the period. For instance,
Table E.3
Operating Expenses of the Federal Reserve Banks, FRIT, and OEB, by Operational Area, 2006 and 2007 Thousands of dollars except as noted
Operational area 2006 (budgeted)
2006 (estimated)
2007 (budgeted)
Percent change
2006 estimated compared with2006 budgeted
2007 budgetedcompared with2006 estimated
Monetary and economic policy ...........Services to U.S. Treasury and
other government agencies ......... Services to fi nancial institutions
and the public .............................. Supervision and regulation ................. Fee-based services to financial
institutions ...................................
Total ...................................................
322,242
409,546
708,310 550,446
795,755
2,786,299
322,652
408,962
710,824 555,820
801,890
2,800,148
343,606
442,689
738,599 601,173
827,264
2,953,331
0.1 6.5
–0.1 8.2
0.4 3.9 1.0 8.2
0.8 3.2
0.5 5.5
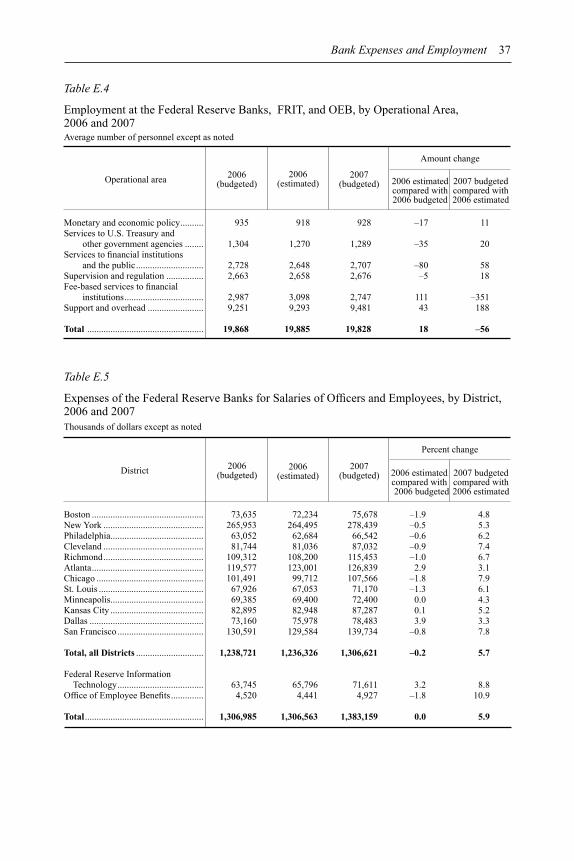
Table E.4
Employment at the Federal Reserve Banks, FRIT, and OEB, by Operational Area, 2006 and 2007
Bank Expenses and Employment 37
Average number of personnel except as noted
Operational area 2006 (budgeted)
2006 (estimated)
2007 (budgeted)
Amount change
2006 estimated compared with 2006 budgeted
2007 budgeted compared with 2006 estimated
Monetary and economic policy ..........Services to U.S. Treasury and
other government agencies ........ Services to fi nancial institutions
and the public .............................Supervision and regulation ................ Fee-based services to financial
institutions ..................................Support and overhead ........................
Total ..................................................
935
1,304
2,728 2,663
2,987 9,251
19,868
918
1,270
2,648 2,658
3,098 9,293
19,885
928
1,289
2,707 2,676
2,747 9,481
19,828
–17 11
–35 20
–80 58 –5 18
111 –351 43 188
18 –56
Table E.5
Expenses of the Federal Reserve Banks for Salaries of Officers and Employees, by District, 2006 and 2007 Thousands of dollars except as noted
District 2006 (budgeted)
2006 (estimated)
2007 (budgeted)
Percent change
2006 estimated compared with 2006 budgeted
2007 budgetedcompared with
2006 estimated
Boston ................................................ New York ........................................... Philadelphia ........................................ Cleveland ........................................... Richmond ........................................... Atlanta ................................................ Chicago .............................................. St. Louis ............................................. Minneapolis ........................................ Kansas City ........................................ Dallas ................................................. San Francisco .....................................
Total, all Districts .............................
Federal Reserve Information Technology ..................................... Office of Employee Benefi ts ..............
Total...................................................
73,635 265,953
63,052 81,744
109,312 119,577 101,491 67,926 69,385 82,895 73,160
130,591
1,238,721
63,745 4,520
1,306,985
72,234 264,495
62,684 81,036
108,200 123,001 99,712 67,053 69,400 82,948 75,978
129,584
1,236,326
65,796 4,441
1,306,563
75,678 278,439
66,542 87,032
115,453 126,839 107,566 71,170 72,400 87,287 78,483
139,734
1,306,621
71,611 4,927
1,383,159
–1.9 4.8 –0.5 5.3 –0.6 6.2 –0.9 7.4 –1.0 6.7 2.9 3.1
–1.8 7.9 –1.3 6.1 0.0 4.3 0.1 5.2 3.9 3.3
–0.8 7.8
–0.2 5.7
3.2 8.8 –1.8 10.9
0.0 5.9
38 Annual Report: Budget Review, 2007
Table E.6
Capital Outlays of the Federal Reserve Banks, by District, and of FRIT and OEB, 2006 and 2007 Thousands of dollars except as noted
District 2006 (budgeted)
2006 (estimated)
2007 (budgeted)
Percent change
2006 estimated compared with2006 budgeted
2007 budgetedcompared with2006 estimated
Boston ................................................. New York ............................................ Philadelphia ......................................... Cleveland ............................................ Richmond ............................................ Atlanta ................................................. Chicago ............................................... St. Louis .............................................. Minneapolis ......................................... Kansas City ......................................... Dallas .................................................. San Francisco ......................................
Total, all Districts .............................
Federal Reserve Information Technology. .................................
Office of Employee Benefits ...............
Total ...................................................
24,843 21,697 18,334 –12.7 –15.5 69,737 62,847 77,456 –9.9 23.2 20,966 16,553 23,361 –21.0 41.1 28,157 23,404 24,161 –16.9 3.2 58,623 36,005 59,717 –38.6 65.9 17,335 22,863 32,928 31.9 44.0 20,841 25,418 20,633 22.0 –18.8 42,743 29,503 43,559 –31.0 47.6 4,782 5,258 5,131 9.9 –2.4
74,738 89,726 150,440 20.1 67.7 9,874 13,052 17,318 32.2 32.7
49,753 51,731 49,669 4.0 –4.0
422,392 398,057 522,708 –5.8 31.3
51,771 53,546 68,115 3.4 27.2 . . . 150 800 . . . . . .
474,163 451,753 591,623 –4.7 31.0
. . . Not applicable.
Table E.7
Capital Outlays of the Federal Reserve Banks, FRIT, and OEB, by Category, 2006 and 2007
2006 estimated compared with 2006 budgeted
Thousands of dollars except as noted
Category 2006 (budgeted)
2006 (estimated)
2007 (budgeted)
Percent change
2007 budgeted compared with 2006 estimated
Building-related projects and facility improvements .............................
Security enhancements ........................ Information technology ...................... Payment system improvement
initiatives. .................................... Miscellaneous1 ...................................
Total ...................................................
252,030 240,399 314,478 –4.6 30.8 64,156 37,600 69,368 –41.4 84.5 72,966 52,892 76,103 –27.5 43.9
80,538 114,562 126,394 42.2 10.3 4,472 6,301 5,279 40.9 –16.2
474,163 451,753 591,623 –4.7 31.0
1. Includes other equipment purchases.

Maps of the Federal Reserve System
The Federal Reserve System
CHICAGO
K CANSAS ITY
ALASKA
MINNEAPOLIS
DALLAS
S FAN RANCISCO
S LT. OUIS
CLEVELAND
RICHMOND
ATLANTA
PHILADELPHIA
N YEW ORK
BOSTON
10 12
11
9
8 6
7
1 2
3
5
4
HAWAII
LEGEND
Both pages
40 Annual Report: Budget Review, 2007
Federal Reserve Bank city
Board of Governors of the Federal Reserve System, Washington, D.C.
Facing page
• Federal Reserve Branch city
— Branch boundary
NOTE
THE FEDERAL RESERVE OFfiCIALLY IDENTIfiES DISTRICTS BY NUM BER AND RESERVE BANK CITY (SHOWN ON BOTH P AGES) AND BY LETTER (SHOWN ON THE FACING P AGE).
IN THE 12TH DISTRICT, THE SEATTLE BRANCH SERVES ALASKA
AND THE SAN FRANCISCO BANK
SERVES HAWAII.THE SYSTEM SERVES COM M ONWEALTHS
AND TERRITORIES AS FOLLOWS: THE NEW YORK
Bank serves the Commonwealth of Puerto Rico and the U.S. Virgin Islands; the San Francisco Bank serves American Samoa, Guam, and the Commonwealth of the Northern Mariana Islands. The maps show the boundaries within the System as of year-end 2006.
NH
MA
RI
ME
VT
CT
1−A
BOSTON
CT
NY
NY NJ
2−B
N YEW ORK
Buffalo
NJPA
DE
3−C
PHILADELPHIA
PA
OH
WV
KY
4−D
CLEVELAND
Cincinnati
Pittsburgh 5−E
RICHMOND
MD
WV
VA
NC
SC
Charlotte
Baltimore
New Orleans
Miami
GA
AL
FL
MS
TN
LA
6−F
ATLANTA
Birmingham
Jacksonville
Nashville
IN
WI MI
IA
IL
7−G
CHICAGO
Detroit
AR
MO
IL IN
MS
KY
TN
8−H
S LT. OUIS
Little Rock
Louisvi
Memphis
lle
ND
MT
SD WI
MN
MI
9−I
MINNEAPOLIS
Helena
NM
CO
WY
NE
MO KS
OK
10−J
K CANSAS ITY
Omaha
Denver
Oklahoma City
TX
LA
NM
11−K
San Antonio
HoustonEl Paso
DALLAS
Maps of the Federal Reserve System 41
ID
CA
OR
NV
AZ
WA
UT
HAWAII
ALASKA
12−L
Seattle
Portland
Los Angeles
Salt Lake City
SAN FRANCISCO

0407