Aquatic Plant/ Macrophyte coveragefiles.dep.state.pa.us/Water/Drinking Water and Facility...
14
BUREAU OF CLEAN WATER AQUATIC MACROPHYTE COVERAGE PROCEDURES FOR LAKE ASSESSMENTS (ADAPTED FROM MA DEP, WI DNR AND NALMS PROTOCOLS FOR PA DEP, 2010) DECEMBER 2015
Transcript of Aquatic Plant/ Macrophyte coveragefiles.dep.state.pa.us/Water/Drinking Water and Facility...

BUREAU OF CLEAN WATER
AQUATIC MACROPHYTE COVERAGE PROCEDURES FOR LAKE ASSESSMENTS
(ADAPTED FROM MA DEP, WI DNR AND NALMS PROTOCOLS FOR PA DEP, 2010)
DECEMBER 2015

1
Aquatic Macrophyte Coverage Procedures for Lake Assessments (Adapted from MA DEP, WI DNR and NALMS protocols for PA DEP, 2010)
Assessing and Monitoring Aquatic Plants Introduction Aquatic plant (macrophyte) mapping is commonly used to aid in lake assessments, recognizing the fact that plants have an important role in a lake ecosystem. Microorganisms living on the plant material form a food base for macroinvertebrates, which in turn support other lake-dwelling species through a diverse food web. Aquatic plants provide cover, nesting areas, building materials, and food for fish, amphibians, reptiles, birds, and aquatic mammals. Aquatic plant beds are important fish spawning and nursery areas, and play a major role in the status of a lake’s fishery. Emergent vegetation provides shoreline habitat and cover for reptiles, amphibians, birds, and small mammals. Aquatic plants, both in-lake and shoreline, also function as buffers from runoff and destructive wave action. Lack of vegetation increases the vulnerability of lakeshore stability, reduces available habitat, and results in lower biodiversity and overall biomass of the lake ecosystem. Paucity in PA lake vegetation is a natural condition of young reservoirs, especially those with steep shorelines, but can also occur in lakes with recurring winter drawdowns, or as a result of aggressive weed management by lake owners. Aquatic macrophytes can be used to assess the Recreational Use of a waterbody and aid in the assessment of Aquatic Life Use (USEPA 2005, Table 1-5). A dense population of aquatic plants can inhibit swimming, fishing, boating, water skiing, and aesthetic appeal. Too few aquatic plants restrict fish and macroinvertebrate habitat to rock or sediment substrates. Judicious plant management can protect and facilitate the waterbody’s recreational use while retaining beneficial aquatic life habitat. However, aquatic plant management through mechanical, chemical, and/or biological means can be an on-going balancing act that is unique to each lake. Assessment of the aquatic plant biomass or coverage in a lake can also be helpful in interpreting lake Trophic State Indices (TSIs). When macrophytes are abundant, they can serve as a phosphorus sink, utilizing much of the available phosphorus. Macrophytes can also stabilize and trap sediments nearshore, contributing to good water clarity and a “clear-water stable-state”. Lack of macrophytes in a nutrient-rich lake often is indicative of an “alternate stable-state” with pelagic phytoplankton dominating, creating consistently turbid conditions. Both of these lake conditions are stable and not easily reversed. Each is characterized by different biological diversity, biomass, and community structure, especially in plankton and fisheries; and in the presence-absence of aquatic macrophytes (Scheffer 1998). To help determine the degree to which the presence or paucity of aquatic macrophytes influences a lake system and its uses, it is advisable to quantify the non-algal plant coverage. This information can then be applied to the overall assessment of the lake use determinations.
2
Monitoring The following procedure has been used in Pennsylvania to determine macrophyte coverage for the assessment of lakes. The density, diversity, and growth patterns of aquatic plants are unique to each lake. Details concerning sample site locations and other sampling aspects should be worked out on a lake-specific basis. Surveys should normally be conducted during the height of the growing season, July and August. An exception to this standard would be determining impacts of Potomogeton crispis (a non-native, sometimes invasive aquatic plant); the survey should be completed in spring because this species grows best in cool temperatures and senesces in warm weather. Record the location of significant plant beds, their bed boundaries, and the general types of aquatic plants in each bed. Plant species can be identified using appropriate keys and references and/or by collecting representative specimens for expert verification. Below are general procedures for mapping the distribution of aquatic plants, collecting plant specimens, and determining the relative density of plant beds at select sites. Equipment: Depth finder, leadline, calibrated oars, or line Rangefinder
GPS Secchi disk
Weighted rake (Weed Weasel® or a garden rake with handle cut in half with about 25-30ft of throwing line attached; or two shortened rakes bolted together for a double-head)
Plastic bags for specimens; place in coolers with ice Clipboard, pencils, permanent marker (to label bags) Map/outline of lake w/ sampling sites marked Data sheets for recording View scope Mapping:
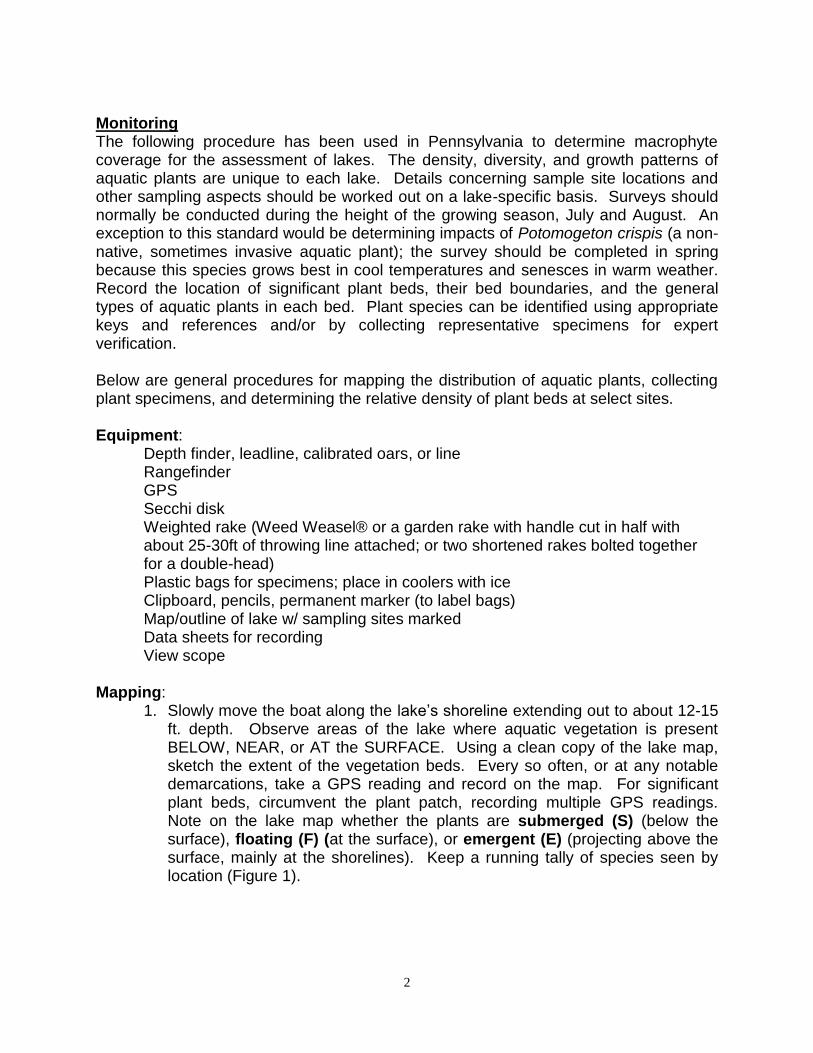
1. Slowly move the boat along the lake’s shoreline extending out to about 12-15 ft. depth. Observe areas of the lake where aquatic vegetation is present BELOW, NEAR, or AT the SURFACE. Using a clean copy of the lake map, sketch the extent of the vegetation beds. Every so often, or at any notable demarcations, take a GPS reading and record on the map. For significant plant beds, circumvent the plant patch, recording multiple GPS readings. Note on the lake map whether the plants are submerged (S) (below the surface), floating (F) (at the surface), or emergent (E) (projecting above the surface, mainly at the shorelines). Keep a running tally of species seen by location (Figure 1).

3
2. Use a scale on the map or a range-finder to estimate the length and width of significant plant beds or record GPS points at the beds’ furthest extent and edges.
3. For significant plant beds, estimate and record on the map the aerial coverage of the plants as:
None = no plants Sparse = 1 to 25 % cover Moderate = >25 to 50 % cover Dense = >50 to 75 % cover Very dense = >75 to 100 % cover
Cover is determined by first visually projecting all of the vegetation in the water column onto the lake surface. Use rake throws to help estimate plant coverages that are not visible (see below). Then approximate the percentage of surface area the vegetation would cover. The following markings can be used to denote areas of different coverage on your map (Figure 2):
No coverage -------------------------- single x Sparse areas -------------------------- outlined area with no markings inside or small “o”s Moderate areas ----------------------- stippling (:::::) Dense areas --------------------------- hatched lines (//////) Very dense areas -------------------- cross-hatched lines (XXX)
If enough GPS coordinates are recorded, the macrophyte coverage can later be visually displayed in a GIS platform as a plant patch polygon. This polygon can then be used to create electronic and printable maps.
When using the rake, plant density can be estimated based on the macrophyte abundance on the rake head (Photos 1 through 4, below). For each cast, estimate the rake “fullness” by categorizing the plant coverage on the rake head. “Sparse” would correspond to a few plants captured on the head of the rake. “Moderate” would be a fairly full rake, with plants between every tine, but rake tines still visible. “Dense” indicates a full rake of plants, with rake tines barely visible. “Very dense” would correspond to a rake overflowing with plants, almost too heavy to pull in. Plants in this category are likely visible as a dense mat in or on the water, but not necessarily (as in deep waters).
The rake method has shown to compare favorably to more intense surveys such as collections by divers or Ponar (Deppe and Lathrop 1992; Kenow, et al 2007; Rodusky et al 2005). 4. Record Secchi depths in approximately each quarter of the lake. Keep in mind that mid-lake areas may have plants on the bottom if the depth is 15 feet or less. Use a view scope (if feasible, based on water clarity) or the rake often to determine plant presence. Maximum light attenuation in PA lakes is

4
about 12 to 15 feet, or about 2 times the Secchi depth; therefore, depths over 15 feet usually do not need to be sampled unless the lake is unusually clear.
Equipment Care: Be cognizant of transporting plant fragments to other lakes! Boats and trailers are major transporters of both plant and animal aquatic invasive species. The following steps should be completed at the end of each sampling day: Drain and wash the inside and outside of your boat, the motor, oars, anchor, and any equipment used during the survey, as well as the entire trailer. The recommended procedure is to use a high pressure spray (like those at a car wash), without soap and preferably hot water over cold. Whenever possible, allow the boat/trailer to dry out completely for several days before launching in another lake. EPA recommends washing equipment in a 2% Clorox solution. Complete procedures for washing equipment are located at EPA’s National Lake Survey website http://www.epa.gov/owow/lakes/lakessurvey in the 2012 and 2007 NLAField Operations Manuals (Methods/Manuals tab), and at PA Fish and Boat Commission’s website, which continues to be updated: http://www.fish.state.pa.us/cleanyourgear.htm.
Extended Information The following procedure is used to record the “types” or species of plants that occur most commonly within the lake and calculate the frequency of occurrence. This is a more in-depth procedure, and the use of a larger scale map and knowledge of aquatic plant taxonomy is recommended. Prior to starting your survey, mark a series of planned observation points on your lake map. Use a minimum of 20 sites per lake, up to 200 acres; add ten sites for every 100 additional acres. Place the stations at uniform intervals across the map; be sure to include areas with shallow and deep plant beds. At each site, record on a datasheet the GPS reading and tally the number of plant species using tick marks (Figure 1). Frequency of occurrence for each plant type (species) can be calculated as a percentage of the total number of sites observed. Moderately enriched and eutrophic lakes will have a fairly good species list, with not many species dominating (<30%). An imbalanced population will have fewer species that occur more frequently. It may be useful to record the specific location of each plant species. Mark the species (or plant type) on a copy of the lake map. You may want to create a code for each species or type, making it easier to fit on the map. The same codes should be maintained in the future to avoid confusion. Voucher Specimens Collect representative specimens of each plant type, at every lake. Place specimens in a labeled (lake/date, with permanent marker), sealable plastic bag. On shore or in the lab the next day, press specimens in a plant press between labeled newspapers, using blotter papers and cardboard spacers to help the drying process. After the specimens

5
are dry and flat (a week or so depending on ambient humidity), store in a safe dry place until the end of the sampling season. Morris Arboretum (in Philadelphia) has agreed to verify the identification of aquatic macrophyte specimens and will include them in their PA plant inventory. Coordinate with Barbara Lathrop, DEP Central Office at 717-772-5651, to submit your specimens to Morris Arboretum. Your plant maps and species lists should be filed with the other data collected at the lake. Assessment Once the survey is complete and the sketched map of the lake’s macrophyte coverage is finished, an estimate of acres or percent coverage can be done either by GIS applications or by hand. If done by hand, lay a see-through grid pattern (approximately ¼” squares) over the entire map. Count plant-covered squares versus open lake squares to estimate percent coverage. Count partial squares until they equal one square. For example, two half-covered squares equals one, and three 1/3rd covered squares equals one. Apply this percentage to the known acreage of the lake to determine the acres of macrophytes. Once the plant coverage is known, use Best Professional Judgment and the extent of coverage to assess recreational impairment. Generally, a surface coverage of 40% or greater will impair the recreational use. For example, for a 100 acre lake with more than 40 acres of the lake OR shoreline covered with aquatic macrophytes, you have an indication of impairment. For larger lakes, assess only the percent surface coverage of the shoreline area because it is unlikely that a large lake will have any coverage offshore. There are a few exceptions, as Pennsylvania does have some large shallow lakes. In these cases, the extent of lake management will be a factor in the amount of plant coverage and in the assessment of recreational impairment. In some larger state park lakes, only public access areas are treated to control macrophytes. However, in some private lakes, the entire shoreline might be treated. Macrophyte coverage can also be used to assess Aquatic Life Use. In this case, a 40% and greater underwater coverage indicates good habitat conditions and justification that the lake is meeting Aquatic Life Use. An underwater coverage of 10% or less indicates habitat impairment. Macrophyte coverage between 10% and 40% requires the reviewing biologist to consider other factors and can be used to support an impairment decision. When using macrophyte coverage to assess lakes, consider the following factors. Take note of the presence and extent of invasive non-native species and the degree of weed management measures used by lake stakeholders (e.g. harvesting, application of herbicides or aqua-shades, drawdowns, etc.). Non-native species can degrade habitat and limit native aquatic plants. Over-management of weeds reduces fish habitat and nursery areas, fosters algal blooms, and causes algal or sediment turbidity. However, judicious management can improve boating and swimming areas, while retaining fish habitat. Information on the extent of macrophyte treatment is usually helpful in making overall use determinations.

6
Trophic State Indices (TSIs) are sensitive to algal biomass, and therefore the chlorophyll TSI of a macrophyte-dominated lake may be underestimated (Canfield et al 1983). When the various TSI parameters on a lake do not agree, often non-algal turbidity or extensive weed growth is the reason. Use the knowledge of a macrophyte-dominated lake and mapped coverages to evaluate TSI differences to rate the lake’s overall trophic status.
7
Literature Cited Table 5-1. Recommended Water Quality Indicators for General Designated Use Categories. p 52 in "Guidance for 2006 Assessment, Listing and reporting Requirements Pursuant to Sections 303(d), 305(b) and 314 of the Clean Water Act”, a Memorandum to States dated July 29, 2005. (Source – Elements of a State Water Monitoring and Assessment Program, Office of Water, US EPA; EPA 841-B-03-003, March 2003).
Canfield, D.E. Jr., K.A. Langeland, M.J. Maceina, W.T. Haller, J.V. Shireman, and J.R.Jones. 1983. Trophic state classification of lakes with aquatic macrophytes. Can. J. Fish. Aquat. Sci. 40: 1713-1718.
Deppe, E.R. and R.C. Lathrop. 1992. A Comparison of Two Rake Sampling Techniques for Sampling Aquatic Macrophytes. In Research Management Findings, Bureau of Research. Wisconsin Dep. Natural Resources, Number 32, March 1992.
Environmental Protection Agency. 2007. Survey of the Nation’s Lakes Field Operations Manual. Doc. EPA841-B-07-004. Office of Water, Washington, D.C. 96 pp. Environmental Protection Agency. 2012. 2012 National Lakes Assessment Field Operations Manual. Doc. EPA 841-B-11-003. Office of Water, Washington, D.C. 234 pp. Pennsylvania Fish and Boat Commission. 2014. Clean Your Gear – Help Reduce the Spread of Aquatic Invasive Species. Website http://www.fish.state.pa.us/cleanyourgear.htm Kenow, K.P, J.E. Lyon, R.K. Hines, and A. Elfessi. 2007. Estimating Biomass of Sumberges Vegetation Using a Simple Rake Sampling Technique. Pp 447-454 in: Hydrobiologia. Vol. 575, No. 1, Jan. 2007. Rodusky, A.J., B. Sharfstein, T.L.East, and R. P. Maki. 2005. A Comparison of Three Methods to Collect Submerged Aquatic Vegetation in a Shallow Lake. Pp. 87-97 in: Environmental Monitoring and Assessment. Vol 110, Nos 1-3, Nov. 2005. Scheffer, Martin. 1998. Ecology of Shallow Lakes. Kluwer Academic Publishers, Norwell, MA. 357 pp.
8
Aquatic Plant Identification Manuals Block, T. A and A.F. Rhoads. 2011. Aquatic Plants of Pennsylvania. A Complete Reference Guide. Morris Arboretum of the University of Pennsylvania. 306 pp. Borman, S, R.Korth, J Temte. 1999. Through the Looking Glass. A Field Guide to Aquatic Plants. Wisconsin Lakes Partnership. Wisconsin DNR Publication FH-207-97. 248 pp. Crow, G.E. and Hellquist, C.B. 2000. Aquatic and Wetland plants of Northeastern North America, Vol. 1 and 2. University of Wisconsin Press. Madison, WI. Hotchkiss, N. 1972. Common Marsh, Underwater, and Floating-leaved Plants of the United States and Canada. Dover Publications, Inc. NY. Nichols, S.A. 1999. Distribution and Habitat Descriptions of Wisconsin Lake Plants. Wisconsin Geological and Natural History Survey. Bull. 96. 266 pp.
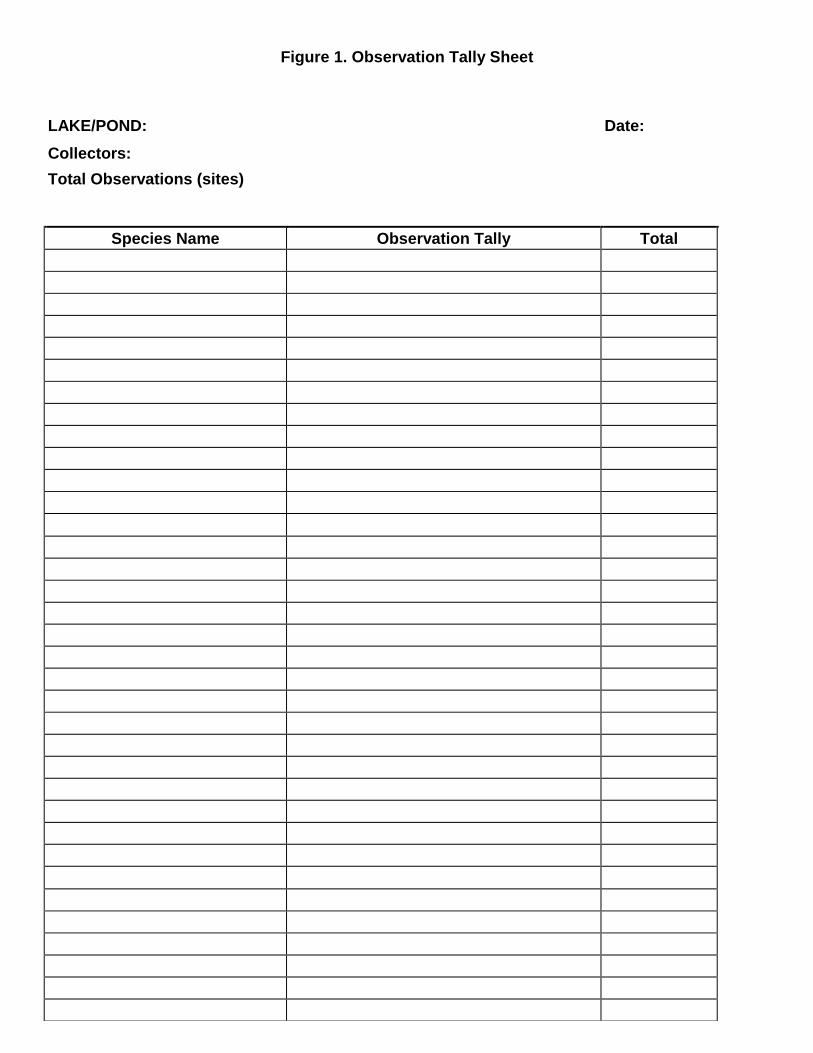
Figure 1. Observation Tally Sheet
LAKE/POND: Date:
Collectors:
Total Observations (sites)
Species Name Observation Tally Total
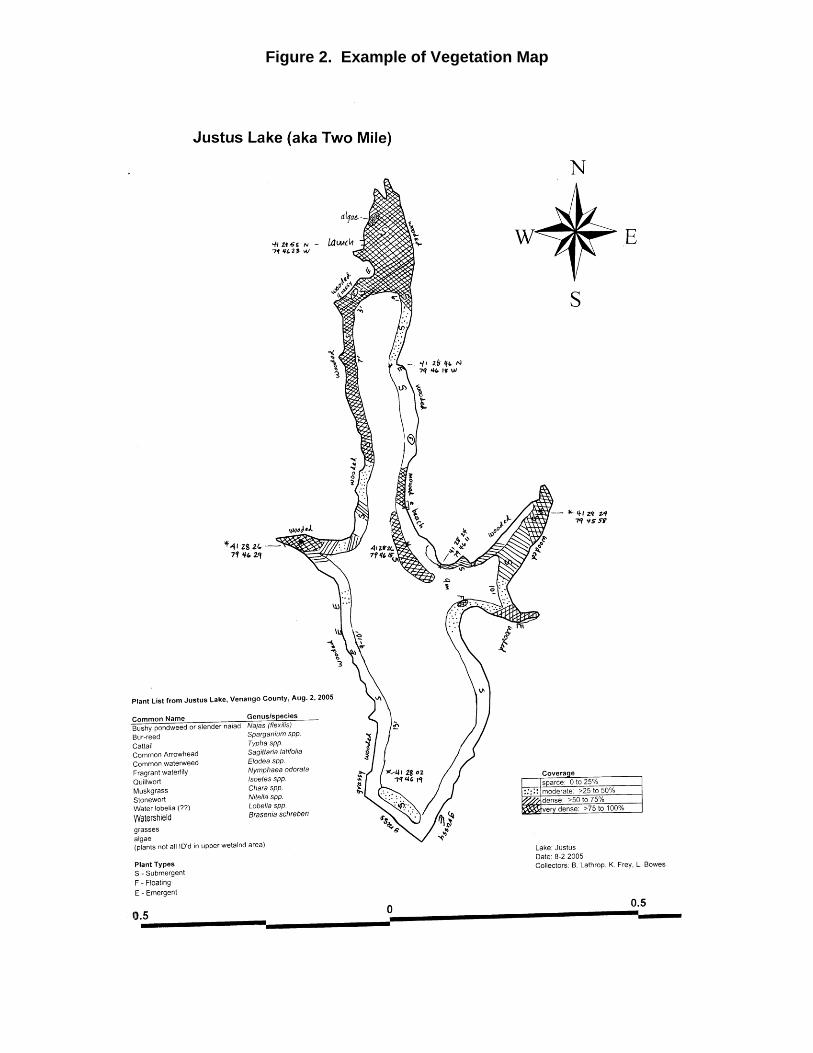
Figure 2. Example of Vegetation Map

Figure 3. Photos of rake density
1. Sparse:
2. Moderate:
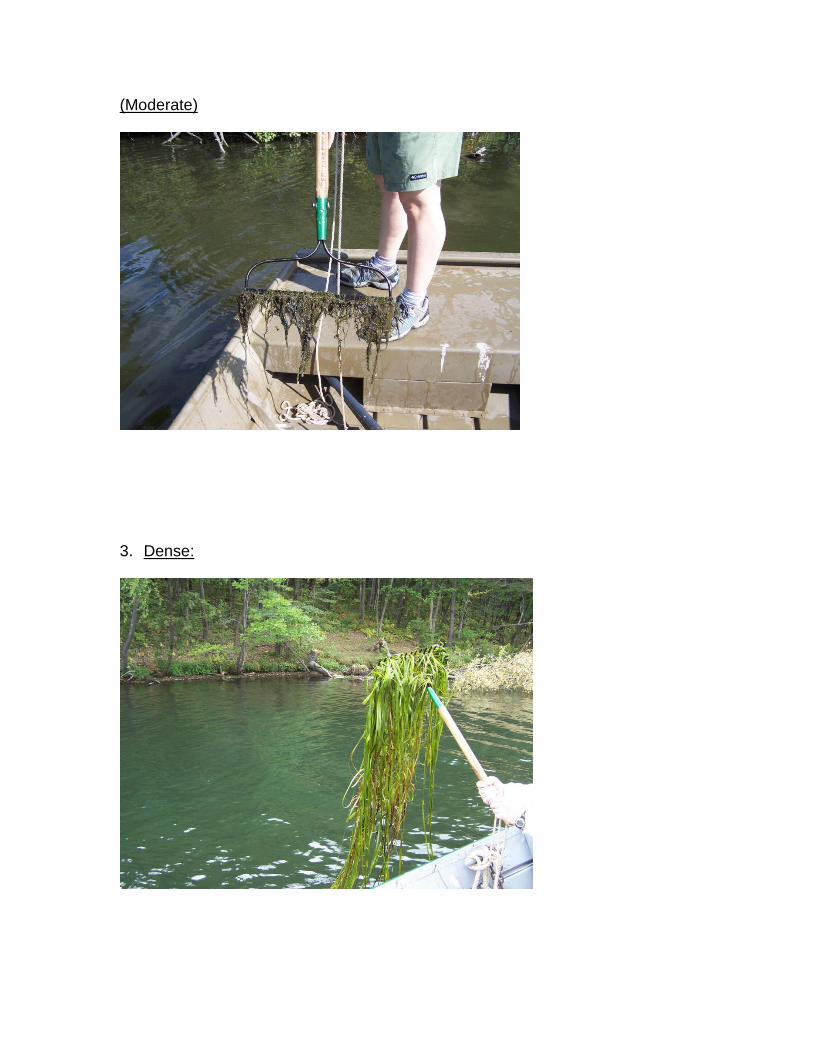
(Moderate)
3. Dense:

4. Very dense!