Opportunities for research experiences in: Aquatic ecology Forest ecology Conservation ecology

www.energy.gov/EM 1
Aquatic Ecology Research and Technology Development in East Fork Poplar Creek
Presentation to the
Oak Ridge Site Specific Advisory Board
June 8, 2016
Mark Peterson Leader Aquatic Ecology Group
Environmental Sciences Division Oak Ridge National Laboratory

www.energy.gov/EM 2
Acknowledgements
Mercury Technology Development Project Team and Researchers:
• DOE OREM: Jason Darby, Elizabeth Phillips, Brian Henry, Laura
Wilkerson
• UCOR/RSI: Charlie Mansfield, Jimmy Massey, Dan Macias, Mary Magleby, Carl Milligan
• ORNL: Scott Brooks, Melanie Mayes, Terry Mathews, Dave Watson, Alex Johs, John Dickson, Mark Peterson

www.energy.gov/EM 3
• ORNL aquatic ecology research • Mercury in East Fork Poplar Creek • Mercury technology development program
• Strategy • Key findings to-date
Presentation Outline
www.energy.gov/EM 4
1940s 1950s 1960s 1970s 1980s 1990s 2000s 2010s
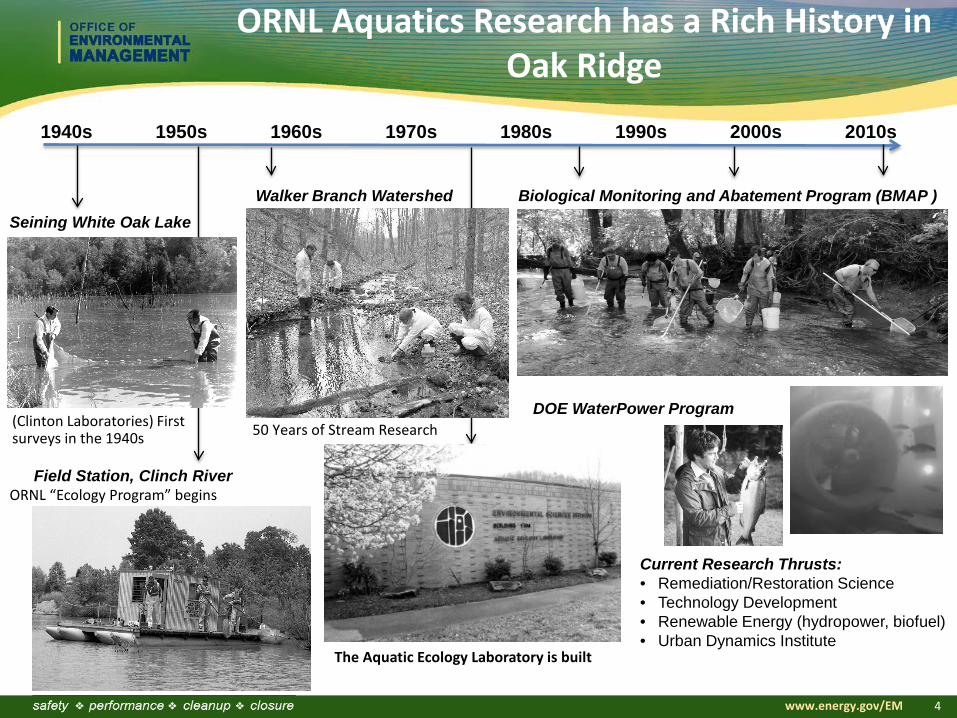
ORNL Aquatics Research has a Rich History in Oak Ridge
ORNL “Ecology Program” begins
Seining White Oak Lake
Field Station, Clinch River
(Clinton Laboratories) First surveys in the 1940s
Walker Branch Watershed
50 Years of Stream Research
The Aquatic Ecology Laboratory is built
Biological Monitoring and Abatement Program (BMAP )
DOE WaterPower Program
Current Research Thrusts: • Remediation/Restoration Science • Technology Development • Renewable Energy (hydropower, biofuel) • Urban Dynamics Institute

www.energy.gov/EM 5
The Aquatic Ecology Laboratory is a Premier Research Facility
• One of the few aquatic ecology research facilities in the southeast
• Focus on solutions to the US’s most challenging energy-environmental problems
• Includes 9,000-square feet of floor space: outbuildings, extensive field research equipment, on-site research ponds, long-term Oak Ridge Reservation research sites
• A go-to place for aquatics research: 18 ORNL staff and ~20-30 subcontractors, students, and research visitors per year to the laboratory; major ORNL tour destination
• Strong ties to regional organizations and related missions (OREM, UCOR/RSI, CNS, TVA, UT, TTU, NEON Inc., CG Services, etc.)
www.energy.gov/EM 6
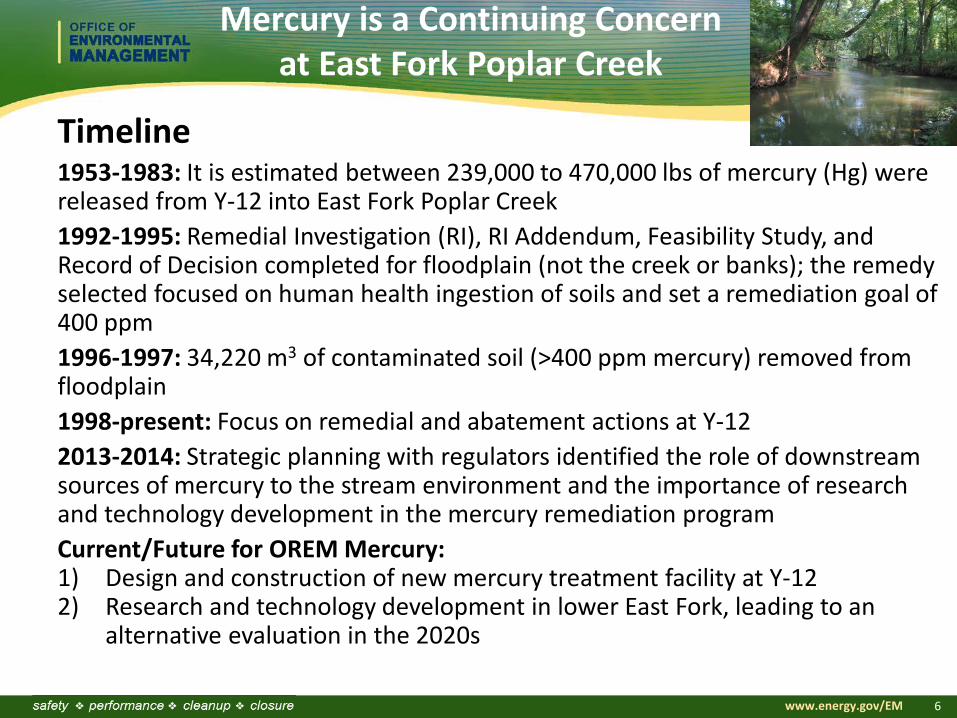
Mercury is a Continuing Concern at East Fork Poplar Creek
Timeline 1953-1983: It is estimated between 239,000 to 470,000 lbs of mercury (Hg) were released from Y-12 into East Fork Poplar Creek 1992-1995: Remedial Investigation (RI), RI Addendum, Feasibility Study, and Record of Decision completed for floodplain (not the creek or banks); the remedy selected focused on human health ingestion of soils and set a remediation goal of 400 ppm 1996-1997: 34,220 m3 of contaminated soil (>400 ppm mercury) removed from floodplain 1998-present: Focus on remedial and abatement actions at Y-12 2013-2014: Strategic planning with regulators identified the role of downstream sources of mercury to the stream environment and the importance of research and technology development in the mercury remediation program Current/Future for OREM Mercury: 1) Design and construction of new mercury treatment facility at Y-12 2) Research and technology development in lower East Fork, leading to an
alternative evaluation in the 2020s

www.energy.gov/EM 7
Mercury Technology Development and Mercury Cleanup Activities will Continue for Many Years
Project start, August 2014
www.energy.gov/EM 8
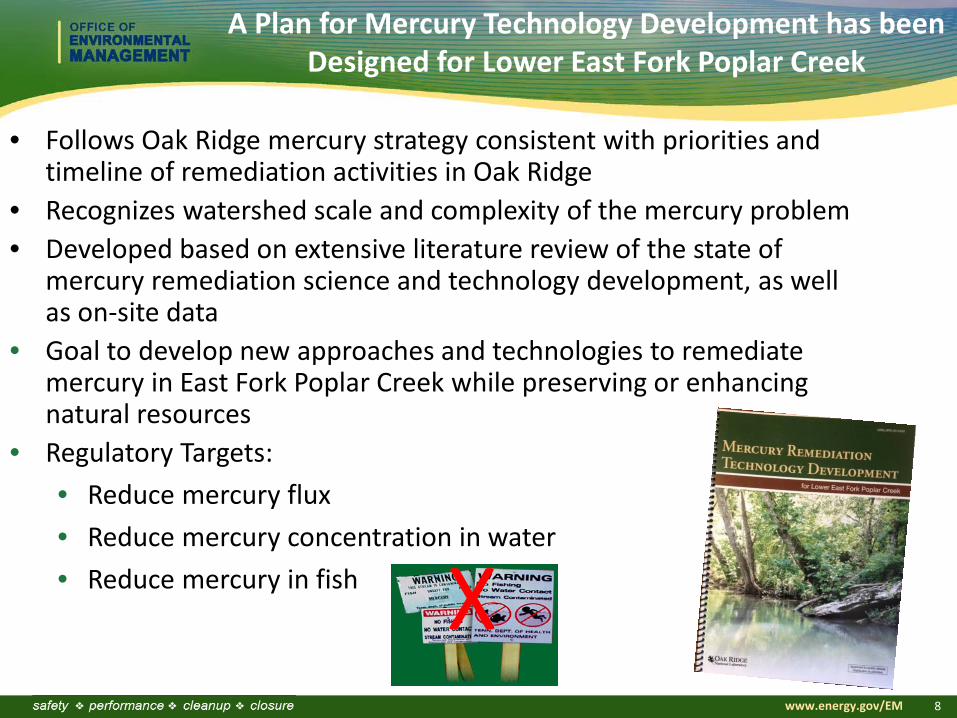
A Plan for Mercury Technology Development has been Designed for Lower East Fork Poplar Creek
• Follows Oak Ridge mercury strategy consistent with priorities and timeline of remediation activities in Oak Ridge
• Recognizes watershed scale and complexity of the mercury problem • Developed based on extensive literature review of the state of
mercury remediation science and technology development, as well as on-site data
• Goal to develop new approaches and technologies to remediate mercury in East Fork Poplar Creek while preserving or enhancing natural resources
• Regulatory Targets: • Reduce mercury flux • Reduce mercury concentration in water • Reduce mercury in fish
X
www.energy.gov/EM 9
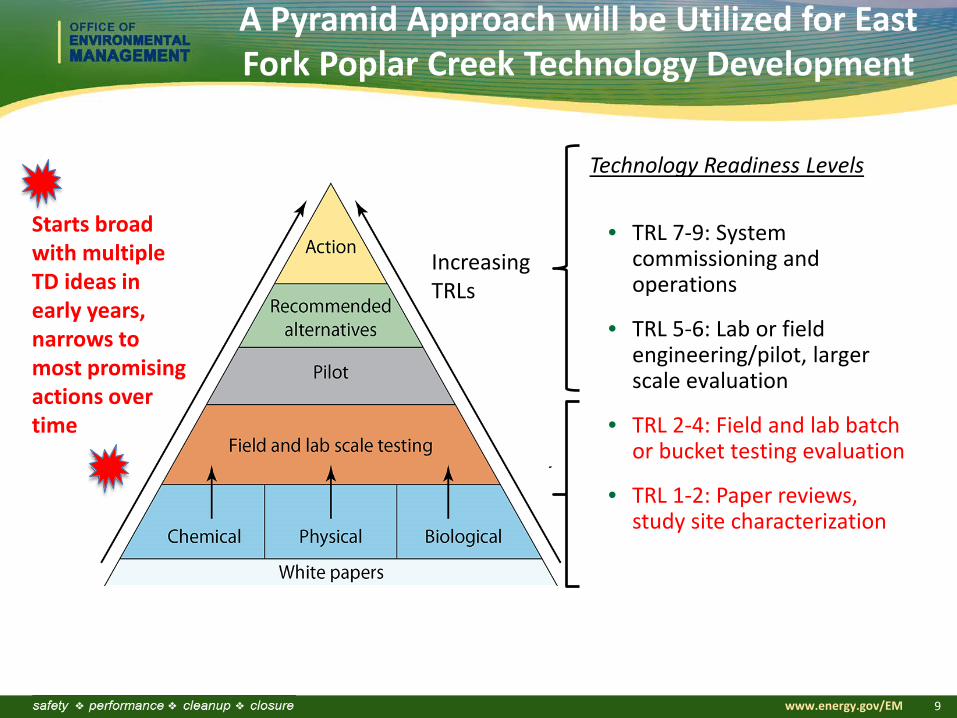
A Pyramid Approach will be Utilized for East Fork Poplar Creek Technology Development
Starts broad with multiple TD ideas in early years, narrows to most promising actions over time
Increasing TRLs
Technology Readiness Levels
• TRL 7-9: System commissioning and operations
• TRL 5-6: Lab or field engineering/pilot, larger scale evaluation
• TRL 2-4: Field and lab batch or bucket testing evaluation
• TRL 1-2: Paper reviews, study site characterization

www.energy.gov/EM 10
Soil and Groundwater
Source Control
Primary benefit is decreased mercury source inputs, flux
Water Chemistry and Sediment Manipulation
Primary benefit is decreased mercury concentration and methylation
Ecological Manipulation
Primary benefit is decreased mercury bioaccumulation
Three key factors determine the level of mercury contamination in fish—the amount of inorganic mercury available to an ecosystem, the conversion of inorganic mercury to methylmercury, and the bioaccumulation of methylmercury through the food web.
-USGS Circular 1395 (2014)
There are Three Major Project Tasks
Tasks: Goals/Potential Benefits:
Source
Time & Food web
complexity
Mercury Methylation
Methylmercury
Methylmercury

www.energy.gov/EM 11
Understanding the System is Essential to Developing the Best Technological Solutions
Temperature & conductivity
pH Turbidity
Dissolved oxygen
YSI 6920 V2
Evaluating bank mercury and soil erosion
Understanding water chemistry
and flow changes
Investigating methyl mercury in biota

www.energy.gov/EM 12
There have been Several Key Findings To Date
• Erosion estimates and mercury sampling provided first detailed estimate of bank mercury flux
• Highest concentrations and fluxes in the upper section of creek
• Bank soils are a major source of mercury to the creek
• Discovered and described a historical release deposit (HRD) with high mercury concentrations
HRD
Estimated mercury flux per 100-m reach (kg/yr/100m)
Total estimated LEFPC 38kg/yr Role of Stream Banks
Soil and Groundwater
Source Control
www.energy.gov/EM 13
Bank profile& horizontal core locations
Distance (m)0.0 0.2 0.4 0.6 0.8
Ban
k H
eigh
t (m
abo
ve w
ater
leve
l)
0.0
0.2
0.4
0.6
0.8
1.0
1.2
1.4
1.6
Distance (cm) into creek bank
0 5 10 15 20
Tota
l Hg
(mg/
kg)
05
1015202530
Tota
l Hg
(mg/
kg)
0
100
200
300
400
Tota
l Hg
(mg/
kg)
0200400600800
100012001400
0 5 10 15 20
Tota
l Hg
(mg/
kg)
020406080
100120140160
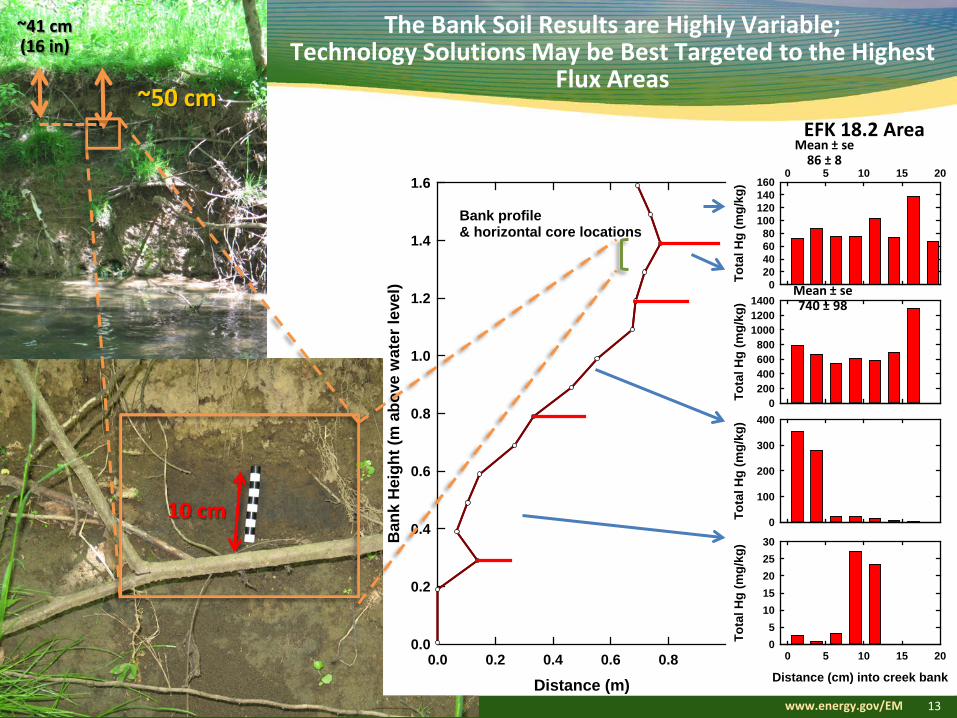
EFK 18.2 Area
10 cm
Mean ± se 86 ± 8
Mean ± se 740 ± 98
~50 cm
~41 cm (16 in)
The Bank Soil Results are Highly Variable; Technology Solutions May be Best Targeted to the Highest
Flux Areas

www.energy.gov/EM 14
There are Many Factors Involved in Evaluating Water Chemistry and Sediment Manipulation
2
3
4
1 Prevent methylation Promote demethylation Alter solid-aqueous partitioning Actions in Y-12
1 2
3
4
1
3 3
3
1
Evaluations of potential water chemistry manipulations in the creek will depend on a thorough understanding of current stream chemistry conditions
www.energy.gov/EM 15
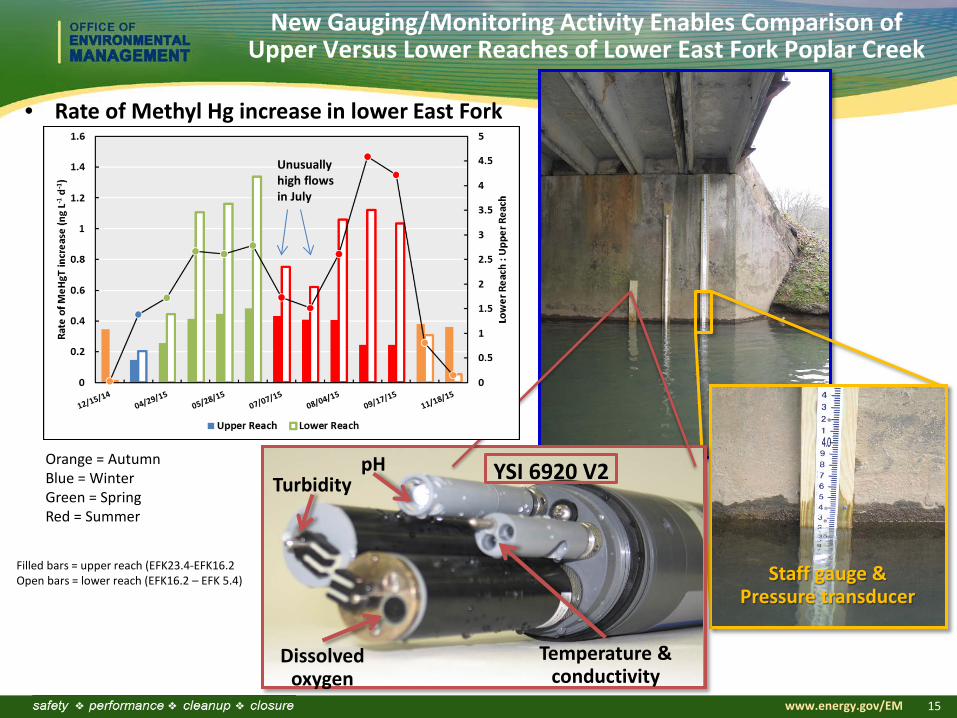
Staff gauge & Pressure transducer
Temperature & conductivity
pH Turbidity
Dissolved oxygen
YSI 6920 V2
New Gauging/Monitoring Activity Enables Comparison of Upper Versus Lower Reaches of Lower East Fork Poplar Creek
• Rate of Methyl Hg increase in lower East Fork
Orange = Autumn Blue = Winter Green = Spring Red = Summer
Unusually high flows in July
Filled bars = upper reach (EFK23.4-EFK16.2 Open bars = lower reach (EFK16.2 – EFK 5.4)

www.energy.gov/EM 16
Mercury Extractability in Fine-Grained Creek Sediments Changes Systematically Downstream
• >97% of mercury extracted only in more chemically aggressive solutions (F3+F4+F5) • Systematic shift in fractions downstream
o More extracted in F3 at the expense of F5
• Implication: Mercury extracted in F3 fraction most strongly correlated with methylation potential (Bloom, 2003)
Fraction Composition
F1 Anaerobic DIW
F2 HCl + Acetic acid (pH 2)
F3 1 M KOH
F4 12 N HNO3
F5 Aqua Regia (HCl: HNO3; 10:3)
Sequential Extraction Analyses

www.energy.gov/EM 17
Food Chains Make a Difference in Mercury Bioaccumulation
Water
Periphyton
InvertebratesForage Fish
Predator Fish
Increasing Trophic Level
USEPA fish tissue mercury criterion = 0.3 µg/g
• Longer food chains can increase mercury bioaccumulation • Each organism has different bioaccumulation potential • Greatest biomagnification step low in the food chain • Recent finding: algae a major contributor to mercury methylation
Can we change pathways of exposure?
www.energy.gov/EM 18
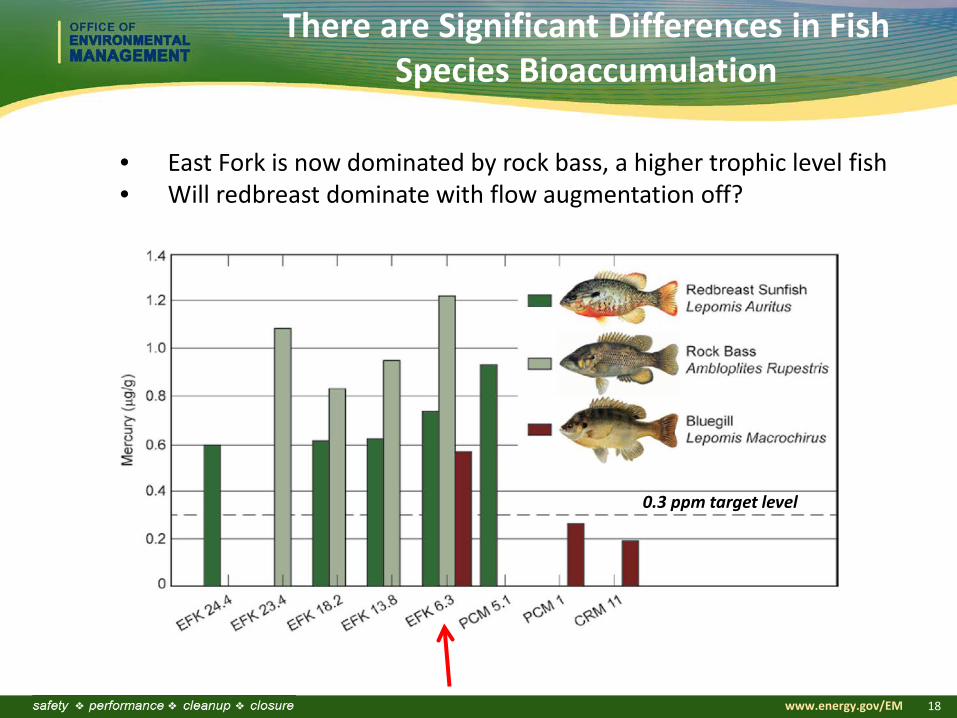
There are Significant Differences in Fish Species Bioaccumulation
0.3 ppm target level
• East Fork is now dominated by rock bass, a higher trophic level fish • Will redbreast dominate with flow augmentation off?

www.energy.gov/EM 19
Percent Methylmercury Varies by Invertebrate Species
Crayfish
Bivalves near 100% inorganic mercury
Crayfish
EFK23.4
EFK18.2
EFK13.8
EFK6.3
MeH
g/H
gT (
g/g
dry
wt.)
0.0
0.5
1.0
1.5
2.0
2.5
3.0MeHg HgTCaddisflies
EFK 23.4
EFK 18.2
EFK 13.8
EFK 6.3
MeH
g/H
g T (
g/g
dry
wt.)
0
1
2
3
4
5
6
MeHg HgT

www.energy.gov/EM 20
The Next Step is to Develop Mercury Control Technologies
Soil and sediment sorbent studies
ORNL lignin-based carbon materials
Decreasing dissolved mercury through chlorine removal
Investigating potential for reintroduction of mussels to decrease mercury in particles/algae
Soil and Groundwater
Source Control
Water Chemistry and Sediment Manipulation
Ecological Manipulation
www.energy.gov/EM 21
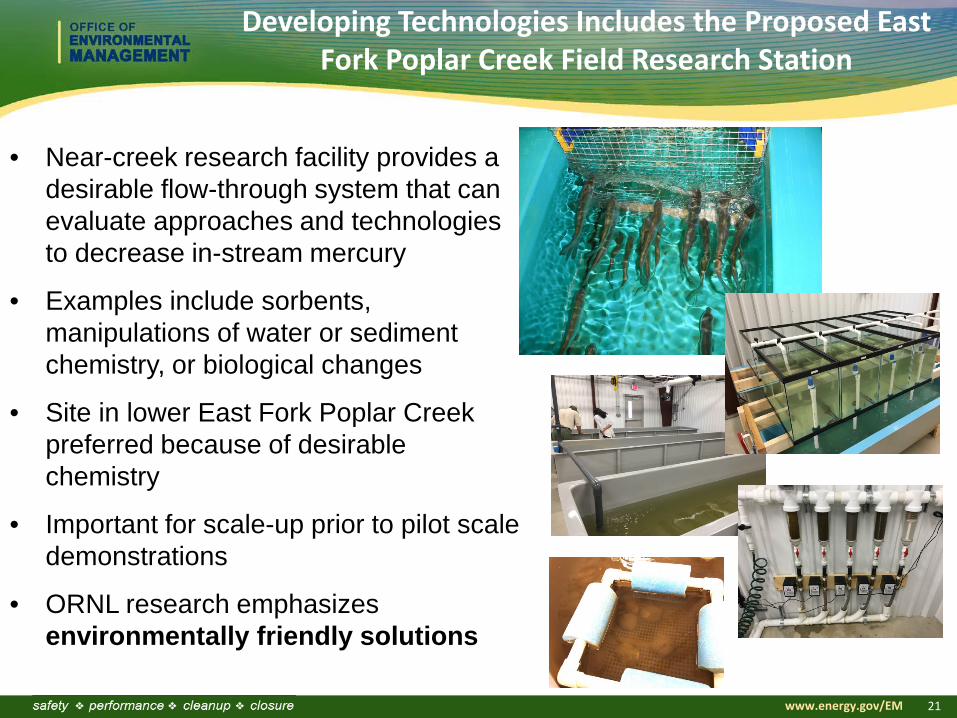
Developing Technologies Includes the Proposed East Fork Poplar Creek Field Research Station
• Near-creek research facility provides a desirable flow-through system that can evaluate approaches and technologies to decrease in-stream mercury
• Examples include sorbents, manipulations of water or sediment chemistry, or biological changes
• Site in lower East Fork Poplar Creek preferred because of desirable chemistry
• Important for scale-up prior to pilot scale demonstrations
• ORNL research emphasizes environmentally friendly solutions

www.energy.gov/EM 22
Water Quality “Good News” Stories
Web video 6/12/2015, BBC Horizons Episode 6: Pollution Solutions; Reversing the effects of pollution Finding science-based solutions for addressing global mercury pollution
Radio 5/1/2015; WUOT Interview Invertebrates rebound Focus on recovery of stream invertebrate populations on the Oak Ridge Reservation
Newspaper 8/2/2015, KNS Pond makeover in Oak Ridge reduces risks, adds beauty Status of innovative remediation project
TV 7/31/2015 WBIR Interview Students find a future through ORNL jobs UT and Duke students conduct studies to
improve urban water bodies
Open Literature Fall 2015 Chemosphere Water chemistry manipulation applied successfully at the Savannah River site.
Stannous chloride (SnCl2)
Wastewater containing Hg
BEFORE
AFTER
Air Stripper
Hg2+ + SnCl2 + 2H2O → Hg0 + 2Cl- + SnO2
Future: City of Oak Ridge
water storage tanks Y-12 Mercury
Treatment Facility