Aqa Econ1 w Qp Jan11
16
General Certificate of Education Advanced Subsidiary Examination January 2011 Economics ECON1 Unit 1 Markets and Market Failure Wednesday 12 January 2011 1.30 pm to 2.45 pm For this paper you must have: an objective test answer sheet a black ball-point pen an AQA 8-page answer book. You may use a calculator. Time allowed 1 hour 15 minutes Instructions In Section A, answer all questions on your objective test answer sheet. In Section B, answer EITHER Question 26 OR Question 27 in your AQA answer book. For Section A, do all rough work in this question paper, not on your objective test answer sheet. Section A (ECON1/1) Use a black ball-point pen. Do not use pencil. Section B (ECON1/2) Use black ink or black ball-point pen. Pencil should only be used for drawing. Write the information required on the front of your answer book. The Examining Body for this paper is AQA. The Paper Reference is ECON1/2. Information The maximum mark for this paper is 75. There are 25 marks for Section A and 50 marks for Section B. In Section A, each question carries 1 mark. No deductions will be made for wrong answers. In Section B, the marks for questions are shown in brackets. You will be marked on your ability to: – use good English – organise information clearly – use specialist vocabulary where appropriate. Advice You are advised to spend no more than 25 minutes on Section A and at least 50 minutes on Section B. ECON1 G/K62792/Jan11/ECON1 6/6/6/6
-
Upload
pesh-oodit -
Category
Documents
-
view
320 -
download
9
description
Economics Exam AQA
Transcript of Aqa Econ1 w Qp Jan11

General Certificate of EducationAdvanced Subsidiary ExaminationJanuary 2011
Economics ECON1Unit 1 Markets and Market Failure
Wednesday 12 January 2011 1.30 pm to 2.45 pm
For this paper you must have: an objective test answer sheet a black ball-point pen an AQA 8-page answer book.You may use a calculator.
Time allowed 1 hour 15 minutes
Instructions In Section A, answer all questions on your objective test answer sheet. In Section B, answer EITHER Question 26 OR Question 27 in your AQA answer book. For Section A, do all rough work in this question paper, not on your objective test answer sheet.
Section A (ECON1/1) Use a black ball-point pen. Do not use pencil.
Section B (ECON1/2) Use black ink or black ball-point pen. Pencil should only be used for drawing. Write the information required on the front of your answer book. The Examining Body for this
paper is AQA. The Paper Reference is ECON1/2.
Information The maximum mark for this paper is 75. There are 25 marks for Section A and 50 marks for Section B. In Section A, each question carries 1 mark. No deductions will be made for wrong answers. In Section B, the marks for questions are shown in brackets. You will be marked on your ability to: – use good English – organise information clearly – use specialist vocabulary where appropriate.
Advice You are advised to spend no more than 25 minutes on Section A and at least 50 minutes on
Section B.
ECON1G/K62792/Jan11/ECON1 6/6/6/6
2
G/K62792/Jan11/ECON1
Section A: Objective Test
Answer all questions in Section A.Each question carries 1 mark. No deductions will be made for wrong answers.
You are advised to spend no more than 25 minutes on Section A.
For each question there are four alternative responses, A, B, C and D. When you have selected the response which you think is the best answer to a question, mark this response on your objective test answer sheet. If you wish to change your answer to a question, follow the instructions on your
objective test answer sheet.
1 The fundamental economic problem facing all societies is
A what, how and for whom goods and services should be produced.
B the existence of unemployed resources.
C a significant divergence between social and private costs of production and consumption.
D inequalities in the distribution of income and wealth.
2 Which one of the following is an example of an economy of scale?
A A firm using its existing capacity more efficiently
B A company using its factory to produce more than one product
C A car firm increasing its range of models
D A firm employing specialist managers as its size increases
3 Which one of the following statements about a merit good is true?
A It may be provided by the free market but not in sufficient quantities.
B Once the good has been supplied to one consumer, there is no extra cost in supplying it to others.
C It is always provided free to consumers.
D It tends to be provided by the government because it is non-excludable.
3
G/K62792/Jan11/ECON1
Turn over
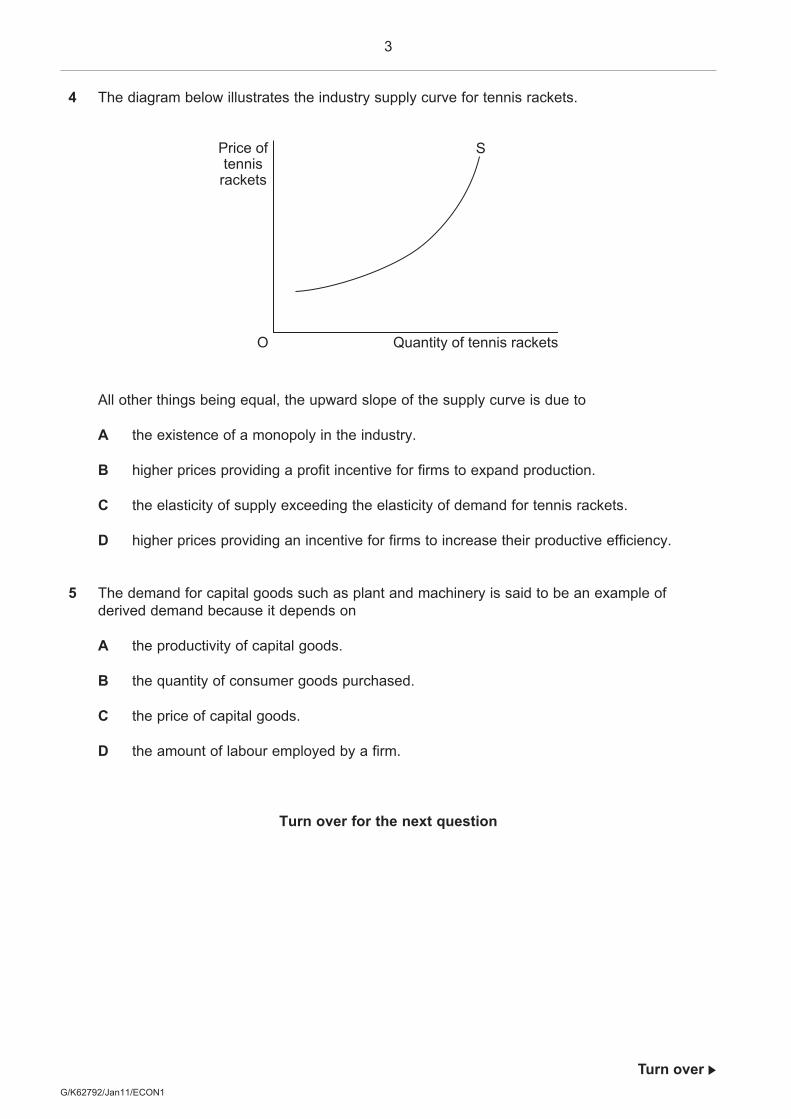
4 The diagram below illustrates the industry supply curve for tennis rackets.
Price oftennisrackets
O
S
Quantity of tennis rackets
All other things being equal, the upward slope of the supply curve is due to
A the existence of a monopoly in the industry.
B higher prices providing a profit incentive for firms to expand production.
C the elasticity of supply exceeding the elasticity of demand for tennis rackets.
D higher prices providing an incentive for firms to increase their productive efficiency.
5 The demand for capital goods such as plant and machinery is said to be an example of derived demand because it depends on
A the productivity of capital goods.
B the quantity of consumer goods purchased.
C the price of capital goods.
D the amount of labour employed by a firm.
Turn over for the next question
4
G/K62792/Jan11/ECON1
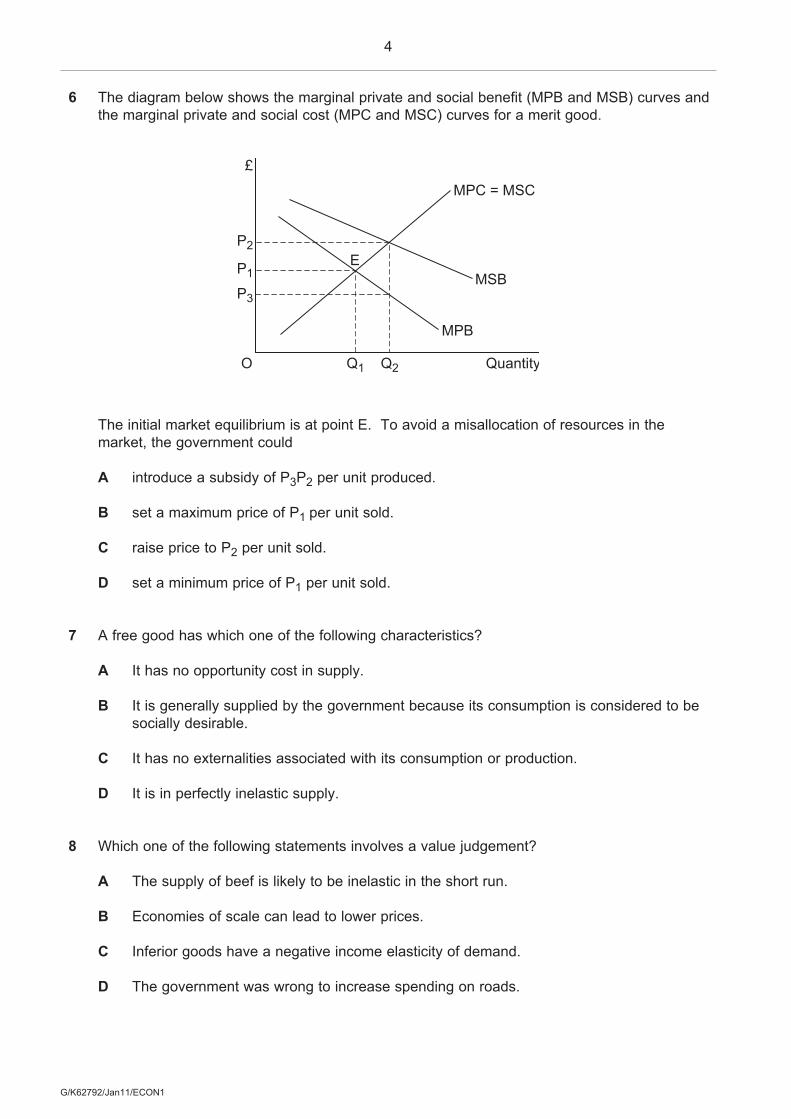
6 The diagram below shows the marginal private and social benefit (MPB and MSB) curves and the marginal private and social cost (MPC and MSC) curves for a merit good.
£
E
O Q1
P1
P2
P3
Q2
MPC = MSC
MSB
MPB
Quantity
The initial market equilibrium is at point E. To avoid a misallocation of resources in the market, the government could
A introduce a subsidy of P3P2 per unit produced.
B set a maximum price of P1 per unit sold.
C raise price to P2 per unit sold.
D set a minimum price of P1 per unit sold.
7 A free good has which one of the following characteristics?
A It has no opportunity cost in supply.
B It is generally supplied by the government because its consumption is considered to be socially desirable.
C It has no externalities associated with its consumption or production.
D It is in perfectly inelastic supply.
8 Which one of the following statements involves a value judgement?
A The supply of beef is likely to be inelastic in the short run.
B Economies of scale can lead to lower prices.
C Inferior goods have a negative income elasticity of demand.
D The government was wrong to increase spending on roads.
5
G/K62792/Jan11/ECON1
Turn over
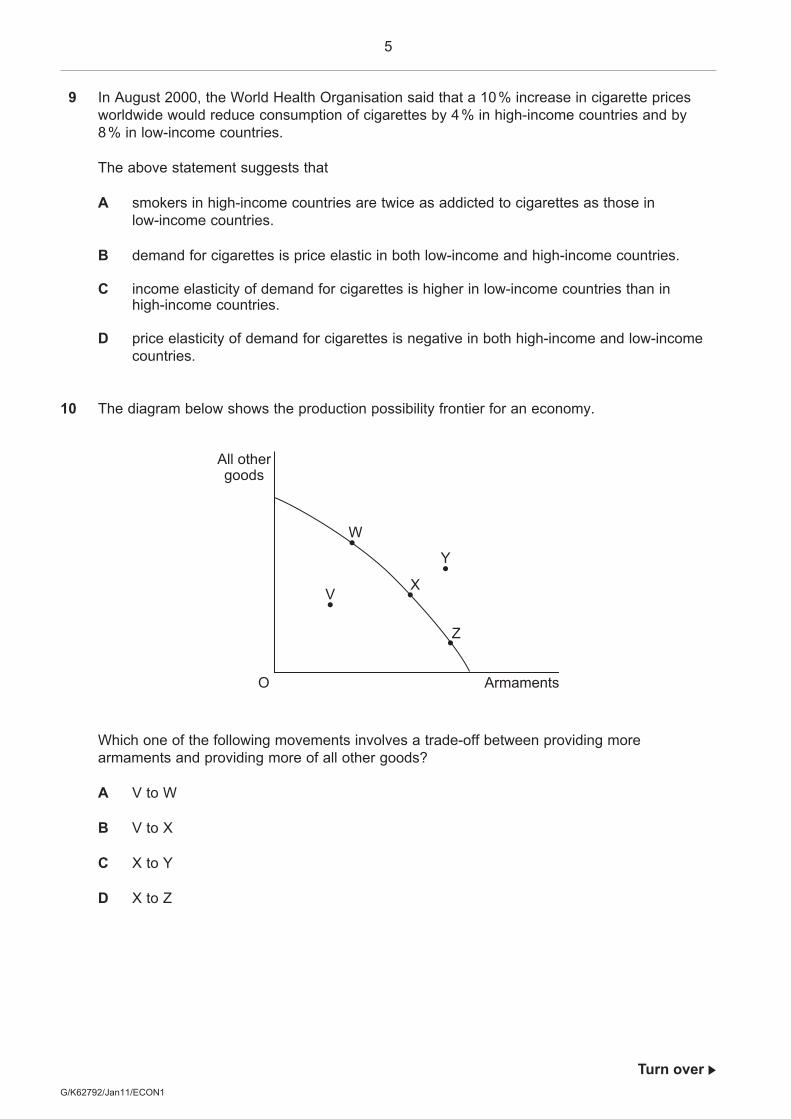
9 In August 2000, the World Health Organisation said that a 10 % increase in cigarette prices worldwide would reduce consumption of cigarettes by 4 % in high-income countries and by 8 % in low-income countries.
The above statement suggests that
A smokers in high-income countries are twice as addicted to cigarettes as those in low-income countries.
B demand for cigarettes is price elastic in both low-income and high-income countries.
C income elasticity of demand for cigarettes is higher in low-income countries than in high-income countries.
D price elasticity of demand for cigarettes is negative in both high-income and low-income countries.
10 The diagram below shows the production possibility frontier for an economy.
All othergoods
O
Y
W
X
Z
V
Armaments
Which one of the following movements involves a trade-off between providing more armaments and providing more of all other goods?
A V to W
B V to X
C X to Y
D X to Z
6
G/K62792/Jan11/ECON1
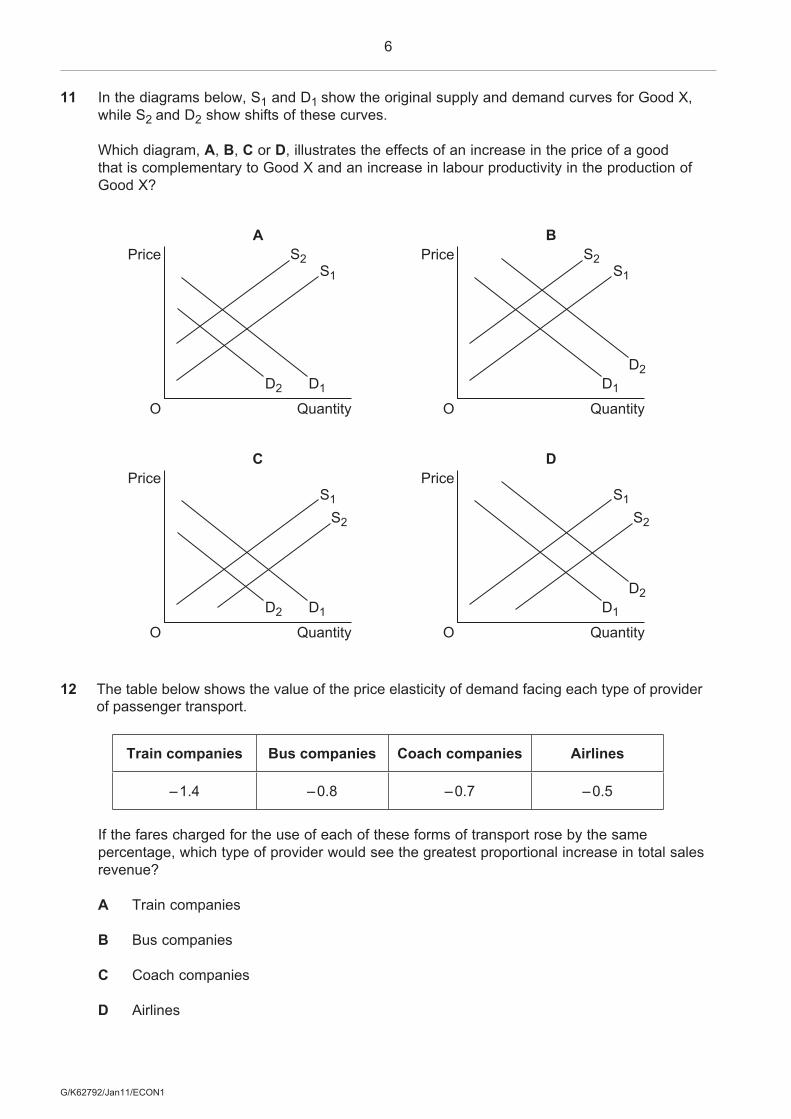
11 In the diagrams below, S1 and D1 show the original supply and demand curves for Good X, while S2 and D2 show shifts of these curves.
Which diagram, A, B, C or D, illustrates the effects of an increase in the price of a good that is complementary to Good X and an increase in labour productivity in the production of Good X?
PriceA
O
D1D2
S1
S2
Quantity
PriceB
O
D1
D2
S1
S2
Quantity
PriceC
O
D1D2
S1S2
Quantity
PriceD
O
D1
D2
S1S2
Quantity
12 The table below shows the value of the price elasticity of demand facing each type of provider of passenger transport.
Train companies Bus companies Coach companies Airlines
– 1.4 – 0.8 – 0.7 – 0.5
If the fares charged for the use of each of these forms of transport rose by the same percentage, which type of provider would see the greatest proportional increase in total sales revenue?
A Train companies
B Bus companies
C Coach companies
D Airlines
7
G/K62792/Jan11/ECON1
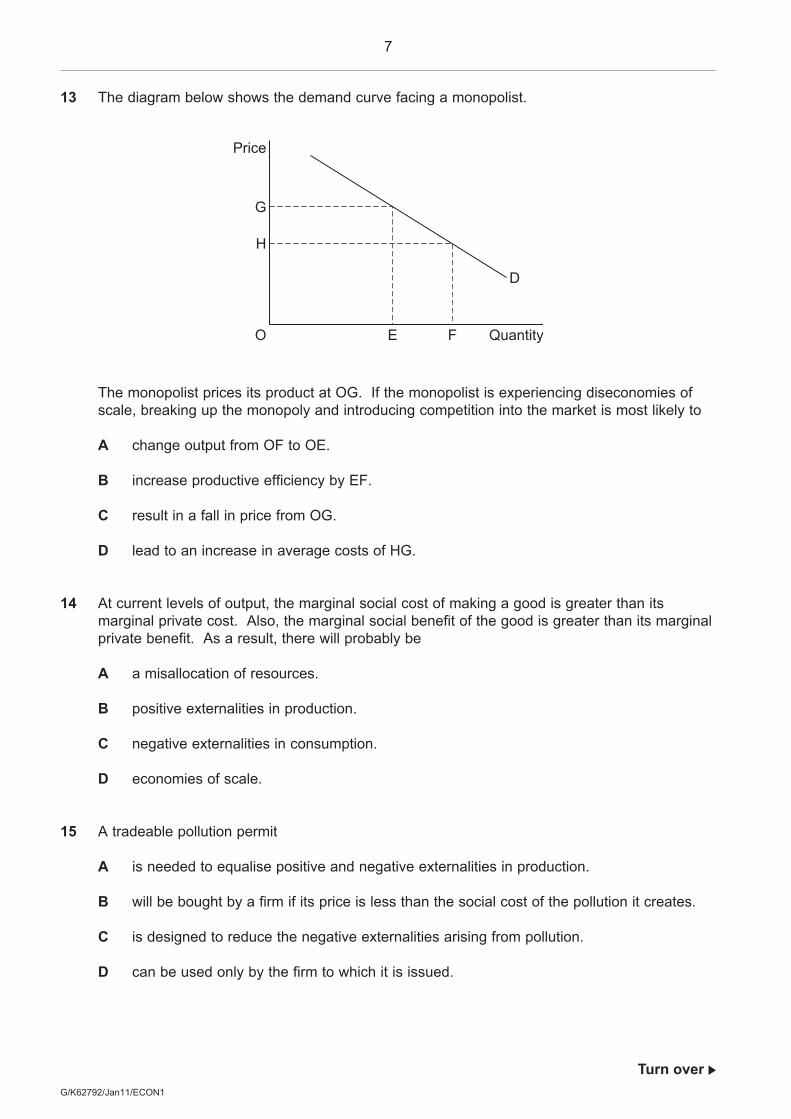
13 The diagram below shows the demand curve facing a monopolist.
Price
O E
H
G
F
D
Quantity
The monopolist prices its product at OG. If the monopolist is experiencing diseconomies of scale, breaking up the monopoly and introducing competition into the market is most likely to
A change output from OF to OE.
B increase productive efficiency by EF.
C result in a fall in price from OG.
D lead to an increase in average costs of HG.
14 At current levels of output, the marginal social cost of making a good is greater than its marginal private cost. Also, the marginal social benefit of the good is greater than its marginal private benefit. As a result, there will probably be
A a misallocation of resources.
B positive externalities in production.
C negative externalities in consumption.
D economies of scale.
15 A tradeable pollution permit
A is needed to equalise positive and negative externalities in production.
B will be bought by a firm if its price is less than the social cost of the pollution it creates.
C is designed to reduce the negative externalities arising from pollution.
D can be used only by the firm to which it is issued.
Turn over
8
G/K62792/Jan11/ECON1
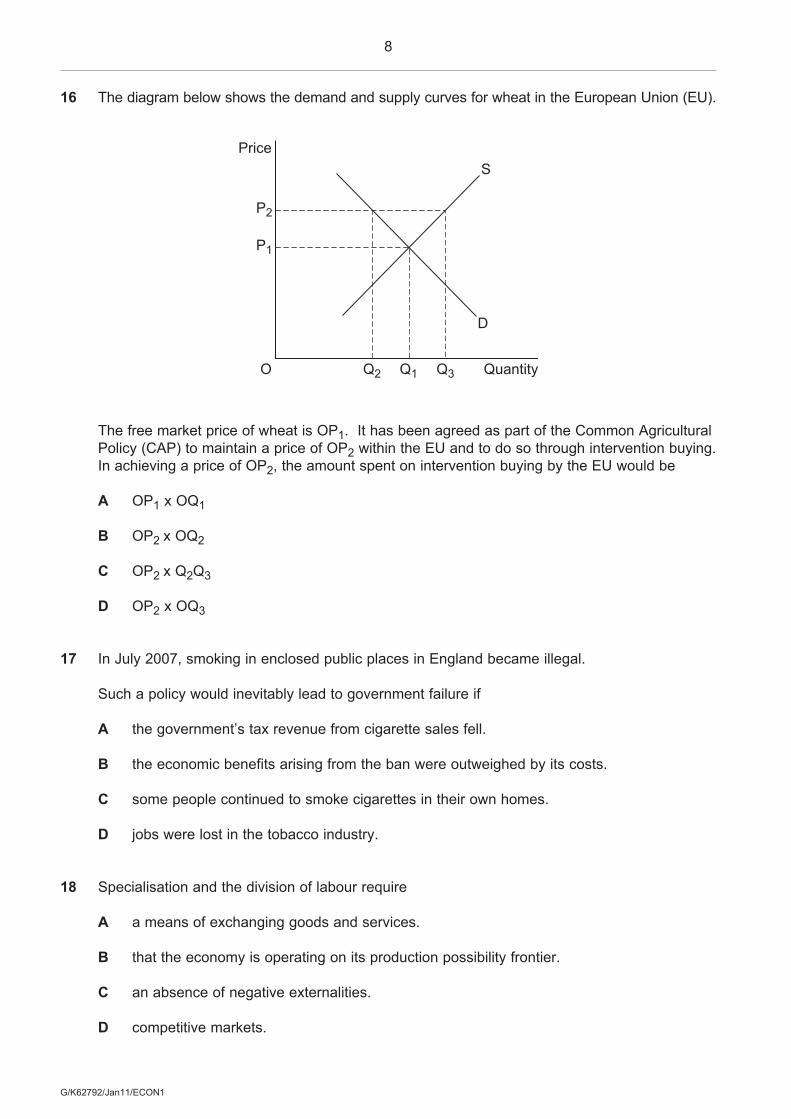
16 The diagram below shows the demand and supply curves for wheat in the European Union (EU).
Price
O Q1
P1
P2
Q2 Q3
S
D
Quantity
The free market price of wheat is OP1. It has been agreed as part of the Common Agricultural Policy (CAP) to maintain a price of OP2 within the EU and to do so through intervention buying. In achieving a price of OP2, the amount spent on intervention buying by the EU would be
A OP1 x OQ1
B OP2 x OQ2
C OP2 x Q2Q3
D OP2 x OQ3
17 In July 2007, smoking in enclosed public places in England became illegal.
Such a policy would inevitably lead to government failure if
A the government’s tax revenue from cigarette sales fell.
B the economic benefits arising from the ban were outweighed by its costs.
C some people continued to smoke cigarettes in their own homes.
D jobs were lost in the tobacco industry.
18 Specialisation and the division of labour require
A a means of exchanging goods and services.
B that the economy is operating on its production possibility frontier.
C an absence of negative externalities.
D competitive markets.
9
G/K62792/Jan11/ECON1
Turn over
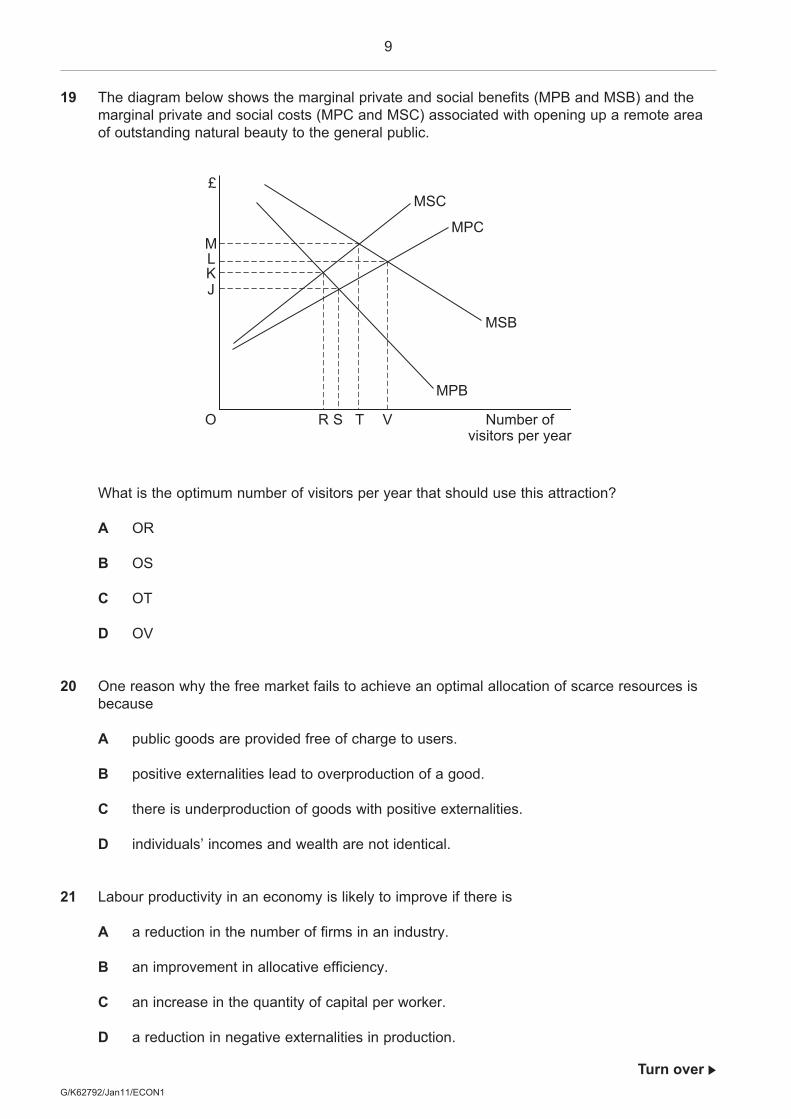
19 The diagram below shows the marginal private and social benefits (MPB and MSB) and the marginal private and social costs (MPC and MSC) associated with opening up a remote area of outstanding natural beauty to the general public.
£
MLKJ
O R S T V
MSC
MPC
MSB
MPB
Number ofvisitors per year
What is the optimum number of visitors per year that should use this attraction?
A OR
B OS
C OT
D OV
20 One reason why the free market fails to achieve an optimal allocation of scarce resources is because
A public goods are provided free of charge to users.
B positive externalities lead to overproduction of a good.
C there is underproduction of goods with positive externalities.
D individuals’ incomes and wealth are not identical.
21 Labour productivity in an economy is likely to improve if there is
A a reduction in the number of firms in an industry.
B an improvement in allocative efficiency.
C an increase in the quantity of capital per worker.
D a reduction in negative externalities in production.
10
G/K62792/Jan11/ECON1
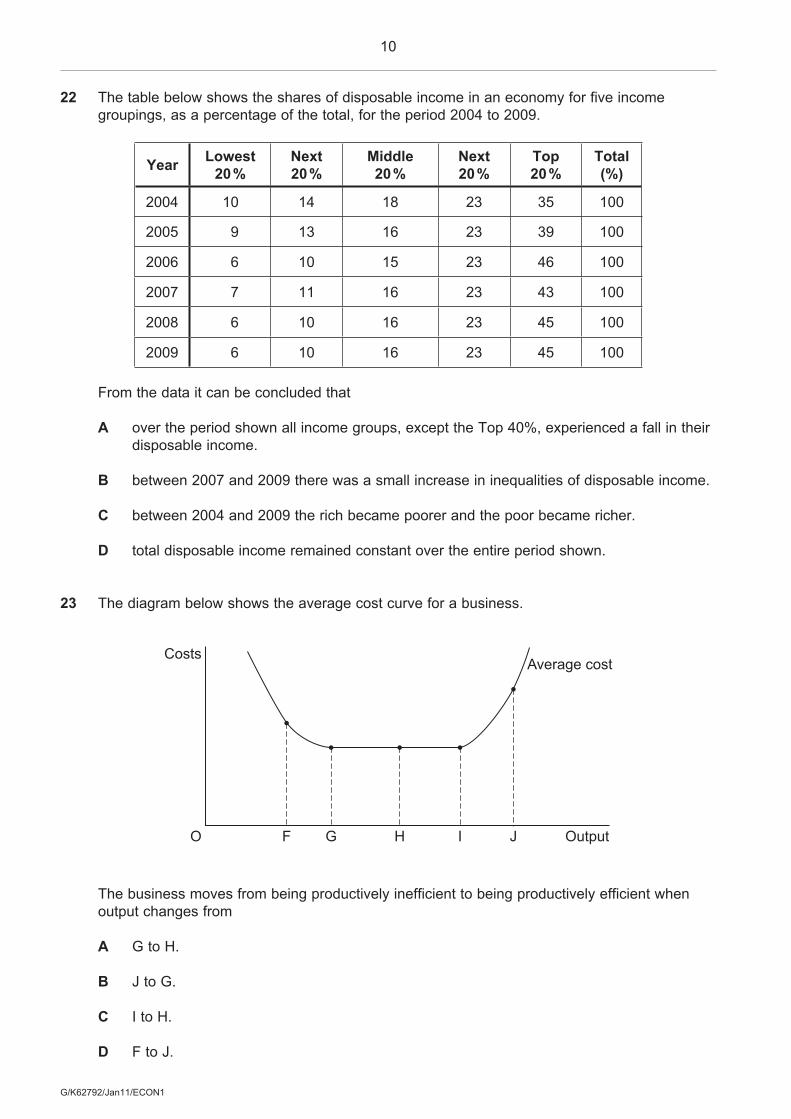
22 The table below shows the shares of disposable income in an economy for five income groupings, as a percentage of the total, for the period 2004 to 2009.
Year Lowest20 %
Next20 %
Middle20 %
Next20 %
Top20 %
Total(%)
2004 10 14 18 23 35 100
2005 9 13 16 23 39 100
2006 6 10 15 23 46 100
2007 7 11 16 23 43 100
2008 6 10 16 23 45 100
2009 6 10 16 23 45 100
From the data it can be concluded that
A over the period shown all income groups, except the Top 40%, experienced a fall in their disposable income.
B between 2007 and 2009 there was a small increase in inequalities of disposable income.
C between 2004 and 2009 the rich became poorer and the poor became richer.
D total disposable income remained constant over the entire period shown.
23 The diagram below shows the average cost curve for a business.
Costs
O F
Average cost
OutputG H I J
The business moves from being productively inefficient to being productively efficient when output changes from
A G to H.
B J to G.
C I to H.
D F to J.
11
G/K62792/Jan11/ECON1
Turn over
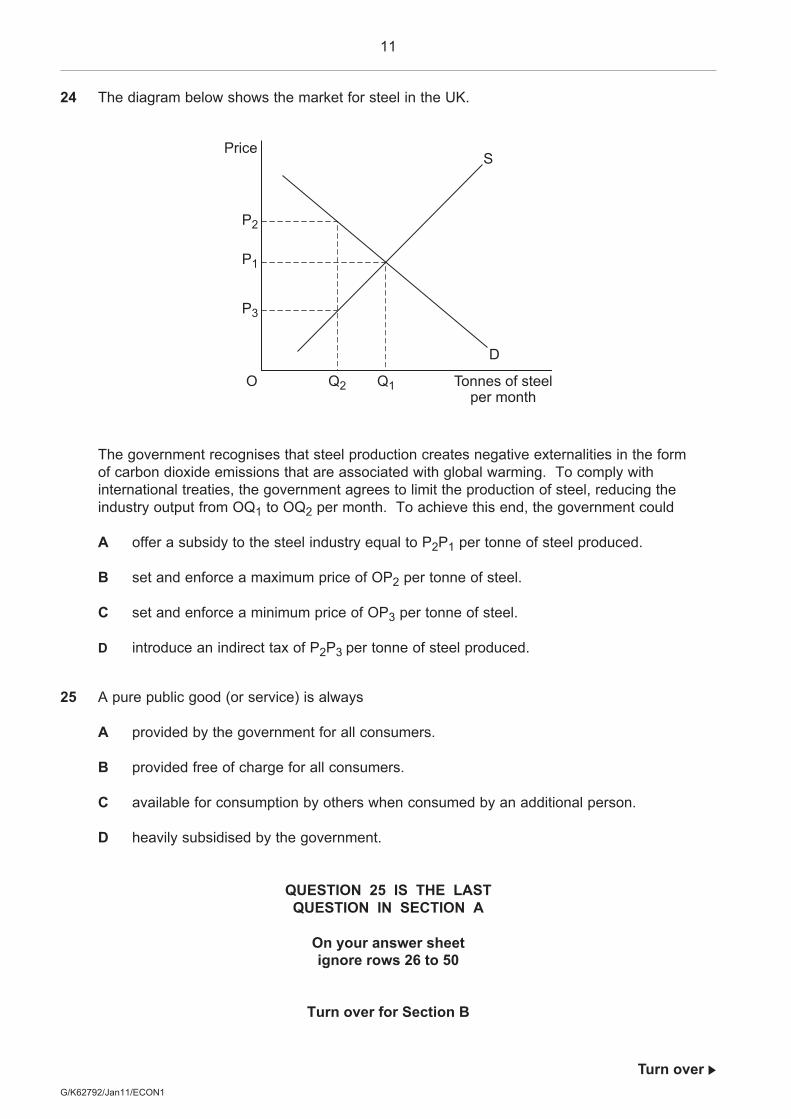
24 The diagram below shows the market for steel in the UK.
Price
O Q1
P1
P3
P2
Q2
S
D
Tonnes of steelper month
The government recognises that steel production creates negative externalities in the form of carbon dioxide emissions that are associated with global warming. To comply with international treaties, the government agrees to limit the production of steel, reducing the industry output from OQ1 to OQ2 per month. To achieve this end, the government could
A offer a subsidy to the steel industry equal to P2P1 per tonne of steel produced.
B set and enforce a maximum price of OP2 per tonne of steel.
C set and enforce a minimum price of OP3 per tonne of steel.
D introduce an indirect tax of P2P3 per tonne of steel produced.
25 A pure public good (or service) is always
A provided by the government for all consumers.
B provided free of charge for all consumers.
C available for consumption by others when consumed by an additional person.
D heavily subsidised by the government.
QUESTION 25 IS THE LASTQUESTION IN SECTION A
On your answer sheetignore rows 26 to 50
Turn over for Section B
12
G/K62792/Jan11/ECON1
Section B: Data Response
Answer EITHER Question 26 OR Question 27.You are advised to spend at least 50 minutes on Section B.
EITHER Total for this question: 50 marks
Question 26
UNSTABLE PRIMARY PRODUCT PRICES
Study Extracts A, B and C, and then answer all parts of Question 26 which follow.
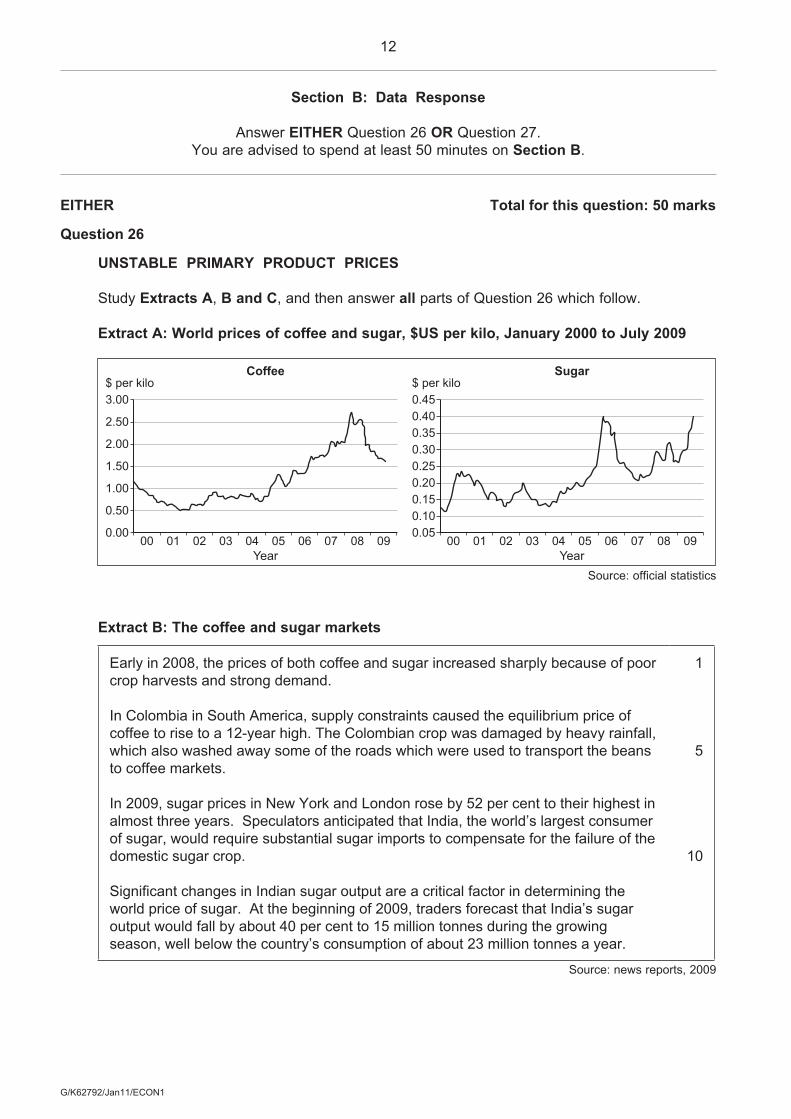
Extract A: World prices of coffee and sugar, $US per kilo, January 2000 to July 2009
3.00$ per kilo
Coffee
00
2.50
2.00
1.50
1.00
0.50
0.0001 02 03 04 05 06 07 08 09
0.45$ per kilo
Sugar
Year Year00
0.400.350.300.250.200.150.100.05
01 02 03 04 05 06 07 08 09
Source: official statistics
Extract B: The coffee and sugar markets
Early in 2008, the prices of both coffee and sugar increased sharply because of poor crop harvests and strong demand.
In Colombia in South America, supply constraints caused the equilibrium price of coffee to rise to a 12-year high. The Colombian crop was damaged by heavy rainfall, which also washed away some of the roads which were used to transport the beans to coffee markets.
In 2009, sugar prices in New York and London rose by 52 per cent to their highest in almost three years. Speculators anticipated that India, the world’s largest consumer of sugar, would require substantial sugar imports to compensate for the failure of the domestic sugar crop.
Significant changes in Indian sugar output are a critical factor in determining the world price of sugar. At the beginning of 2009, traders forecast that India’s sugar output would fall by about 40 per cent to 15 million tonnes during the growing season, well below the country’s consumption of about 23 million tonnes a year.
1
5
10
Source: news reports, 2009
13
G/K62792/Jan11/ECON1
Turn over
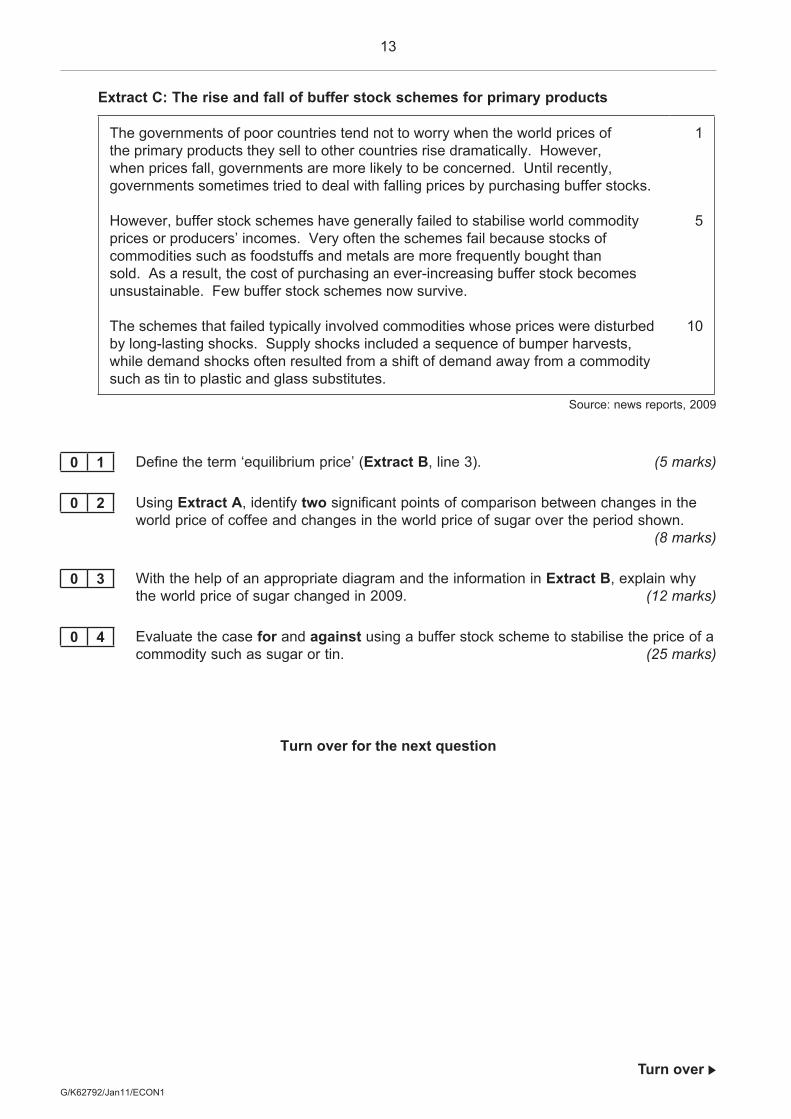
Extract C: The rise and fall of buffer stock schemes for primary products
The governments of poor countries tend not to worry when the world prices of the primary products they sell to other countries rise dramatically. However, when prices fall, governments are more likely to be concerned. Until recently, governments sometimes tried to deal with falling prices by purchasing buffer stocks.
However, buffer stock schemes have generally failed to stabilise world commodity prices or producers’ incomes. Very often the schemes fail because stocks of commodities such as foodstuffs and metals are more frequently bought than sold. As a result, the cost of purchasing an ever-increasing buffer stock becomes unsustainable. Few buffer stock schemes now survive.
The schemes that failed typically involved commodities whose prices were disturbed by long-lasting shocks. Supply shocks included a sequence of bumper harvests, while demand shocks often resulted from a shift of demand away from a commodity such as tin to plastic and glass substitutes.
1
5
10
Source: news reports, 2009
0 1 Define the term ‘equilibrium price’ (Extract B, line 3). (5 marks)
0 2 Using Extract A, identify two significant points of comparison between changes in the world price of coffee and changes in the world price of sugar over the period shown.
(8 marks)
0 3 With the help of an appropriate diagram and the information in Extract B, explain why the world price of sugar changed in 2009. (12 marks)
0 4 Evaluate the case for and against using a buffer stock scheme to stabilise the price of a commodity such as sugar or tin. (25 marks)
Turn over for the next question
14
G/K62792/Jan11/ECON1
Do not answer Question 27 if you have answered Question 26.
OR Total for this question: 50 marks
Question 27
FLOODING AND FLOOD DEFENCES
Study Extracts D, E and F, and then answer all parts of Question 27 which follow.
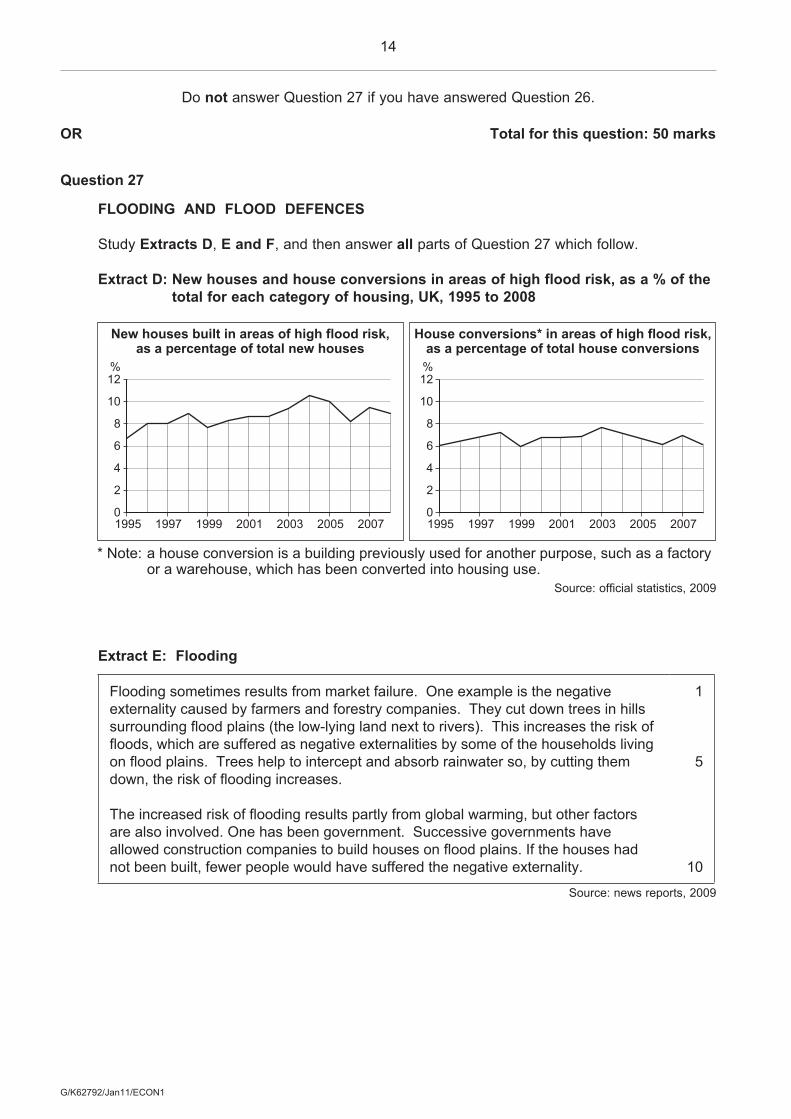
Extract D: New houses and house conversions in areas of high flood risk, as a % of the total for each category of housing, UK, 1995 to 2008
New houses built in areas of high flood risk,as a percentage of total new houses
12%
1995
10
8
6
4
2
01997 1999 2001 2003 2005 2007
House conversions* in areas of high flood risk,as a percentage of total house conversions
* Note: a house conversion is a building previously used for another purpose, such as a factoryor a warehouse, which has been converted into housing use.
12%
1995
10
8
6
4
2
01997 1999 2001 2003 2005 2007
Source: official statistics, 2009
Extract E: Flooding
Flooding sometimes results from market failure. One example is the negative externality caused by farmers and forestry companies. They cut down trees in hills surrounding flood plains (the low-lying land next to rivers). This increases the risk of floods, which are suffered as negative externalities by some of the households living on flood plains. Trees help to intercept and absorb rainwater so, by cutting them down, the risk of flooding increases.
The increased risk of flooding results partly from global warming, but other factors are also involved. One has been government. Successive governments have allowed construction companies to build houses on flood plains. If the houses had not been built, fewer people would have suffered the negative externality.
1
5
10
Source: news reports, 2009
15
G/K62792/Jan11/ECON1
Extract F: Flood defences
A flood defence provides a collective barrier for everyone it protects against the damage that flooding can cause. Some economists say that flood defence is an example of a public good.
However, spending on new flood defences and on maintaining the large number of existing, though inadequate, defences has to be paid for by somebody. So, who should pay?
Should the households who suffer from flooding be the only ones who pay? Should people who never suffer from flooding also have to pay? Should it be the businesses that insure houses that are at risk from flooding who pay? Recent research by the Environment Agency showed that two in five households at risk did not know whether their insurance would cover them in a flood.
Should it be the government, and thus ultimately tax payers, who pay? Should it be farmers and forestry companies? Or should it be house-building companies? The government says that developers building homes should pay part of the money needed for flood defences.
1
5
10
15
Source: news reports, 2009
0 5 Define the term ‘market failure’ (Extract E, line 1) (5 marks)
0 6 Using Extract D, identify two significant points of comparison between the changes in the two types of house building over the period shown. (8 marks)
0 7 With the help of an appropriate diagram and the information in Extract E, explain why the negative externalities caused by the cutting down of trees may lead to market failure.
(12 marks)
0 8 Extract F (lines 4 – 5) suggests that public goods such as flood defences have to be paid for by somebody.
Evaluate the view that the provision and maintenance of flood defences should be paid for solely by the government. (25 marks)
END OF QUESTIONS

16
G/K62792/Jan11/ECON1
Copyright © 2011 AQA and its licensors. All rights reserved.
There are no questions printed on this page