APWG Phishing Activity Trends Report · PDF fileunique phishing reports de-duplicate emails...
9
3 rd Quarter 2016 July – September 2016 Published Dec. 20, 2016 Phishing Activity Trends Report Unifying the Global Response To Cybercrime
Transcript of APWG Phishing Activity Trends Report · PDF fileunique phishing reports de-duplicate emails...

3rd Quarter 2016
July – September 2016
Published Dec. 20, 2016
Phishing Activity Trends Report
Uni fying the
Global Response
To Cybercrime

Phishing Activity Trends Report 3rd Quarter 2016 w w w . a p w g . o r g • i n f o @ a p w g . o r g
2
Phishing Activity Trends Report, 3rd Quarter 2016
!
Table of Contents
Statistical Highlights for 3rd Quarter 2016 3
Phishing E-mail Reports and Phishing Site Trends 4
Brand-Domain Pairs Measurement 5
Brands & Legitimate Entities Hijacked by
E-mail Phishing Attacks 6
Most Targeted Industry Sectors 7
Top Malware Infected Countries 8
APWG Phishing Trends Report Contributors 9
Phishing Report Scope
The APWG Phishing Activity Trends Report analyzes phishing attacks reported to the APWG by its member companies, its Global Research Partners, through the organization’s website at http://www.apwg.org, and by e-mail submissions to [email protected]. APWG also measures the evolution, proliferation, and propagation of crimeware by drawing from the research of our member companies.
Phishing Defined
Phishing is a criminal mechanism employing both social engineering and technical subterfuge to steal consumers’ personal identity data and financial account credentials. Social engineering schemes use spoofed e-mails purporting to be from legitimate businesses and agencies, designed to lead consumers to counterfeit websites that trick recipients into divulging financial data such as usernames and passwords. Technical subterfuge schemes plant crimeware onto PCs to steal credentials directly, often using systems to intercept consumers online account user names and passwords -- and to corrupt local navigational infrastructures to misdirect consumers to counterfeit websites (or authentic websites through phisher-controlled proxies used to monitor and intercept consumers’ keystrokes).
3rd Quarter 2016 Phishing Activity Trends Summary
• The Retail/Service sector continued to be the most-attacked category of victim, suffering 43% of phishing attacks in Q3. [p. 7]
• The number of brands targeted by phishers also fell, and was down 17% from Q2 to Q3. [p. 6]
• An average of 200,000 new malware samples were discovered per day in Q3. [p. 8]
• The country with the worst malware infection rate was China, where 47.23% of machines were infected, followed by Taiwan (43.38%) and Turkey (39.01%). Scandinavian countries had the lowest infection rates [p. 8]
• The number of URLs per brand dipped 25% from Q2 to Q3, indicating that phishers were, on average and overall, creating fewer phishing URLs. [p. 5]
In Q3, the total number of phishing sites detected fell 25 percent from record high numbers detected in Q2. [pg. 4]
Record Wave of Phishing Comes to an Ebb in Autumn 2016

Phishing Activity Trends Report 3rd Quarter 2016 w w w . a p w g . o r g • i n f o @ a p w g . o r g
3
Phishing Activity Trends Report, 3rd Quarter 2016
!
The APWG continues to refine its tracking and reporting methodology and to incorporate new data sources into our reports. APWG tracks and reports the number of unique phishing reports (email campaigns) it receives, in addition to the number of unique phishing sites found. An e-mail campaign is a unique e-mail sent out to multiple users, directing them to a specific phishing web site (multiple campaigns may point to the same web site). Counts for unique phishing reports de-duplicate emails found in a given month that have the same subject line in the e-mail. The APWG also tracks the number of unique phishing websites. This is now determined by the unique base URLs of the phishing sites. (A single phishing site may be advertised as thousands of customized URLS, all leading to basically the same attack destination.) APWG additionally tracks crimeware instances (unique software applications as determined by MD5 hash of the crimeware sample), as well as unique sites that are distributing crimeware (typically via browser drive-by exploits). The APWG Phishing Activity Trends Report also includes statistics on rogue anti-virus software, desktop infection rates, and related topics.
July August September
Number of unique phishing websites detected 155,102 104,349 104,973
Number of unique phishing e-mail reports (campaigns) received by APWG from consumers
93,160 66,166 69,925
Number of brands targeted by phishing campaigns 358 340 361
Methodology and Instrumented Data Sets
Statistical Highlights for 3rd Quarter 2016

Phishing Activity Trends Report 3rd Quarter 2016 w w w . a p w g . o r g • i n f o @ a p w g . o r g
4
Phishing Activity Trends Report, 3rd Quarter 2016
!
The total number of phishing websites (attacks) detected in Q3 was 364,424, compared with 466,065 in Q2. This was a decline of 25 percent. Q2 represented an all-time-high number of phishing attacks, and so the recent decline represents a return to more historical norms. The number of attacks detected per month fell from a high of 153,998 in April to 104,349 in August.
According to Stefanie Ellis, AntiFraud Product Marketing Manager at MarkMonitor, “In August and September MarkMonitor detected a significant dip in phishing URLs following record highs in April through July. Volume in Q3 was comparable with volumes detected over the same period last year.”
The number of unique phishing reports submitted to APWG during Q3 was 229,251, compared to 315,524 in Q2. The number of reports declined as the number of confirmed attacks declined above.
Phishing E-mail Reports and Phishing Site Trends – 3rd Quarter 2016

Phishing Activity Trends Report 3rd Quarter 2016 w w w . a p w g . o r g • i n f o @ a p w g . o r g
5
Phishing Activity Trends Report, 3rd Quarter 2016
!
The following chart combines statistics based on brands phished, unique domains, unique domain/brand pairs, and unique URLs. Brand/domain pairs count the unique instances of a domain being used to target a specific brand. (Example: if several URLs are targeting a brand – but are hosted on the same domain – this brand/domain pair would be counted as one instead of several.) Forensic utility of this metric: If the number of unique URLs is greater than the number of brand/domain pairs, it indicates many URLs are being hosted on the same domain to target the same brand. Knowing how many URLs occur with each domain indicates the approximate number of attacking domains a brand-holding victim needs to locate and neutralize. Since phishing-prevention technologies (like browser and e-mail blocking) require the full URL in order to prevent over-blocking, it is useful to understand the general number of unique URLs that occur per domain. The number of URLs per brand dipped 25 percent from Q2 to Q3, indicating that phishers were, on average and overall, creating fewer phishing URLs:
July August September
Number of Unique Phishing Web Sites Detected 155,102 104,349 104,973
Unique Domains 30,042 26,308 25,868
Unique Brand-Domain Pairs 35,066 29,790 29,391
Unique Brands 358 340 361
URLs Per Brand 433 306 290
Brand-Domain Pairs Measurement – 3rd Quarter 2016
Phishing Activity Trends Report 3rd Quarter 2016 w w w . a p w g . o r g • i n f o @ a p w g . o r g
6
Phishing Activity Trends Report, 3rd Quarter 2016
!
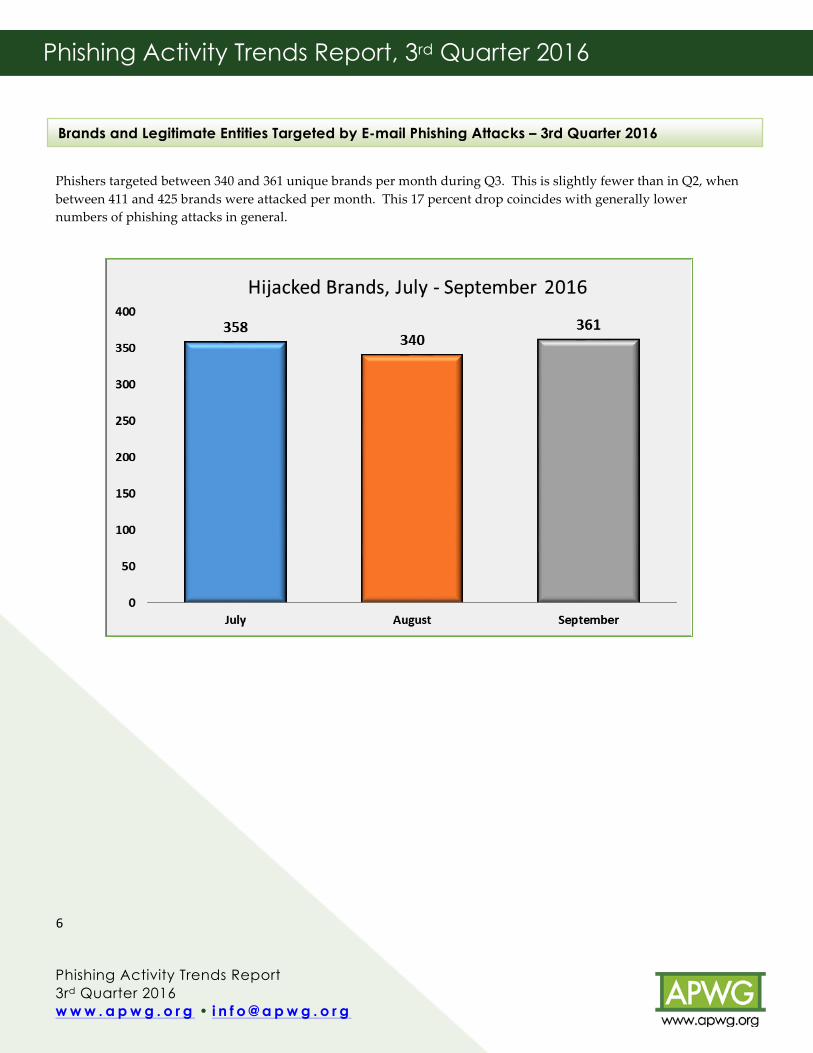
Phishers targeted between 340 and 361 unique brands per month during Q3. This is slightly fewer than in Q2, when between 411 and 425 brands were attacked per month. This 17 percent drop coincides with generally lower numbers of phishing attacks in general.
Brands and Legitimate Entities Targeted by E-mail Phishing Attacks – 3rd Quarter 2016

Phishing Activity Trends Report 3rd Quarter 2016 w w w . a p w g . o r g • i n f o @ a p w g . o r g
7
Phishing Activity Trends Report, 3rd Quarter 2016
!
The Retail/Service sector continued to be the most-attacked, suffering 43 percent of all phishing attacks in Q3 just as in Q2. The Retail/Service sector includes music and e-commerce sites. Attacks against the Financial sector (composed mainly of banks) increased from 16 percent in Q2 to 21 perecnt in Q3.
Most-Targeted Industry Sectors – 3rd Quarter 2016

Phishing Activity Trends Report 3rd Quarter 2016 w w w . a p w g . o r g • i n f o @ a p w g . o r g
8
Phishing Activity Trends Report, 3rd Quarter 2016
!
The APWG’s crimeware statistics categorize crimeware attacks as follows, though the taxonomy will grow as variations in attack code are spawned. Definition: Crimeware is code designed with the intent of collecting information on the end-user in order to steal the user’s credentials. Unlike most generic keyloggers, phishing-based keyloggers have tracking components, which attempt to monitor specific actions (and specific organizations, such as financial institutions, retailers, and e-commerce merchants) in order to target specific information. The most common types of information are access to financial-based websites, e-commerce sites, and web-based mail sites. APWG member PandaLabs found an average of 200,000 new malware samples per day in Q3, slightly less than in Q2. This is the first slow-down in recent history, and we will see if the number of malware variants may have plateaued. The following data show the proportion of new malware variants by type: According to Luis Corrons, PandaLabs Technical Director and Trends Report contributing analyst, the world's most- infected country was China, where 47.23% of machines were infected, followed by Taiwan (43.38%) and Turkey (39.01%). As is usually the case, Scandinavian countries had the lowest infection rates. Norway has the lowest national infection rate at 19.73%, followed by Finland with 19.81% and Sweden with 20.33%.
Crimeware Taxonomy and Samples According to Classification
Malware Infected Countries – 3rd Quarter 2016
New Malware Strains in Q3 % of malware samples
Trojans 69.89%
Virus 12.46%
Worms 10.04%
Adware / Spyware 1.98%
PUPs 5.54%
Ranking Country Infection ratio 45 Belgium 24.09% 44 United Kingdom 23.39% 43 Germany 23.23% 42 Switcherland 22.31% 41 Netherlands 21.82% 40 Denmark 21.38% 39 Japan 20.84% 38 Sweden 20.33% 37 Finland 19.81% 36 Norway 19.73%
Ranking Country Infection Rate 1 China 47.23% 2 Taiwan 43.38% 3 Turkey 39.01% 4 Russia 37.86% 5 Ecuador 37.21% 6 Guatemala 36.55% 7 Peru 36.01% 8 Mexico 35.79% 9 Brazil 33.88%
10 Venezuela 32.31%
Malware Infections by Type % of malware samples
Trojans 71.48%
Virus 1.19%
Worms 2.91%
Adware / Spyware 0.97%
PUPs 23.45%

Phishing Activity Trends Report 3rd Quarter 2016 w w w . a p w g . o r g • i n f o @ a p w g . o r g
9
Phishing Activity Trends Report, 3rd Quarter 2016
!
APWG Phishing Activity Trends Report Contributors
An infoblox company, IID is a US-based provider of technology and services that help organizations secure their Internet presence.
Panda Security’s mission is to keep our customers' information and IT assets safe from security threats, providing the most effective protection with minimum resource consumption.
MarkMonitor, a global leader in enterprise brand protection, offers comprehensive solutions and services that safeguard brands, reputation and revenue from online risks.
iThreat provides risk data, intelligence tools, and analysis to help its clients protect their intellectual & Internet properties.
About the APWG
Founded in 2003, the Anti-Phishing Working Group (APWG) is a not-for-profit industry association focused on eliminating the identity theft and frauds that result from the growing problem of phishing, crimeware, and e-mail spoofing. Membership is open to qualified financial institutions, retailers, ISPs, solutions providers, the law enforcement community, government agencies, multi-lateral treaty organizations, and NGOs. There are more than 2,000 enterprises worldwide participating in the APWG.
Websites of APWG public-service enterprises include its public website, <http://www.antiphishing.org>; the Website of public awareness program, STOP. THINK. CONNECT. Messaging Convention <http://www.stopthinkconnect.org> and the APWG’s research website <http://www.ecrimeresearch.org>. These serve as resources about the problem of phishing and electronic frauds perpetrated against personal computers and their users – and resources for countering these threats. The APWG, a 501(c)6 tax-exempted corporation, was founded by Tumbleweed Communications, financial services institutions and e-commerce providers. APWG’s first meeting was in November 2003 in San Francisco and was incorporated in 2004 as an independent corporation controlled by its board of directors, its executives and its steering committee.
The APWG Phishing Activity Trends Report is published by the APWG. For further information about the APWG, please contact APWG Deputy Secretary General Foy Shiver at 404.434.7282 or [email protected]. For media inquiries related to the content of this report, please contact APWG Secretary General Peter Cassidy at 617.669.1123; Stefanie Ellis or [email protected]; Luis Corrons of Panda at [email protected]. PWG thanks its contributing members, above, for the data and analyses in this report0.
Analysis by Greg Aaron, iThreat Cyber Group; editing by Ronnie Manning, Mynt Public Relations.