April 30, 2021
40
April 30, 2021
Transcript of April 30, 2021

April 30, 2021

COVID-19 Cases in Windsor-Essex and Ontario
2021-04-30

Number of Cases in Ontario (Daily New casesand 7-day average)
2021-04-30
0
1000
2000
3000
4000
5000
6000
Thu
Jan
30 2
020
Thu
Feb
20 2
020
Tue
Mar
10
2020
Wed
Mar
25
2020
Thu
Apr 0
9 20
20Fr
i Apr
24
2020
Sat M
ay 0
9 20
20Su
n M
ay 2
4 20
20M
on Ju
n 08
202
0Tu
e Ju
n 23
202
0W
ed Ju
l 08
2020
Thu
Jul 2
3 20
20Fr
i Aug
07
2020
Sat A
ug 2
2 20
20Su
n Se
p 06
202
0M
on S
ep 2
1 20
20Tu
e O
ct 0
6 20
20W
ed O
ct 2
1 20
20Th
u N
ov 0
5 20
20Fr
i Nov
20
2020
Sat D
ec 0
5 20
20Su
n De
c 20
202
0M
on Ja
n 04
202
1Tu
e Ja
n 19
202
1W
ed F
eb 0
3 20
21Th
u Fe
b 18
202
1Fr
i Mar
05
2021
Sat M
ar 2
0 20
21Su
n Ap
r 04
2021
Mon
Apr
19
2021
# of
CO
VID-
19 ca
ses
New cases 7-day average

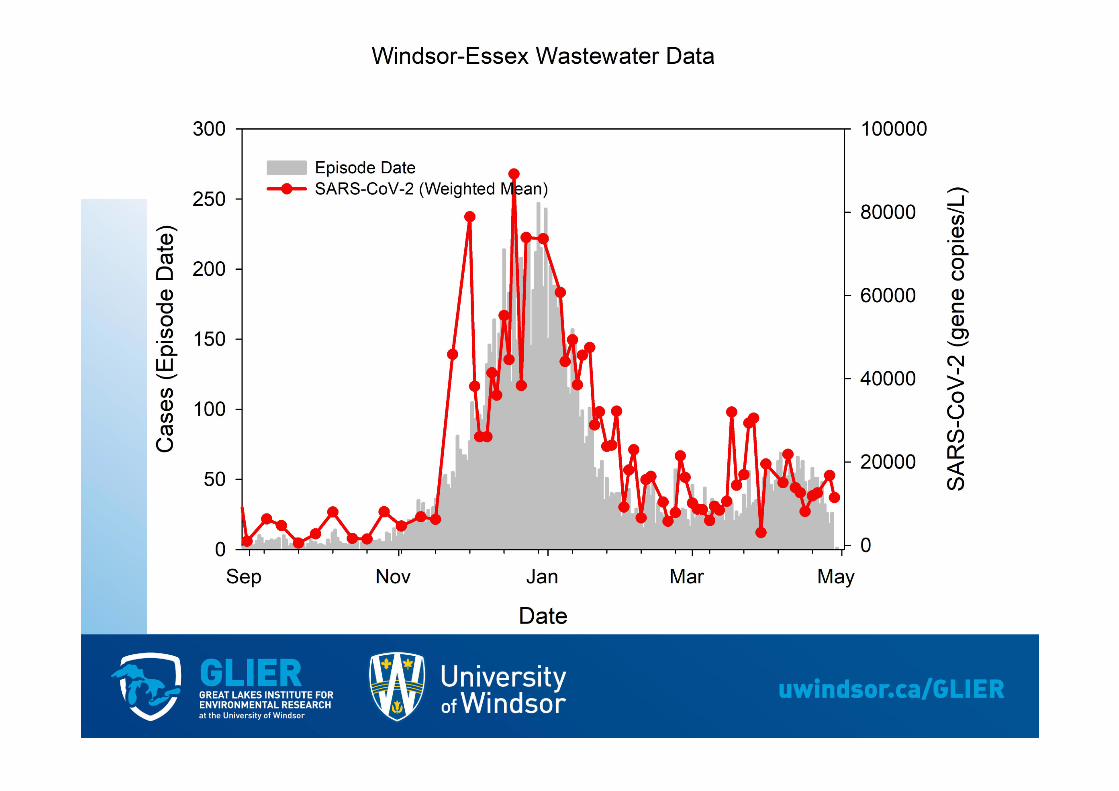
Epidemic Curve by Reported Date in Windsor-Essex
2021-04-30
0
50
100
150
200
250
300
350#o
f con
firm
ed C
OVI
D-19
case
s
Date Reported
Case Count 7-day MA

0
50
100
150
200
250
0
500
1000
1500
2000
2500
3000
3500
4000
4500
5000
Fri M
ar 2
7 20
20Su
n Ap
r 12
2020
Tue
Apr 2
8 20
20Th
u M
ay 1
4 20
20Sa
t May
30
2020
Mon
Jun
15 2
020
Wed
Jul 0
1 20
20Fr
i Jul
17
2020
Sun
Aug
02 2
020
Tue
Aug
18 2
020
Thu
Sep
03 2
020
Sat S
ep 1
9 20
20M
on O
ct 0
5 20
20W
ed O
ct 2
1 20
20Fr
i Nov
06
2020
Sun
Nov
22
2020
Tue
Dec
08 2
020
Thu
Dec 2
4 20
20Sa
t Jan
09
2021
Mon
Jan
25 2
021
Wed
Feb
10
2021
Fri F
eb 2
6 20
21Su
n M
ar 1
4 20
21Tu
e M
ar 3
0 20
21Th
u Ap
r 15
2021
# of
CO
VID-
19 ca
ses d
aily
: 7-d
ay a
vera
ge (W
inds
or-
Esse
x)
# of
CO
VID-
19 ca
ses d
aily
: 7-d
ay a
vera
ge (O
ntar
io)
Ontario Windsor-Essex
7-Day Average Comparison: Windsor-Essex vs.Ontario
2021-04-30

Windsor-Essex Rate by Reported Week
2021-04-30
0
200
400
600
800
1000
1200
1400
1600
0.0
50.0
100.0
150.0
200.0
250.0
300.0
350.0
400.0
18 20 22 24 26 28 30 32 34 36 38 40 42 44 46 48 50 52 1 3 5 7 9 11 13 15
# of
CO
VID-
19 ca
ses
Rate
per
100
,000
pop
ulat
ion
Reported Week

Percent Positivity by Week by All Tests
2021-04-30
0
2,000
4,000
6,000
8,000
10,000
12,000
14,000
0.0%
5.0%
10.0%
15.0%
20.0%
25.0%
Wee
k01-
08 F
eb29
Wee
k11
Mar
21W
eek1
4 Ap
r11
Wee
k17
May
02W
eek2
0 M
ay23
Wee
k23
Jun1
3W
eek2
6 Ju
l04
Wee
k29
Jul2
5W
eek3
2 Au
g15
Wee
k 35
Sep
05W
eek
38 S
ep26
Wee
k 41
Oct
17W
eek
44 N
ov7
Wee
k 47
Nov
28W
eek
50 D
ec19
Wee
k 1
Jan9
Wee
k 4
Jan3
0W
eek
7 Fe
b20
Wee
k 10
Mar
13
Wee
k 13
Apr
3W
eek
16 A
pr24 #
of p
eopl
e te
sted
/# o
f tes
ts c
ompl
eted
% p
ositi
vity
Week
Weekly test completed % positivity (all WEC tests)

% Positivity in Ontario: 7-Day Average
2021-04-30
0.0%
2.0%
4.0%
6.0%
8.0%
10.0%
12.0%
14.0%
16.0%
18.0%
Peel
Toro
nto
York
Nia
gara
Dur
ham
Halto
nHa
milt
onO
ttaw
aW
ater
loo
WD
GW
inds
or-E
ssex
Mid
dles
ex-L
ondo
nBr
ant C
ount
yHa
ldim
and-
Nor
folk
Sim
coe-
Mus
koka
Porc
upin
eTi
mis
kam
ing
East
ern
Ont
ario
Nor
thw
este
rnG
rey
Bruc
eH
KPR
Sout
hwes
tern
Chat
ham
-Ken
tPe
terb
orou
ghSu
dbur
yLG
LDTh
unde
r Bay
Lam
bton
Cou
nty
HPE
CN
orth
Bay
Par
ry S
ound
Renf
rew
Cou
nty
KFL&
AHu
ron
Pert
hAl
gom
a
% p
ositi
vity
: 7-d
ay a
vera
ge

Percent Positivity by Age Group
2021-04-30
0
0.05
0.1
0.15
0.2
0.25
0.3
0.35%
pos
iviti
y -7
-day
ave
rage
Date
0 to 17 18 to 34 35 to 64 65+

Percent Positivity by School Aged
2021-04-30
0.0%
5.0%
10.0%
15.0%
20.0%
25.0%
30.0%
35.0%
40.0%
45.0%%
pos
itivi
ty -
7-da
y
Date
4 to 8 9 to 13 14 to 17

School Aged Epidemic Curve in Windsor-Essex
2021-04-30
0
5
10
15
20
25
30
# of
CO
VID-
19 ca
ses
Reported Date
# School-Aged Cases School-aged 7-day average

7-Day Average Comparison: School Aged vs.Overall
2021-04-30
0
2
4
6
8
10
12
14
16
18
0
50
100
150
200
250
# of
SCH
OO
L-AG
ED c
ases
: 7-d
ay a
vera
ge
# of
OVE
RVAL
L cas
es: 7
-day
ave
rage
Reported Date
Overall 7-day average School-aged 7-day average
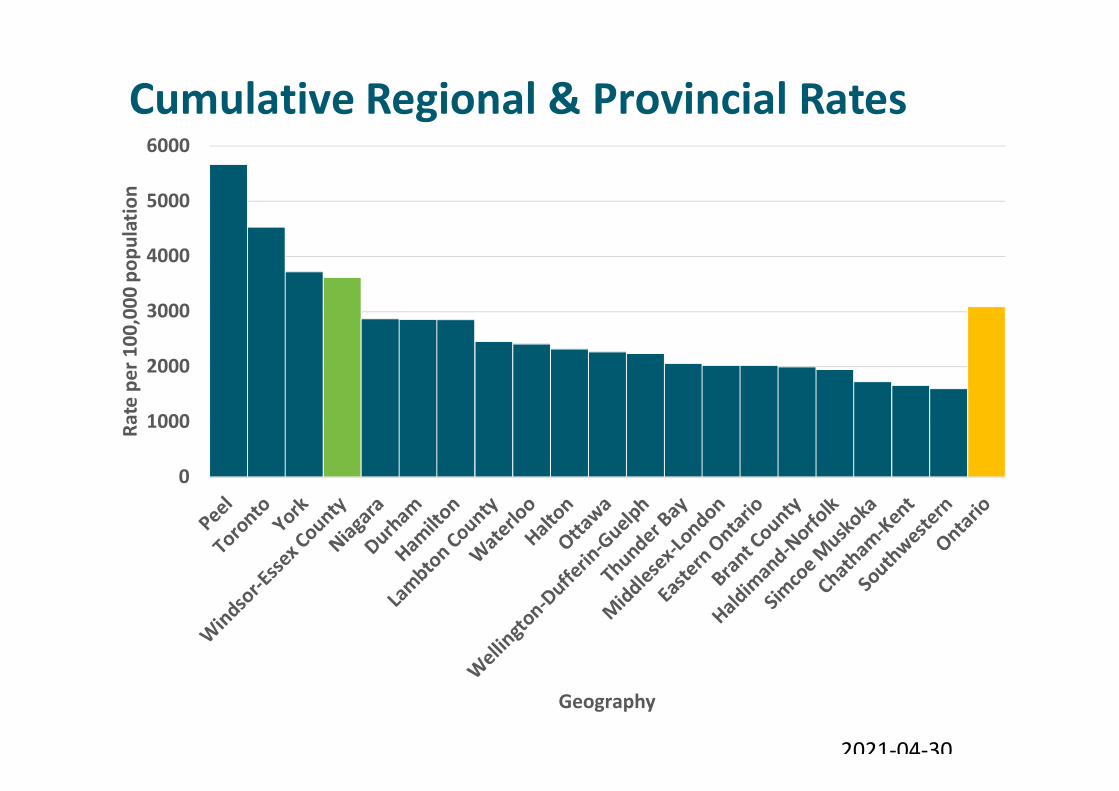
Cumulative Regional & Provincial Rates
2021-04-30
0
1000
2000
3000
4000
5000
6000Ra
te p
er 1
00,0
00 p
opul
atio
n
Geography

Rate per 100,000 by Municipality (Apr to Present)
2021-04-30
159
257
200
336
232210
349
421
0
50
100
150
200
250
300
350
400
450
Rate
per
100
,000
pop
ulat
ion
Municipality

Distribution of COVID-19 Cases by Municipalityin last 30 days (March 30 to April 28)
2021-04-30
Amherstburg3%
Essex4% Kingsville
3%
Lakeshore9%
LaSalle5%
Leamington4%
Tecumseh5%
Windsor67%

Distribution of COVID-19 Cases by Municipalityin last 7 days (April 22 to April 28)
2021-04-30
Amherstburg1%
Essex3% Kingsville
2%
Lakeshore9%
LaSalle3%
Leamington3%
Tecumseh9%
Windsor70%

Age & Sex Distribution
2021-04-30
23%27%
13% 14%11%
8%
3% 1%
48%
41%
12%
22%
16% 14%14%
9%
6% 7%
52%
46%
0%
10%
20%
30%
40%
50%
60%
0 to 19years
20 to 29years
30 to 39years
40 to 49years
50 to 59years
60 to 69years
70 to 79years
80+years
Male Female
% o
f CO
VID-
19 ca
ses
Last Two Weeks Overall

Exposure History by Reported Date (Apr to Present)
2021-04-30
-5
5
15
25
35
45
55
65
75
85
# of
cas
es b
y ex
posu
re ty
pe
Reported Date
Under Investigation Close Contact Household Contact Outbreak Travel Community

Source of Acquisition (April to Present)
2021-04-30
33.2%
30.6%
20.8%
2.7%1.1%
11.6%
0.0%
5.0%
10.0%
15.0%
20.0%
25.0%
30.0%
35.0%
HouseholdContact
Community Close Contact Outbreak Travel UnderInvestigation
% o
f cas
es
Exposure Type

Variants of Concern – Epidemic Curve
2021-04-30
0
5
10
15
20
25
30
35
40
45
50
55
01-J
an-2
1
08-J
an-2
1
15-J
an-2
1
22-J
an-2
1
29-J
an-2
1
05-F
eb-2
1
12-F
eb-2
1
19-F
eb-2
1
26-F
eb-2
1
05-M
ar-2
1
12-M
ar-2
1
19-M
ar-2
1
26-M
ar-2
1
02-A
pr-2
1
09-A
pr-2
1
16-A
pr-2
1
23-A
pr-2
1
# of
var
iant
s of c
once
rn ca
ses i
dent
ified

Percentage of Daily VOC Cases (March-Present)
2021-04-30
0.0%
10.0%
20.0%
30.0%
40.0%
50.0%
60.0%
70.0%
80.0%
90.0%
100.0%%
of d
aily
cas
es th
at a
re V
OCs

Variants of Concern – Source of Acquisition
2021-04-30
38.8%
32.0%
21.8%
1.7% 1.4% 4.3%
40.1%
30.6%
21.5%
0.7% 1.3%
5.9%
0.0%
5.0%
10.0%
15.0%
20.0%
25.0%
30.0%
35.0%
40.0%
45.0%%
of V
OC
case
s
Overall April 12-25

COVID-19 Hospitalizations
2021-04-30
0
20
40
60
80
100
120
0
500
1,000
1,500
2,000
2,500
3,000
# of
CO
VID-
19 ca
ses h
ospi
taliz
ed in
Win
dsor
-Ess
ex
# of
CO
VID-
19 ca
ses h
ospi
taliz
ed in
Ont
ario
Ontario Windsor-Essex
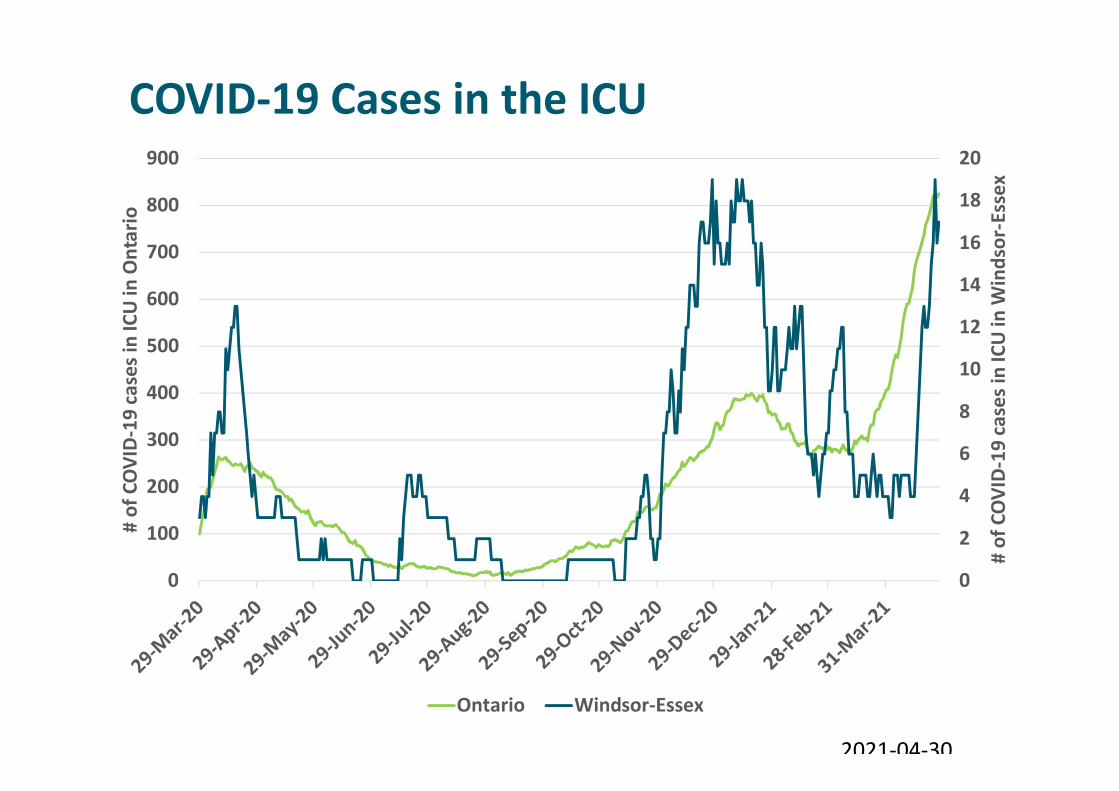
COVID-19 Cases in the ICU
2021-04-30
0
2
4
6
8
10
12
14
16
18
20
0
100
200
300
400
500
600
700
800
900
# of
CO
VID-
19 ca
ses i
n IC
U in
Win
dsor
-Ess
ex
# of
CO
VID-
19 ca
ses i
n IC
U in
Ont
ario
Ontario Windsor-Essex

Age & Sex Breakdown of COVID-19 Deaths
2021-04-30
0% 0% 0% 1% 2%
10%
24%
62%
48%52%
0%
10%
20%
30%
40%
50%
60%
70%
0 to 19years
20 to 29years
30 to 39years
40 to 49years
50 to 59years
60 to 69years
70 to 79years
80+years
Male Female
% o
f con
firm
ed C
OVI
D-19
dea
ths
Age Group & Sex

Case Fatality Rate
2021-04-30
1.3%
12.6%
2.7%1.7%
17.8%
0.0%
2.0%
4.0%
6.0%
8.0%
10.0%
12.0%
14.0%
16.0%
18.0%
20.0%
Community LTCH/RH Overall WEC Ontario Ontario LTCH
Case
fata
lity
(%)
Setting

Doubling Time (Day over Day Comparison)
2021-04-30
1
20
400
Doub
ling
Tim
e (lo
g10)
Reported Date
ONT Doubling TimeWECHU Doubling TimeCanada Doubling Time

Median R0 (Effective)
2021-04-30
0
0.5
1
1.5
2
2.5
3M
ean
R0
Date of Symptom Onset

Local COVID-19 Vaccine Status
2021-04-30
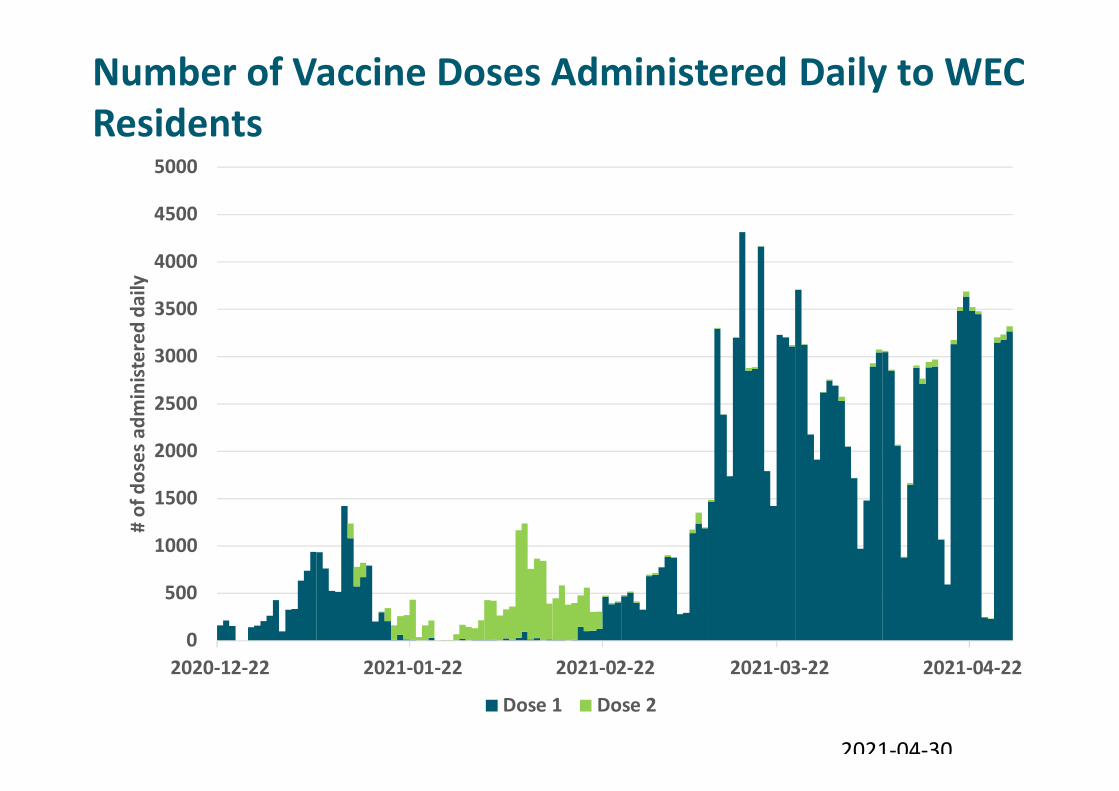
Number of Vaccine Doses Administered Daily to WECResidents
2021-04-30
0
500
1000
1500
2000
2500
3000
3500
4000
4500
5000
2020-12-22 2021-01-22 2021-02-22 2021-03-22 2021-04-22
# of
dos
es a
dmin
ister
ed d
aily
Dose 1 Dose 2

Cumulative Doses Administered to WEC Residents
2021-04-30
0
20000
40000
60000
80000
100000
120000
140000
160000
2020-12-22 2021-01-22 2021-02-22 2021-03-22
# of
dos
es a
dmin
ister
ed to
WEC
resi
dent
s
Dose 1 Dose 2

WEC Residents Vaccinated With At Least OneDose by Age Group
2021-04-30
9.6%13.1%
16.5%19.2%25.2% 26.4%
35.5%
45.8%
75.0%79.1%81.9%
89.3%92.4%
82.4%
33.8%
0.0%
10.0%
20.0%
30.0%
40.0%
50.0%
60.0%
70.0%
80.0%
90.0%
100.0%
% o
f age
gro
up v
acci
nate
d w
ith a
t lea
st 1
dos
e

Coverage in Hotspots within Windsor-Essex CountyWhere at Least One Dose Was Administered
2021-04-30
32.6%
29.0%
34.0%
25.9%23.3%
24.8%
45.5%
30.6%33.8%
0.0%
5.0%
10.0%
15.0%
20.0%
25.0%
30.0%
35.0%
40.0%
45.0%
50.0%
N8H N8X N8Y N9A N9B N9C N9Y HotspotCoverage
OverallCoverage
% o
f pop
ulat
ion
vacc
inat
ed w
ith a
t lea
st 1
dos
e

Location of Doses Administered to Windsor-Essex Residents
2021-04-30
0
10000
20000
30000
40000
50000
60000
70000
# of
dos
es a
dmin
ister
ed to
WEC
resi
dent
s by
vacc
ine
site
Dose 1 Dose 2

Number of Doses Administered by Vaccine Typeto Windsor-Essex Residents
2021-04-30
91,681
35,475
20,917
8,006
25
5,718
0
20,000
40,000
60,000
80,000
100,000
120,000
Pfizer-Biontech Astrazeneca Moderna
# of
dos
es a
dmin
ister
ed b
y va
ccin
e ty
pe
Dose 1 Dose 2

Cumulative Number of Doses Administered byVaccine Type to Windsor-Essex Residents
2021-04-30
0
20000
40000
60000
80000
100000
120000
140000
160000
180000
2020-12-22 2021-01-22 2021-02-22 2021-03-22 2021-04-22
# of
dos
es a
dmin
ister
ed (c
umul
ativ
e) b
y ty
pe
Pfizer-Biontech Moderna Astrazeneca

Number of Doses Administered Daily by VaccineType to Windsor-Essex Residents
2021-04-30
0
500
1000
1500
2000
2500
3000
3500
4000
4500
5000
2020-12-22 2021-01-22 2021-02-22 2021-03-22 2021-04-22
# of
dos
es a
dmin
ister
ed d
aily
by
vacc
ine
type
Pfizer-Biontech Moderna Astrazeneca

Summary• The case rate in Windsor-Essex County
remained unchanged this past week• Acquisition source is distributed between
close contacts and community transmission.• COVID-19 related hospitalizations and ICU
admissions have increased this week• Vaccine rollout continues at a steady pace
with available vaccine supply• Overall COVID-19 vaccination coverage rate is
33.8%
2021-04-30

Summary of Monitoring Indicators for WEC• Most recent completed weekly case rate =
91.6 cases/100,000 population• Most recent 7-day rate = 82.9 cases/100,000
population
• Percent positivity = 6.5% (full week)• Most recent 7-days percent positivity = 6.2%
• R0 (effective) = 0.94
2021-04-30