April 27, 2020 I Knowledge Series Indian Hotel Industry ...
37
Overview The Indian hospitality industry along with tourism continues to be one of the key segments driving the growth of the services sector in the Indian economy. Currently, Indian economy ranks 6 th in the world in terms of GDP as of FY19 as per IMF (2019 estimates). Travel and tourism sector contributes about US$ 247 billion (y-o-y growth of 6.7%) as per World Travel & Tourism Council’s (WTTC), providing employment to about 42 million persons. Also, travel & tourism is the 3 rd largest foreign exchange earner for the country. As of 2018, India ranks 3 rd as per WTTC travel and tourism power ranking 1 . In the study, CARE Ratings has analysed the Indian hotels & tourism industry for the past 25 years to see the changes it has gone through and to understand the major factors affecting the industry in terms of demand and pricing. The industry has been viewed in comparison to other regions such as US, Europe, Middle East, Asia Pacific, etc to assess the performance Sections covered in the report - History of the industry - Concepts used - Operating models - Inventory position – Existing & upcoming - Performance of major markets - City-wise performance - World Tourism & India - India Tourism – Domestic & Foreign - Challenges faced by the industry - Emerging market trends - Financial performance - Investment scenario - Taxes & policies - Covid-19 impact and outlook 1 WTTC travel & tourism power ranking looks at absolute growth of 185 countries across 4 main travel & tourism indicators – GDP, visitor exports, domestic spending and travel & tourism capital investment April 27, 2020 I Knowledge Series Indian Hotel Industry – Performance review Contact: Madan Sabnavis Chief Economist [email protected] 91-22-6837 4433 Author Darshini Kansara Deputy Manager – Industry Research [email protected] 91-22-6837 4345 Mradul Mishra (Media Contact) [email protected] 91-022-6837 4424 Disclaimer: This report is prepared by CARE Ratings Ltd. CARE Ratings has taken utmost care to ensure accuracy and objectivity while developing this report based on information available in public domain. However, neither the accuracy nor completeness of information contained in this report is guaranteed. CARE Ratings is not responsible for any errors or omissions in analysis/inferences/views or for results obtained from the use of information contained in this report and especially states that CARE Ratings has no financial liability whatsoever to the user of this report.
Transcript of April 27, 2020 I Knowledge Series Indian Hotel Industry ...

Overview
The Indian hospitality industry along with tourism continues to be one
of the key segments driving the growth of the services sector in the
Indian economy. Currently, Indian economy ranks 6th in the world in
terms of GDP as of FY19 as per IMF (2019 estimates). Travel and
tourism sector contributes about US$ 247 billion (y-o-y growth of
6.7%) as per World Travel & Tourism Council’s (WTTC), providing
employment to about 42 million persons. Also, travel & tourism is the
3rd largest foreign exchange earner for the country. As of 2018, India
ranks 3rd as per WTTC travel and tourism power ranking1.
In the study, CARE Ratings has analysed the Indian hotels & tourism
industry for the past 25 years to see the changes it has gone through
and to understand the major factors affecting the industry in terms of
demand and pricing. The industry has been viewed in comparison to
other regions such as US, Europe, Middle East, Asia Pacific, etc to
assess the performance
Sections covered in the report
- History of the industry
- Concepts used
- Operating models
- Inventory position – Existing & upcoming
- Performance of major markets
- City-wise performance
- World Tourism & India
- India Tourism – Domestic & Foreign
- Challenges faced by the industry
- Emerging market trends
- Financial performance
- Investment scenario
- Taxes & policies
- Covid-19 impact and outlook
1
WTTC travel & tourism power ranking looks at absolute growth of 185 countries across 4 main travel &
tourism indicators – GDP, visitor exports, domestic spending and travel & tourism capital investment
April 27, 2020 I Knowledge Series
Indian Hotel Industry –
Performance review
Contact: Madan Sabnavis Chief Economist [email protected] 91-22-6837 4433
Author
Darshini Kansara
Deputy Manager – Industry Research [email protected] 91-22-6837 4345
Mradul Mishra (Media Contact)
[email protected] 91-022-6837 4424
Disclaimer: This report is prepared by CARE Ratings Ltd. CARE
Ratings has taken utmost care to ensure accuracy and objectivity
while developing this report based on information available in
public domain. However, neither the accuracy nor completeness of
information contained in this report is guaranteed. CARE Ratings is
not responsible for any errors or omissions in
analysis/inferences/views or for results obtained from the use of
information contained in this report and especially states that
CARE Ratings has no financial liability whatsoever to the user of
this report.

Industry Insights I Indian Hotel Industry – Performance review
2
Table 1: Indian Hospitality & Tourism Industry – The History
Late 1800 Hotel industry in India started off with developing clusters of hotels in locations that were frequented by the British and the Indian aristocracy during the period
1830 Spence’s Hotel, Calcutta (Now Kolkata)
1841 The Great Eastern Hotel, Calcutta (Now Kolkata)
1876 The Rugby, Matheran
1900 The Taj Mahal Hotel, Mumbai
1930 The Grand, Calcutta
1935 The Cecil Hotels, Shimla and Murree (Now Pakistan)
1936 The Savoy, Mussoorie
1935 - 1947 No hotel development, India got independence
1956 Tourism was recognized as an engine for country's economic growth
1966 India Tourism Development Corporation (ITDC) was set up as a corporation under the Indian Companies Act of 1956
1967 The government created the Ministry of Tourism and Civil Aviation separating it from the Ministry of Transport and Shipping
1967 - 1975 Franchising' picked up in India, marking the beginning of the systematic planning, designing, decorating and furnishing of hotels in India. Training of managerial and other personnel was one of franchisee benefits
1975 ITDC acquired its first hotel in Chennai and launched its hotel business. The hotel was rechristened ‘Hotel Chola’
1975 - 1977 Using Indian expertise and inspired by the slogan ‘Be Indian, Buy Indian’, 3 Welcome Group Hotels commissioned operations in the country
1978 Welcome Group hotels, however, adopted the Sheraton system and used the services of expatriates for the purposes of upgrading staff training and installing Sheraton operating system without a management contract
1982 India agreed to host the Asian Games, another boost to the tourism industry
The Indian government approved the National tourism policy and outlined country’s tourism development objectives
1986
Tourism was officially recognised as an ‘industry’ by the government making it eligible for several government incentives
However, most of the hotels built post this were not planned well and lacked standardization and character failing to facilitate operations. Alarmed by this sudden proliferation of hotels in tier II locations, the Department of Tourism (DoT) made it mandatory for new hotel projects having 10 or more sellable rooms or having a minimum carpet area of 120 sqft per room to seek prior approvals from the government’s Hotel and Restaurant Approval and Classification Committee (HRACC)
1987
After a critical evaluation, the government permitted an Indian firm to franchise 3- and 4-star hotels in India to support the emerging group of entrepreneurs with sufficient means to build and run small and medium sized (3 & 4 star) hotels and extend the benefits of appropriate technical planning, international standards of comfort, assured hygienic services, and a focus on customer satisfaction
1991 Tourism was made a priority sector for the foreign direct investment, making it eligible for automatic approvals of hotels with up to 51% of the equity being provided by a foreign partner
1996 A National Strategy for the Development of Tourism was announced advocating the creation of an Advisory Board for Tourism Industry & Trade
1998 The tourism industry was given the status of ‘Export House’ which made its stakeholders such as the hotel owners, tour operators and travel agents, eligible for various government incentives leading to entry of various international hotel chains in the country
2002 The government formalized a new ‘National Tourism Policy’, in order to take advantage of the liberalized economic regime in India and the economic developments in the world

Industry Insights I Indian Hotel Industry – Performance review
3
Classification of Hotels in India
With the aim to provide and maintain contemporary standards of facilities and services, the Ministry of Tourism has a
voluntary scheme for approval of Hotel Projects categorised under 5 – Star, 4 – Star, 3 – Star, 2 – Star, 1 – Star and Heritage
(Basic). The classification is valid for the period of 5 years, and the same can be renewed upon expiry.
The Indian Hotel Industry can be further broadly classified under 3 major heads:
Chart 1: Classification of Hotels
Source: CARE Ratings
Other Emerging Concepts
Timesharing industry
- A timeshare is a form of vacation ownership of property. Units may be on a partial ownership, lease or a ‘right to
use’ basis where the sharer has no claim to the ownership of the property. The concept of ‘timeshare’ as an
innovative way for increasing holiday choice became popular in Europe in the 1960s. Under this concept, the use
and costs of running the property (hotel) are shared among the owners.
- Instead of booking a resort every year for a week or two, or purchasing a property, timeshare offers buyers the
ability to buy rights of occupancy in a property, usually in multiples of a week, for a set period. After purchasing their
holiday time and using it, they can pass it to their friends and relatives, or rent it out.
The industry offers various purchase options to meet consumers’ requirements for vacation variety and flexibility.
Classification of hotels
Based on Location
City Hotels
Suburban Hotels
Motels
Airport Hotels
Resorts
Forest Hotels
Floatels
Rotels
Based on the level of service
Upscale Hotels
Mid market Hotels
Economy Hotels
Based on Themes
Ecotel
Boutique Hotels
Heritage Hotels
Spa Hotels

Industry Insights I Indian Hotel Industry – Performance review
4
1. Fixed-week: The most common type of timeshare where units are sold for use during a fixed week of the year.
2. Floating week: This could be any week during a certain season of the year.
3. Rotating or flex-week: Under this, in an attempt to give all owners a chance for best weeks, the weeks are rotated
forwards or backwards through the calendar, so in year 1 the owner has week 25, then in year 2 the owner has week
26 and week 27 in the week after that.
4. Points Program: Annually, the program gives the owner the points equal to the level of ownership and the owner
has the flexibility to use these points as currency to make their travel arrangements.
Timeshare owners have the option to holiday in different resorts if the memberships are affiliated to an exchange
company. Resort Condominiums International (RCI) and Interval International are the major players amongst the existing
exchange companies.
Service Apartments
- Service apartments are fully furnished apartments available for short-term or long-term stay providing all the
luxuries of a premium hotel such as room service, laundry service, fitness centre, etc. and have larger rooms and
more space at a far more competitive rate. The apartments are usually equipped with full kitchens, Wi-Fi and other
in-house amenities.
- These apartments are ideal for people who do not have to stay for long durations to set up a home but also long
enough to want to live a normal life while experiencing luxuries of a 5-star hotel. Also, no rental deposits are
required in this case unlike ordinary residential leases which typically binds people for a year or and involve an 11
month rental deposit.
- Business professionals, executives who may be on local or international work assignments (project related) are
frequent users of this facility. However, they are available to general public as well.
Although this concept is picking up in some business destinations, we at CARE Ratings do not see it becoming a threat to the
demand for existing premium segment hotels, as the average length of stay (ALOS) in hotels is still lower at 2-3 days and are
preferred over service apartments.
Operating models
Chart 2: Operating models
Source: CARE Ratings
Ownership model
Franchise
Management Contract
Owned hotels
Lease and License
Joint Venture

Industry Insights I Indian Hotel Industry – Performance review
5
Classification of Customer segments
1. Business traveller
- The business traveller is a businessman or a corporate executive travelling for business purposes. This segment
includes corporates, both domestic and foreign. This practice is on a rise due to the economic upswing in India. It can
also be attributed to the increased business opportunities internationally.
- The business travellers can be divided into two categories based on their duration of stay; first, the business traveller
who travels for a short duration. These travellers come mostly for a meeting or a conference. They are time-
conscious and willing to be price-insensitive. Such customers are ready to pay higher price in exchange for flexibility
of being able to book a room at the last minute.
- The other category is the business traveller who travels for a mid-to-long-term duration. They travel mostly for
working on a project. Such customers may or may not have a pre-planned journey; therefore, they may or may not
be price sensitive. Nowadays, such people prefer serviced apartments.
2. Leisure travellers
- The leisure traveller could either be a foreigner or a domestic traveller whose primary purpose of visit is holiday or
site seeing. Among non-business foreign tourists, the primary motivation for visiting India is largely cultural
attraction followed by conferences and conventions, tourist attractions like beaches, wild life, hill resorts, etc.
- Usually, leisure travellers are part of a package run by a tour operator. Their duration of stay varies from short to
medium term. Such customers are price-sensitive and are willing to give up some flexibility for the sake of a more
inexpensive room.
- Most of these travellers are domestic travellers. Due to growing economy and rising income levels, the number of
such travellers is increasing.
3. Airline Cabin Crew
- Airline cabin crew forms another important segment because of the repetitive and guaranteed nature of the
business that they provide.
- Usually, these are a part of an annual contract whereby, in return for a fixed rate, a certain number of rooms are
provided on demand for cabin crews with discount rates in the range of 40% and 50% and represents a low-yield
segment for hotels in general.
Chart 3: Share of Business & Leisure travellers (% share in volume terms)
56.3 56.9 59.1 60.4 59.4
42.5 43.1 40.9 39.7 40.7
FY0
0
FY0
1
FY0
2
FY0
3
FY0
4
FY0
5
FY0
6
FY0
7
FY0
8
FY0
9
FY1
0
FY1
1
FY1
2
FY1
3
FY1
4
FY1
5
FY1
6
FY1
7
Business travellers Leisure travellers

Industry Insights I Indian Hotel Industry – Performance review
6
Source: Ministry of Tourism, CMIE
- In volume terms, both business and leisure segments have been witnessing stable growth over the years. However,
after witnessing strong growth of over 450% y-o-y during 2008, the business travellers were impacted registering a
sharp decline of about 50% on a y-o-y basis in 2009 led by the Lehman financial crisis that affected the world
economy
- Leisure travel was slow during the period as well but declined sharply during 2010 by over 53% y-o-y post which
both the segments witnessed y-o-y double-digit growth between 2010 and 2012 pointing towards an improvement
in demand mainly for the business segment with the economies bouncing back. Also, the ‘Incredible India’ campaign
was extended during 2008 and 2009 for the purpose of promoting domestic as well as foreign tourism in the
country.
Distribution channels
Chart 4: Distribution channels
Distribution channel FY05 (% share) FY17 (% share)
CRS 3.9 3.9
GDS 1.7 1.9
Booker 54.7 45.5
Hotel/chain website 4.6 8.0
Travel Agent 21.2 17.9
Online Travel Portal 3.7 15.1
Marketing Alliances 10.2 7.6
Source: FHRAI, CARE Ratings
1. Global Distribution System (GDS)
- A GDS is a network operated by a company that enables the electronic reservation systems between the travel
service providers (hotels, airlines, car rental companies, etc) and the travel agencies (travel agents and the public) to
provide and avail travel related services.
2. Centralised reservation system (CRS)
- The CRS is a computerised system that stores and distributes information to carry out transactions related to air
travel, car rentals, hotel bookings and other related services through which reservations can be made.
3. Booker/Hotel representative
- The travel manager, executive assistants working directly with the hotel/chain that are the link between the traveller
and the service provider (hotel/ airlines, etc) usually make corporate bookings.
4. Tour agent/Travel agent (booking via GDS/CRS)
Distribution modes
GDS
CRS
Booker
Hotel/Chain website
Travel Agent
Online Travel Portals
Marketing Alliances

Industry Insights I Indian Hotel Industry – Performance review
7
- A travel agent is someone who provides travel and tourism services to the public on behalf of the suppliers such as
activities, airlines, car rentals, cruise lines, package tours, etc. Some agents besides dealing with the ordinary tourists
also have a separate department looking after the corporate/business travellers.
5. Online Travel Portals
- Online travel portals have increasingly become one stop shop for all the travel related services with the emergence
of e-commerce. These are websites dedicated to travel related transactions such as flight ticket bookings, hotels and
travel packages. Again, these travel websites are connected to GDS/CRS systems that enable them to offer lowest
rates prevalent in the distribution network.
6. Marketing alliances
- Hotels are often associated with marketing alliances. Such alliances provide the hotels get direct access to the online
reservation network, promotions and the internet coverage.
Industry characteristics
The industry can be classified as business and leisure destinations from the point of view of the hospitality sector. It should
be noted that the two are not mutually exclusive as some locations have a fair mix of business and leisure travellers. The
demand dynamics are quite different for both the segments.
Cyclicality
The hospitality industry is cyclical in nature. i.e., during positive cycles the industry witnesses periods of sustained growth
and sees healthy average room rates (ARRs) and occupancy rates (ORs). Until the economy goes through a downturn or if
there is excess supply, the trend continues. When recession sets in, the ORs begin to decline followed by the ARRs. For
example, during the year 2009 & 2010, the ORs witnessed a sharp drop of about 1,000 basis points (10%) after witnessing
stable growth of about 300 basis points during 2006, 2007 and 2008 respectively. Similarly, ARRs witnessed a sharp decline
of about 4% and 16% y-o-y during 2009 & 2010 respectively. In the recovery phase, ORs starts to move up and eventually the
ARRs also start to increase.
While the macro-economic factors affect the business destinations (RevPARs– revenue per available room, growth is
sensitive to the macro-economic indicator such as the nominal GDP, inflation, lending rates, etc), the leisure destinations
show a greater sensitivity to non-economic factors such as terror attacks, health related travel warning, etc. (decline in FTA
in FY09 was largely on account of the Mumbai terror attacks on November 26, 2008 and the swine flu linked travel
advisories). Consequently, the average RevPARs of 11 major cities had registered a decline of about 16.3% in FY09 and 16%
in FY10. While in FY11, with higher growth in nominal GDP and an increase in FTAs post-recession, these 11 major cities
recorded an average increase of about 2.2% in RevPARs. Similarly, due to increased domestic and international trade
activities and various initiatives taken by the government during FY16, the number of foreign travellers in the country has
increased. This has been reflecting in the overall RevPARs in India that registered a CAGR growth of over4% between FY14
and FY19.
Seasonality
The hotel industry demand is seasonal in nature. Though the peak season for both business and leisure destinations is the
same (January – March), during the remaining year both demonstrate different behaviours. While the business destinations
maintain constant ORs (5-10% lower than Jan-Mar period) from April – November. However, in December, a sharp

Industry Insights I Indian Hotel Industry – Performance review
8
correction is witnessed in the business destinations as it coincides with the international holiday period. Leisure destinations
on the other hand register lower ORs during May - October period, while the occupancy rates improve in December on
account of holiday season.
Chart 5: Seasonal nature of hotels industry in India (Occupancy rates - %) FY19
Source: FHRAI
Average length of stay (ALOS)
The demand for hotel rooms in business destinations is usually concentrated around weekdays, i.e., the ORs are generally
lower on weekends. The ALOS for business hotels is usually in the range of 2-2.5 nights with low levels or double occupancy
(fewer occasions where more than one person shares the room). While the hotels in leisure destinations the ORs are higher
during the weekends and have ALOS of around 2-3 days. The occurrence of double occupancy is also typically higher in
leisure destinations.
Existing Inventory
The upscale segment of the hotel industry in India is highly organized and concentrated in few key cities. The total number of
‘keys’ (rooms) in the top 11 key cities covered by CARE Ratings is estimated at 94,544 as at the end of FY19. Of this, about
53% of the room inventory is concentrated in NCR, Bengaluru and Mumbai.
The existing room supply for the country grew by 5.4% y-o-y in FY19 totaling to 133,359 rooms (as of March 31, 2019). This
considers the 5,132 new rooms that entered various markets in H2 FY19, as well an expansion of the existing properties that
are operational for less than 6 months.
Looking at the major markets analyzed in this report, Bengaluru, with the second largest number of inventory in the set, saw
the highest increase in supply (13.4%) in FY19, followed by Chennai (8.9%) and Goa (6.9%). Post the recession in FY09,
demand in cities like Bengaluru, Chennai and Pune witnessed an uptick led by increasing demand from the business
segments mainly from IT, Auto, BFSI sectors thereby attracting huge investments in these cities by the hotel industry.
Inventory increased by about 18% CAGR in Pune and about 15% CAGR in Bengaluru and Chennai each between FY10 and
65%
60% 59% 56%
59% 61% 62%
72% 69%
67%
77% 72%
71% 69%
66% 68% 68%
70%
67%
80% 79%
75%
81%
73%
63% 63% 61% 60% 61% 61% 61%
69% 71%
67% 70%
65%
Ap
ril
May
Jun
e
July
Au
gust
Sep
tem
ber
Oct
ob
er
No
vem
ber
Dec
em
ber
Jan
uar
y
Feb
ruar
y
Mar
ch
Five-Star Deluxe Five-Star All India Average (across categories)

Industry Insights I Indian Hotel Industry – Performance review
9
FY15. NCR witnessed a huge increase as well largely led by higher inventory in Gurgaon and Noida. Also, leisure demand
increased for Jaipur and Goa leading to about 14% and 10% growth in inventory during the period. However, post FY15; the
industry faced a situation of over supply thereby hurting the ARRs during the period. The total upcoming supply therefore
witnessed a slower growth of about 5.7% CAGR between FY14 and FY19 vis-à-vis a double-digit growth of about 12% CAGR
witnessed between FY10 and FY15.
Table 2: Existing inventory (Major cities and across categories – Only branded)
Sr no. City Existing inventory at the end of Y-o-y
Growth CAGR
FY07 – FY19 FY07 FY18 FY19
1 New Delhi * 7,990 21,855 21,974 0.5% 8.8%
2 Bengaluru 2,414 12,594 14,287 13.4% 16.0%
3 Mumbai 7,402 13,524 13,687 1.2% 5.3%
4 Chennai 2,442 9,061 9,863 8.9% 12.3%
5 Hyderabad 1,868 6,846 6,965 1.7% 11.6%
6 Goa 2,450 6,386 6,828 6.9% 8.9%
7 Pune 777 6,353 6,460 1.7% 19.3%
8 Jaipur 1,388 5,352 5,613 4.9% 12.3%
9 Kolkata 1,354 3,652 3,742 2.5% 8.8%
10 Ahmedabad 519 3,393 3,000 -11.6% 15.7%
11 Agra 1,336 2,256 2,125 -5.8% 3.9%
Total 29,940 91,272 94,544 3.6% 10.1%
12 Other Cities 9,345 35,293 38,815 10.0% 12.6%
Total 39,285 1,26,565 1,33,359 5.4% 10.7% Note: *NCR includes New Delhi, Noida and Gurugram
** Other cities includes all other hotel markets across India
Source: Hotelivate
Table 3: Top Brands in Hotel Industry in India
Domestic Hotels International Hotels
Bharat Hotels Ltd Accor
EIH Ltd Swissotel Hotels & Resorts*
Hotel Leelaventure Ltd Four Seasons Hotels Inc
Taj Hotels Palaces Resorts Safaris Intercontinental^
ITC Ltd Best Western Hotel
Neesa Leisure Ltd Hyatt
Pride Hotels Carlson Rezidor
Park Hotels Berggruen Hotels
Lemon Tree Hotels Hilton Hotels
Sarovar Hotels & Resorts Wyndham Hotels
Royal Orchid Hotels Choice Hotels
Concept Hospitality Marriott International
Starwood Hotels & Resorts** Note: *Swissotel has been taken over by Accor, ^Six Continents was renamed Intercontinental,
**Starwood Hotels & Resorts has been acquired by Marriott International
Source: CARE Ratings

Industry Insights I Indian Hotel Industry – Performance review
10
Upcoming Supply
The future supply landscape is ever-changing and subject to several external forces and macro-economic factors, delay in
government approvals, cost overruns, etc, that may often delay project openings. It is noteworthy that the pipeline for
proposed supply totaled 114,466 rooms back in FY08 – the highest in a decade, whereas in FY19 it contracted significantly to
just 50,170 rooms
Table 4: Proposed Branded Hotel Rooms across Major Cities and Categories (FY19 – FY24)
Existing Supply (FY19)
Proposed Supply*
Increase in Future Supply
Luxury Upscale Upper-
Midmarket Mid-
market Budget
Agra 2,125 582 27% 0.0% 34.4% 0.0% 45.4% 20.3%
Ahmedabad 3,000 2,006 67% 31.0% 19.9% 25.3% 5.3% 18.4%
Bengaluru 14,287 4,620 32% 15.2% 26.1% 20.0% 23.2% 15.5%
Chennai 9,863 393 4% 28.0% 0.0% 26.2% 30.5% 15.3%
New Delhi 14,730 805 5% 0.0% 30.6% 10.6% 25.1% 33.8%
Gurgaon 5,866 1,808 31% 0.0% 33.3% 19.7% 20.7% 26.2%
Noida 1,378 981 71% 0.0% 26.5% 54.0% 7.3% 12.1%
Goa 6,828 2,068 30% 0.0% 28.2% 23.5% 25.5% 22.8%
Hyderabad 6,965 728 10% 0.0% 31.9% 13.7% 22.8% 31.6%
Jaipur 5,613 2,601 46% 8.3% 55.7% 26.6% 9.4% 0.0%
Kolkata 3,742 1,724 46% 28.4% 9.5% 25.4% 18.6% 18.2%
Mumbai 13,687 4,816 35% 32.9% 9.3% 35.4% 5.0% 17.5%
Pune 6,460 796 12% 24.9% 19.6% 25.0% 26.9% 3.6%
Other cities 38,815 26,242 68% 5.2% 19.1% 26.7% 29.6% 19.4%
Total 133,359 50,170 38% 10.5% 21.9% 26.2% 23.3% 18.1% Note:*Proposed Supply includes 5,132 rooms which have been open for less than six months, and therefore, not included in the existing supply Source: Industry, Hotelivate
Performance of major markets in India (11 cities)
The overall average Occupancy rates (ORs) increased by only about 100 basis points y-o-y during FY19 in 11 major cities in
India. ORs increased from 65.7% in FY18 to 66.7%% in FY19 on back of increased demand mainly from domestic travelers for
business and leisure activities. Of this, leisure spending by domestic travelers accounted for about 95% of the total
contribution to India’s direct travel & tourism GDP 2018. Foreign tourist arrivals witnessed slower growth during FY19 on
back of slowdown in major global economies during the year and foreign visitor spending accounted for just about ~13% of
the total spending during the year. However, the average room rates (ARRs) increased by about 3.6% during the same period
to Rs 5,973 per day on back of increased demand and limited supply additions during the year. This increase in ORs and ARRs
led to the all India RevPAR performance of major markets to record a growth of about 3.8% over the preceding fiscal and
reach Rs 3,981 per day in FY19. This rate was last achieved in the year FY09.
During FY07 and FY09, the Indian Hotel Industry witnessed the best performance amongst the years under consideration.
However, the financial crisis during 2008 restricted the domestic as well as international tourism (both business as well as
leisure) and impacted the domestic hotel industry in terms of occupancy as well as the room rates. The Mumbai terror

Industry Insights I Indian Hotel Industry – Performance review
11
attack in 2008 further impacted the tourism in the country which can be seen in the charts below. Post this, huge
investments in the tourism sector were made by the government as well as industry players so as to attract demand for the
sector as well as promote safety of the travellers (chart 18). Also, Post the recession in FY09, demand in cities like Bengaluru,
Chennai and Pune witnessed an uptick led by increasing demand from the business segments mainly from IT, Auto, BFSI
sectors thereby attracting huge investments in these cities by the hotel industry. Inventory increased by about 18% CAGR in
Pune and about 15% CAGR in Bengaluru and Chennai each between FY10 and FY15 which led a decline in overall ARRs by
over 3% while the ORs remained largely stable at ~59% during the period due to oversupply. NCR witnessed a huge
increase as well largely led by higher inventory in Gurgaon and Noida. Also, leisure demand increased for Jaipur and Goa
leading to about 14% and 10% growth in inventory during the period. The total upcoming supply therefore witnessed a
slower growth of about 5.7% CAGR between FY14 and FY19 vis-à-vis a double-digit growth of about 12% CAGR witnessed
between FY10 and FY15.
Chart 6: Performance of Hotels – Overall average
Source: Hotelivate, FHRAI, HVS, CMIE
Occupancy rates (OR):
ORs for 2 star and 3 star hotels witnessed the sharpest growth of about 370 and 230 basis points y-o-y during FY19. This was
followed by 5 star D hotels that registered a growth of about 200 basis points. 4 star hotels witnessed a lower growth of only
60 basis points y-o-y a while ORs of 5 star hotels remained largely stable and witnessed only a marginal increase of about 10
basis points on a y-o-y basis.
Chart 7A: Occupancy rates (%) – Premium category
3,688
5,444
7,989
6,489
5,973
2,320
3,892
5,496
3,861 3,981
62.9%
71.5% 68.8%
59.5% 66.7%
0.0%
10.0%
20.0%
30.0%
40.0%
50.0%
60.0%
70.0%
80.0%
0
1,000
2,000
3,000
4,000
5,000
6,000
7,000
8,000
9,000
FY9
7
FY9
8
FY9
9
FY0
0
FY0
1
FY0
2
FY0
3
FY0
4
FY0
5
FY0
6
FY0
7
FY0
8
FY0
9
FY1
0
FY1
1
FY1
2
FY1
3
FY1
4
FY1
5
FY1
6
FY1
7
FY1
8
FY1
9
Average room rate (Rs) RevPAR (Rs) Occupancy rate (%)

Industry Insights I Indian Hotel Industry – Performance review
12
Chart 7B: Occupancy rates (%) – Mid-market & Budget category
Source: Hotelivate, FHRAI, HVS, CMIE
Average Room Rates (ARR):
Similarly in case of average room rates, 2 star hotels witnessed the maximum growth in the group increasing by over 11% y-
o-y during FY19. This was followed by 3 star hotels that registered a growth of about 5.1% y-o-y in FY19. 5 star and 5 star D
hotels recorded a growth of 3.9% and 3% y-o-y each in average room rates. 4 star hotels, however, registered the lowest
growth about 2.3% y-o-y in the group during the year. This may be attributed to the gradual escalation of commercial
activity in Tier II and Tier III cities as well as increased domestic travel.
Chart 8: Average room rates (Rs per day) – category wise
67.6%
73.8% 73.0% 71.7%
62.5%
67.4%
65.7%
70.4% 67.2%
58.5% 57.2%
66.0%
FY9
7
FY9
8
FY9
9
FY0
0
FY0
1
FY0
2
FY0
3
FY0
4
FY0
5
FY0
6
FY0
7
FY0
8
FY0
9
FY1
0
FY1
1
FY1
2
FY1
3
FY1
4
FY1
5
FY1
6
FY1
7
FY1
8
FY1
9
5 Star- D 5 Star
60.5% 53.2%
68.7% 72.7%
68.9%
58.5% 57.9% 61.2%
67.5%
49.2% 47.7%
59.6% 65.9%
68.9%
56.2% 56.8% 59.8%
67.4%
FY9
7
FY9
8
FY9
9
FY0
0
FY0
1
FY0
2
FY0
3
FY0
4
FY0
5
FY0
6
FY0
7
FY0
8
FY0
9
FY1
0
FY1
1
FY1
2
FY1
3
FY1
4
FY1
5
FY1
6
FY1
7
FY1
8
FY1
9
4 Star 3 Star 2 Star

Industry Insights I Indian Hotel Industry – Performance review
13
RevPAR:
Each star category witnessed a y-o-y increase in RevPAR in FY19, with the 2 star category leading the pack, recording a sharp
growth of 14% during the year. The improvement in RevPAR across all star categories can be attributed to both occupancy
and average rate.
Chart 9: Revenue per available room (RevPAR) (Rs per day) – category wise
Source: Hotelivate
The expected future inventory in 11 major markets (across categories - only branded) is lower at around 50,170 rooms for
the next 5 years (FY19 to FY24). Therefore, as historically witnessed with increasing demand on back of improvement in
economic activities and lower room additions, we expect the industry to sustain the average room rates (ARRs) going
forward and grow at an average of 3.5-4.5%% per annum. Also, we expect the occupancy to inch up to an average of
about 68-70% by the end of FY22 compared with 66.7% in FY19.
However, during Q4 FY20 and H1 FY21, the operational parameters (Occupancy rates – ORs & Average room rates – ARRs) of
the hotel players are expected to get adversely impacted led by the spread of the pandemic Covid-19 and the consequent
4,9
91
7,1
68
9,7
78
11
,20
0
11
,09
6
10
,65
6
FY9
7
FY9
8
FY9
9
FY0
0
FY0
1
FY0
2
FY0
3
FY0
4
FY0
5
FY0
6
FY0
7
FY0
8
FY0
9
FY1
0
FY1
1
FY1
2
FY1
3
FY1
4
FY1
5
FY1
6
FY1
7
FY1
8
FY1
9
5 Star- D 5 Star 4 Star 3 Star 2 Star
3,374
5,290
7,138
8,030
6,933 7,180
FY9
7
FY9
8
FY9
9
FY0
0
FY0
1
FY0
2
FY0
3
FY0
4
FY0
5
FY0
6
FY0
7
FY0
8
FY0
9
FY1
0
FY1
1
FY1
2
FY1
3
FY1
4
FY1
5
FY1
6
FY1
7
FY1
8
FY1
9
5 Star- D 5 Star 4 Star 3 Star 2 Star

Industry Insights I Indian Hotel Industry – Performance review
14
lockdown in the country as well as many other countries. Tourism, both foreign as well as domestic is expected to get
impacted for short to medium term period.
City-wise performance – FY19
1. Mumbai
- Business travellers account for about 80% of the total room demand in the city.
- Mumbai's hotel market once again outpaced all other major markets across country and recorded the highest
occupancy (77.1%) as well as highest average room rates (Rs 8,096 per day), further consolidating its position as the
best performing hotel market in terms of RevPAR too. This was primarily backed by strong growth in corporate
travel from industries such as BFSI and IT/ITeS along with an upswing in meetings, incentives, conferences and
exhibitions (MICE) demand in major commercial hubs such as BKC, Powai, Goregaon and Airoli, CBD Belapur in Navi
Mumbai and the promising growth in the Extended-Stay segment – have favourably impacted Mumbai's hotel
market
- In terms of future supply, Mumbai is expecting an addition of about 4,816 rooms by FY24. Of this, about 33% supply
is expected in the luxury space while the remaining is mostly in the upper-mid-market and budget category.
2. Bengaluru
- Business travellers constitute about 80-85% of the premium segment room demand in Bengaluru. BFSI and PSU
companies mainly account for room demand in CBD area while Whitefield and Electronic city areas have demand
from IT/ITeS companies
- Hotels in Bengaluru witnessed a surge of 5.2% in market wide RevPAR in FY19, driven mainly by the higher room
rates during the year. The city's hotels exhibited an increase of about 9% y-o-y in average rates and reached Rs 6,339
per day. The fact that the resilient market performance was accompanied by a 13.4% y-o-y growth in supply bodes
well for the city that is expected to add approximately 4,620 rooms in a phased manner over the next 5years.
3. NCR
- Business travellers account for about 70-75% of the demand while the remaining comes from the leisure travel
demand. Demand mainly comes from the BFSI and PSU segments in Delhi while in Gurugram, IT/ITeS, BPO and
telecom sector drive demand. Hotels in Noida region majorly cater to demand from IT, BPO and consumer durables
companies. Aerocity district caters to demand from corporates, MICE activities and transient clients. Social events –
marriages also contribute to the room demand in NCR. The demand previously catered to by the unorganised sector
in the area has been absorbed by the branded mid-market and budget hotels located within the district.
- NCR is home to the largest branded hotel market in the country. New Delhi continued to record a y-o-y growth of
about 8.5% y-o-y in RevPAR despite opening of two large hotels (an addition of about 470 keys), while Gurugram and
Noida witnessed a growth of over 5% and 25% respectively in FY19 after declining in FY18 due to supply pressure.
- NCR is expected to witness an addition of about 3,594 rooms in the next five years, with maximum rooms (~1,800)
expected in Gurugram alone.
4. Chennai
- 85% of the room demand in Chennai comes from business travellers.

Industry Insights I Indian Hotel Industry – Performance review
15
- Demand in CBD area comes mainly from BFSI and PSU companies, IT/ITeS companies drive demand in the OMR
region. Proximity to electronics and the auto industry players in and around the Sriperumbudur area, makes hotels
near airport area attractive for business travellers
- It also enjoys demand from other major business sectors including manufacturing, port and port-related activities,
the government and embassies, etc along with a growing MICE demand base owing to the recent expansion of room
inventories including large-scale meeting facilities in the city
- Despite an increase of about 9% in supply in FY19, the market continued on its path to recovery with room rates
registering a y-o-y growth of about 3.7% y-o-y and recorded the highest RevPAR growth of about 7% in last 12 years.
- Going forward, only about 400 rooms are expected to be added to Chennai market in the next 5 years.
5. Pune
- Demand from business travellers account for about 90-95% of overall demand in the city for premium hotels.
- In addition to serving as a manufacturing hub in Western India, the city has developed into an important IT/ITeS
centre. Availability of large commercial floor plates along with a young and educated workforce has driven the rapid
development of the city. Proximity and ease of connectivity to Mumbai, the country's financial capital, has also
helped the city
- In the past few years, a staggering increase in room supply resulted in a downward spiral in both occupancy and
average rate performance which overshadowed the y-o-y double-digit growth in demand, and questioned the
strength of the market
- However, the silver lining is that the slowdown in new supply coupled with the robust and continuous increase in
demand has helped the city's hotels perform well in terms of occupancy. Occupancy rates registered a slower
expansion of about 200 basis points during FY19 largely due to subdued performance of auto industry and restricted
travel during the year. Average room rates, however, witnessed an increase of about 7% y-o-y leading to a sharp
growth of about 10% y-o-y in RevPAR during the year.
6. Ahmedabad
- The city has lately attracted substantial investments and industries. Ahmedabad market witnessed healthy RevPAR
growth of over 10% led by about 10% y-o-y higher average room rates during FY19 on back of number of new
commercial and industrial developments taking place both within the city and on the outskirts, generating demand
mainly for commercial, extended-stay and MICE segments. Occupancy rates, however, remained largely stable and
witnessed a negligible growth of about 30 basis points during the year
- With the city hosting multiple mega events and festivals, a large amount of leisure demand is also generated
- Around 2,000 rooms are expected to be added to the Ahmedabad market by FY24.
7. Hyderabad
- About 85-90% of premium segment hotel demand comes from business travellers led by MICE activities in the HITEC
city.
- CBD area room demand is primarily dominated by business travel segment from sectors such as BFSI and PSU
companies while the Hitech city caters to demand from IT/ITes.
- Corresponding to the rebound in commercial activity, the Hyderabad hotel market witnessed an expansion of about
400 basis points in occupancy rates and the average rates increased by about 6% y-o-y in FY19. With opening of
Grade-A commercial spaces and major global conglomerates setting up office in HITEC city, demand has been on the
upward trajectory

Industry Insights I Indian Hotel Industry – Performance review
16
- 730 rooms are expected to be added to the existing supply between FY19 and FY24.
8. Kolkata
- About 75% of room demand for premium segment comes from business travellers.
- Kolkata is driven primarily by commercial activity emanating from PSUs, PSBs, manufacturing, IT/ITeS, engineering,
medical activity and the telecom industry
- In FY19, Kolkata witnessed negligible change of about -0.9% y-o-y in average room rates, while the RevPAR remained
unchanged. Post the increase in room supply in the last few years, the city ORs managed to be over 70% and the
average room rates reached Rs 5,853 per night
- The MICE activities has been the major contributor of incremental demand with its connectivity to domestic as well
as international destinations, improved infra and shift of demand from unorganised to branded hotels supporting
the demand in the city.
- Kolkata market is expected to add about 1,700 rooms between FY19 and FY24
9. Jaipur
- Popularly known as the 'Pink City' and an integral part of the Golden triangle itinerary, Jaipur's rich culture and its
spectacular forts, palaces, and havelis continue to attract tourists from all over the world, making it one of the top
leisure destinations in the country.
- Lately, the city has become a major MICE destination, primarily known for its destination weddings and large scale
conventions
- In FY19, the city witnessed about 5% growth in room supply. Despite the increase in supply, the city average room
rates reached Rs 5,296 per night (5% y-o-y increase) while ORs remained largely stable at 67.9% (y-o-y expansion of
about 50 basis points). In line with the ORs and ARRs, RevPARs registered about 5.4% y-o-y growth during the year.
- Going forward, about 2,600 rooms are expected to be added to Jaipur hotel market in the next 5 years
10. Goa
- Goa continued to exhibit largely stable average room rates of Rs 7,912 per night during FY19 (the second highest
after Mumbai), Occupancy rates reached 71.8% during the year (expansion of about 200 basis points) leading the
RevPARs to witness an increase of about 2.4% y-o-y.
- However, Goa continues to face competition from beach destinations in South and Southeast Asia
- The up-tick in the occupancy can be attributed to the improved domestic leisure travel and the booming MICE
(wedding business).
- Recently, Goa’s position as the most preferred getaway spot in India has been impacted on back of various measures
taken by the government such as banning alcohol consumption on the beaches to imposition of long list of ‘dry
days’. Marginal shift in demand to travel destinations like Sri Lanka, Istanbul and Thailand (comparable in terms of
costs) has been witnessed in the past couple of years
- The proposed Mopa Airport is further expected to make significant demand contribution
- Going forward, about 2,068 rooms are expected to be added to Goa market by FY24
11. Kerala
- Room demand in Kerala is driven by both leisure and business travellers, each accounting for 50% share

Industry Insights I Indian Hotel Industry – Performance review
17
- Kochi is known as the commercial capital of Kerala comprising of shipbuilding and port operations, chemicals, spices,
construction, fertilizers and IT industries. Also, large oil corporations such as Indian Oil Corporation, Bharat
Petroleum and Hindustan Petroleum have plants located at Irumpanam, a suburb of Kochi
- Trivandrum comprises of industries such as IT and medical
- Apart from this, leisure travellers also drive room demand in Kerala
- Demand in the state was affected due to health advisories in May 2018 followed by severe floods and airport closure
during August-September 2018. Also, the ripple effects were felt for a few months post that with hotels being shut
for maintenance work caused by unusual flooding while demand moved to neighbouring destinations such as Sri
Lanka, Thailand, etc.
12. Agra
- Room demand is usually driven by leisure travellers
- Any macroeconomic conditions have an impact on demand in tourist destinations such as Agra where FTAs
constitute majority
- In FY19, OR registered an expansion of over 120 bps to reach 67 %, city’s highest in over 20 years. Also, despite
competition from the branded mid-market segment, the room rates witnessed an increase of about 7.7% y-o-y to
average at Rs 5,726 per night. This higher occupancy/demand translated into a growth of over 9% in RevPARs during
the year.
- In FY19, the city continued to witness decline in the FTAs, which was cushioned by the increase in DTAs led by
introduction of the Gatimaan Expressway, Yamuna Expressway and the Agra-Lucknow Expressway, improved rail-
road connectivity to NCR, Lucknow and neighbouring cities that has increased the demand from MICE segment and
individual domestic leisure travellers.
- Going forward, only about 580 rooms are expected to be added to Agra market by FY24
Citywise performance – At a glance
City ORs ARRs RevPAR Demand drivers
Agra 67.0% 5,726 3,835 Leisure destination Macro-economic conditions impact demand as FTAs constitute majority
Ahmedabad 63.9% 4,578 2,926 Demand comes from commercial, extended-stay and MICE segments, multiple mega events and festivals also generates leisure demand
Bengaluru 66.0% 6,339 4,185 ~80-85% business demand Major business clusters - CBD, Whitefield and electronic city Major industries - IT/ITeS, BFSI & PSU
Chennai 65.0% 5,045 3,280 ~85% business demand Major business clusters - CBD, OMR Major industries - BFSI, PSU, IT/ITeS, manufacturing, ports & related
New Delhi 72.5% 7,026 5,091 ~70-75% business demand Major business clusters - Gurugram, Noida, Aerocity Major industries - BFSI, PSU, IT/BPO, consumer durables, Auto
Gurgaon 68.8% 6,346 4,364
NOIDA 60.0% 6,100 3,662
Goa 71.8% 7,912 5,679
Largely known for leisure demand, beaches, cuisines, etc faces competition from beach destinations in South India and Southeast Asia Government has banned alcohol consumption on the beaches and imposed a long list of ‘dry days’ which is impacting demand

Industry Insights I Indian Hotel Industry – Performance review
18
Hyderabad 70.3% 5,217 3,668 ~85-90% business demand Major business clusters - HITEC City, CBD Major industries - BFSI, PSU, IT/ITeS
Jaipur 67.9% 5,296 3,597 one of the top leisure destinations in the country Forts, havelis, palaces and rich culture. Major MICE activities - destination weddings and large scale conventions
Kolkata 70.8% 5,853 4,143 ~75% business demand major industries - PSUs, PSBs, manufacturing, IT/ITeS, engineering, medical activity and the telecom
Mumbai 77.1% 8,096 6,241 ~80% business demand Major business clusters - BKC, BKC, Powai, Goregaon and Airoli, CBD Belapur Major industries - BFSI, IT/ITeS, Gems & Jewellery
Pune 69.9% 4,807 3,359 ~90-95% business demand Proximity to Mumbai, availability of large commercial floor plates Major industries - IT/ITeS, Auto, manufacturing, warehousing
World Tourism & India
Chart 10: Factors affecting Tourism
Source: World Economic Forum
Global Travel & Tourism (T&T) GDP grew by about 3.9% during 2018, outperforming the global economy that grew by 3.2%
during the year. Below table provides a country-wise contribution of T&T to GDP during the year.
Environment
Business environment
Safety & security
Health & hygeine
Human resource & labour market
Information Communication Technology (ICT)
Readiness
Policies & Enabling Conditions
Prioritizing Travel & tourism
International openness
Price competitiveness
Environmental sustainability
Infrastructure
Air trainsport Infra
Roads & ports Infra
Tourist service Infra
Natural & Cultural Resources
Natural resources
Cultural resources & business travel
Industry Insights I Indian Hotel Industry – Performance review
19
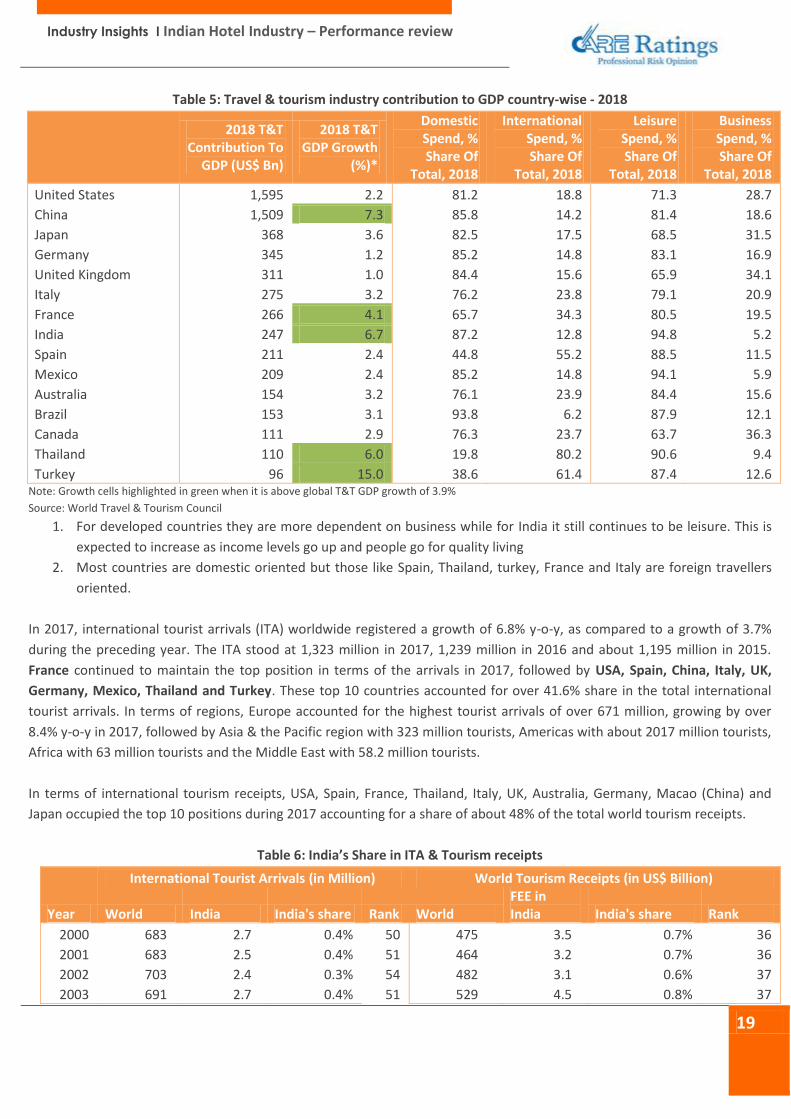
Table 5: Travel & tourism industry contribution to GDP country-wise - 2018
2018 T&T Contribution To
GDP (US$ Bn)
2018 T&T GDP Growth
(%)*
Domestic Spend, % Share Of
Total, 2018
International Spend, % Share Of
Total, 2018
Leisure Spend, % Share Of
Total, 2018
Business Spend, % Share Of
Total, 2018
United States 1,595 2.2 81.2 18.8 71.3 28.7
China 1,509 7.3 85.8 14.2 81.4 18.6
Japan 368 3.6 82.5 17.5 68.5 31.5
Germany 345 1.2 85.2 14.8 83.1 16.9
United Kingdom 311 1.0 84.4 15.6 65.9 34.1
Italy 275 3.2 76.2 23.8 79.1 20.9
France 266 4.1 65.7 34.3 80.5 19.5
India 247 6.7 87.2 12.8 94.8 5.2
Spain 211 2.4 44.8 55.2 88.5 11.5
Mexico 209 2.4 85.2 14.8 94.1 5.9
Australia 154 3.2 76.1 23.9 84.4 15.6
Brazil 153 3.1 93.8 6.2 87.9 12.1
Canada 111 2.9 76.3 23.7 63.7 36.3
Thailand 110 6.0 19.8 80.2 90.6 9.4
Turkey 96 15.0 38.6 61.4 87.4 12.6 Note: Growth cells highlighted in green when it is above global T&T GDP growth of 3.9% Source: World Travel & Tourism Council
1. For developed countries they are more dependent on business while for India it still continues to be leisure. This is
expected to increase as income levels go up and people go for quality living
2. Most countries are domestic oriented but those like Spain, Thailand, turkey, France and Italy are foreign travellers
oriented.
In 2017, international tourist arrivals (ITA) worldwide registered a growth of 6.8% y-o-y, as compared to a growth of 3.7%
during the preceding year. The ITA stood at 1,323 million in 2017, 1,239 million in 2016 and about 1,195 million in 2015.
France continued to maintain the top position in terms of the arrivals in 2017, followed by USA, Spain, China, Italy, UK,
Germany, Mexico, Thailand and Turkey. These top 10 countries accounted for over 41.6% share in the total international
tourist arrivals. In terms of regions, Europe accounted for the highest tourist arrivals of over 671 million, growing by over
8.4% y-o-y in 2017, followed by Asia & the Pacific region with 323 million tourists, Americas with about 2017 million tourists,
Africa with 63 million tourists and the Middle East with 58.2 million tourists.
In terms of international tourism receipts, USA, Spain, France, Thailand, Italy, UK, Australia, Germany, Macao (China) and
Japan occupied the top 10 positions during 2017 accounting for a share of about 48% of the total world tourism receipts.
Table 6: India’s Share in ITA & Tourism receipts
International Tourist Arrivals (in Million) World Tourism Receipts (in US$ Billion)
Year World India India's share Rank World FEE in India India's share Rank
2000 683 2.7 0.4% 50 475 3.5 0.7% 36
2001 683 2.5 0.4% 51 464 3.2 0.7% 36
2002 703 2.4 0.3% 54 482 3.1 0.6% 37
2003 691 2.7 0.4% 51 529 4.5 0.8% 37

Industry Insights I Indian Hotel Industry – Performance review
20
2004 762 3.5 0.5% 44 633 6.2 1.0% 26
2005 803 3.9 0.5% 43 680 7.5 1.1% 22
2006 847 4.5 0.5% 44 744 8.6 1.2% 22
2007 894 5.1 0.6% 41 857 10.7 1.3% 22
2008 917 5.3 0.6% 41 939 11.8 1.3% 22
2009 883 5.2 0.6% 41 853 11.1 1.3% 20
2010 948 5.8 0.6% 42 931 14.5 1.6% 17
2011 994 6.3 0.6% 38 1,042 17.7 1.7% 18
2012 1,039 6.6 0.6% 41 1,117 18.0 1.6% 16
2013 1,087 7.0 0.6% 41 1,198 18.4 1.5% 16
2014 1,137 13.1 1.2% 24 1,252 19.7 1.6% 15
2015 1,195 13.3 1.1% 24 1,217 21.0 1.7% 14
2016 1,239 14.6 1.2% 26 1,239 22.9 1.8% 13
2017 1,323 15.5 1.2% 26 1,332 27.3 2.1% 13 Source: Ministry of Tourism, UN World Tourism Organisation
As can be seen in the above table, India ranks 26th in terms of the international tourist arrivals in the world as of 2017, up
from ranking 50th in the year 2000. Also, in terms of world tourism receipts, India’s rank has improved to 13th in 2017 from
36th in the year 2000. Factors such as government push to tourism, initiatives like ‘Incredible India’ promoting the country’s
vast culture and safety, adoption of e-visas and visa on arrival, significance of medical tourism, rupee depreciation leading to
comparatively weaker currency for international tourists have enabled the country to make its position in the World
tourism. While the ‘Incredible India’ campaign was initiated in the year 2002, post the recession period and the Mumbai
terror attacks in 2008-09, the government increased its allocation to the tourism industry and appointed ambassadors to
promote the safety and the culture in India to attract tourists that were affected during the period. Various states such as
Madhya Pradesh, Gujarat, Uttar Pradesh, Tamil Nadu, North east cluster, etc have come up with their own promotional
campaigns to attract both foreign as well as domestic tourists. Also, states have their own websites promoting the states and
highlighting their architectural infrastructure, heritage sites, accommodation support, travel guides, events in the states, etc
thereby easing the process of planning and information gathering.
India Tourism
A. Domestic Tourists
Domestic tourist arrivals (DTA) are the tourists within India who travel to different places both for business and leisure
purposes. The domestic tourist arrivals grew by a marginal 2.7% y-o-y from 16,136 lakhs in 2016 to 16,575lakhs in 2017.In
CY18, DTAs witnessed a sharp double-digit growth of about 12% y-o-y to 18,549 lakh travelers. The growth in the domestic
tourist arrivals can be attributed to the, rising disposable income, popularizing weekend culture, the eagerness to spend
amongst the youth, government campaigns, introduction of low-cost airline services, connectivity by rail and road as well as
by air to smaller cities, increased trade and growing service sector. The travel to religious places like the Golden Temple,
Vaishno Devi and Tirupati amongst many and travel to leisure destinations like Goa, Shimla, Agra, Kerala, Jaipur etc. also are
the key growth drivers for hotels in the upscale category. Coupled with this, marriage at traditional locations amongst the
rich and the royal families is also a key growth driver for the upscale and heritage hotels in India, especially in Jaipur, Jodhpur
and Udaipur.

Industry Insights I Indian Hotel Industry – Performance review
21
Cities like Mumbai, Bengaluru and Delhi hosts both, business and leisure tourists but the share is skewed towards business
travellers. However, Tamil Nadu receives mostly leisure and medical tourists. Uttar Pradesh which boasts of the Taj Mahal is
a preferred destination for the leisure tourists. Tamil Nadu, Uttar Pradesh and Karnataka witnessed highest DTA flow during
CY18.
Domestic travellers continue to be the majority generators of room night demand in India. It is imperative to highlight that
the domestic spending accounts for about 87% of the overall spending as contribution to India’s direct travel and tourism
GDP as of 2018, while foreign visitor spending accounts for the remaining 13%, in terms of leisure spending, the segment
accounts for about 95% of the share while business spending accounts for meagre 5%. Going forward, with the rise in
spending by domestic travellers, domestic demand is also likely to grow at a healthy pace.
Chart 11: Trend in DTAs
Source: Ministry of Tourism, CMIE
Chart 12: State-wise DTAs
1997 2018
Source: Ministry of Tourism, CMIE
16
0
16
8
19
1
22
0
23
6
27
0
30
9
36
6
39
2
46
2
52
7
56
3
66
9
74
8
86
5
1,0
45
1,1
45
1,2
90
1,4
32
1,6
15
1,6
52
1,8
54
14.1% 15.4%
18.5% 17.9%
6.9%
18.8%
11.8% 12.8% 12.2%
0.0%
5.0%
10.0%
15.0%
20.0%
25.0%
-
200
400
600
800
1,000
1,200
1,400
1,600
1,800
2,000
19
97
19
98
19
99
20
00
20
01
20
02
20
03
20
04
20
05
20
06
20
07
20
08
20
09
20
10
20
11
20
12
20
13
20
14
20
15
20
16
20
17
20
18
Domestic Tourist Arrivals (in Million) Growth (%)
19 12 7 6 5 5 5 4 3 1
12%
7%
4% 4% 3% 3% 3% 2% 2%
1%
0%2%4%6%8%10%12%14%
-
5
10
15
20
Tam
il N
adu
Kar
nat
aka
Mah
aras
htr
a
Raj
asth
an
Ker
ala
Wes
t B
en
gal
J&K
Him
ach
al P
rad
esh
Od
ish
a
NC
T o
f D
elh
i
Top 10 States - DTA (in Mn) % share in total DTA
34
5
23
4
18
0
16
5
11
9
85
80
78
48
46
21%
14% 11% 10%
7% 5% 5% 5%
3% 3%
0%
5%
10%
15%
20%
25%
- 50
100 150 200 250 300 350 400
Tam
il N
adu
Utt
ar P
rad
esh
Kar
nat
aka
An
dh
ra P
rad
esh
Mah
aras
htr
a
Tela
nga
na
We
st B
en
gal
Mad
hya
Pra
des
h
Gu
jara
t
Raj
asth
an
Top 10 States - DTA (in Mn) % share in total DTA
Industry Insights I Indian Hotel Industry – Performance review
22
While Tamil Nadu retains its position in terms of DTAs, Madhya Pradesh, Gujarat, Uttar Pradesh, Telangana and Andhra
Pradesh have witnessed an increased number of tourists in the state followed by the state government initiatives and
promotions highlighting the vast cultural experiences the states have to offer. Over the years, these states have increased
spends on tourism promotion in order to attract the visitors from various parts of the country as well as the world.
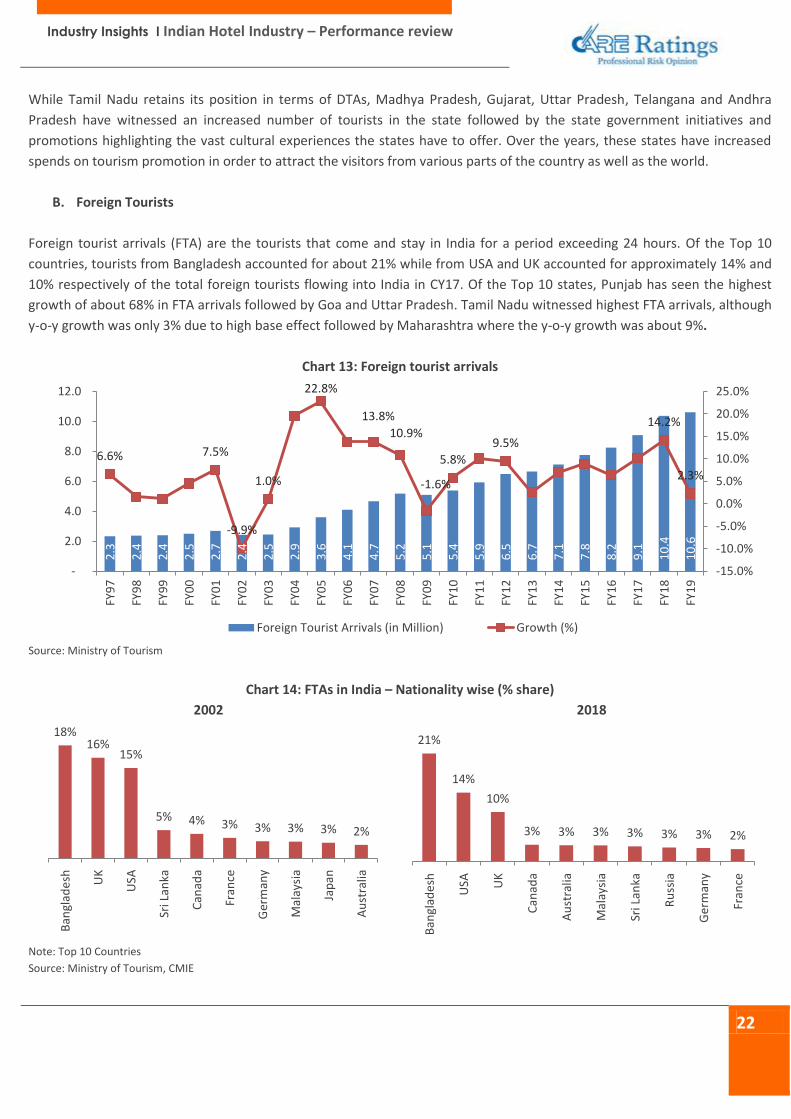
B. Foreign Tourists
Foreign tourist arrivals (FTA) are the tourists that come and stay in India for a period exceeding 24 hours. Of the Top 10
countries, tourists from Bangladesh accounted for about 21% while from USA and UK accounted for approximately 14% and
10% respectively of the total foreign tourists flowing into India in CY17. Of the Top 10 states, Punjab has seen the highest
growth of about 68% in FTA arrivals followed by Goa and Uttar Pradesh. Tamil Nadu witnessed highest FTA arrivals, although
y-o-y growth was only 3% due to high base effect followed by Maharashtra where the y-o-y growth was about 9%.
Chart 13: Foreign tourist arrivals
Source: Ministry of Tourism
Chart 14: FTAs in India – Nationality wise (% share)
2002 2018
Note: Top 10 Countries
Source: Ministry of Tourism, CMIE
2.3
2.4
2.4
2.5
2.7
2.4
2.5
2.9
3.6
4.1
4.7
5.2
5.1
5.4
5.9
6.5
6.7
7.1
7.8
8.2
9.1
10
.4
10
.6
6.6% 7.5%
-9.9%
1.0%
22.8%
13.8%
10.9%
-1.6%
5.8%
9.5%
14.2%
2.3%
-15.0%
-10.0%
-5.0%
0.0%
5.0%
10.0%
15.0%
20.0%
25.0%
-
2.0
4.0
6.0
8.0
10.0
12.0
FY9
7
FY9
8
FY9
9
FY0
0
FY0
1
FY0
2
FY0
3
FY0
4
FY0
5
FY0
6
FY0
7
FY0
8
FY0
9
FY1
0
FY1
1
FY1
2
FY1
3
FY1
4
FY1
5
FY1
6
FY1
7
FY1
8
FY1
9
Foreign Tourist Arrivals (in Million) Growth (%)
18% 16%
15%
5% 4% 3% 3% 3% 3% 2%
Ban
glad
esh UK
USA
Sri L
anka
Can
ada
Fran
ce
Ger
man
y
Mal
aysi
a
Jap
an
Au
stra
lia
21%
14%
10%
3% 3% 3% 3% 3% 3% 2%
Ban
glad
esh
USA U
K
Can
ada
Au
stra
lia
Mal
aysi
a
Sri L
anka
Ru
ssia
Ger
man
y
Fran
ce
Industry Insights I Indian Hotel Industry – Performance review
23
Top 10 countries in terms of FTAs in India remains largely stable with the some shares changing between 2002 and 2018.
While Bangladesh continues to hold the largest share for India at about 21% in 2018, up from 18% in 2002, share of USA &
UK together stands at about 24% as of 2018, down from about 31% during 2002. Other countries have largely maintained
their shares in the Indian tourism except for Japan that no longer holds a position in the top 10 countries. Russia accounts
for about 3% share of the FTAs in India
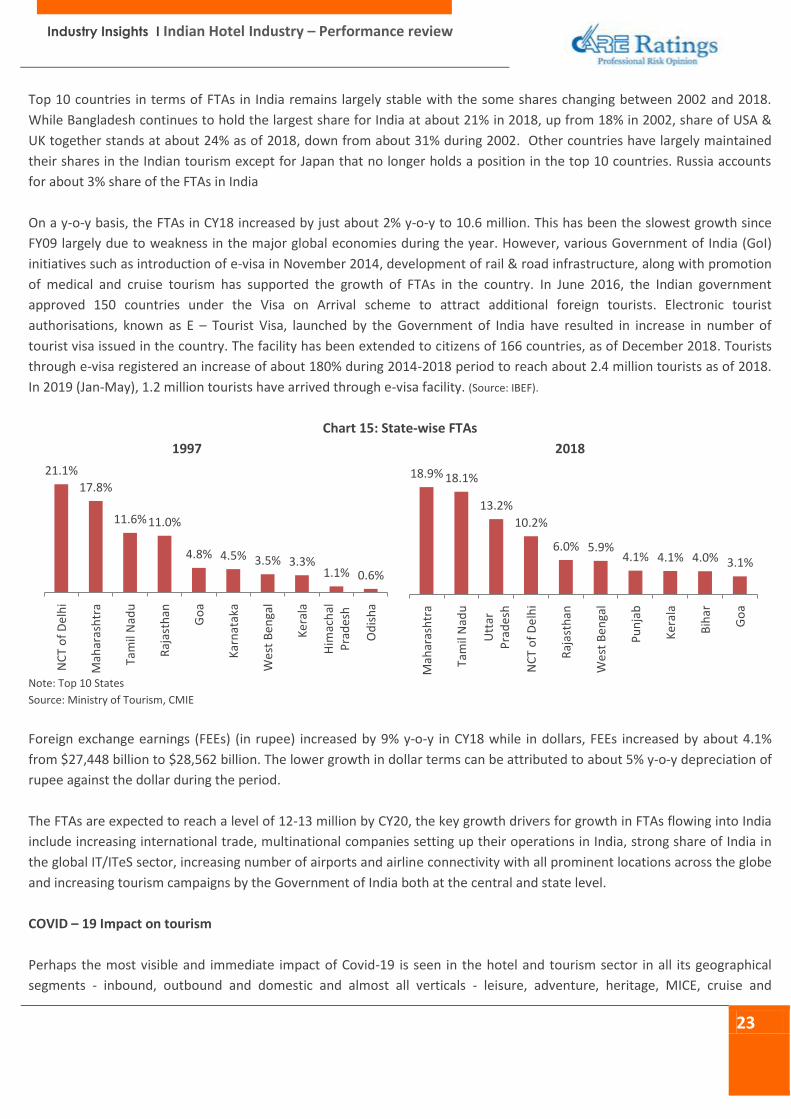
On a y-o-y basis, the FTAs in CY18 increased by just about 2% y-o-y to 10.6 million. This has been the slowest growth since
FY09 largely due to weakness in the major global economies during the year. However, various Government of India (GoI)
initiatives such as introduction of e-visa in November 2014, development of rail & road infrastructure, along with promotion
of medical and cruise tourism has supported the growth of FTAs in the country. In June 2016, the Indian government
approved 150 countries under the Visa on Arrival scheme to attract additional foreign tourists. Electronic tourist
authorisations, known as E – Tourist Visa, launched by the Government of India have resulted in increase in number of
tourist visa issued in the country. The facility has been extended to citizens of 166 countries, as of December 2018. Tourists
through e-visa registered an increase of about 180% during 2014-2018 period to reach about 2.4 million tourists as of 2018.
In 2019 (Jan-May), 1.2 million tourists have arrived through e-visa facility. (Source: IBEF).
Chart 15: State-wise FTAs
1997 2018
Note: Top 10 States
Source: Ministry of Tourism, CMIE
Foreign exchange earnings (FEEs) (in rupee) increased by 9% y-o-y in CY18 while in dollars, FEEs increased by about 4.1%
from $27,448 billion to $28,562 billion. The lower growth in dollar terms can be attributed to about 5% y-o-y depreciation of
rupee against the dollar during the period.
The FTAs are expected to reach a level of 12-13 million by CY20, the key growth drivers for growth in FTAs flowing into India
include increasing international trade, multinational companies setting up their operations in India, strong share of India in
the global IT/ITeS sector, increasing number of airports and airline connectivity with all prominent locations across the globe
and increasing tourism campaigns by the Government of India both at the central and state level.
COVID – 19 Impact on tourism
Perhaps the most visible and immediate impact of Covid-19 is seen in the hotel and tourism sector in all its geographical
segments - inbound, outbound and domestic and almost all verticals - leisure, adventure, heritage, MICE, cruise and
21.1%
17.8%
11.6% 11.0%
4.8% 4.5% 3.5% 3.3% 1.1% 0.6%
NC
T o
f D
elh
i
Mah
aras
htr
a
Tam
il N
adu
Raj
asth
an
Go
a
Kar
nat
aka
We
st B
en
gal
Ke
rala
Him
ach
alP
rad
esh
Od
ish
a
18.9% 18.1%
13.2%
10.2%
6.0% 5.9% 4.1% 4.1% 4.0% 3.1%
Mah
aras
htr
a
Tam
il N
adu
Utt
arP
rad
esh
NC
T o
f D
elh
i
Raj
asth
an
We
st B
en
gal
Pu
nja
b
Ke
rala
Bih
ar
Go
a

Industry Insights I Indian Hotel Industry – Performance review
24
corporate. Given various travel restrictions imposed by the Indian Government as well as Governments across the globe,
forward bookings for various conferences and leisure travel bookings to foreign destinations have already been cancelled. In
India, most of the summer holiday bookings have been cancelled (about 40-50% most of which was to states of Kerala,
Rajasthan and Goa) impacting the domestic tourism. The impact on the inbound and outbound passengers is expected to be
most severe in the next couple of quarters.
India’s total foreign tourist arrivals (FTA) stood at 10.9 million and the foreign exchange earnings (FEE) stood at Rs 210,971
crore during 2019 with Maharashtra, Tamil Nadu, Uttar Pradesh and Delhi accounting for about 60% of FTAs. However, now
with travel restrictions in India for over 80 countries and most of the flights of major airlines being suspended along with
lockdown in states of India till March 31, 2020, the Indian domestic as well as foreign travel and tourism industry is expected
to witness a sharp negative impact in 2020.
Table 7: Foreign tourist arrivals (FTA) (in million)
Month Foreign Tourist Arrivals
(in Mn nos.) Foreign Exchange Earnings
(in Rs. crore)
2017 2018 2019 2017 2018 2019
January 1.0 1.0 1.1 16,135 17,755 18,079
February 1.0 1.0 1.1 15,790 17,757 17,912
March 0.9 1.0 1.0 14,667 17,222 16,125
April 0.7 0.7 0.8 14,260 15,620 17,061
May 0.6 0.6 0.6 12,255 12,753 13,541
June 0.7 0.7 0.7 12,971 14,398 15,963
July 0.8 0.8 0.8 14,796 16,976 18,191
August 0.7 0.8 0.8 13,811 16,492 17,817
September 0.7 0.7 0.8 13,840 15,150 16,791
October 0.9 0.9 0.9 14,213 14,701 17,043
November 1.0 1.0 1.1 16,528 16,584 19,831
December 1.2 1.2 1.2 19,381 19,474 22,617
Total 10.1 10.6 10.9 1,78,647 1,94,882 2,10,971
Growth rate (%) 14.8% 4.4% 3.2% 15.9% 9.1% 8.3% Source: Ministry of Tourism
Assuming the impact to be about 50% during January and February 2020, while the impact being higher at about 70% during
March 2020 post the suspension of international flights and about 100% during Q2 2020 (April – June 2020) on the overall
foreign travellers with travel advisories being put out, the Indian tourism industry is expected to book revenues of Rs 69,400
crore during H1 2020, a y-o-y loss of over 30% during the period. During H2 2020, assuming the virus impact subsides, we
expect FTAs to still be lower affecting the FEEs by about 50% to reach Rs 56,150 crore vis-à-vis Rs 112,300 crore during H2
2019. Therefore, for the year 2020, the industry is expected to book a revenue loss of Rs 125,550 crore, loss of over 40% y-
o-y
Challenges faced by Hotels in India
1. Government approvals and licenses
- Major issues for most of the industries in India are related to multiple windows of clearances, even for the hotel
industry. Hoteliers face regulatory constraint at every step in the process of development of hotels beginning from
Industry Insights I Indian Hotel Industry – Performance review
25
land acquisition stage (for which laws differ from state-to state) to approval by various ministries & association on
various matters.
- A company requires approximately 100 clearances for setting up an upscale category hotel in India. The clearances
have to be taken from multiple government bodies. It is tedious and a time-consuming process.
2. Land availability and cost issues
- The process of identifying new land parcels as per the requirement for hotels is a tedious task in India. Compared to
international standards, where land costs accounts for 15-20% of the total project cost, in India this is often in the
range of 40-50%. This is also one of the reasons for low development of budget & mid-market hotels in comparison
to upscale luxury hotels as budget hotels with lower average rates are unlikely to become viable with such high land
cost. As a remedy to the problem, hoteliers have started mixed-use development projects comprising hospitality,
commercial, residential and retail components.
3. Human Capital
- Indian hotels face the continued challenge of shortage of trained employees, especially at the manager and
supervisor levels. Most of the companies are falling short of skilled employees for their hotels. Major reason for this
shortage is absence of organized training and educational institutes for development of skilled employees like in
aviation and other service sectors. Only few major Indian players like Taj, Oberoi and ITC have set up their training
institutes with a few international brands like IHG, Carlson etc. Also, hotel and catering management institutes
approved by All India Council of Technical Education (AICTE) is less than adequate and much of the talent graduating
each year is unsuited for direct employment in the industry due to lack of required skills.
- Retaining the workforce even through training and development in the hotel industry is a tedious task as attrition
levels are too high. One of the reasons for this is unattractive wage packages. Though the industry has been growing
at a fast pace, hotel management graduates opt to join other sectors like aviation and catering services where they
are paid higher.
4. Management Contract related issues
- Performance clause in management contracts is one of the most debated clauses between owners and operators of
the hotel. It is most often the only clause that provides a window for an owner to terminate the management
contract with the brand. However, unlike in other industries where a client has the choice to reject/ discontinue a
product/ service if he/she is dissatisfied with the performance, hotel owners do not enjoy such a privilege and in
turn have to pay a hefty termination fee to disengage with the operator.
- Also, owners are seldom informed/ involved in the hotel operations. Non-involvement of owners in hotel operations
and lack of transparency can result in a gap for desired objectives. Such non coordination between owners and
operators pose a threat to the industry.
Emerging market trends
Indian Online Travel Market
India’s total internet subscribers’ base as of FY19 stood at about 563 million compared with meagre 14.8 million as of FY97.
The penetration of internet stands at over 40% which is comparatively lower than developed markets like the United States
and the United Kingdom but is growing at a much faster rate. India's e-commerce market was worth about $2.5 billion in
2009, it went up $38.5 billion in 2017. Approximately about 75% of this is travel related. Also, as per the telecom regulator

Industry Insights I Indian Hotel Industry – Performance review
26
TRAI, at the end of December 2019, India had 1,172 million wireless subscribers. With this increased emergence of
smartphone in India, providing an easy access to internet and various applications, it is readily becoming a major source of
travel bookings including hotel bookings.
Online Travel Market has always been predominantly known for Air Ticketing followed by Rail Ticketing. However, with the
infusion of global travel brands, increased number of internet savvy people and large number of new hotel openings by
various national and international brands at different domestic locations, online hotels and package bookings has emerged
as a prospective opportunity for both online travel companies and hoteliers. In addition to online air ticketing, online hotel
bookings has become a major revenue contributor to the online travel company in the recent past.
Going digital
The Indian Ministry of Tourism has started using social media to promote tourism sites throughout the country. It joined
Facebook in January 2013. 70% of all 4 and 5 star hotels in first tier cities in India had established their presence in social
media by August 2013. Leading Indian airline Jet Airways put social media at the centre of its marketing, involving 10
different departments in its social media activities targeting consumers.
A considerable increase has been seen across all star categories in reservations using Online Reservation Systems,
hotel/chain websites and Chain CRS (central Reservation System), with the All-India average increasing from meagre 10.3%
in FY13 to 31.2% in FY18. At the same time, Direct Enquiries or reservations made through Hotel Representatives, Travel
Agents and Tour Operators (still accounting for about 50% of the total reservations) have declined significantly over the past
few years. In keeping with the growing importance of maintaining a positive and impactful online presence, hotels have
redirected their marketing efforts towards digital marketing mediums. Hotels are now using their Hotel Website to reach
customers where marketing media measures such as Pay per Click increased to 17.4% in FY18 and Promotions have gone up
to 75% in FY18 vis-à-vis 67.3% in FY13.
Also, for payments, cash sales accounted for the largest share of about 42% during FY05 while credit card sales stood at
about 32.5%. In FY18, credit card sales accounted for the largest share in the all India average with about 37.5%, up from
32% in FY05, followed by cash sales at 27.6% as of FY18. Credit sales (other than cards) stands at about 19.3% (vis-à-vis
23.9% in FY05) while ETF (Electric Fund Transfer) accounts for about 15.7% as of FY18 vis-à-vis a negligible share of about
1.5% in FY05. While there no evidence of generating higher demand, use of electronic payments method or plastic money
method have significantly increased in the last few years with easy availability of credit, improved standard of living,
technological upgradations thereby improving the overall efficiency of the industry.
Financial Performance
CARE has analysed the basic revenue and cost structure of the organised hotel industry in India based on 53 companies.
After declining by about 2.4% in FY18, net sales (revenue) of the industry witnessed a y-o-y growth of about 3.5% in FY19.
Revenue registered a marginal CAGR growth of about 0.5% for the 3 year period between FY17 and FY19. While the
hospitality industry demand slowdown was generally due to slowdown in the economy during FY18, the decline in net
profits was largely led by one company in the set that recorded an exceptional loss during the year. However, during FY19,
demand for hospitality industry improved on back of demand from domestic travellers and increased MICE activities during
the year. Also, with GST implementation and processes in place, the industry sentiment remained optimistic.
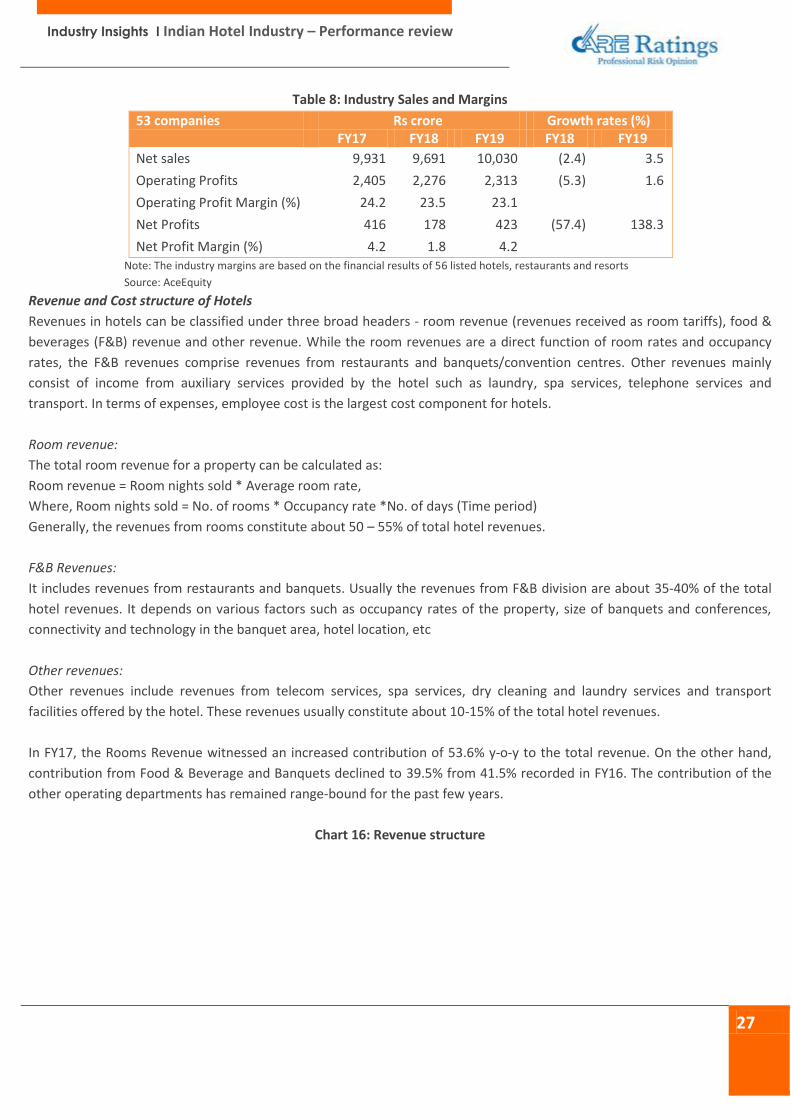
Industry Insights I Indian Hotel Industry – Performance review
27
Table 8: Industry Sales and Margins
53 companies Rs crore Growth rates (%) FY17 FY18 FY19 FY18 FY19
Net sales 9,931 9,691 10,030 (2.4) 3.5
Operating Profits 2,405 2,276 2,313 (5.3) 1.6
Operating Profit Margin (%) 24.2 23.5 23.1
Net Profits 416 178 423 (57.4) 138.3
Net Profit Margin (%) 4.2 1.8 4.2
Note: The industry margins are based on the financial results of 56 listed hotels, restaurants and resorts
Source: AceEquity
Revenue and Cost structure of Hotels
Revenues in hotels can be classified under three broad headers - room revenue (revenues received as room tariffs), food &
beverages (F&B) revenue and other revenue. While the room revenues are a direct function of room rates and occupancy
rates, the F&B revenues comprise revenues from restaurants and banquets/convention centres. Other revenues mainly
consist of income from auxiliary services provided by the hotel such as laundry, spa services, telephone services and
transport. In terms of expenses, employee cost is the largest cost component for hotels.
Room revenue:
The total room revenue for a property can be calculated as:
Room revenue = Room nights sold * Average room rate,
Where, Room nights sold = No. of rooms * Occupancy rate *No. of days (Time period)
Generally, the revenues from rooms constitute about 50 – 55% of total hotel revenues.
F&B Revenues:
It includes revenues from restaurants and banquets. Usually the revenues from F&B division are about 35-40% of the total
hotel revenues. It depends on various factors such as occupancy rates of the property, size of banquets and conferences,
connectivity and technology in the banquet area, hotel location, etc
Other revenues:
Other revenues include revenues from telecom services, spa services, dry cleaning and laundry services and transport
facilities offered by the hotel. These revenues usually constitute about 10-15% of the total hotel revenues.
In FY17, the Rooms Revenue witnessed an increased contribution of 53.6% y-o-y to the total revenue. On the other hand,
contribution from Food & Beverage and Banquets declined to 39.5% from 41.5% recorded in FY16. The contribution of the
other operating departments has remained range-bound for the past few years.
Chart 16: Revenue structure

Industry Insights I Indian Hotel Industry – Performance review
28
Source: FHRAI
Employee costs are one of the largest cost components of the hotels accounting for about 25-30% of the total expenditure.
Hotels therefore have large fixed costs and marginal costs per additional guests are comparatively low. Selling & distribution
(S&D) costs account for about 15-20% of the operating costs which includes advertising expenses and marketing costs.
Power & fuel account for 8-10%. Also, the F&B consumes about 10-15% of the costs on an average. Other operating costs
account for the remaining 35-40% of the costs that include the repairs and maintenance, travelling expenses, etc. among
others.
Chart 17: Cost Structure
Source: AceEquity, CARE Ratings
Investments
In term of investments in travel & tourism, India is the third largest globally with an investment of US$ 45.7 billion in 2018,
accounting for 5.9% of national investment. (Source: IBEF). In 2011, to attract both foreign as well as domestic tourists post the
recession and the Mumbai terror attacks that affected demand in the country, the government made huge investments in its
‘Incredible India’ campaign to highlight safety and security in the country as well as building the favourable infrastructure for
the industry.
52.2% 51.3% 50.9% 51.7% 53.6% 51.9%
41.2% 41.9% 42.6% 41.5% 39.5% 41.3%
6.6% 6.9% 6.6% 6.8% 6.9% 6.8%
FY13 FY14 FY15 FY16 FY17 FY18Rooms F&B Others
Employee Cost
25-30%
S&D Cost 15-20%
F&B Consumed
10-15%
Power & Fuel 8-10%
Others 35-40%

Industry Insights I Indian Hotel Industry – Performance review
29
Chart 18: Investments in the Sector (Rs Billion)
Source: CMIE
The Insolvency and Bankruptcy Code, 2016 (IBC) has had the biggest impact on hotel asset sales since the year 2001, which
witnessed the disinvestment of 13 hotels of India Tourism Development Corporation (ITDC). While the disinvestment laid the
road for the hotel transactions market in the country, the IBC restricted the volume of sales having a short-term impact on
the industry after having peaked in 2015. The hotel transaction volumes contracted in 2018 to its lowest since 2005 in dollar
terms however; in Indian Rupee terms the total volume recorded was about 6% higher than that in 2005.
Chart 19: Indian Hotel Transactions (Volume) – 2001 – 2018
Source: HVS, FHRAI
- In Union Budget FY21, an allocation of Rs 3,150 crore to the Ministry of Culture and Rs 2,500 crore building tourism
infrastructure and for promotion and publicity has been made. Also, the Finance minister proposed develop 5
archaeological sites into Iconic Tourism destinations with onsite Museums to enhance visitor’s experience (both
domestic & foreign travelers), setting up of a Tribal Museum in Ranchi (Jharkhand) and setting up of Maritime
Museum in Ahmedabad which is expected to increase tourism and benefit the room demand in those locations
- Proposal has also been made to establish an Indian Institute of Heritage and Conservation under Ministry of Culture,
providing knowledge in disciplines such as museology and archaeology in order to provide trained man-power
52 44
13 30
16 25 14 14 45
29 53
124
216 185 179
161 133
119
21
57 73
54 24 19
3 - 4 - -
99
24 2 6
61 31
12 18 17
51
266
47 37 38 42
76
42 27 34
FY9
6
FY9
7
FY9
8
FY9
9
FY0
0
FY0
1
FY0
2
FY0
3
FY0
4
FY0
5
FY0
6
FY0
7
FY0
8
FY0
9
FY1
0
FY1
1
FY1
2
FY1
3
FY1
4
FY1
5
FY1
6
FY1
7
FY1
8
FY1
9
Hotels & restaurants Tourism
USD
48
Mn
R
s 2
,31
7 M
n
USD
23
3 M
n
Rs
11
,36
2 M
n
USD
22
Mn
R
s 1
,03
0 M
n
USD
7 M
n
Rs
32
0 M
n U
SD 1
58
Mn
R
s 6
,92
0 M
n
USD
10
9 M
n
Rs
5,0
50
Mn
USD
17
0 M
n
Rs
6,8
66
Mn
USD
23
2 M
n
Rs
10
,44
4 M
n
USD
29
6 M
n
Rs
14
,43
5 M
n
USD
25
1 M
n
Rs
11
,70
0 M
n
USD
23
3 M
n
Rs
10
,90
2 M
n
USD
32
9 M
n
Rs
16
,73
0 M
n
USD
12
6 M
n
Rs
7,2
39
Mn
USD
18
4 M
n
Rs
11
,19
8 M
n
USD
30
6 M
n
Rs
19
,92
9 M
n
USD
15
8 M
n
Rs
10
,50
0 M
n
USD
25
7 M
n
Rs
17
,39
5 M
n
USD
78
Mn
R
s 5
,35
4 M
n
20
01
20
02
20
03
20
04
20
05
20
06
20
07
20
08
20
09
20
10
20
11
20
12
20
13
20
14
20
15
20
16
20
17
20
18

Industry Insights I Indian Hotel Industry – Performance review
30
- The tourism and hospitality sector is among the top 10 sectors in India to attract the highest Foreign Direct
Investment (FDI). Under the automatic route, 100% FDI is allowed for tourism and hospitality industry in India,
subject to applicable regulations and laws - Also, 100% FDI is allowed in tourism construction projects, including the development of hotels, resorts and
recreational facilities in India
- Ministry of Tourism launches Audio Guide facility App called Audio Odigos for 12 sites of India (including iconic sites)
- During the period April 2000-June 2019, the hotel and tourism sector attracted around US$ 12.99 billion of FDI,
according to the data released by Department for Promotion of Industry and Internal Trade (DPIIT).
GST implications on Hotel industry
In September 2019, the GST Council lowered the tax to 18% from the earlier 28% on hotel rooms with a tariff above Rs
7,500. Rooms with tariffs between Rs 1,000 and Rs 7,500 will now attract 12% tax rate from the earlier rate of 18% and
rooms with tariff below Rs 1,000 have been exempt from any GST
Table 9: Revised GST rates for Hotels and Restaurants (Applicable as of October 1, 2019)
Services
Pre GST Regime Post GST Regime Central Taxes State Taxes
A/c or non a/c restaurant (standalone or chained) 5%^
Restaurant located within a hotel with room tariff over Rs 7,500
15% on service component^^
12.5% for food bill 18.0%*
20.0% for alcohol bill
Accommodation in hotels, guest houses, etc. where room tariff is less than Rs 1,000 per day
- - Nil
Accommodation in hotels, guest houses, etc. with room tariff between Rs1,000/- and Rs 7,500/- per day
9% 10% 12.0%^
Accommodation in hotels, guest houses, etc. where room tariff is above Rs 7,500/- per day
9% 10% 18.0%^
Note: ^Without input tax credit
*With input tax credit
^^ Considered to be 40% of the bill amount + service charges.
Source: CBEC
The GST on restaurants in 5 star and luxury hotels continues to be 18%, with a provision of input tax credit. Food &
beverages form 30-40% revenue for 5 star hotels.
With GST rates now at 18% for premium hotels (room tariff above Rs 7,500 per day), average room rates are expected to
improve going forward, as the industry had seen some moderation in FY18 for 5D & 5 star hotels post initial implementation
of GST rate of 28% for such hotels.
Under GST regime, the overall tariffs for premium hotels (four star and above) may see a decline, which may have
further positive impact on the demand which had seen a pick-up in the last financial year.

Industry Insights I Indian Hotel Industry – Performance review
31
Further, the practice of bundling of meals with room tariffs may see a decline, especially for 4starand above category
hotels, as higher tariffs above the stipulated levels of Rs 7,500 per day may attract higher tax rates.
Hotels having centralized registration will have to get registered in each state whether providing hotel services on own
account or through agent (franchise)
The biggest relaxation for the industry is the ease of compliance for the industry as there would be no different taxes for
the different services provided by the industry.
GST would benefit the industry by the input credit system by reducing the overall tax flow for the industry, as earlier
they did not have the option to set-off the taxes already paid on inputs of the industry.
Also, the slashing of GST on restaurants to 5%, it is expected to have a positive impact on the footfalls and increase the
propensity of dining out
Concluding remarks & Outlook:
In terms of ORs, after witnessing growth between FY97 and FY08, occupancy rates declined for all cities in FY09 and FY10
led by the macro-economic factors that were affected due to the financial crisis and the Mumbai terror attacks that
jeopardised the tourism in the country during the period. Due to increased investments in marketing and higher demand
from businesses as well as leisure demand in the region, hotel markets in Pune, Ahmedabad, Hyderabad, Jaipur,
Mumbai, Bengaluru and Agra witnessed a positive growth during the period between FY11 and FY19 while Goa, Kolkata,
New Delhi and Gurgaon witnessed slower growth during the period. Noida and Chennai markets witnessed a decline in
ORs during the period.
ARRs, on the other hand witnessed higher growth between FY97 and FY09, post which most of the cities went in for
expansions and supply increased. However, with increased supply, competition increased as well which lead to a decline
in ARRs between FY09 and FY16. The average room rates have witnessed a marginal uptick between FY17 and FY19 on
back of lower supply additions in the market as well as increased demand, foreign as well as domestic.
In terms of tourism, the growth rates have been quite inconsistent over the last 25 years. However, during the major
events in FY09, the country did witness a decline both in domestic as well as foreign travellers led by the financial
recession that impacted the world economy. Further the terror attacks in Mumbai jeopardised the international as well
as domestic tourism in India.
With government efforts to promote India as a safe tourism destination and initiatives like ‘Incredible India’ promoting
the country’s vast culture and safety, adoption of e-visas and visa on arrival, significance of medical tourism, rupee
depreciation leading to comparatively weaker currency for international tourists have enabled the country to make its
position in the World tourism. India ranked 26th in terms of the international tourist arrivals in the world as of 2017, up
from ranking 50th in the year 2000. Also, in terms of world tourism receipts, India’s rank has improved to 13th in 2017
from 36th in the year 2000.
Hotel industry revenues stood at Rs 10,030 crore as of FY19 (3.5% y-o-y growth vis-à-vis FY18). Hotels which derives
higher share of revenue from foreign passengers and food & beverages segment will be the worst affected. Cost-cutting
measures are the need of hour. Hotel entities which will be quick in trimming down the unnecessary costs and
implement various efficiency improvement measures will be able to cut down the damage better. Employee costs are
one of the largest cost components of the hotels accounting for about 25-30% of the total expenditure.
Hotel sector is characterized by long gestation period. Hotel entities with recent expansions or groups with a higher
portfolio of new assets compared to mature assets will face additional heat on their already weak financials. With high
debt repayments and squeezed profitability, these entities may witness tightening in their liquidity and credit profile.
Furthermore, hotels need to revisit their capex plans as the Covid-19 impact is expected to derail the future growth.

Industry Insights I Indian Hotel Industry – Performance review
32
While certain demand is expected to be impacted on account of the ongoing Covid-19 concern, India is also expected
to benefit from it as demand for MICE from other Asian countries is expected to be diverted to India to some extent,
benefits of which will be seen only be seen post FY21
On back of marginally positive sentiments for the domestic tourism and MICE led by social and industrial activities, we
expect the momentum to pick up going forward and the industry to register a growth of about 3-5% in revenues for
FY20-FY21.
The expected future inventory in 11 major markets (across categories - only branded) is lower at around 50,170 rooms
for the next 5 years (FY19 to FY24). Therefore, with increasing demand on back of improvement in economic activities
and lower room additions, we expect the major markets in the industry to sustain the average room rates (ARRs) going
forward and grow at an average of 3.5-4.5% per annum. Also, we expect the occupancy to inch up to an average of
about 68-70% by the end of FY22 compared with 66.7% in FY19.
Accordingly, the hotels industry is expected to see an increase in room revenue at the rate of about 6-8% CAGR over
the next 3 years.
The sector continues to face several challenges in terms of complex regulatory environment and inadequate tourism
infrastructure.
Goods and Services Tax (GST) has been implemented from July 1, 2017, with the aim of replacing the indirect taxes on all
goods and services. In September 2019, the GST for hotel accommodation with room tariff above Rs 7,500 has been
revised to 18% from the earlier rate of 28%. Rooms with tariffs between Rs 1,000 and Rs 7,500 will now attract GST of
12% while that below Rs 1,000 have been exempt from any GST. Accordingly, we at CARE Ratings believe that the
effective tax rate is expected to provide some impetus to the hotel industry in terms of average room rates going
forward.

Industry Insights I Indian Hotel Industry – Performance review
33
Annexure
Hotels - Star Category Classification
Criteria 1 & 2 Star 3 Star 4 Star
5 Star & 5-D
Comments
General
24 hour lifts for buildings higher than ground plus two floors
N N N N
Mandatory for all hotels. Local laws may require a relaxation of this condition. Easy access for differently abled guests
All floor surfaces clean and in good shape
N N N N Floor may be of any type
Parking facilities D N N N
Should be adequate in relation to the number of rooms & banquet / convention hall capacities. Exclusively earmarked accessible parking nearest to the entrance for differently abled guests
Guest Room
Minimum size of bedroom excluding bathroom in sq. ft.
120 130 140 200 Single occupancy rooms may be 20 sq. ft. less. Rooms should not be less than the specified size.
Air-conditioning - % of Rooms 25% 50% 100% 100%
Air-conditioning / heating depends on climatic conditions & architecture. Room temp. Should be between 20cto 28c.
Suites D D N N 2% of room block with a minimum of 1 suite room
Minibar/Fridge D D N N
All 3 Star hotels shall have the facility of a mini fridge and all 4 Star, 5 Star and 5 Star deluxe shall have the facility of mini bar with effect from 1.4.2014. Contents must conform to local laws
Shelves/Drawer space N N N N Necessary for hotels of 1, 2 & 3 Star category to have a wardrobe.
Wardrobe with minimum 4 clothes hangers per bedding
N N N N In 1 star or 2 star hotels this may be without doors
Sufficient lighting, 1 per bed N N N N
A 5 amp earthed power socket N N N N
A bedside table and drawer N N N N 1 per two twins and two for a double bed.
Opaque curtains or screening at all windows
N N N N All 4 Star, 5 Star and 5 Star deluxe hotels shall install blackout curtains by 1.4.2015

Industry Insights I Indian Hotel Industry – Performance review
34
TV - cable if available N N N
Mandatory for 3*, 4*, 5* and 5* Deluxe category and TV must have remote. Exception: For Eco and Nature Resort, TV Cable is not mandatory for 3*,4*,5*,5* Deluxe category. However, it is mandatory that they provide a Television with cable in lobby or other common area.
Bathroom
Number of rooms with attached bathrooms
All All All All
It will be mandatory w.e.f. 01.09.2010 for all 1 & 2 Star category hotels to have attached bathrooms. All bathrooms to have sanitary bin with lid
Minimum size of bathroom in sqft 30 36 36 45 25% of bathroom in 1 & 2 Star hotels to have western style WC. No higher ceiling / cap on the maximum size
Guest toiletries to be provided - minimum 1 new soap per guest
N N N N Quality products depending on the star category
Bottled toiletry products to be provided
D D N N
Floors and walls to have non - porous surfaces
N N N N
All Star hotels shall provide water sprays or bidets or washlets or other modern water based post-toilet-paper hygiene facilities.
N N N N
This condition shall be applicable to all new hotels that will start operating from 1.4.2016. For the hotels which have come into operation or will come into operation before 31.3.2016, these facilities will be mandatory from 1.4.2022.
Hot and cold running water available 24 hours
N N N N
It will be mandatory w.e.f. 01.09.2010 for all 1 & 2 Star category hotels to provide hot & cold running water
Public Area Valet (Parking) services to be available
D N N N
Lounge or seating area in the lobby
N N N N
Lobby shall have furniture and fixtures which shall include chairs /arm chairs, sofa, tables and fresh floral display.
Food & Beverage
1 Star & 2 Star category
1 & 2 Star categories should have minimum one dining room serving all meals. Room service not necessary
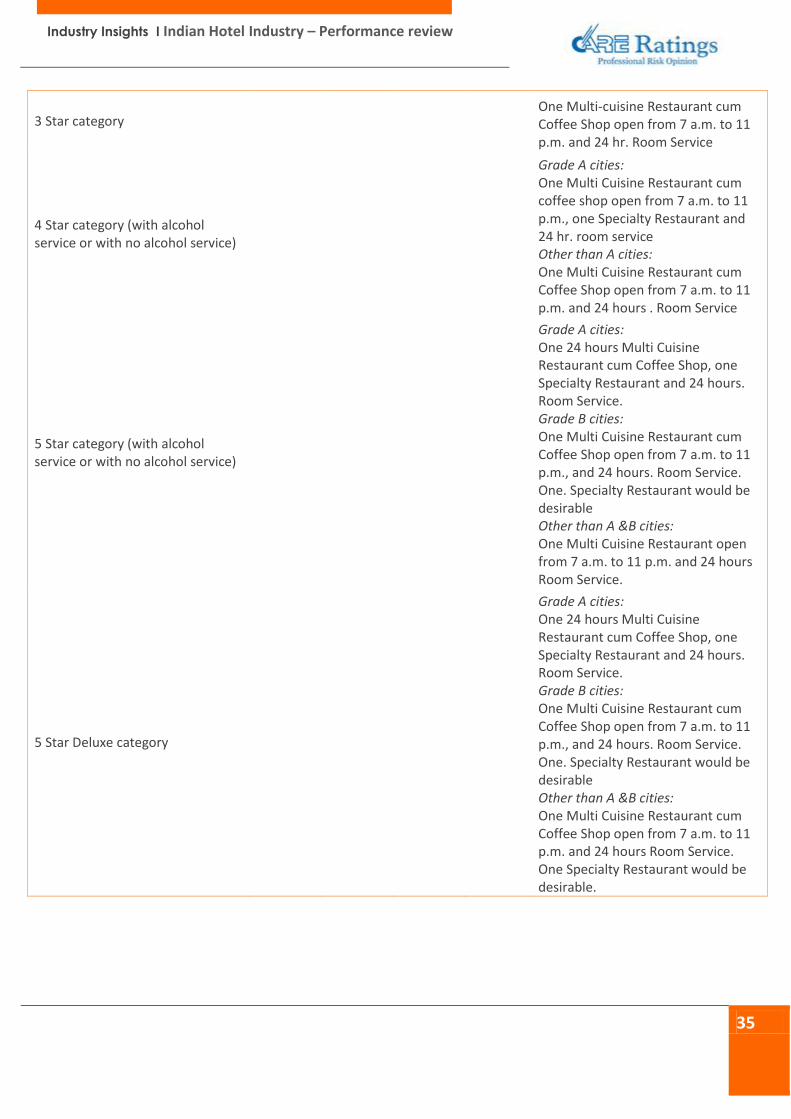
Industry Insights I Indian Hotel Industry – Performance review
35
3 Star category One Multi-cuisine Restaurant cum Coffee Shop open from 7 a.m. to 11 p.m. and 24 hr. Room Service
4 Star category (with alcohol service or with no alcohol service)
Grade A cities: One Multi Cuisine Restaurant cum coffee shop open from 7 a.m. to 11 p.m., one Specialty Restaurant and 24 hr. room service Other than A cities: One Multi Cuisine Restaurant cum Coffee Shop open from 7 a.m. to 11 p.m. and 24 hours . Room Service
5 Star category (with alcohol service or with no alcohol service)
Grade A cities: One 24 hours Multi Cuisine Restaurant cum Coffee Shop, one Specialty Restaurant and 24 hours. Room Service. Grade B cities: One Multi Cuisine Restaurant cum Coffee Shop open from 7 a.m. to 11 p.m., and 24 hours. Room Service. One. Specialty Restaurant would be desirable Other than A &B cities: One Multi Cuisine Restaurant open from 7 a.m. to 11 p.m. and 24 hours Room Service.
5 Star Deluxe category
Grade A cities: One 24 hours Multi Cuisine Restaurant cum Coffee Shop, one Specialty Restaurant and 24 hours. Room Service. Grade B cities: One Multi Cuisine Restaurant cum Coffee Shop open from 7 a.m. to 11 p.m., and 24 hours. Room Service. One. Specialty Restaurant would be desirable Other than A &B cities: One Multi Cuisine Restaurant cum Coffee Shop open from 7 a.m. to 11 p.m. and 24 hours Room Service. One Specialty Restaurant would be desirable.

Industry Insights I Indian Hotel Industry – Performance review
36
Grade A: Delhi,** Mumbai, Kolkata, Chennai, Bangalore, Pune, Hyderabad, Secunderabad Grade B: Cities in the rest of the country excluding Grade ‘A’ cities Grade C: Cities in the rest of the country
Note: The Ministry of Tourism may review and revise the cities falling under the Grade ‘A’ – Grande ‘B’ from the time to time. **Delhi would include the hotels falling in Gurgaon, Faridabad, Ghaziabad, NOIDA, and Greater NOIDA”
Kitchen/Food Production Area
Refrigerator with deep freezer N N N N Capacity based on size of F & B service
Segregated storage of Meat, fish and vegetables
N N N N Meat, fish and vegetables in separate freezers
Drinking water N N N N Water treated with UV + filtration Garbage to be segregated - wet and dry
N N N N To encourage recycling
Wet garbage area to be air- conditioned
D N N N
Guest Services
Iron and Iron Board facility D D N N
Iron and iron board to be made available on request in 1 to 3 Star category hotels on complimentary basis. For 4, 5, 5 Star Deluxe categories to be available in the room on complimentary basis.
Dry- cleaning /laundry D D D N In house for 5 Star Deluxe hotels. For 5 Star category and below may be outsourced
Paid transportation on call D N N N Guest should be able to travel from hotel
Acceptance of common credit cards and facility / infrastructure for accepting/ making payments by digital transactions.
N N N N
Wake - up call service on request N N N N Name Address and telephone numbers of doctors with front desk
N N N N
Newspapers available D D N N This may be placed in the lounge for 1, 2 & 3 Star hotels
Stamps and mailing facilities D N N N
Access to travel desk facilities N N N N This neednot be on the premise for 1, 2 & 3 Star categories
Health - Fitness facilities D D D N Indian system of treatments should preferably be offered
Conference Facilities D D D N
Safety & Security
CCTV Cameras at strategic locations N N N N
Smoke Detectors N N N N These can be battery Operated

Industry Insights I Indian Hotel Industry – Performance review
37
Utility shop / kiosk D D D N
The presence of a utility kiosk/shop will not be a mandatory condition for classification under one to four Star categories. For 5 Star & 5 Star Deluxe categories one utility kiosk or shop will be a must. No separate book shop shall be necessary
Metal detectors (door frame or hand held)
D N N N
Security arrangements for all hotel entrances
N N N N
Communication Facilities
Telephone facility within arm’s reach of the toilet seat.
D D N N
All hotels in the categories 4 Star, 5 Star & 5 Star Deluxe shall provide a telephone within an arm’s reach of the toilet seat. This condition shall be applicable to all new hotels that will start operating from 1.4.2016.
A telephone for incoming & outgoing calls in the room.
N N N N
4 star and above should have direct dialing and STD / ISD facilities. 1,2 and 3 Star category hotels may go through a telephone exchange
PC available for guest use with internet access
D N N N
This can be a paid service. Up to 3 Star, PC can be in the executive offices, Internet subject to local access being available
Swimming Pool D D D N
This can be relaxed for hill destinations. Mandatory to have trained Life Guard. Board containing Do’s & Don’ts, No Diving sign, pool depth etc. should be displayed at a strategic location in the pool area All 4 Star, 5 Star and 5 Star Deluxe hotels shall provide a luminous LED wall clock with numerals of three inches or more on display near their swimming pools. It will be desirable for all 5 Star Deluxe hotels to have air-conditioned porches and heated swimming pools.
Note: D – Desired, N - Necessary Source: Ministry of Tourism
CORPORATE OFFICE: CARE RATINGS LIMITED Corporate Office: 4th Floor, Godrej Coliseum, Somaiya Hospital Road, Off Eastern Express Highway, Sion (East), Mumbai - 400 022.CIN: L67190MH1993PLC071691 Tel: +91-22-6754 3456 I Fax: +91-22-6754 3457 E-mail: [email protected] I Website: www.careratings.com
Follow us on /company/CARE Ratings
/company/CARE Ratings