April 27, 2004 Radioactive contamination around Jadugoda ... · Radioactive contamination around...
16
1 April 27, 2004 Radioactive contamination around Jadugoda uranium mine in India Research Reactor Institute, Kyoto University Hiroaki KOIDE 1. Introduction - The uranium mine of India India is the big nation where population exceeded 1 billion in May 2000. The land area is 3,290,000km 2 . GNP is 340 dollars (1995) per person. The ratio of agriculture, forestry, and fishery worker is 61.6% (1995). A life expec- tancy is 60 years old of men and 61 years old of women (1992-1993). It has also severe caste system and there are still many poor people. And some people named “Untouchable” are set-aside even from the caste system. Al- though Gandhi called them "Hari Jean (Child of God)", they have the history of distress. Moreover, there are peo- ple with more distress history in this country. They are the aborigines (Native Indian). Many of them have lived in Bihar state of eastern India, especially in Jharkhand of Bihar. Jharkhand won the independence from Bihar in 2000 and 28% of its population is aborigines. It is a mineral rich state and the iron ore brought the first full-scale industrial city in India “Jamshedpur (Tatanagar)". The nuclear test named "Smile of Buddha" was succeeded in 1974. Meanwhile, India has made efforts for the de- velopment of the nuclear power generation in order to utilize the rich thorium resources. Though it is 1957 that the nuclear reactor becomes criticality for the first time in Japan, the nuclear reactor becomes criticality in 1956 in India. It was the first nuclear reactor in Asia. Now 14 nuclear power plants are under operation and the total gen- erating power is 2.72GW. Two reactors are boiling water reactor plants introduced from U.S.A. And two are CANDU reactors introduced from Canada, and then 10 of the remainder are the heavy water boiling reactors of the original development. In addition, 9 nuclear power plants are under construction including 2 Russian type pressurized water reactors. In India only Jharkhand has uranium mine, and it has contributed to both of the development of nuclear weapon and nuclear power plants. The map of the nuclear related facili- ties in India is shown in Figure 1, and the railroad map of Jharkhand is shown in Figure 2 1) . Figure 3 is an artificial satellite photograph that shows the position of Jamshedpur (Tatanagar) and uranium mines around Jadugoda. The position of the central part of Jadugoda is east longitude 86-degree 20 minutes, and north latitude 22-degree 40 minutes. The distance from the Tatanagar station to Jadugoda is 24km in a straight line. The area around mines is mountainous land where the abo- rigines have lived. Aborigines were deprived of Figure 1 Nuclear colossus, India
Transcript of April 27, 2004 Radioactive contamination around Jadugoda ... · Radioactive contamination around...
1
April 27, 2004 Radioactive contamination around Jadugoda uranium mine in India
Research Reactor Institute, Kyoto University
Hiroaki KOIDE
1. Introduction - The uranium mine of India India is the big nation where population exceeded 1 billion in May 2000. The land area is 3,290,000km2. GNP is
340 dollars (1995) per person. The ratio of agriculture, forestry, and fishery worker is 61.6% (1995). A life expec-
tancy is 60 years old of men and 61 years old of women (1992-1993). It has also severe caste system and there are
still many poor people. And some people named “Untouchable” are set-aside even from the caste system. Al-
though Gandhi called them "Hari Jean (Child of God)", they have the history of distress. Moreover, there are peo-
ple with more distress history in this country. They are the aborigines (Native Indian). Many of them have lived in
Bihar state of eastern India, especially in Jharkhand of Bihar. Jharkhand won the independence from Bihar in
2000 and 28% of its population is aborigines. It is a mineral rich state and the iron ore brought the first full-scale
industrial city in India “Jamshedpur (Tatanagar)".
The nuclear test named "Smile of Buddha" was succeeded in 1974. Meanwhile, India has made efforts for the de-
velopment of the nuclear power generation in order to utilize the rich thorium resources. Though it is 1957 that the
nuclear reactor becomes criticality for the first time in Japan, the nuclear reactor becomes criticality in 1956 in
India. It was the first nuclear reactor in Asia. Now 14 nuclear power plants are under operation and the total gen-
erating power is 2.72GW. Two reactors are boiling water reactor plants introduced from U.S.A. And two are
CANDU reactors introduced from Canada, and then 10 of the remainder are the heavy water boiling reactors of
the original development. In addition, 9 nuclear power plants are under construction including 2 Russian type
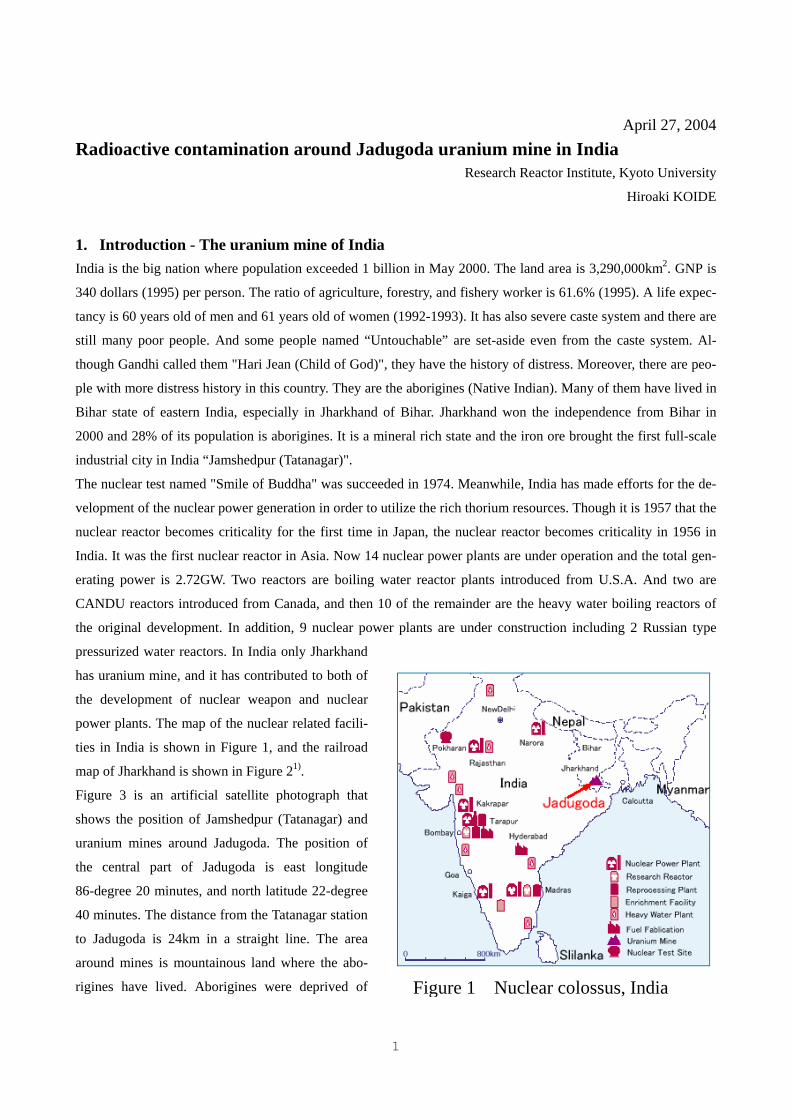
pressurized water reactors. In India only Jharkhand
has uranium mine, and it has contributed to both of
the development of nuclear weapon and nuclear
power plants. The map of the nuclear related facili-
ties in India is shown in Figure 1, and the railroad
map of Jharkhand is shown in Figure 21).
Figure 3 is an artificial satellite photograph that
shows the position of Jamshedpur (Tatanagar) and
uranium mines around Jadugoda. The position of
the central part of Jadugoda is east longitude
86-degree 20 minutes, and north latitude 22-degree
40 minutes. The distance from the Tatanagar station
to Jadugoda is 24km in a straight line. The area
around mines is mountainous land where the abo-
rigines have lived. Aborigines were deprived of
Figure 1 Nuclear colossus, India
2
their own land because uranium is
discovered their land and they were
polluted with radioactivity. They had
to have a distress history for it. Ura-
nium was discovered in many abo-
rigines' lands like in the U.S.A. and
Australia.
The population of Jharkhand is about
100 million and 1 million people live
in its capital, Ranchi. There is West
Bengal State on the east side and
Orissa State is located on the south.
Jharkhand state has the long slender
area called "East Singhbhum" which
lies between West Bengal and Orissa.
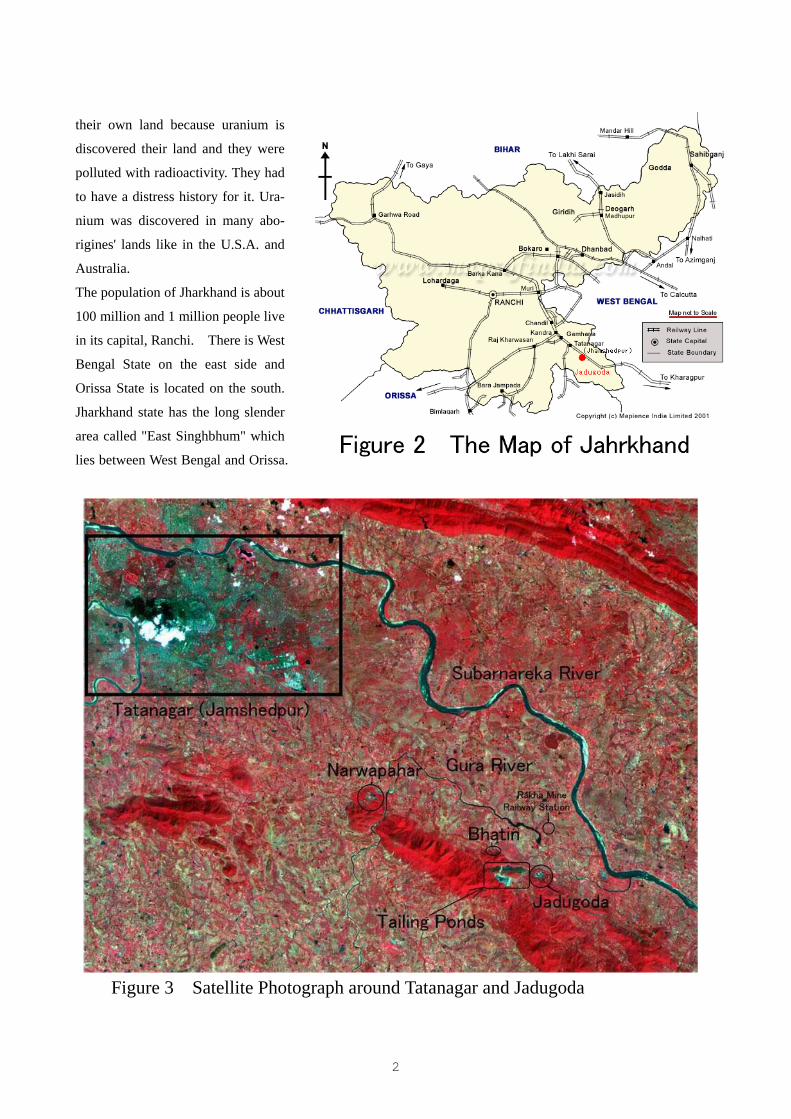
Figure 3 Satellite Photograph around Tatanagar and Jadugoda
3
Tatanagar and three uranium mines, Narwapahar, Bhatin and Jadugoda, are located in this area. These uranium
mines are managed by UCIL (Uranium Corporation of India Limited), the government enterprise of India. The
distance from Narwapahar to Jadugoda is only 10km. In Jadugoda, uranium ore from these three mines has been
processed in a smelter. In addition, mill-tailings have been thrown away into three tailing ponds. The uranium got
as a product is packed in the drum can and transported from the Rakha-mine railway station.
Though India has the rich thorium resources, it does not have the uranium almost. The grade of the uranium ore
dug in these uranium mines is remarkably low. The average grade is about 0.06%. Ability of the smelter in
Jadugoda is the ores of 1000 tons per day2). And the amount of uranium is only 600 kg per day, namely 200 ton
per year. In the meantime, mill-tailings after uranium was removed reaches 300,000 ton per year. It has been
thrown into tailing ponds by pipeline in liquid form. Besides, the mine-tailings also occur, and the quantity
reaches 10 times of the mill-tailings. They are left in surroundings without any countermeasure.
The video movie “Buddha weeps in Jadugoda”3) which received the grand prize in the global environment image
festival 2000 taught me Jadugoda problem. The movies showed that there are 15 colonies within 5km around
Jadugoda, about 30,000 people live, and much health disturbance on children of the nearby colony is being gener-
ated.
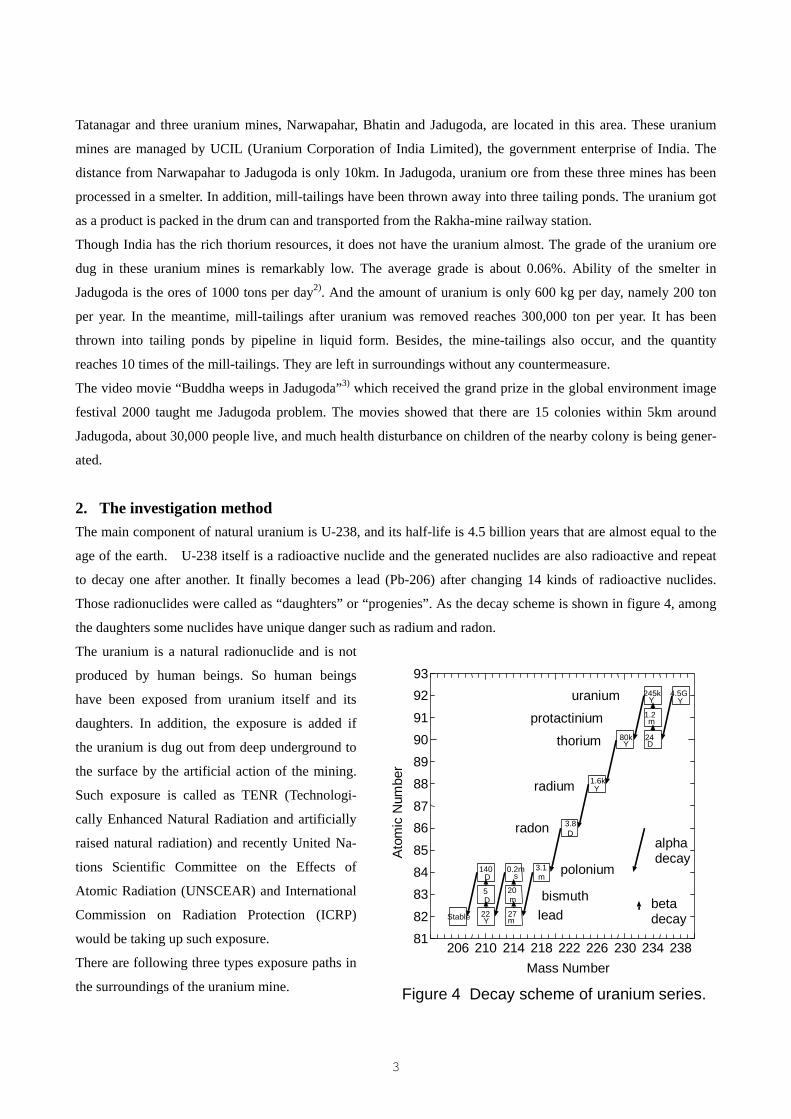
2. The investigation method The main component of natural uranium is U-238, and its half-life is 4.5 billion years that are almost equal to the
age of the earth. U-238 itself is a radioactive nuclide and the generated nuclides are also radioactive and repeat
to decay one after another. It finally becomes a lead (Pb-206) after changing 14 kinds of radioactive nuclides.
Those radionuclides were called as “daughters” or “progenies”. As the decay scheme is shown in figure 4, among
the daughters some nuclides have unique danger such as radium and radon.
The uranium is a natural radionuclide and is not
produced by human beings. So human beings
have been exposed from uranium itself and its
daughters. In addition, the exposure is added if
the uranium is dug out from deep underground to
the surface by the artificial action of the mining.
Such exposure is called as TENR (Technologi-
cally Enhanced Natural Radiation and artificially
raised natural radiation) and recently United Na-
tions Scientific Committee on the Effects of
Atomic Radiation (UNSCEAR) and International
Commission on Radiation Protection (ICRP)
would be taking up such exposure.
There are following three types exposure paths in
the surroundings of the uranium mine.
206 210 214 218 222 226 230 234 238 81 82 83 84 85 86 87 88 89 90 91 92 93
Mass Number
Atom
ic N
umbe
r
uranium
protactinium
thorium
radium
radon
polonium
bismuth lead
alpha
beta
decay
decay
Figure 4 Decay scheme of uranium series.
4.5G Y
24 D
1.2 m
245k Y
80k Y
1.6k Y
3.8 D
3.1 m
27 m
20 m
0.2m s
22 Y
5 D
140 D
Stable
4
1. The gamma-ray exposure by approaching tailing ponds or mine-tailings.
2. The internal exposure by taking water or food contaminated by uranium and the daughters.
3. The internal exposure by inhaling radon in the air.
I carried out following three type investigations in order to consider such exposure.
A. Measurement of gamma radiation dose
TLDs (Thermo Luminescence Dosimeter: Matsushita Electric Co.Ltd., type UD-200S and UD-110S) were placed
in the field, and they were recovered after 3 months. A cumulative dose was measured by the TLD Reader (Mat-
sushita Electric Co. Ltd., UD-5120PGL) of KURRI (Research Reactor Institute, Kyoto University). The exposure
dose under transportation of TLDs was corrected using the dose data of control samples and dose rate data in the
aircraft anticipated generally. Beside, the direct measurement in the field by the survey-meter (Horiba Ltd.,
PA-100, ORIENT Co.Ltd., PSD06021 and Belarusian PDM-2) was also carried out. Both measurement results
showed the approximately good coincidence.
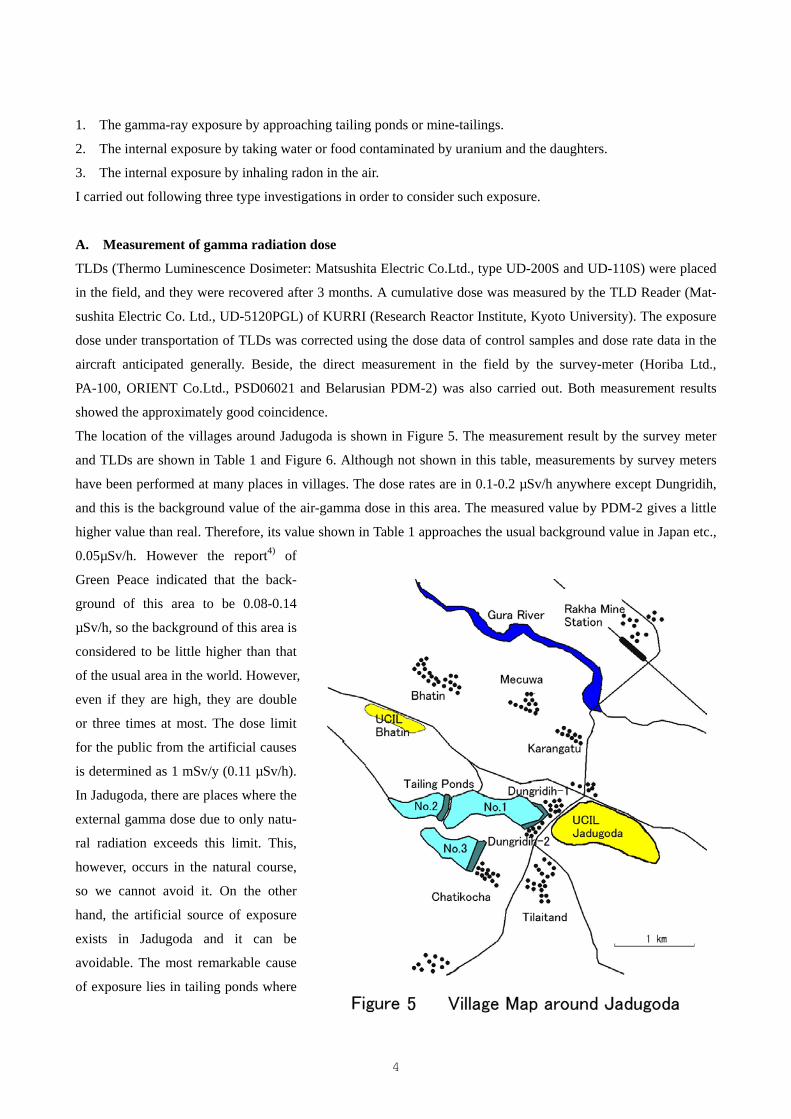
The location of the villages around Jadugoda is shown in Figure 5. The measurement result by the survey meter
and TLDs are shown in Table 1 and Figure 6. Although not shown in this table, measurements by survey meters
have been performed at many places in villages. The dose rates are in 0.1-0.2 µSv/h anywhere except Dungridih,
and this is the background value of the air-gamma dose in this area. The measured value by PDM-2 gives a little
higher value than real. Therefore, its value shown in Table 1 approaches the usual background value in Japan etc.,
0.05µSv/h. However the report4) of
Green Peace indicated that the back-
ground of this area to be 0.08-0.14
µSv/h, so the background of this area is
considered to be little higher than that
of the usual area in the world. However,
even if they are high, they are double
or three times at most. The dose limit
for the public from the artificial causes
is determined as 1 mSv/y (0.11 µSv/h).
In Jadugoda, there are places where the
external gamma dose due to only natu-
ral radiation exceeds this limit. This,
however, occurs in the natural course,
so we cannot avoid it. On the other
hand, the artificial source of exposure
exists in Jadugoda and it can be
avoidable. The most remarkable cause
of exposure lies in tailing ponds where
5
the air-gamma dose exceeds 10mSv/y (1.1µSv/h). UCIL enclosed this area by the barbed wire. But this area had
been farmland or village of residents and even now it is the place of their everyday life. When I entered into a
tailing pond and collected the sample, two women were crossing a tailing pond putting firewood on their head.
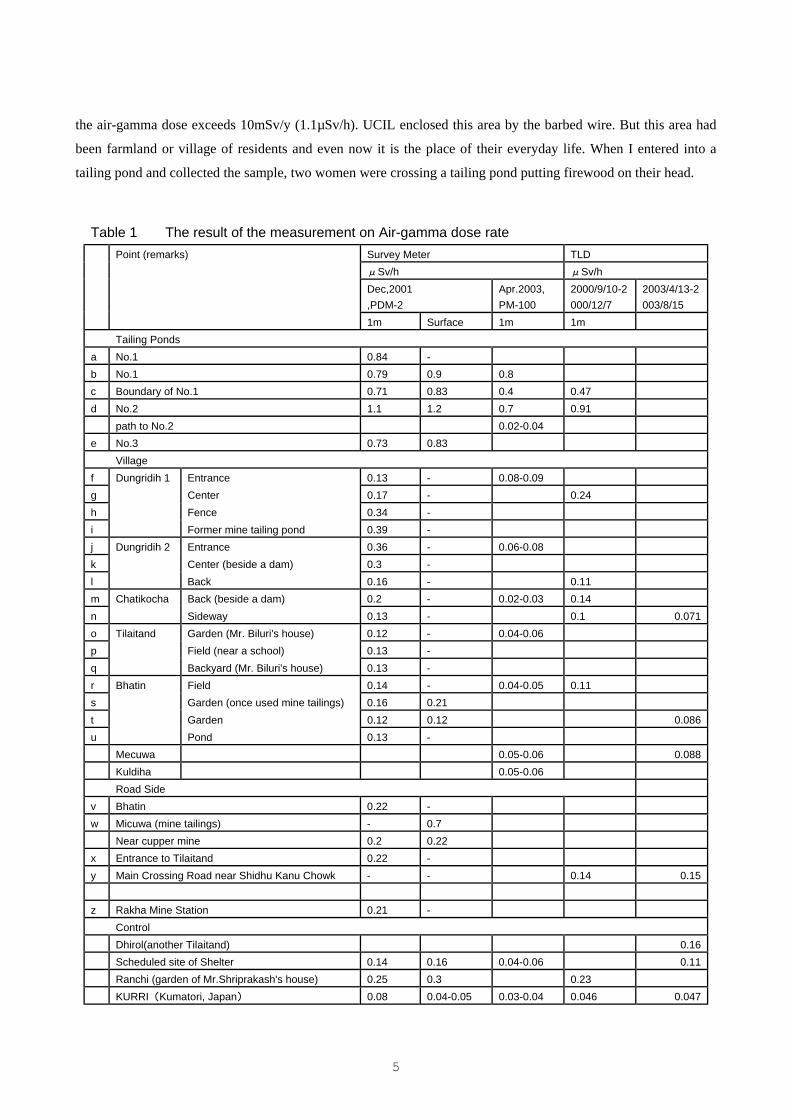
Table 1 The result of the measurement on Air-gamma dose rate Point (remarks) Survey Meter TLD μSv/h μSv/h Dec,2001
,PDM-2 Apr.2003,
PM-100 2000/9/10-2000/12/7
2003/4/13-2003/8/15
1m Surface 1m 1m Tailing Ponds a No.1 0.84 - b No.1 0.79 0.9 0.8 c Boundary of No.1 0.71 0.83 0.4 0.47 d No.2 1.1 1.2 0.7 0.91 path to No.2 0.02-0.04 e No.3 0.73 0.83 Village f Entrance 0.13 - 0.08-0.09 g Center 0.17 - 0.24 h Fence 0.34 - i
Dungridih 1
Former mine tailing pond 0.39 - j Dungridih 2 Entrance 0.36 - 0.06-0.08 k Center (beside a dam) 0.3 - l Back 0.16 - 0.11 m Back (beside a dam) 0.2 - 0.02-0.03 0.14 n
Chatikocha Sideway 0.13 - 0.1 0.071
o Tilaitand Garden (Mr. Biluri's house) 0.12 - 0.04-0.06 p Field (near a school) 0.13 - q Backyard (Mr. Biluri's house) 0.13 - r Field 0.14 - 0.04-0.05 0.11 s Garden (once used mine tailings) 0.16 0.21 t Garden 0.12 0.12 0.086 u
Bhatin
Pond 0.13 - Mecuwa 0.05-0.06 0.088 Kuldiha 0.05-0.06 Road Side v Bhatin 0.22 - w Micuwa (mine tailings) - 0.7 Near cupper mine 0.2 0.22 x Entrance to Tilaitand 0.22 - y Main Crossing Road near Shidhu Kanu Chowk - - 0.14 0.15 z Rakha Mine Station 0.21 - Control Dhirol(another Tilaitand) 0.16 Scheduled site of Shelter 0.14 0.16 0.04-0.06 0.11 Ranchi (garden of Mr.Shriprakash's house) 0.25 0.3 0.23 KURRI(Kumatori, Japan) 0.08 0.04-0.05 0.03-0.04 0.046 0.047
6
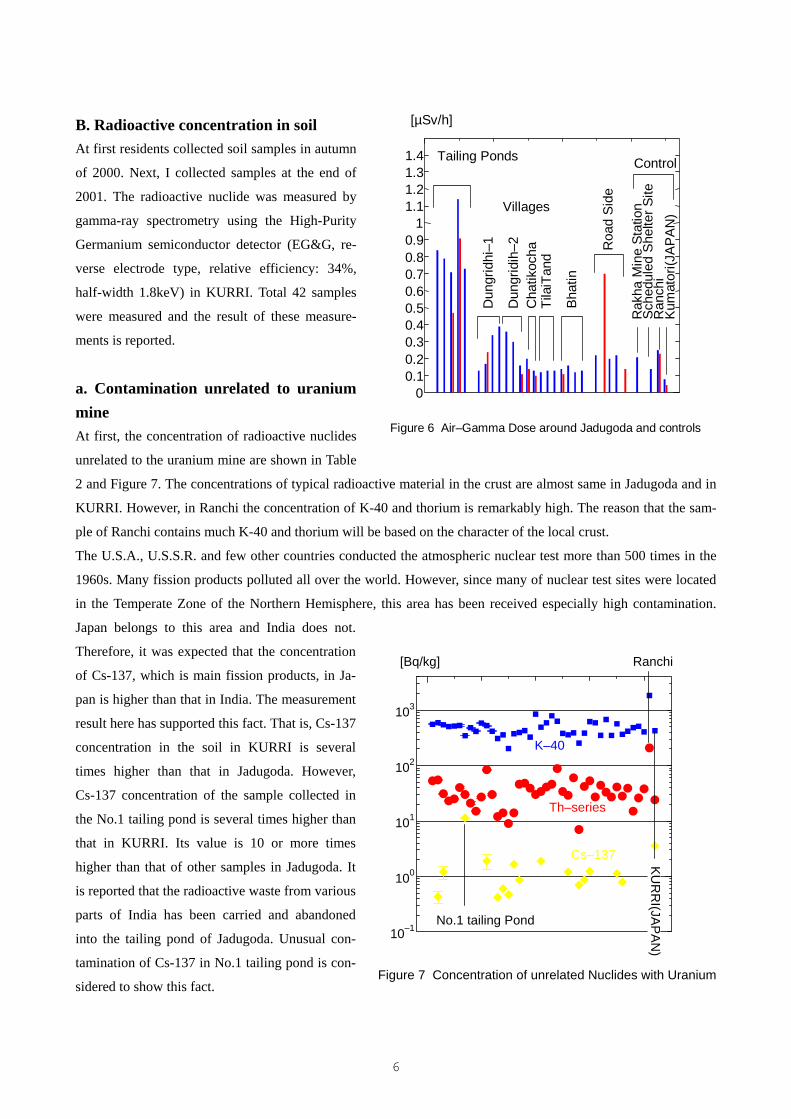
B. Radioactive concentration in soil At first residents collected soil samples in autumn
of 2000. Next, I collected samples at the end of
2001. The radioactive nuclide was measured by
gamma-ray spectrometry using the High-Purity
Germanium semiconductor detector (EG&G, re-
verse electrode type, relative efficiency: 34%,
half-width 1.8keV) in KURRI. Total 42 samples
were measured and the result of these measure-
ments is reported.
a. Contamination unrelated to uranium mine At first, the concentration of radioactive nuclides
unrelated to the uranium mine are shown in Table
2 and Figure 7. The concentrations of typical radioactive material in the crust are almost same in Jadugoda and in
KURRI. However, in Ranchi the concentration of K-40 and thorium is remarkably high. The reason that the sam-
ple of Ranchi contains much K-40 and thorium will be based on the character of the local crust.
The U.S.A., U.S.S.R. and few other countries conducted the atmospheric nuclear test more than 500 times in the
1960s. Many fission products polluted all over the world. However, since many of nuclear test sites were located
in the Temperate Zone of the Northern Hemisphere, this area has been received especially high contamination.
Japan belongs to this area and India does not.
Therefore, it was expected that the concentration
of Cs-137, which is main fission products, in Ja-
pan is higher than that in India. The measurement
result here has supported this fact. That is, Cs-137
concentration in the soil in KURRI is several
times higher than that in Jadugoda. However,
Cs-137 concentration of the sample collected in
the No.1 tailing pond is several times higher than
that in KURRI. Its value is 10 or more times
higher than that of other samples in Jadugoda. It
is reported that the radioactive waste from various
parts of India has been carried and abandoned
into the tailing pond of Jadugoda. Unusual con-
tamination of Cs-137 in No.1 tailing pond is con-
sidered to show this fact.
10–1
100
101
102
103
Ranchi
KUR
RI(JAPAN
)
No.1 tailing Pond
Th–series
K–40
Cs–137
[Bq/kg]
Figure 7 Concentration of unrelated Nuclides with Uranium
0 0.1 0.2 0.3 0.4 0.5 0.6 0.7 0.8 0.9
1 1.1 1.2 1.3 1.4 Tailing Ponds
Villages
Dun
grid
hi–1
Dun
grid
ih–2
C
hatik
ocha
Ti
laiT
and
Bhat
in
Roa
d Si
de
Rak
ha M
ine
Stat
ion
Sche
dule
d Sh
elte
r Site
R
anch
i Ku
mat
ori(J
APAN
)
Control
Figure 6 Air–Gamma Dose around Jadugoda and controls
[µSv/h]
7
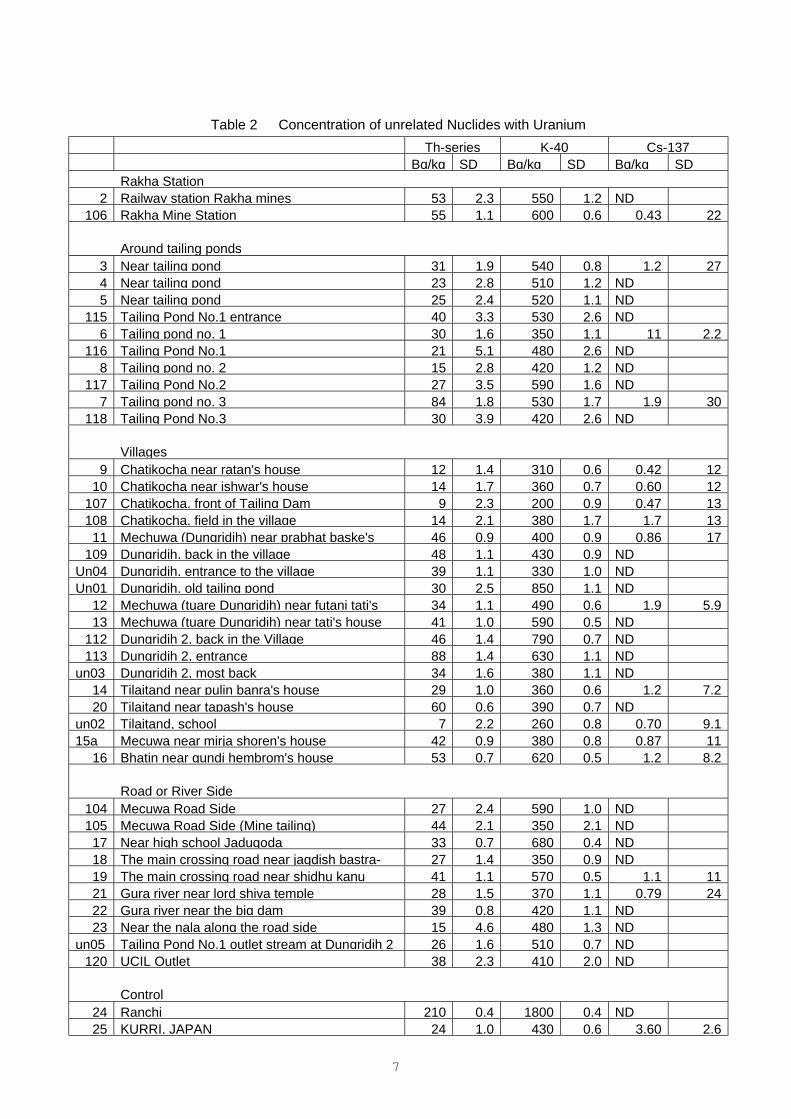
Table 2 Concentration of unrelated Nuclides with Uranium Th-series K-40 Cs-137 Bq/kg SD Bq/kg SD Bq/kg SD Rakha Station
2 Railway station Rakha mines 53 2.3 550 1.2 ND 106 Rakha Mine Station 55 1.1 600 0.6 0.43 22
Around tailing ponds
3 Near tailing pond 31 1.9 540 0.8 1.2 27 4 Near tailing pond 23 2.8 510 1.2 ND 5 Near tailing pond 25 2.4 520 1.1 ND
115 Tailing Pond No.1 entrance 40 3.3 530 2.6 ND 6 Tailing pond no. 1 30 1.6 350 1.1 11 2.2
116 Tailing Pond No.1 21 5.1 480 2.6 ND 8 Tailing pond no. 2 15 2.8 420 1.2 ND
117 Tailing Pond No.2 27 3.5 590 1.6 ND 7 Tailing pond no. 3 84 1.8 530 1.7 1.9 30
118 Tailing Pond No.3 30 3.9 420 2.6 ND Villages
9 Chatikocha near ratan's house 12 1.4 310 0.6 0.42 12 10 Chatikocha near ishwar's house 14 1.7 360 0.7 0.60 12
107 Chatikocha, front of Tailing Dam 9 2.3 200 0.9 0.47 13 108 Chatikocha, field in the village 14 2.1 380 1.7 1.7 13
11 Mechuwa (Dungridih) near prabhat baske's 46 0.9 400 0.9 0.86 17 109 Dungridih, back in the village 48 1.1 430 0.9 ND
Un04 Dungridih, entrance to the village 39 1.1 330 1.0 ND Un01 Dungridih, old tailing pond 30 2.5 850 1.1 ND
12 Mechuwa (tuare Dungridih) near futani tati's 34 1.1 490 0.6 1.9 5.9 13 Mechuwa (tuare Dungridih) near tati's house 41 1.0 590 0.5 ND
112 Dungridih 2, back in the Village 46 1.4 790 0.7 ND 113 Dungridih 2, entrance 88 1.4 630 1.1 ND
un03 Dungridih 2, most back 34 1.6 380 1.1 ND 14 Tilaitand near pulin banra's house 29 1.0 360 0.6 1.2 7.2 20 Tilaitand near tapash's house 60 0.6 390 0.7 ND
un02 Tilaitand, school 7 2.2 260 0.8 0.70 9.1 15a Mecuwa near mirja shoren's house 42 0.9 380 0.8 0.87 11
16 Bhatin near gundi hembrom's house 53 0.7 620 0.5 1.2 8.2 Road or River Side
104 Mecuwa Road Side 27 2.4 590 1.0 ND 105 Mecuwa Road Side (Mine tailing) 44 2.1 350 2.1 ND
17 Near high school Jadugoda 33 0.7 680 0.4 ND 18 The main crossing road near jagdish bastra- 27 1.4 350 0.9 ND 19 The main crossing road near shidhu kanu 41 1.1 570 0.5 1.1 11 21 Gura river near lord shiva temple 28 1.5 370 1.1 0.79 24 22 Gura river near the big dam 39 0.8 420 1.1 ND 23 Near the nala along the road side 15 4.6 480 1.3 ND
un05 Tailing Pond No.1 outlet stream at Dungridih 2 26 1.6 510 0.7 ND 120 UCIL Outlet 38 2.3 410 2.0 ND
Control
24 Ranchi 210 0.4 1800 0.4 ND 25 KURRI, JAPAN 24 1.0 430 0.6 3.60 2.6
8
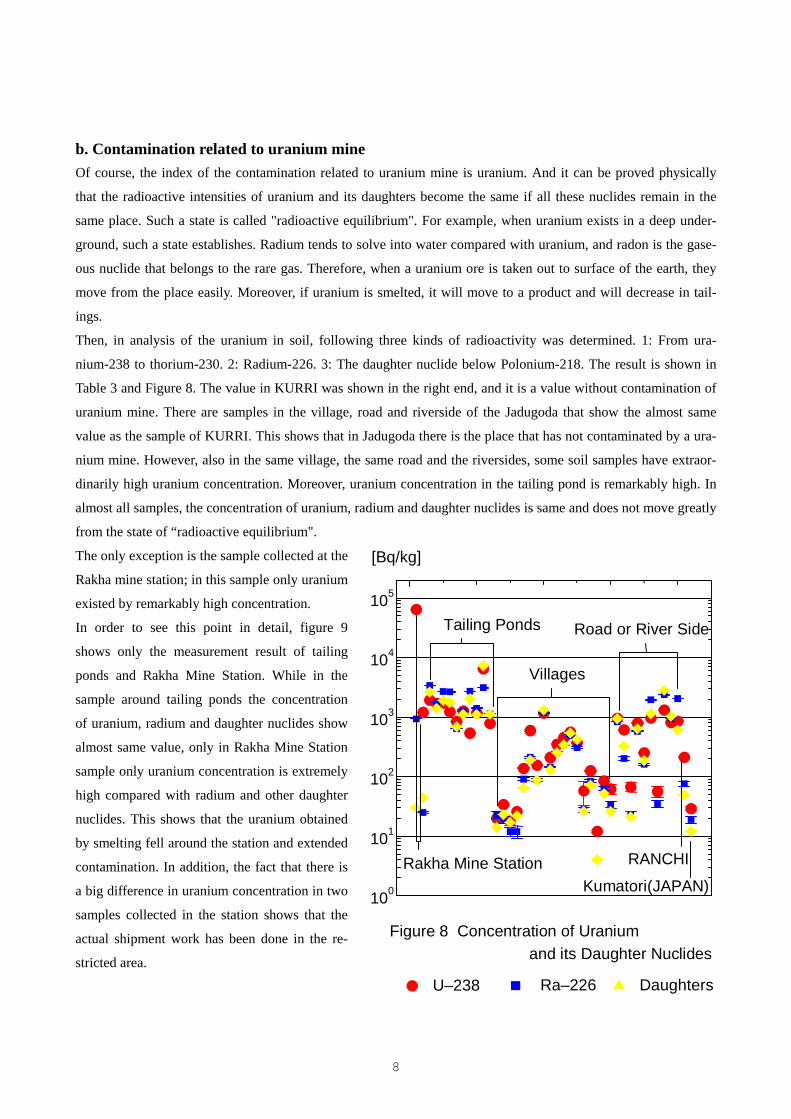
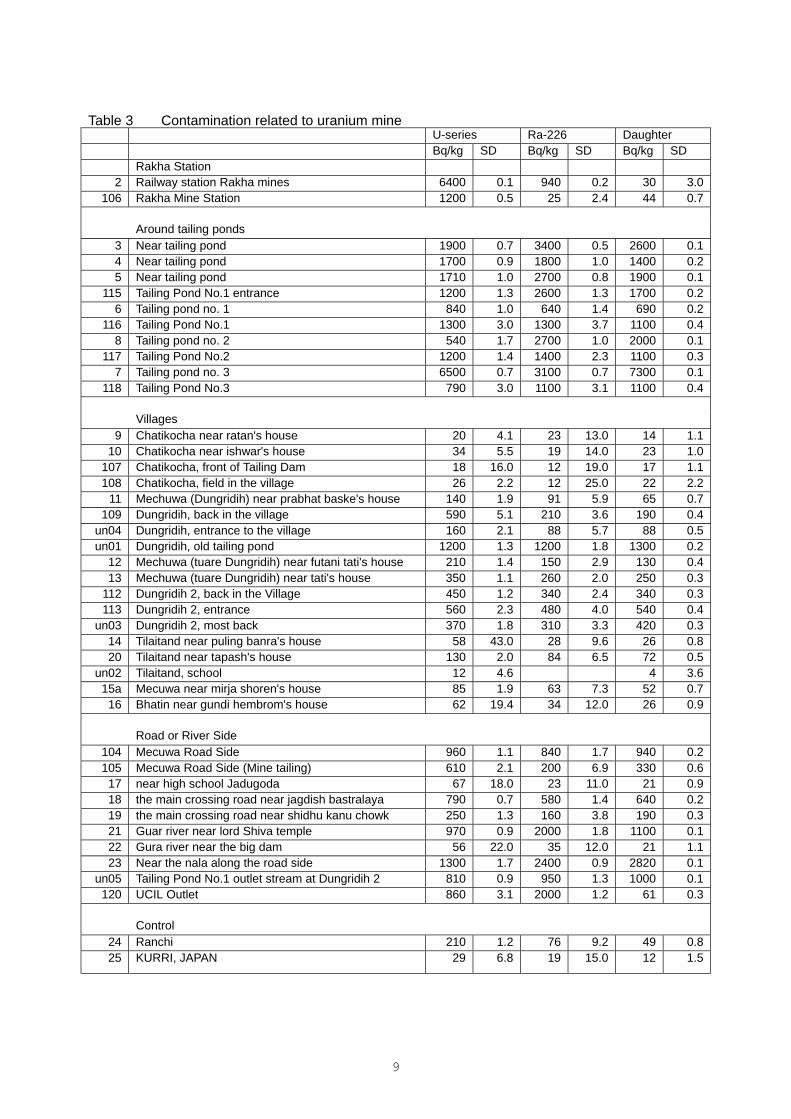
b. Contamination related to uranium mine Of course, the index of the contamination related to uranium mine is uranium. And it can be proved physically
that the radioactive intensities of uranium and its daughters become the same if all these nuclides remain in the
same place. Such a state is called "radioactive equilibrium". For example, when uranium exists in a deep under-
ground, such a state establishes. Radium tends to solve into water compared with uranium, and radon is the gase-
ous nuclide that belongs to the rare gas. Therefore, when a uranium ore is taken out to surface of the earth, they
move from the place easily. Moreover, if uranium is smelted, it will move to a product and will decrease in tail-
ings.
Then, in analysis of the uranium in soil, following three kinds of radioactivity was determined. 1: From ura-
nium-238 to thorium-230. 2: Radium-226. 3: The daughter nuclide below Polonium-218. The result is shown in
Table 3 and Figure 8. The value in KURRI was shown in the right end, and it is a value without contamination of
uranium mine. There are samples in the village, road and riverside of the Jadugoda that show the almost same
value as the sample of KURRI. This shows that in Jadugoda there is the place that has not contaminated by a ura-
nium mine. However, also in the same village, the same road and the riversides, some soil samples have extraor-
dinarily high uranium concentration. Moreover, uranium concentration in the tailing pond is remarkably high. In
almost all samples, the concentration of uranium, radium and daughter nuclides is same and does not move greatly
from the state of “radioactive equilibrium".
The only exception is the sample collected at the
Rakha mine station; in this sample only uranium
existed by remarkably high concentration.
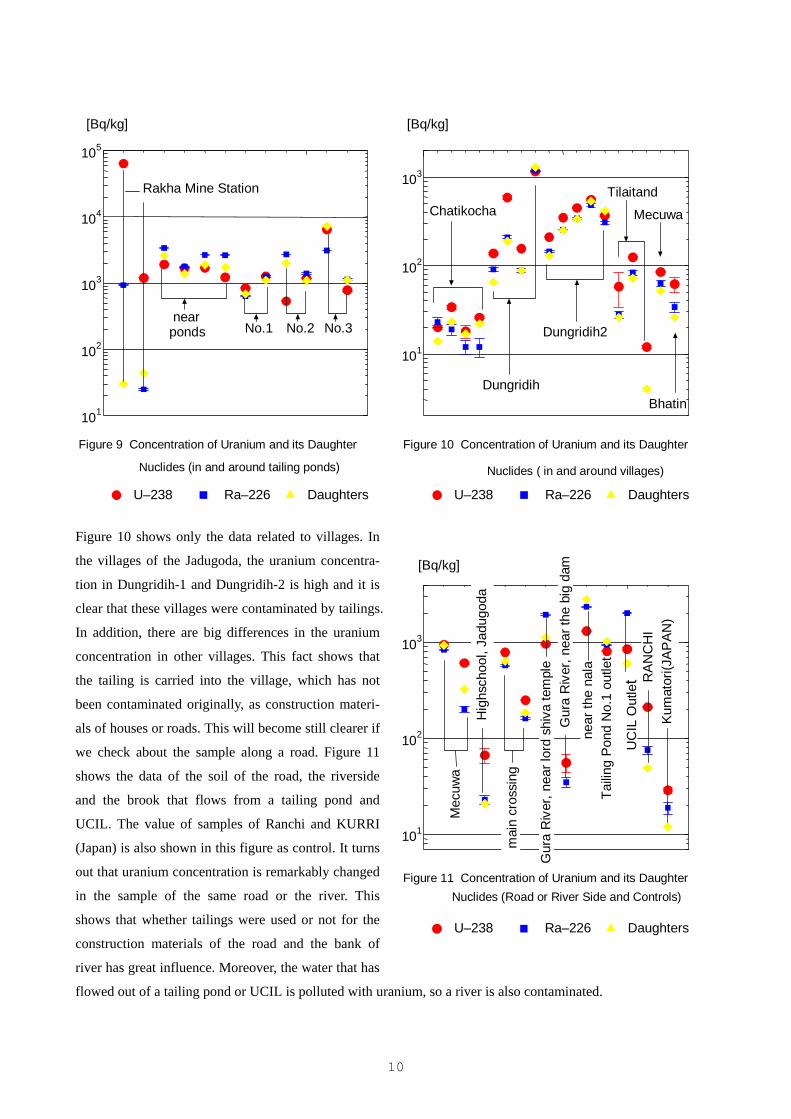
In order to see this point in detail, figure 9
shows only the measurement result of tailing
ponds and Rakha Mine Station. While in the
sample around tailing ponds the concentration
of uranium, radium and daughter nuclides show
almost same value, only in Rakha Mine Station
sample only uranium concentration is extremely
high compared with radium and other daughter
nuclides. This shows that the uranium obtained
by smelting fell around the station and extended
contamination. In addition, the fact that there is
a big difference in uranium concentration in two
samples collected in the station shows that the
actual shipment work has been done in the re-
stricted area.
10 0
10 1
10 2
10 3
10 4
10 5
Tailing Ponds
Villages
Road or River Side
RANCHI Kumatori(JAPAN)
Rakha Mine Station
Figure 8 Concentration of Uranium
[Bq/kg]
U–238 Ra–226 Daughters
and its Daughter Nuclides
9
Table 3 Contamination related to uranium mine U-series Ra-226 Daughter Bq/kg SD Bq/kg SD Bq/kg SD
Rakha Station 2 Railway station Rakha mines 6400 0.1 940 0.2 30 3.0
106 Rakha Mine Station 1200 0.5 25 2.4 44 0.7
Around tailing ponds 3 Near tailing pond 1900 0.7 3400 0.5 2600 0.1 4 Near tailing pond 1700 0.9 1800 1.0 1400 0.2 5 Near tailing pond 1710 1.0 2700 0.8 1900 0.1
115 Tailing Pond No.1 entrance 1200 1.3 2600 1.3 1700 0.2 6 Tailing pond no. 1 840 1.0 640 1.4 690 0.2
116 Tailing Pond No.1 1300 3.0 1300 3.7 1100 0.4 8 Tailing pond no. 2 540 1.7 2700 1.0 2000 0.1
117 Tailing Pond No.2 1200 1.4 1400 2.3 1100 0.3 7 Tailing pond no. 3 6500 0.7 3100 0.7 7300 0.1
118 Tailing Pond No.3 790 3.0 1100 3.1 1100 0.4
Villages 9 Chatikocha near ratan's house 20 4.1 23 13.0 14 1.1
10 Chatikocha near ishwar's house 34 5.5 19 14.0 23 1.0 107 Chatikocha, front of Tailing Dam 18 16.0 12 19.0 17 1.1 108 Chatikocha, field in the village 26 2.2 12 25.0 22 2.2
11 Mechuwa (Dungridih) near prabhat baske's house 140 1.9 91 5.9 65 0.7 109 Dungridih, back in the village 590 5.1 210 3.6 190 0.4
un04 Dungridih, entrance to the village 160 2.1 88 5.7 88 0.5 un01 Dungridih, old tailing pond 1200 1.3 1200 1.8 1300 0.2
12 Mechuwa (tuare Dungridih) near futani tati's house 210 1.4 150 2.9 130 0.4 13 Mechuwa (tuare Dungridih) near tati's house 350 1.1 260 2.0 250 0.3
112 Dungridih 2, back in the Village 450 1.2 340 2.4 340 0.3 113 Dungridih 2, entrance 560 2.3 480 4.0 540 0.4
un03 Dungridih 2, most back 370 1.8 310 3.3 420 0.3 14 Tilaitand near puling banra's house 58 43.0 28 9.6 26 0.8 20 Tilaitand near tapash's house 130 2.0 84 6.5 72 0.5
un02 Tilaitand, school 12 4.6 4 3.6 15a Mecuwa near mirja shoren's house 85 1.9 63 7.3 52 0.7 16 Bhatin near gundi hembrom's house 62 19.4 34 12.0 26 0.9
Road or River Side
104 Mecuwa Road Side 960 1.1 840 1.7 940 0.2 105 Mecuwa Road Side (Mine tailing) 610 2.1 200 6.9 330 0.6 17 near high school Jadugoda 67 18.0 23 11.0 21 0.9 18 the main crossing road near jagdish bastralaya 790 0.7 580 1.4 640 0.2 19 the main crossing road near shidhu kanu chowk 250 1.3 160 3.8 190 0.3 21 Guar river near lord Shiva temple 970 0.9 2000 1.8 1100 0.1 22 Gura river near the big dam 56 22.0 35 12.0 21 1.1 23 Near the nala along the road side 1300 1.7 2400 0.9 2820 0.1
un05 Tailing Pond No.1 outlet stream at Dungridih 2 810 0.9 950 1.3 1000 0.1 120 UCIL Outlet 860 3.1 2000 1.2 61 0.3
Control
24 Ranchi 210 1.2 76 9.2 49 0.8 25 KURRI, JAPAN 29 6.8 19 15.0 12 1.5
10
Figure 10 shows only the data related to villages. In
the villages of the Jadugoda, the uranium concentra-
tion in Dungridih-1 and Dungridih-2 is high and it is
clear that these villages were contaminated by tailings.
In addition, there are big differences in the uranium
concentration in other villages. This fact shows that
the tailing is carried into the village, which has not
been contaminated originally, as construction materi-
als of houses or roads. This will become still clearer if
we check about the sample along a road. Figure 11
shows the data of the soil of the road, the riverside
and the brook that flows from a tailing pond and
UCIL. The value of samples of Ranchi and KURRI
(Japan) is also shown in this figure as control. It turns
out that uranium concentration is remarkably changed
in the sample of the same road or the river. This
shows that whether tailings were used or not for the
construction materials of the road and the bank of
river has great influence. Moreover, the water that has
flowed out of a tailing pond or UCIL is polluted with uranium, so a river is also contaminated.
10 1
10 2
10 3
10 4
10 5
U–238 Ra–226 Daughters
Rakha Mine Station
near ponds No.1 No.2 No.3
[Bq/kg]
Figure 9 Concentration of Uranium and its Daughter
Nuclides (in and around tailing ponds)
10 1
10 2
10 3
U–238 Ra–226 Daughters
[Bq/kg]
Chatikocha
Dungridih
Dungridih2
Tilaitand
Mecuwa
Bhatin
Figure 10 Concentration of Uranium and its Daughter
Nuclides ( in and around villages)
10 1
10 2
10 3
U–238 Ra–226 Daughters
[Bq/kg]
Kum
ator
i(JAP
AN)
RAN
CH
I
Hig
hsch
ool,
Jadu
goda
Gur
a R
iver
, nea
r the
big
dam
Nuclides (Road or River Side and Controls)
Mec
uwa
mai
n cr
ossi
ng
Gur
a R
iver
, nea
r lor
d sh
iva
tem
ple
near
the
nala
Ta
iling
Pond
No.
1 ou
tlet
UC
IL O
utle
t
Figure 11 Concentration of Uranium and its Daughter
11
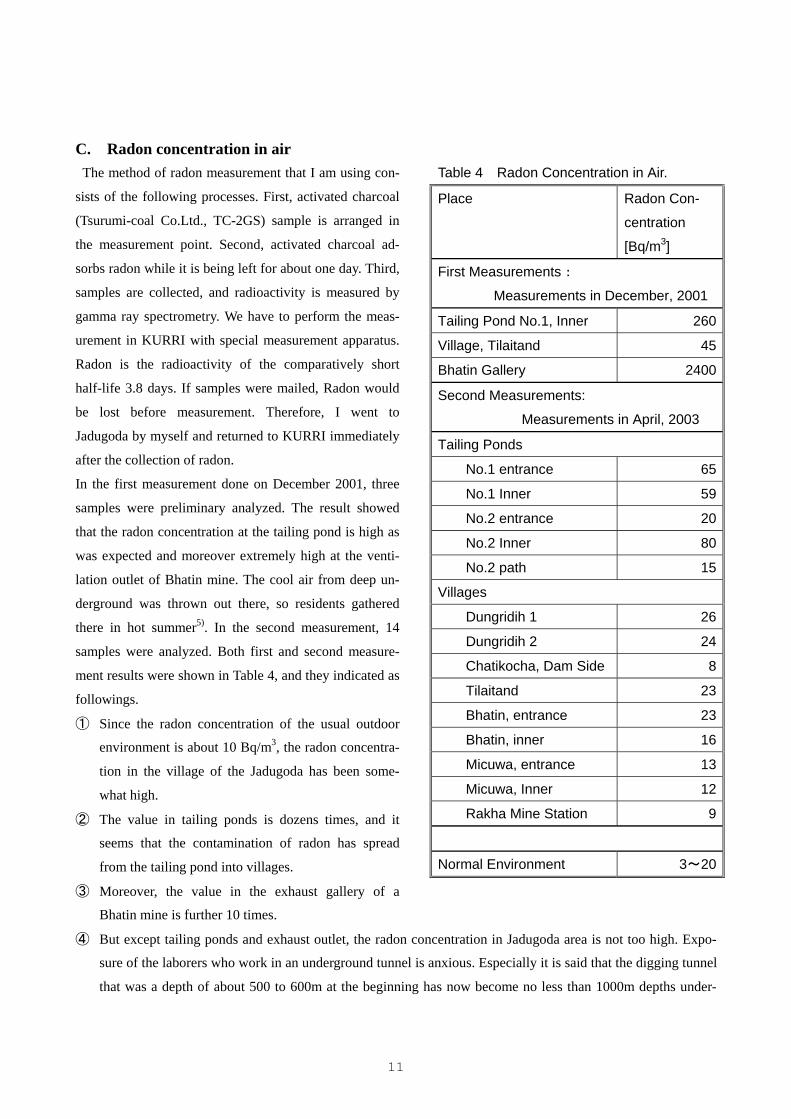
C. Radon concentration in air The method of radon measurement that I am using con-
sists of the following processes. First, activated charcoal
(Tsurumi-coal Co.Ltd., TC-2GS) sample is arranged in
the measurement point. Second, activated charcoal ad-
sorbs radon while it is being left for about one day. Third,
samples are collected, and radioactivity is measured by
gamma ray spectrometry. We have to perform the meas-
urement in KURRI with special measurement apparatus.
Radon is the radioactivity of the comparatively short
half-life 3.8 days. If samples were mailed, Radon would
be lost before measurement. Therefore, I went to
Jadugoda by myself and returned to KURRI immediately
after the collection of radon.
In the first measurement done on December 2001, three
samples were preliminary analyzed. The result showed
that the radon concentration at the tailing pond is high as
was expected and moreover extremely high at the venti-
lation outlet of Bhatin mine. The cool air from deep un-
derground was thrown out there, so residents gathered
there in hot summer5). In the second measurement, 14
samples were analyzed. Both first and second measure-
ment results were shown in Table 4, and they indicated as
followings.
① Since the radon concentration of the usual outdoor
environment is about 10 Bq/m3, the radon concentra-
tion in the village of the Jadugoda has been some-
what high.
② The value in tailing ponds is dozens times, and it
seems that the contamination of radon has spread
from the tailing pond into villages.
③ Moreover, the value in the exhaust gallery of a
Bhatin mine is further 10 times.
④ But except tailing ponds and exhaust outlet, the radon concentration in Jadugoda area is not too high. Expo-
sure of the laborers who work in an underground tunnel is anxious. Especially it is said that the digging tunnel
that was a depth of about 500 to 600m at the beginning has now become no less than 1000m depths under-
Table 4 Radon Concentration in Air. Place Radon Con-
centration
[Bq/m3]
First Measurements:
Measurements in December, 2001
Tailing Pond No.1, Inner 260
Village, Tilaitand 45
Bhatin Gallery 2400
Second Measurements:
Measurements in April, 2003
Tailing Ponds
No.1 entrance 65
No.1 Inner 59
No.2 entrance 20
No.2 Inner 80
No.2 path 15
Villages
Dungridih 1 26
Dungridih 2 24
Chatikocha, Dam Side 8
Tilaitand 23
Bhatin, entrance 23
Bhatin, inner 16
Micuwa, entrance 13
Micuwa, Inner 12
Rakha Mine Station 9
Normal Environment 3~20

12
ground. The biggest healthy problem that the residentsof Jadugoda are faced is exposure of mine laborers.
3. Conclusion --- Serious Problem A. Contamination exists Contamination surely exists around Jadugoda uranium mine. If uranium is exploited and is left on the surface of
the earth, there is no reason in which the pollution is not generated. Moreover, if unmanageable tailings are posi-
tively used for the construction materials of the building or the road, contamination will be expanded further. Ac-
cording to the request of JOAR (Jharkhandi Organization Against Radiation), the Environment Committee of the
Bihar Legislative Council was installed. The committee issued the last report in December 1998 after investigat-
ing the circumference over two years. The report indicated, "There should be no village up to at least 5km., from
the dumping ground area." However, according to my investigation, contamination centering on tailing ponds
seems to have not spread yet broadly. Since two villages, Dungridih-1 and Dungridih-2, are in contact with the
tailing pond, soil is polluted and the air-gamma dose is also high. On the other hand, in the villages including Ti-
laitand those are not directly in contact with tailing ponds the air-gamma dose is not high. In addition, the soils of
these villages were not contaminated by tailings, either.
The result of this investigation is summarized below.
1. The contamination from the uranium mine has spread in Jadugoda.
2. The amount of air-gamma dose exceeds 1 mSv/y in the villages, and reaches 10 mSv/y around the tail-
ing ponds.
3. The circumference of tailing ponds is polluted with uranium. The strength of the pollution in the tailing
ponds is 10 to 100 times higher than the place without contamination.
Since the uranium content of uranium mine around Jadugoda is low, the air-gamma dose rate and uranium
concentration of a tailing ponds are not extremely high. As long as tailing is abandoned, it is reasonable that
the air-gamma dose rate and the uranium concentration in soil in tailings ponds are high. In addition, the ra-
don concentration in the air is also high. As shown in Table 1, the dose rate reaches 1μSv/h and tailing ponds
should be managed as a controlled area of the radiation. However, when I entered into the inside of a tailing
pond in order to collect the soil samples for radioactivity measurement, two women were crossing a tailing
pond putting firewood on their heads. For a long time, residents have been nestling up to nature. Tailing pond
were built where the place of a daily life of the residents. As the Environmental Committee of the Bihar Leg-
islative Council has already pointed out, the tailing pond is the place of an every-day life of residents. Even
now, they cannot but enter into tailing ponds in order to live. Residents receive excessive exposure by the
gamma ray from the ground only by entering into these tailing ponds, and they receive further exposure by
inhaling the radon that escapes from the ground and by making tailings adhere to the body. Tailing ponds are
dangerous places and the measures that prohibit the inhabitant to enter into the tailing ponds must be taken.
Now, the barbed wire stretched around tailing ponds is cut everywhere. At first, it is necessary to stretch
barbed wire again. An essentially required thing, however, is telling residents about the danger of tailing
13
ponds. In addition, it is necessary to make the conditions that the inhabitant would also live on not entering
tailing ponds.
4. No.1 tailing pond has contamination of cesium. This fact shows that radioactivity was brought from
another polluted source that was not uranium mine.
5. Especially Dungridih that is in contact with the tailing pond has high contamination. However, other
villages have not contaminated seriously yet.
The villages of Dungridih and Chatikocha are directly under tailing dams. In order to make tailing ponds, land
was taken and residents settled there reluctantly. The water from tailing ponds flows there in the rainy season.
And tailings that became a fine particle carried there by the wind in the dry season. Especially the uranium
concentration in soil in Dungridih is high (cf. Table 1) and therefore the rate of air-gamma dose rate is also
high (cf. Table 2). Residents have better be emigrated another villages if tailings will be throw away into tail-
ing ponds.
6. Radon emanated from tailing ponds etc spreads contamination.
As already mentioned, residents had gathered at the exhaust outlet in the summer. I visited there on Decem-
ber 2001. Although there was no roof in order to blow out the air, there was enclosed by concrete building. I
jumped into inside from the upside opening in order to install the activated carbon sample for radon collec-
tions. Cold damp air was violently blowing off there. Although it was too late, installation of a concrete
building was the needful measure. However, from the tailing ponds, radon is spreading now and its behaviour
should be monitored.
7. Mine-tailings used for construction material spreads pollution
There is a shade of uranium contamination in a same village, as high contamination has been measured at
Tilaitand or other village. This cause is because tailings were used for the building materials. There are
places where uranium concentration is high at the road or the riverside, and it is thought that tailings are used
for construction material too. Residents testified followings. When they told UCIL that they wanted con-
struction materials, UCIL carried mine-tailings by dump trucks. It must be immediately stopped to bring
tailings into villages and to use it for construction materials.
8. Product uranium is dealt with carelessly and has fallen in environment
While it is important to prevent the pollution of mill and mine-tailings, product uranium has also been dealt
with carelessly. At the Rakha Mine station, the soil is severely polluted by only uranium. Its concentration is
remarkably high. This shows that the product uranium obtained by smelting fell and extended contamination.
Table 5 shows the measurement result of two samples collected at Rakha Mine station. The concentration of
Ra-226 and other daughter nuclides are extremely low compared with the concentration of uranium. This fact
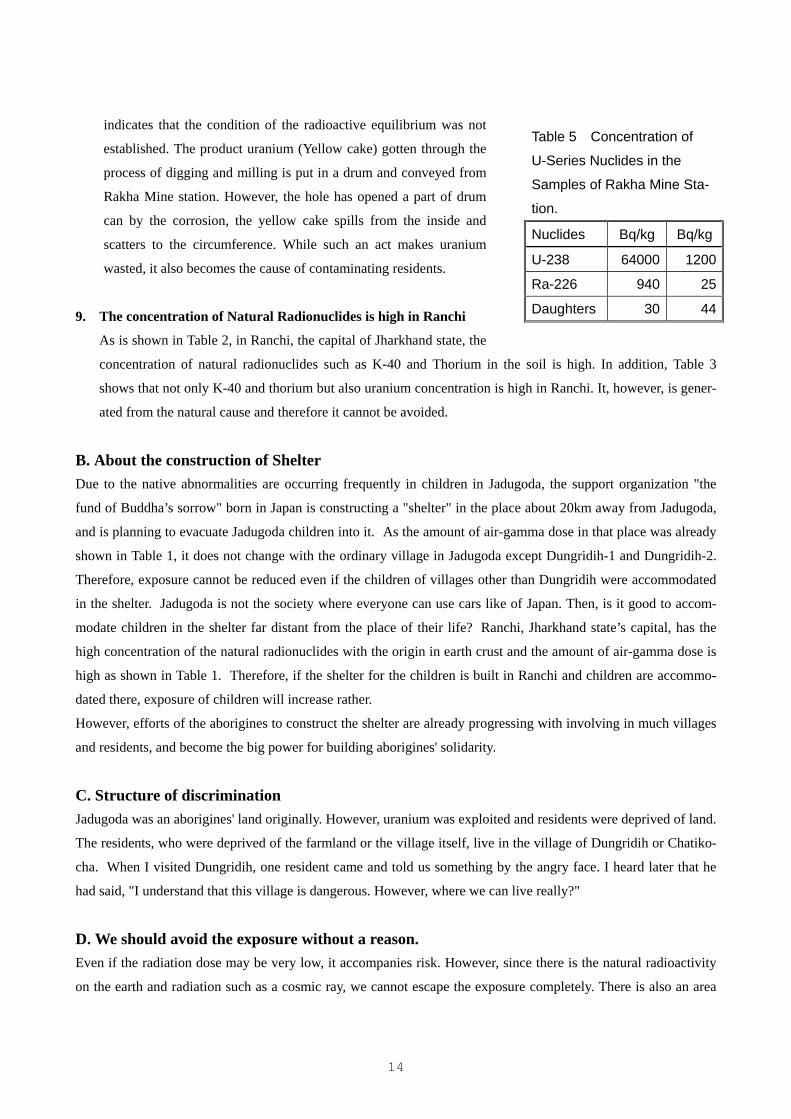
14
indicates that the condition of the radioactive equilibrium was not
established. The product uranium (Yellow cake) gotten through the
process of digging and milling is put in a drum and conveyed from
Rakha Mine station. However, the hole has opened a part of drum
can by the corrosion, the yellow cake spills from the inside and
scatters to the circumference. While such an act makes uranium
wasted, it also becomes the cause of contaminating residents.
9. The concentration of Natural Radionuclides is high in Ranchi
As is shown in Table 2, in Ranchi, the capital of Jharkhand state, the
concentration of natural radionuclides such as K-40 and Thorium in the soil is high. In addition, Table 3
shows that not only K-40 and thorium but also uranium concentration is high in Ranchi. It, however, is gener-
ated from the natural cause and therefore it cannot be avoided.
B. About the construction of Shelter Due to the native abnormalities are occurring frequently in children in Jadugoda, the support organization "the
fund of Buddha’s sorrow" born in Japan is constructing a "shelter" in the place about 20km away from Jadugoda,
and is planning to evacuate Jadugoda children into it. As the amount of air-gamma dose in that place was already
shown in Table 1, it does not change with the ordinary village in Jadugoda except Dungridih-1 and Dungridih-2.
Therefore, exposure cannot be reduced even if the children of villages other than Dungridih were accommodated
in the shelter. Jadugoda is not the society where everyone can use cars like of Japan. Then, is it good to accom-
modate children in the shelter far distant from the place of their life? Ranchi, Jharkhand state’s capital, has the
high concentration of the natural radionuclides with the origin in earth crust and the amount of air-gamma dose is
high as shown in Table 1. Therefore, if the shelter for the children is built in Ranchi and children are accommo-
dated there, exposure of children will increase rather.
However, efforts of the aborigines to construct the shelter are already progressing with involving in much villages
and residents, and become the big power for building aborigines' solidarity.
C. Structure of discrimination Jadugoda was an aborigines' land originally. However, uranium was exploited and residents were deprived of land.
The residents, who were deprived of the farmland or the village itself, live in the village of Dungridih or Chatiko-
cha. When I visited Dungridih, one resident came and told us something by the angry face. I heard later that he
had said, "I understand that this village is dangerous. However, where we can live really?"
D. We should avoid the exposure without a reason. Even if the radiation dose may be very low, it accompanies risk. However, since there is the natural radioactivity
on the earth and radiation such as a cosmic ray, we cannot escape the exposure completely. There is also an area
Table 5 Concentration of
U-Series Nuclides in the
Samples of Rakha Mine Sta-
tion.
Nuclides Bq/kg Bq/kg
U-238 64000 1200
Ra-226 940 25
Daughters 30 44
15
where the content of the uranium or thorium in soil are high, and peoples are received exposure of 10 or more
times in such a place compared with other areas. There is no other way but to accept. Ranchi, the capital of Jhark-
hand, is one of such the places.
On the other hand, man's act may also induce exposure. One example is going on in Jadugoda. Moreover, the abo-
rigines who are prevented even from caste are having the exposure forced.
The aborigines of Jadugoda were destroyed their life by depriving of their land. They were destroyed their health
by becoming the laborers of a huge government enterprise. Moreover, radioactivity is thrown away into the place
of their every-day life and they have been exposed further.
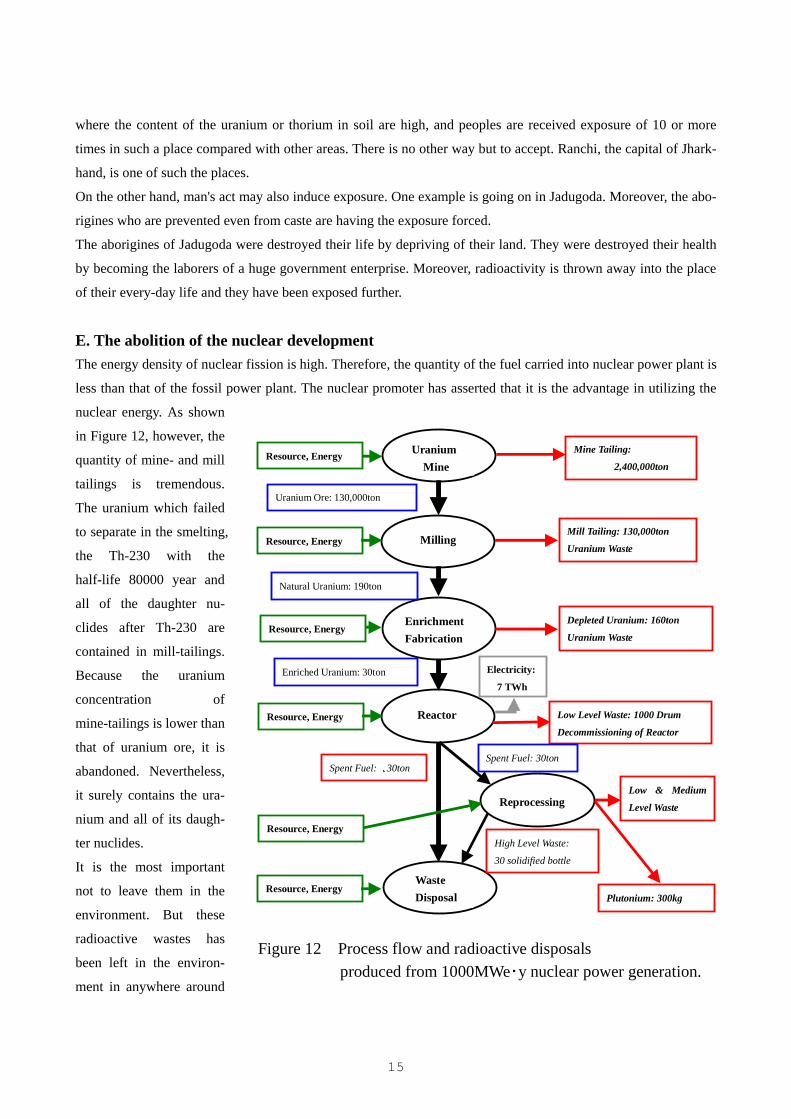
E. The abolition of the nuclear development The energy density of nuclear fission is high. Therefore, the quantity of the fuel carried into nuclear power plant is
less than that of the fossil power plant. The nuclear promoter has asserted that it is the advantage in utilizing the
nuclear energy. As shown
in Figure 12, however, the
quantity of mine- and mill
tailings is tremendous.
The uranium which failed
to separate in the smelting,
the Th-230 with the
half-life 80000 year and
all of the daughter nu-
clides after Th-230 are
contained in mill-tailings.
Because the uranium
concentration of
mine-tailings is lower than
that of uranium ore, it is
abandoned. Nevertheless,
it surely contains the ura-
nium and all of its daugh-
ter nuclides.
It is the most important
not to leave them in the
environment. But these
radioactive wastes has
been left in the environ-
ment in anywhere around
Uranium Mine
Mine Tailing:
2,400,000ton
Milling
Enrichment Fabrication
Reactor
Reprocessing
Waste Disposal
Mill Tailing: 130,000ton
Uranium Waste
Depleted Uranium: 160ton
Uranium Waste
Low Level Waste: 1000 Drum
Decommissioning of Reactor
Low & Medium
Level Waste
Uranium Ore: 130,000ton
Natural Uranium: 190ton
Enriched Uranium: 30ton
Spent Fuel: 、30ton
High Level Waste:
30 solidified bottle
Spent Fuel: 30ton
Plutonium: 300kg
Resource, Energy
Resource, Energy
Resource, Energy
Resource, Energy
Resource, Energy
Resource, Energy
Figure 12 Process flow and radioactive disposals produced from 1000MWe・y nuclear power generation.
Electricity:
7 TWh
16
the world. Besides, it is not avoided that the inhabitant gets
exposure, if the appropriate management does not be done.
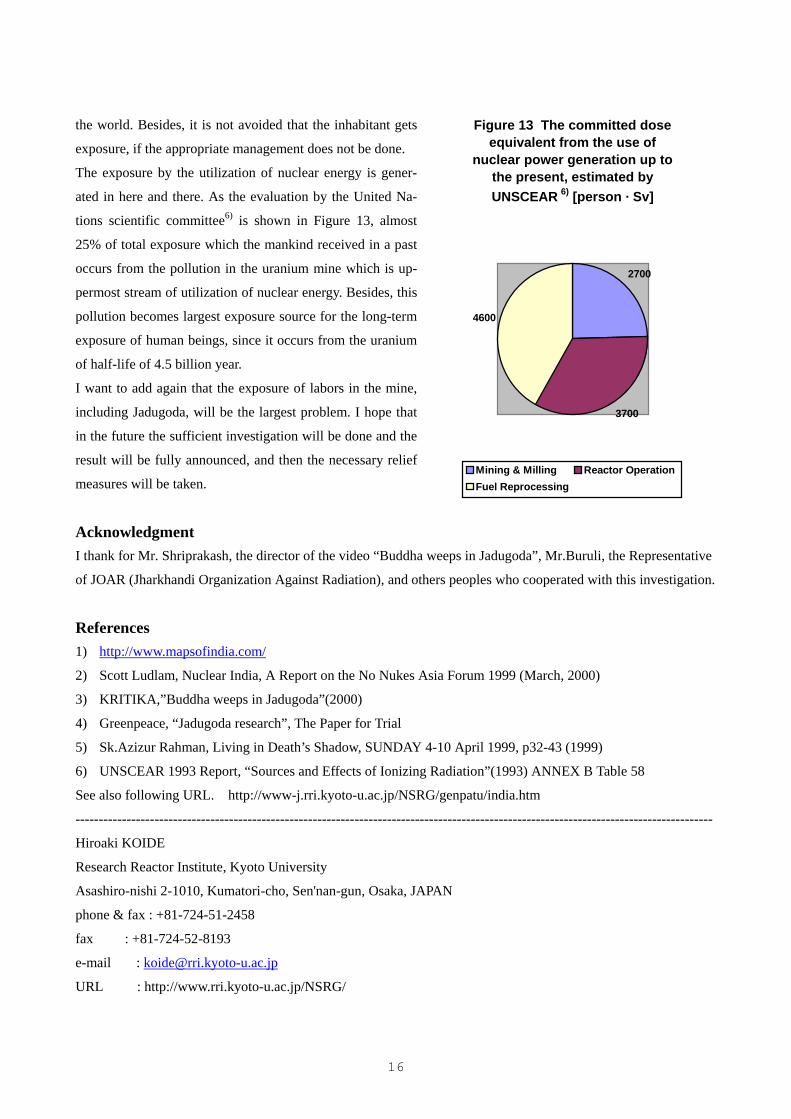
The exposure by the utilization of nuclear energy is gener-
ated in here and there. As the evaluation by the United Na-
tions scientific committee6) is shown in Figure 13, almost
25% of total exposure which the mankind received in a past
occurs from the pollution in the uranium mine which is up-
permost stream of utilization of nuclear energy. Besides, this
pollution becomes largest exposure source for the long-term
exposure of human beings, since it occurs from the uranium
of half-life of 4.5 billion year.
I want to add again that the exposure of labors in the mine,
including Jadugoda, will be the largest problem. I hope that
in the future the sufficient investigation will be done and the
result will be fully announced, and then the necessary relief
measures will be taken.
Acknowledgment I thank for Mr. Shriprakash, the director of the video “Buddha weeps in Jadugoda”, Mr.Buruli, the Representative
of JOAR (Jharkhandi Organization Against Radiation), and others peoples who cooperated with this investigation.
References 1) http://www.mapsofindia.com/
2) Scott Ludlam, Nuclear India, A Report on the No Nukes Asia Forum 1999 (March, 2000)
3) KRITIKA,”Buddha weeps in Jadugoda”(2000)
4) Greenpeace, “Jadugoda research”, The Paper for Trial
5) Sk.Azizur Rahman, Living in Death’s Shadow, SUNDAY 4-10 April 1999, p32-43 (1999)
6) UNSCEAR 1993 Report, “Sources and Effects of Ionizing Radiation”(1993) ANNEX B Table 58
See also following URL. http://www-j.rri.kyoto-u.ac.jp/NSRG/genpatu/india.htm
-----------------------------------------------------------------------------------------------------------------------------------------
Hiroaki KOIDE
Research Reactor Institute, Kyoto University
Asashiro-nishi 2-1010, Kumatori-cho, Sen'nan-gun, Osaka, JAPAN
phone & fax : +81-724-51-2458
fax : +81-724-52-8193
e-mail : [email protected]
URL : http://www.rri.kyoto-u.ac.jp/NSRG/
Figure 13 The committed dose equivalent from the use of
nuclear power generation up to the present, estimated by UNSCEAR 6) [person · Sv]
2700
3700
4600
Mining & Milling Reactor OperationFuel Reprocessing