April 24, 2008, Atlas Copco Group Q1 Results April 24, 2008.
30
1 April 24, 2008, www.atlascopco.com Atlas Copco Group Q1 Results April 24, 2008
-
Upload
jasper-jordan -
Category
Documents
-
view
217 -
download
4
Transcript of April 24, 2008, Atlas Copco Group Q1 Results April 24, 2008.

1April 24, 2008, www.atlascopco.com
Atlas Copco Group
Q1 Results
April 24, 2008

2April 24, 2008, www.atlascopco.com
Contents
Q1 Business Highlights
Market Development
Business Areas
Financials
Outlook
3April 24, 2008, www.atlascopco.com
Q1 - Highlights
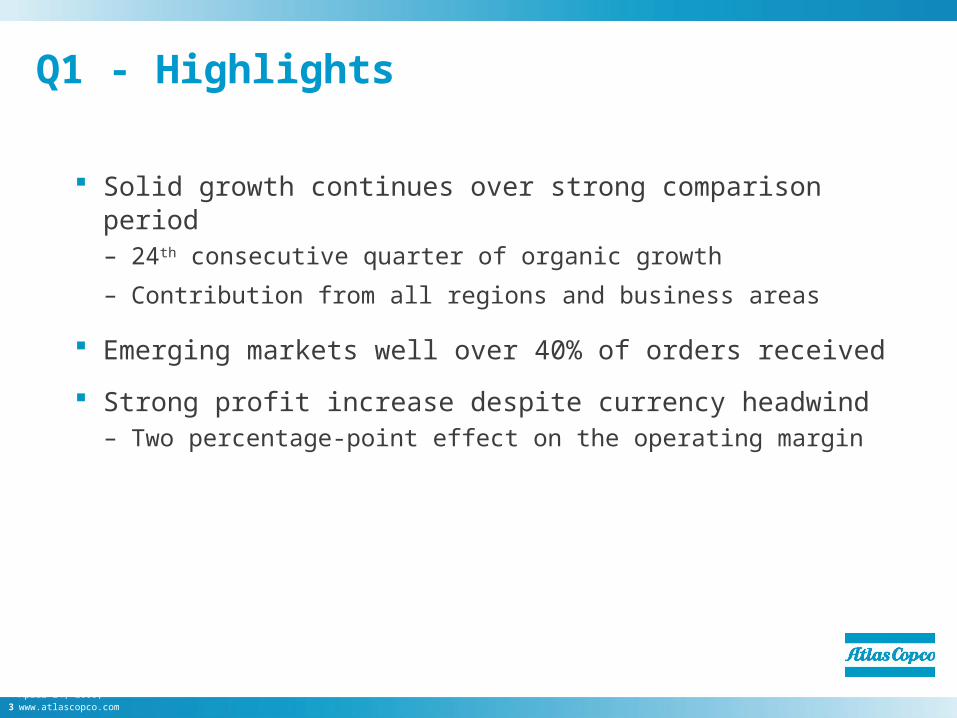
Solid growth continues over strong comparison period– 24th consecutive quarter of organic growth
– Contribution from all regions and business areas
Emerging markets well over 40% of orders received
Strong profit increase despite currency headwind– Two percentage-point effect on the operating margin

4April 24, 2008, www.atlascopco.com
Q1 - Figures in summary
Orders up 21%; 11% organic growth
Revenues up 28% to MSEK 17 122; 18% organic growth
Operating profit up 28% to MSEK 3 248– Operating margin at 19.0% (19.0)
Profit before tax at MSEK 3 026 (2 477)
Earnings per share for continuing operations SEK 1.79 (1.45)
Operating cash flow MSEK 900 (845)
5April 24, 2008, www.atlascopco.com
Contents
Q1 Business Highlights
Market Development
Business Areas
Financials
Outlook
6April 24, 2008, www.atlascopco.com
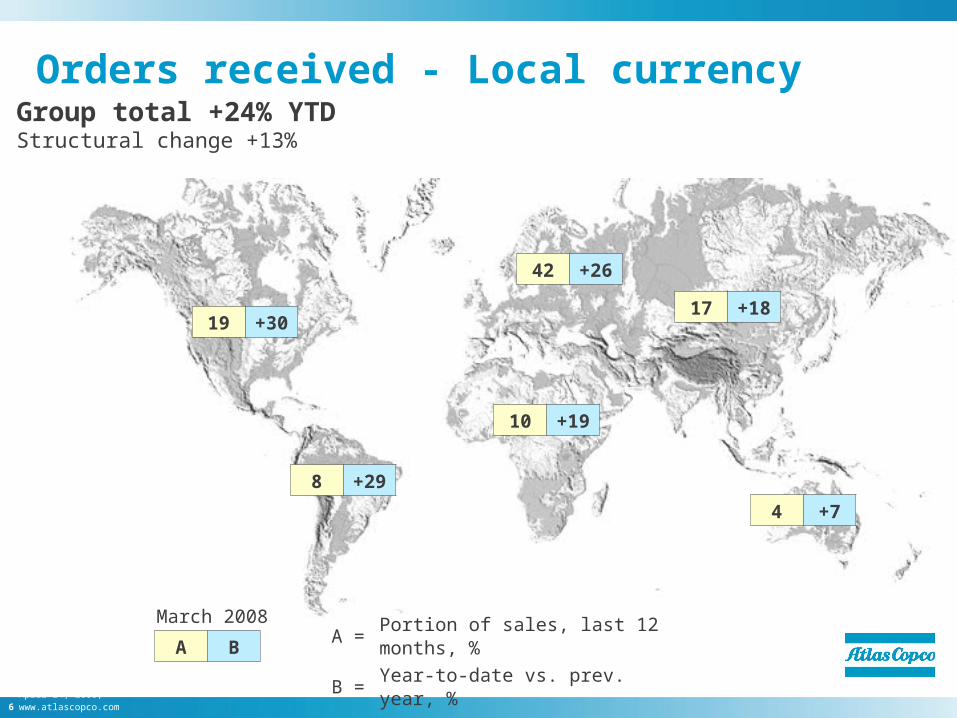
Orders received - Local currencyGroup total +24% YTDStructural change +13%
March 2008 A = Portion of sales, last 12 months, %
B = Year-to-date vs. prev. year, %
42 +26
17 +18
10 +19
8 +29
19 +30
A B
4 +7
7April 24, 2008, www.atlascopco.com
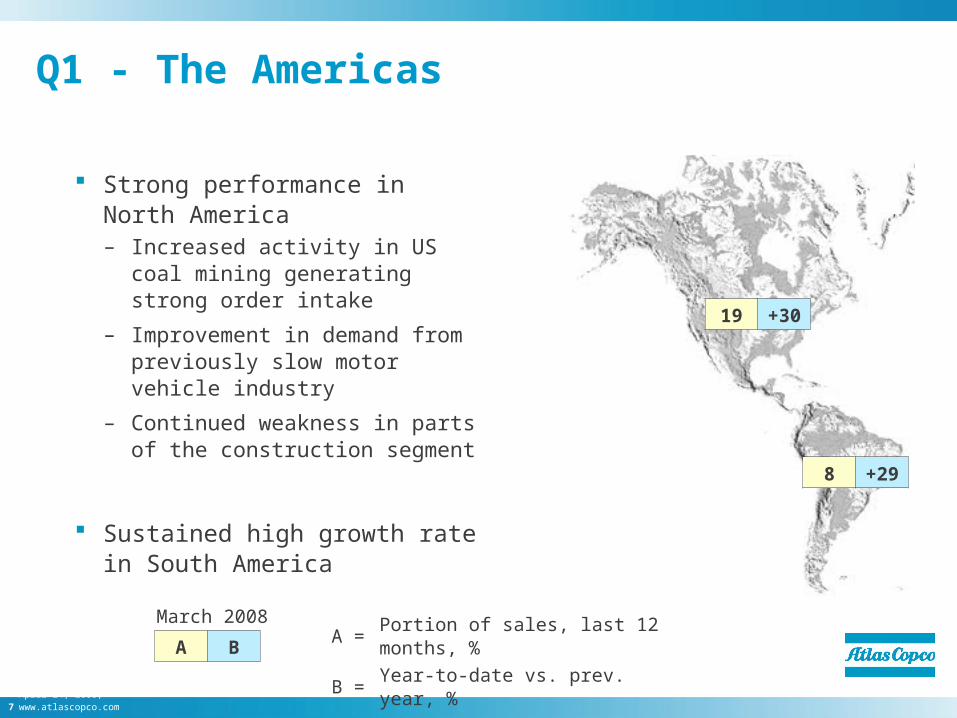
Q1 - The Americas
Strong performance in North America– Increased activity in US coal mining
generating strong order intake
– Improvement in demand from previously slow motor vehicle industry
– Continued weakness in parts of the construction segment
Sustained high growth rate in South America
March 2008 A = Portion of sales, last 12 months, %
B = Year-to-date vs. prev. year, %A B
19 +30
8 +29

8April 24, 2008, www.atlascopco.com
Q1 - Europe and Africa/Middle East
Good development in Europe– Very high growth rates in Eastern Europe
– Good demand from manufacturing industries
– Mining segment strong, while construction related to housing continued to slow down in Western Europe
Solid growth in the Africa / Middle East region – Good demand for construction equipment
in Northern Africa and the Middle East
March 2008 A = Portion of sales, last 12 months, %
B = Year-to-date vs. prev. year, %A B
42 +26
10 +19

9April 24, 2008, www.atlascopco.com
Q1 - Asia and Australia
Stable, high growth in Asia – Strong demand for both equipment
and aftermarket products
– India and China remain strong markets, while Japan slows down
Continued strength in Australian mining
March 2008 A = Portion of sales, last 12 months, %
B = Year-to-date vs. prev. year, %A B
17 +18
4 +7

10April 24, 2008, www.atlascopco.com
Organic* Growth per Quarter
Change in orders received in % vs. same quarter previous year
Atlas Copco Group, continuing operations
-10
-5
0
5
10
15
20
25
30
00 Q
100
Q2
00 Q
300
Q4
01 Q
101
Q2
01 Q
301
Q4
02 Q
102
Q2
02 Q
302
Q4
03 Q
103
Q2
03 Q
303
Q4
04 Q
104
Q2
04 Q
304
Q4
05 Q
105
Q2
05 Q
305
Q4
06 Q
106
Q2
06 Q
306
Q4
07 Q
107
Q2
07 Q
307
Q4
08 Q
108
Q2
08 Q
308
Q4
*Volume and price
11April 24, 2008, www.atlascopco.com
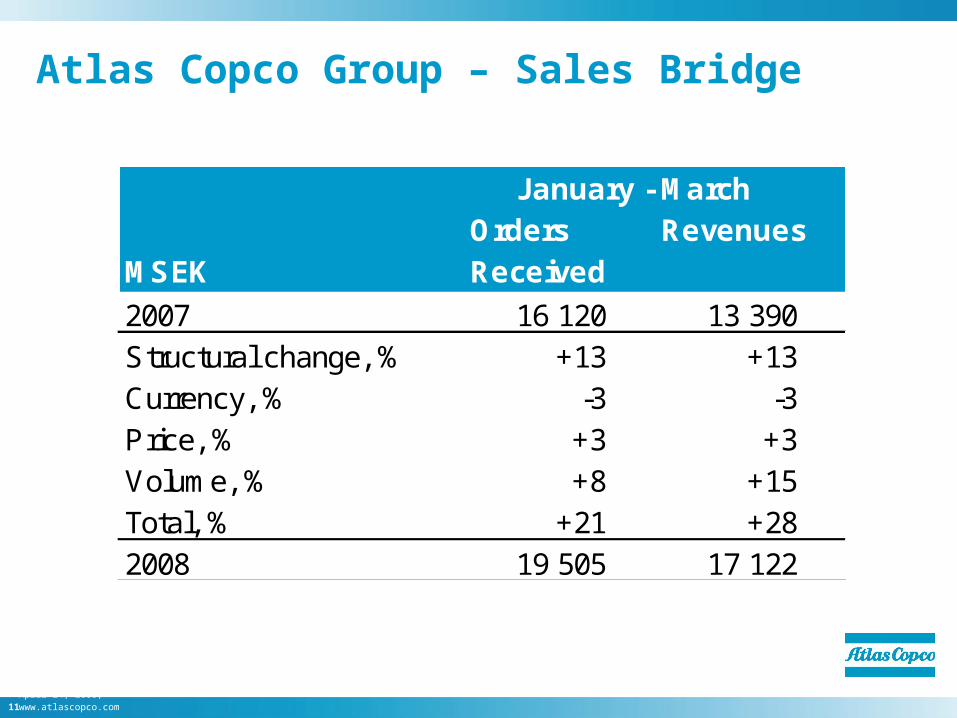
Atlas Copco Group – Sales Bridge
January - MarchOrders Revenues
MSEK Received
2007 16 120 13 390Structural change, % +13 +13Currency, % -3 -3Price, % +3 +3Volume, % +8 +15Total, % +21 +282008 19 505 17 122

12April 24, 2008, www.atlascopco.com
Contents
Q1 Business Highlights
Market Development
Business Areas
Financials
Outlook
13April 24, 2008, www.atlascopco.com
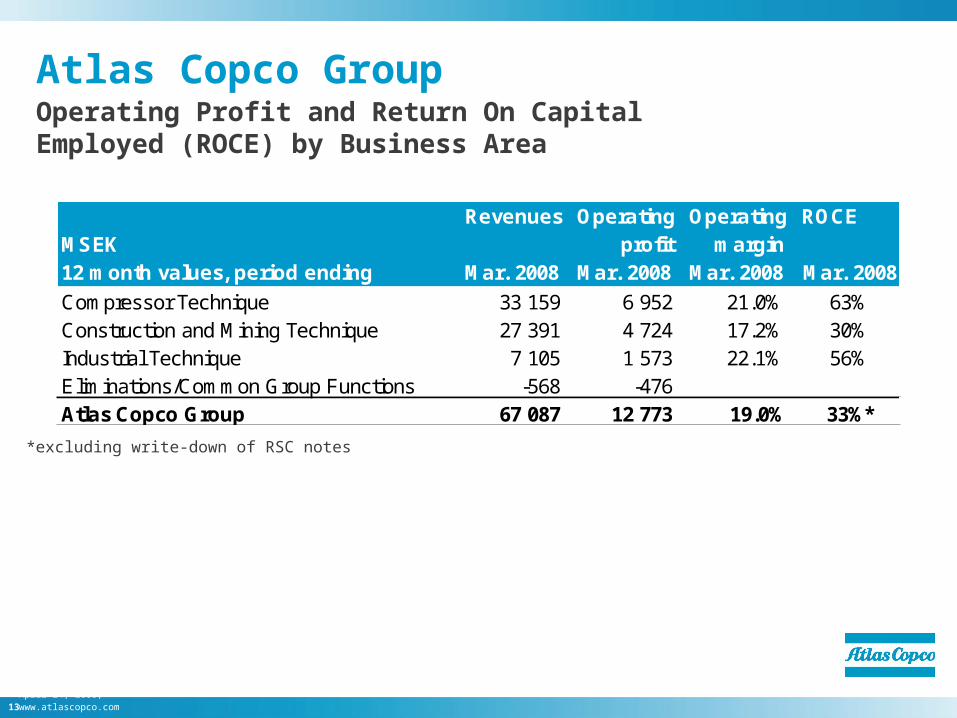
Revenues Operating Operating ROCEMSEK profit margin12 month values, period ending Mar. 2008 Mar. 2008 Mar. 2008 Mar. 2008
Compressor Technique 33 159 6 952 21.0% 63%Construction and Mining Technique 27 391 4 724 17.2% 30%Industrial Technique 7 105 1 573 22.1% 56%Eliminations/Common Group Functions -568 -476Atlas Copco Group 67 087 12 773 19.0% 33%*
Atlas Copco GroupOperating Profit and Return On Capital Employed (ROCE) by Business Area
*excluding write-down of RSC notes
14April 24, 2008, www.atlascopco.com
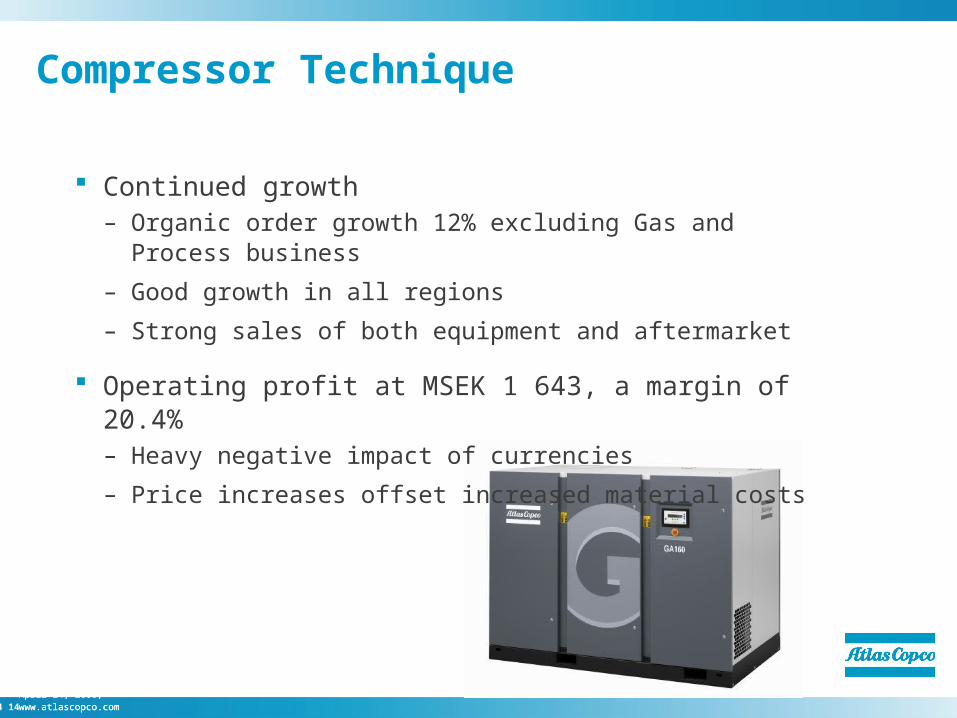
Compressor Technique
14April 24, 2008, www.atlascopco.com
Continued growth– Organic order growth 12% excluding Gas and Process business
– Good growth in all regions
– Strong sales of both equipment and aftermarket
Operating profit at MSEK 1 643, a margin of 20.4%– Heavy negative impact of currencies
– Price increases offset increased material costs

15April 24, 2008, www.atlascopco.com
Compressor Technique
-10
-5
0
5
10
15
20
25
-10
-5
0
5
10
15
20
25
01
Q1
01
Q2
01
Q3
01
Q4
02
Q1
02
Q2
02
Q3
02
Q4
03
Q1
03
Q2
03
Q3
03
Q4
04
Q1
04
Q2
04
Q3
04
Q4
05
Q1
05
Q2
05
Q3
05
Q4
06
Q1
06
Q2
06
Q3
06
Q4
07
Q1
07
Q2
07
Q3
07
Q4
08
Q1
08
Q2
08
Q3
08
Q4
Organic* revenue growth: Change vs. same quarter previous year, %
Quarterly operating margin, %
Quarterly operating margins include Prime Energy from Q1 2006.*Volume and price

16April 24, 2008, www.atlascopco.com
Organic order growth 14%– Continued strong demand from mining industry
– Housing related construction demand slower in some countries
Operating profit up 37%, margin at 17.0%– Margin negatively affected by currency
changes
– Dynapac margin at 9.6%, excluding restructuring costs
Construction and Mining Technique

17April 24, 2008, www.atlascopco.com
-10
-5
0
5
10
15
20
25
30
-10
-5
0
5
10
15
20
25
30
01
Q1
01
Q2
01
Q3
01
Q4
02
Q1
02
Q2
02
Q3
02
Q4
03
Q1
03
Q2
03
Q3
03
Q4
04
Q1
04
Q2
04
Q3
04
Q4
05
Q1
05
Q2
05
Q3
05
Q4
06
Q1
06
Q2
06
Q3
06
Q4
07
Q1
07
Q2
07
Q3
07
Q4
08
Q1
08
Q2
08
Q3
08
Q4
Organic* revenue growth: Change vs. same quarter previous year, %
Quarterly operating margin, %
Construction and Mining Technique
*Volume and price
18April 24, 2008, www.atlascopco.com
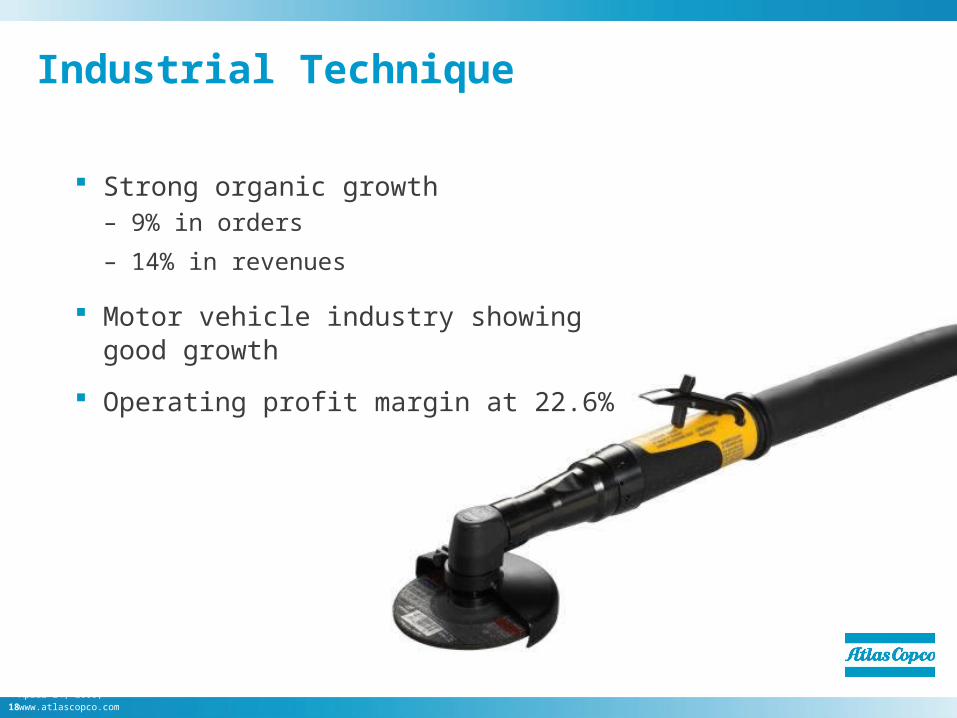
Industrial Technique
Strong organic growth– 9% in orders
– 14% in revenues
Motor vehicle industry showing good growth
Operating profit margin at 22.6%

19April 24, 2008, www.atlascopco.com
Industrial Technique
-5
0
5
10
15
20
25
-5
0
5
10
15
20
25
03
Q1
03
Q2
03
Q3
03
Q4
04
Q1
04
Q2
04
Q3
04
Q4
05
Q1
05
Q2
05
Q3
05
Q4
06
Q1
06
Q2
06
Q3
06
Q4
07
Q1
07
Q2
07
Q3
07
Q4
08
Q1
08
Q2
08
Q3
08
Q4
Organic* revenue growth: Change vs. same quarter previous year, %
Quarterly operating margin, %
*Volume and price
20April 24, 2008, www.atlascopco.com
Contents
Q1 Business Highlights
Market Development
Business Areas
Financials
Outlook
21April 24, 2008, www.atlascopco.com
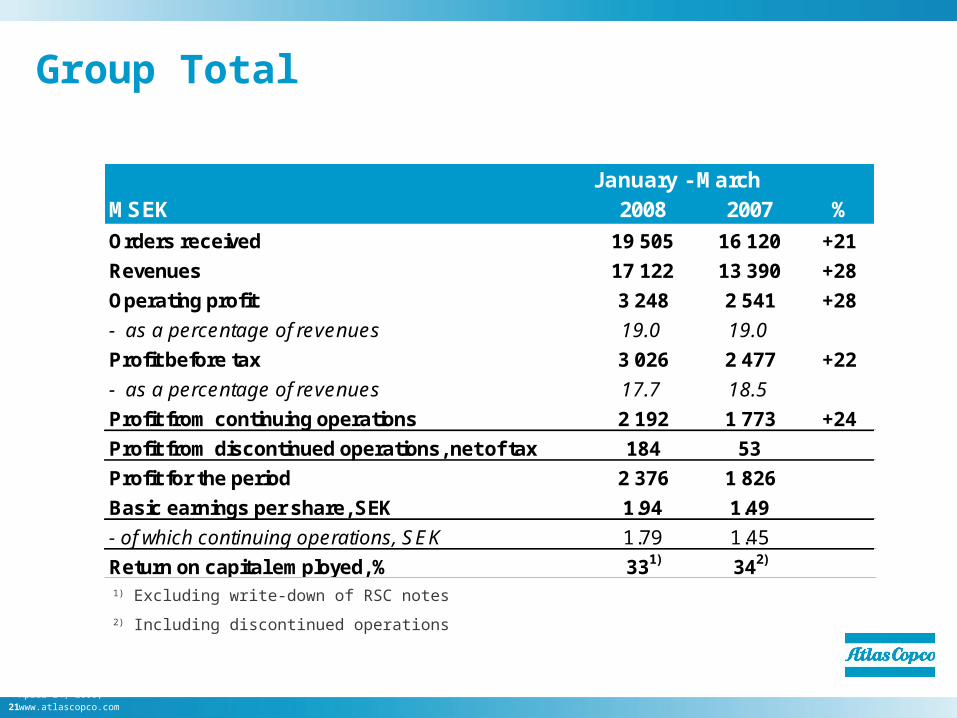
Group Total
January - MarchMSEK 2008 2007 %
Orders received 19 505 16 120 +21
Revenues 17 122 13 390 +28
Operating profit 3 248 2 541 +28
- as a percentage of revenues 19.0 19.0
Profit before tax 3 026 2 477 +22
- as a percentage of revenues 17.7 18.5
Profit from continuing operations 2 192 1 773 +24
Profit from discontinued operations, net of tax 184 53
Profit for the period 2 376 1 826
Basic earnings per share, SEK 1.94 1.49
- of which continuing operations, SEK 1.79 1.45
Return on capital employed, % 331) 342)
1) Excluding write-down of RSC notes
2) Including discontinued operations
22April 24, 2008, www.atlascopco.com
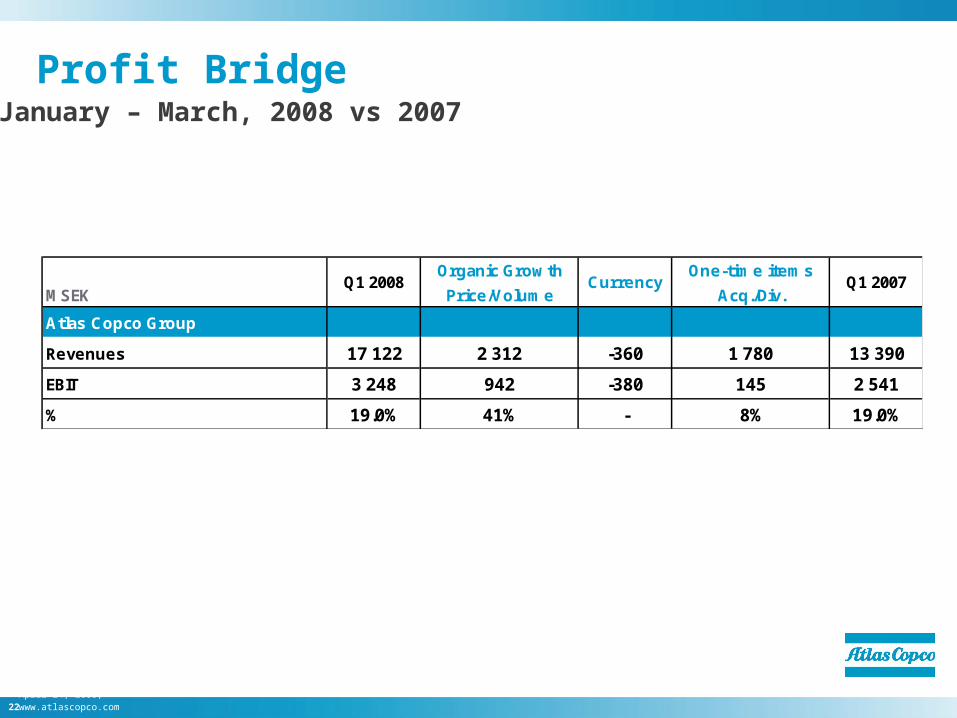
Profit BridgeJanuary – March, 2008 vs 2007
Organic Growth One-time items
MSEK Price/Volume Acq./Div.
Atlas Copco Group
Revenues 17 122 2 312 -360 1 780 13 390
EBIT 3 248 942 -380 145 2 541
% 19.0% 41% - 8% 19.0%
Q1 2008 Currency Q1 2007

23April 24, 2008, www.atlascopco.com
Profit Bridge – by Business AreaJanuary - March, 2008 vs 2007
Q1 2008 Organic Growth Currency One-time items Q1 2007
MSEK Price/Volume Acq./Div.
Compressor Technique
Revenues 8 053 989 -150 420 6 794
EBIT 1 643 383 -205 25 1 440
% 20.4% 39% - 6% 21.2%
Construction & Mining Technique
Revenues 7 344 1 131 -180 1 300 5 093
EBIT 1 252 460 -235 115 912
% 17.0% 41% - 9% 17.9%
Industrial Technique
Revenues 1 825 216 -40 58 1 591
EBIT 412 46 -20 8 378
% 22.6% 21% - 14% 23.8%
One-time items include a capital gain for the divestment of a rental company in Compressor Technique and restructuring costs in Construction and Mining Technique
24April 24, 2008, www.atlascopco.com
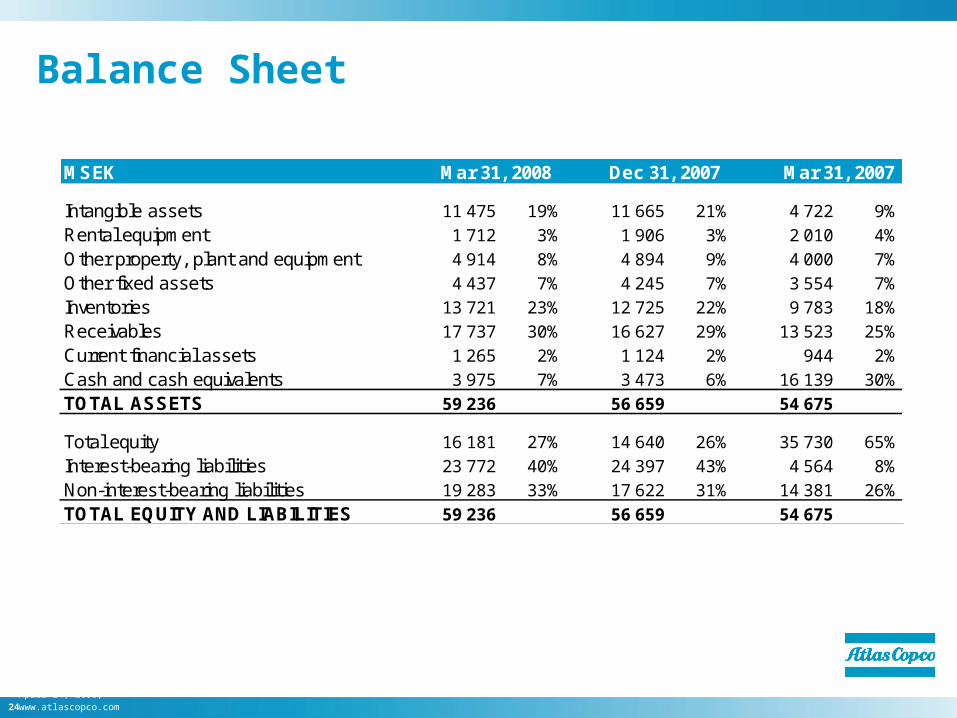
Balance Sheet
MSEK Mar 31, 2008 Dec 31, 2007 Mar 31, 2007
Intangible assets 11 475 19% 11 665 21% 4 722 9%
Rental equipment 1 712 3% 1 906 3% 2 010 4%
Other property, plant and equipment 4 914 8% 4 894 9% 4 000 7%
Other fixed assets 4 437 7% 4 245 7% 3 554 7%
Inventories 13 721 23% 12 725 22% 9 783 18%
Receivables 17 737 30% 16 627 29% 13 523 25%
Current financial assets 1 265 2% 1 124 2% 944 2%
Cash and cash equivalents 3 975 7% 3 473 6% 16 139 30%
TOTAL ASSETS 59 236 56 659 54 675
Total equity 16 181 27% 14 640 26% 35 730 65%
Interest-bearing liabilities 23 772 40% 24 397 43% 4 564 8%
Non-interest-bearing liabilities 19 283 33% 17 622 31% 14 381 26%
TOTAL EQUITY AND LIABILITIES 59 236 56 659 54 675
25April 24, 2008, www.atlascopco.com
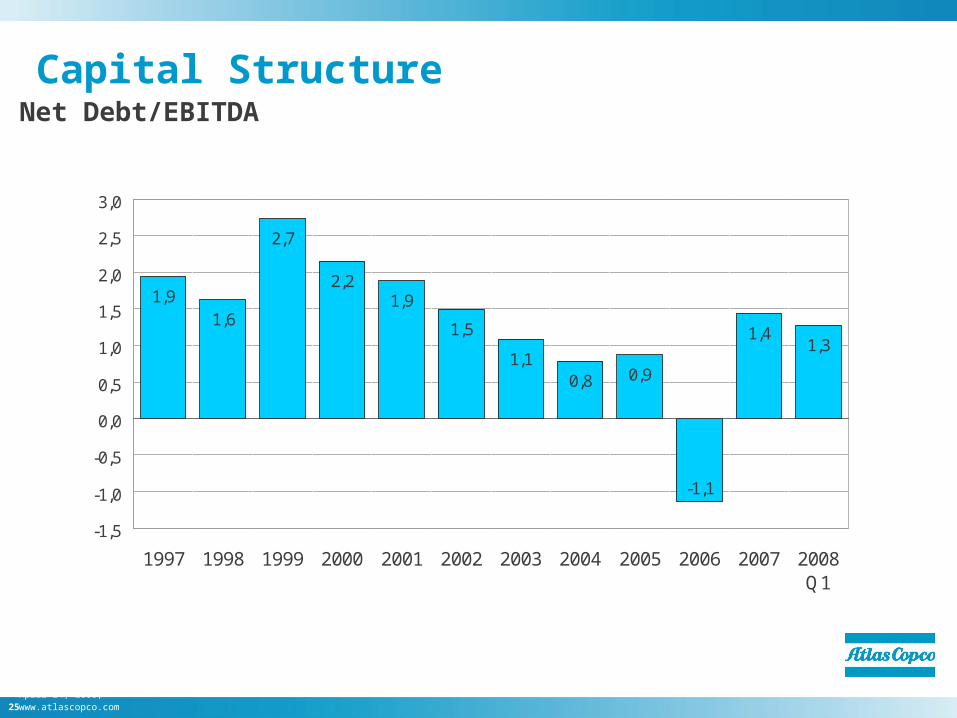
1,91,6
2,7
2,21,9
1,5
1,10,8 0,9
-1,1
1,41,3
-1,5
-1,0
-0,5
0,0
0,5
1,0
1,5
2,0
2,5
3,0
1997 1998 1999 2000 2001 2002 2003 2004 2005 2006 2007 2008Q1
Capital Structure Net Debt/EBITDA
26April 24, 2008, www.atlascopco.com
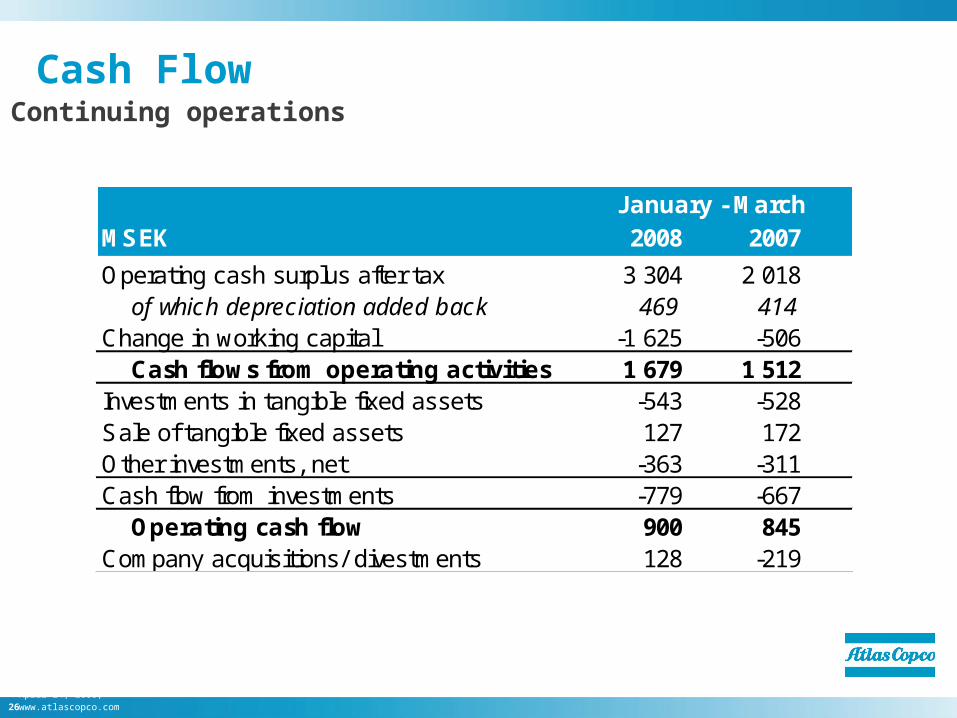
Cash FlowContinuing operations
January - MarchMSEK 2008 2007
Operating cash surplus after tax 3 304 2 018 of which depreciation added back 469 414Change in working capital -1 625 -506 Cash flows from operating activities 1 679 1 512Investments in tangible fixed assets -543 -528Sale of tangible fixed assets 127 172Other investments, net -363 -311Cash flow from investments -779 -667 Operating cash flow 900 845Company acquisitions/ divestments 128 -219
27April 24, 2008, www.atlascopco.com
Contents
Q1 Business Highlights
Market Development
Business Areas
Financials
Outlook
28April 24, 2008, www.atlascopco.com
Near-term Outlook
The demand for Atlas Copco’s products and services from most customer segments and regions is expected to remain at a high level.
The positive outlook includes the main part of the construction segment, while certain sectors, primarily related to housing is expected to remain weak in North America and parts of Europe.

29

30April 24, 2008, www.atlascopco.com
Cautionary Statement
“Some statements herein are forward-looking and the actual outcome could be materially different. In addition to the factors explicitly commented upon, the actual outcome could be materially effected by other factors like for example, the effect of economic conditions, exchange-rate and interest-rate movements, political risks, impact of competing products and their pricing, product development, commercialization and technological difficulties, supply disturbances, and major customer credit losses.”