April 15, 2020
14
1 April 15, 2020
Transcript of April 15, 2020

1
April 15, 2020

2
This presentation contains forward-looking statements, including, but not limited to, the Company’s plans in response to the novel coronavirus (COVID-19). Many of theseforward-looking statements can be identified by use of words such as may, will, expect, anticipate, approximate, estimate, assume, continue, model, project, plan, goal,and similar words and phrases, although the absence of those words does not necessarily mean that statements are not forward-looking. The Company’s actual resultsand future financial condition may differ materially from those expressed in any such forward-looking statements as a result of many factors. Such factors include,without limitation: general economic conditions including the housing market, a challenging overall macroeconomic environment and related changes in the retailingenvironment; risks associated with the COVID-19 and the governmental responses to it, including its impacts across the Company’s businesses on demand and operations,as well as on the operations of the Company’s suppliers and other business partners, and the effectiveness of the Company's actions taken in response to these risks;consumer preferences, spending habits and adoption of new technologies; demographics and other macroeconomic factors that may impact the level of spending for thetypes of merchandise sold by the Company; civil disturbances and terrorist acts; unusual weather patterns and natural disasters; competition from existing and potentialcompetitors across all channels; pricing pressures; liquidity; the ability to achieve anticipated cost savings, and to not exceed anticipated costs, associated withorganizational changes and investments; the ability to attract and retain qualified employees in all areas of the organization; the cost of labor, merchandise and othercosts and expenses; potential supply chain disruption due to trade restrictions, and other factors such as natural disasters, such as pandemics, including the COVID-19pandemic, political instability, labor disturbances, product recalls, financial or operational instability of suppliers or carriers, and other items; the ability to find suitablelocations at acceptable occupancy costs and other terms to support the Company’s plans for new stores; the ability to establish and profitably maintain the appropriatemix of digital and physical presence in the markets it serves; the ability to assess and implement technologies in support of the Company’s development of itsomnichannel capabilities; the ability to effectively and timely adjust the Company’s plans in the face of the rapidly changing retail and economic environment, including inresponse to the COVID-19 pandemic; uncertainty in financial markets; volatility in the price of the Company’s common stock and its effect, and the effect of other factors,including the COVID-19 pandemic, on the Company’s capital allocation strategy; risks associated with the ability to achieve a successful outcome for its business conceptsand to otherwise achieve its business strategies; the impact of intangible asset and other impairments; disruptions to the Company’s information technology systemsincluding but not limited to security breaches of systems protecting consumer and employee information or other types of cybercrimes or cybersecurity attacks;reputational risk arising from challenges to the Company’s or a third party product or service supplier’s compliance with various laws, regulations or standards, includingthose related to labor, health, safety, privacy or the environment; reputational risk arising from third-party merchandise or service vendor performance in direct homedelivery or assembly of product for customers; changes to statutory, regulatory and legal requirements, including without limitation proposed changes affectinginternational trade; changes to, or new, tax laws or interpretation of existing tax laws; new, or developments in existing, litigation, claims or assessments; changes to, ornew, accounting standards; and foreign currency exchange rate fluctuations. The Company does not undertake any obligation to update its forward-looking statements.

33
Responding to COVID-19 4
Strengthening Our Financial Position 5
Driving Strategic Growth Plan 6
FY 2019 Q4 Financial Results Summary 7
Outlook 8
FY 2019 Q4 P&L Summary 10
Special Items 11
Non-GAAP Reconciliation Tables 12

4
#1 Priority is the health and safety of our customers and team
Quickly Implements Contingency Plan
▪ Essential Response Unit – focused on People, Operations, Customers, Technology and Finances
▪ Adapting and taking decisive actions to keep our people safe, deliver for our customers and strengthen our liquidity and financial flexibility
Temporarily Closes Stores
▪ As of 3/20/20, >50% of stores have been temporarily closed until 4/3/20
▪ As of 3/23/20, all stores temporarily closed other than buybuy BABY and Harmon Face Values stores (~170 stores in total), subject to state and local regulations
o Continue to provide essential items such as infant, health and personal care products in-store and online
▪ As of 4/2/20, temporary store closures extended until at least 5/2/20
Enhances Omni Fulfillment Capabilities
▪ Converting ~25% of Bed Bath & Beyond and buybuy BABY stores in the US/Canada into regional fulfillment centers to assign orders locally and deliver quickly; expanding store capacity significantly
▪ Fast-tracked implementation of curbside pickup and BOPIS

5
Taking Proactive Steps to Preserve Liquidity and Financial Flexibility
Implements Additional Cost Reductions
▪ Furloughed majority of store associates and portion of corporate associates until at least 5/2/20
▪ Temporarily reduced salaries of senior executive team by 30%
▪ Temporarily reduced quarterly cash compensation of Board of Directors by 30%
▪ Reducing discretionary spend (e.g., business travel, advertising)
▪ Renegotiating extensions of payment terms for goods and services, and rent
▪ Managing to lower inventory levels
Takes Further Actions
▪ Drew down additional $236 million remaining of available funds from revolving credit facility
▪ Suspended prior FY2020 plans for share repurchases, future dividends and debt reduction
▪ Postponed $150 million in planned FY2020 CAPEX
▪ Implementing applicable benefits of CARES Act
Mark Tritton
President and CEO
While Spring celebrations may look very different this year, the essence of this time of year remains the same: renewal and joy. In light of what’s happening in our world today, the season of optimism and hope could not have come at a better time.
I want to take a moment to express my sincerest thanks to you, our customers, who continue to shop with us. We are honored you choose us for your needs and we pledge to do all we can to make your experience with us the best it can be.
I also want to give a heartfelt thank-you to our associates who have been working so hard to fill online orders and deliver the items you need right now. Their dedication is astonishing, and so deeply appreciated. This Sunday, our warehouses and distribution centers will be closed to provide our associates with much-needed downtime to connect with family and friends.
Whether you are able to celebrate with family (even if through phones and screens) or individually, best wishes for a joyful holiday.
April 12, 2020

6
Investing With Confidence Where It Matters Most Recruiting Talent Remains a Priority
▪ Joe Hartsig, Chief Merchandising Officer, President of Harmon joined 3/4/20
▪ More announcements to come in the upcoming weeks
Generating Funds from Sale of Assets
▪ Sold One Kings Lane business to a 3rd party for an undisclosed amount (April 2020)
▪ Signed definitive agreement to sell PersonalizationMall.com for ~$252 million; Filed claim to enforce rights
▪ Completed sale-leaseback transaction for ~$250 million
▪ While no assurances can be made, Company will continue to pursue other portfolio adjustments and evaluate remaining owned real estate
Focusing Investments on Core Business and Key Projects That Support Omni-Channel Capabilities
▪ Omni fulfillment (e.g., BOPIS, curbside pickup, leveraging store inventory)
▪ Omni inventory management
▪ Digital marketing and personalization (e.g. creating newness and freshness across our websites and communicating items customers need to make it easy to feel at home)
▪ Re-engineering supply chain and vendor relationships
▪ Further strengthening owned-brand strategy
▪ Further digital enhancements (e.g. improve site speed, checkout experience and simplify process)
Original Copy Revised Copy Refreshed Copy
Bed Bath & Beyond is taking on an even more important role supporting customers and their families by making it easy to feel at home

7
▪ On a GAAP basis, a net loss per diluted share of ($0.53) vs. a net loss per diluted share of ($1.92) in the prior year period
• Reported net loss includes an unfavorable impact of $0.91 per diluted share for special items including: ~$41 million in severance costs; non-cash charge of ~$35 million for impairment of certain store-level assets; non-cash charge of ~$33 million for impairment of certain tradenames and other assets; and ~$33 million expense related to loss on sale-leaseback transaction, including transaction fees
• On an adjusted basis, net earnings per diluted share of $0.38
▪ Net sales of $3.1B, a decrease of 6.1%; Comp sales decline of 5.6%, including ~10% decline in stores, and ~16% increase in digital channels
• Sales significantly impacted by calendar shift of Cyber Monday holiday into FY 2019 Q4 (not included in FY 2018 Q4)
• Adjusting for calendar shift (exclude Cyber Monday week from both periods), Comp sales decline 11%, with ~13.6% decline in store and ~1.1% growth in digital
▪ Gross Margin of 32.6% decline 210 bps vs. FY 2018 Q4, primarily due to unfavorable impact on merchandise margin from promotional activity and markdowns, and an increase in net direct-to-customer shipping expense due to higher penetration of digital sales within the total mix of quarterly sales
▪ Adjusted SG&A expense (as % of sales) of 30.7% increase ~250 bps, in order of magnitude, was primarily due to consulting expense (~100 bps), increase in advertising expense, including digital marketing, and to a lesser extent, effect of fixed costs on a lower sales base
▪ Adjusted tax rate of (3.3%), including ~$8.3 million of net after tax benefits due to distinct events occurring during the quarter
▪ Cash and investments balance of $1.4B at the end of FY 2019 Q4
▪ Adjusted Retail Inventories of $2.1B (at cost) at the end of FY 2019 Q4, a reduction of ~16% or over $400 million (at cost) vs FY 2018 Q4
8
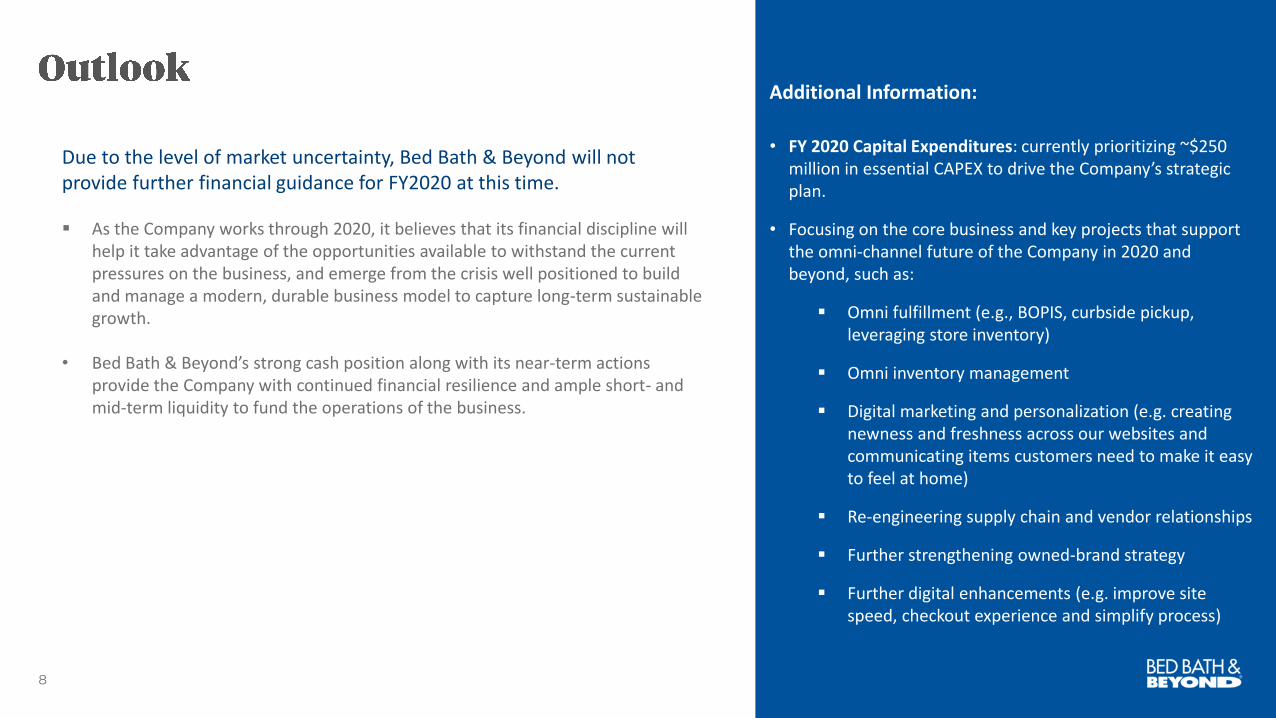
Additional Information:
• FY 2020 Capital Expenditures: currently prioritizing ~$250 million in essential CAPEX to drive the Company’s strategic plan.
• Focusing on the core business and key projects that support the omni-channel future of the Company in 2020 and beyond, such as:
▪ Omni fulfillment (e.g., BOPIS, curbside pickup, leveraging store inventory)
▪ Omni inventory management
▪ Digital marketing and personalization (e.g. creating newness and freshness across our websites and communicating items customers need to make it easy to feel at home)
▪ Re-engineering supply chain and vendor relationships
▪ Further strengthening owned-brand strategy
▪ Further digital enhancements (e.g. improve site speed, checkout experience and simplify process)
Due to the level of market uncertainty, Bed Bath & Beyond will not provide further financial guidance for FY2020 at this time.
▪ As the Company works through 2020, it believes that its financial discipline will help it take advantage of the opportunities available to withstand the current pressures on the business, and emerge from the crisis well positioned to build and manage a modern, durable business model to capture long-term sustainable growth.
• Bed Bath & Beyond’s strong cash position along with its near-term actions provide the Company with continued financial resilience and ample short- and mid-term liquidity to fund the operations of the business.

9

10
(amounts in millions, except comp sales %, % of sales, and earnings per share data)
10
February 29, 2020 % of Sales March 2, 2019 % of Sales
Comp Sales % (5.6) (1.4)
Net Sales $3,107 100.0 $3,308 100.0
Gross Profit $1,014 32.6 $1,147 34.7 (2.1) (a)
SG&A Expenses $953 (b) 30.7 $934 (c) 28.2 (2.5) (d)
Operating Profit $61 (b) 2.0 $213 (c) 6.4 (4.4)
Net Earnings $47 (b) 1.5 $159 (c) 4.8 (3.3)
EPS - Diluted $0.38 (b) $1.20 (c)
WAS - Diluted 123 132
(a)
(b) Excludes severance expense, tradename and other impairments, and the loss on a sale leaseback transaction, including transacton fees.
(c)
(d) As a percentage of net sales, the increase was primarily due to higher consulting expense associated with our efforts to expedite
the ongoing transformation and review of assets, and an increase in advertising expense, including digital marketing, related to
the heavy promotional activity, and the effect of fixed costs, such as occupancy and technology-related expenses, including
depreciation, on a lower sales base.
% Change
Three Months Ended
Excludes goodwill and other impairments.
As a percentage of net sales, primarily due to lower merchandise margin from promotional activity and markdowns, and an increase in
net direct-to-customer shipping expense due to a higher penetration of digital sales.

11Refer to http://bedbathandbeyond.gcs-web.com/investor-relations for non-GAAP reconciliation tables included in relevant quarterly press releases.
Q1 Q2 Q3 Q4 YTD Q1 Q2 Q3 Q4 YTD
Incremental Charge
for Markdowns- $194 ($24) - $170 - - - - -
Severance Costs $39 $23 - $41 $103 $9 $5 - - $14
Goodwill and Other
Impairments$401 $28 $12 $68 $509 - - - $510 $510
Loss on Sale
Leaseback
Transaction
- - - $33 $33
Shareholder Activity
Costs$8 - - - $8 - - - - -
Gain on Sale of
Building- - - - - - - ($28) - ($28)
Total $448 $245 ($12) $142 $823 $9 $5 ($28) $510 $496
FY 2018FY 2019
Special Item
12
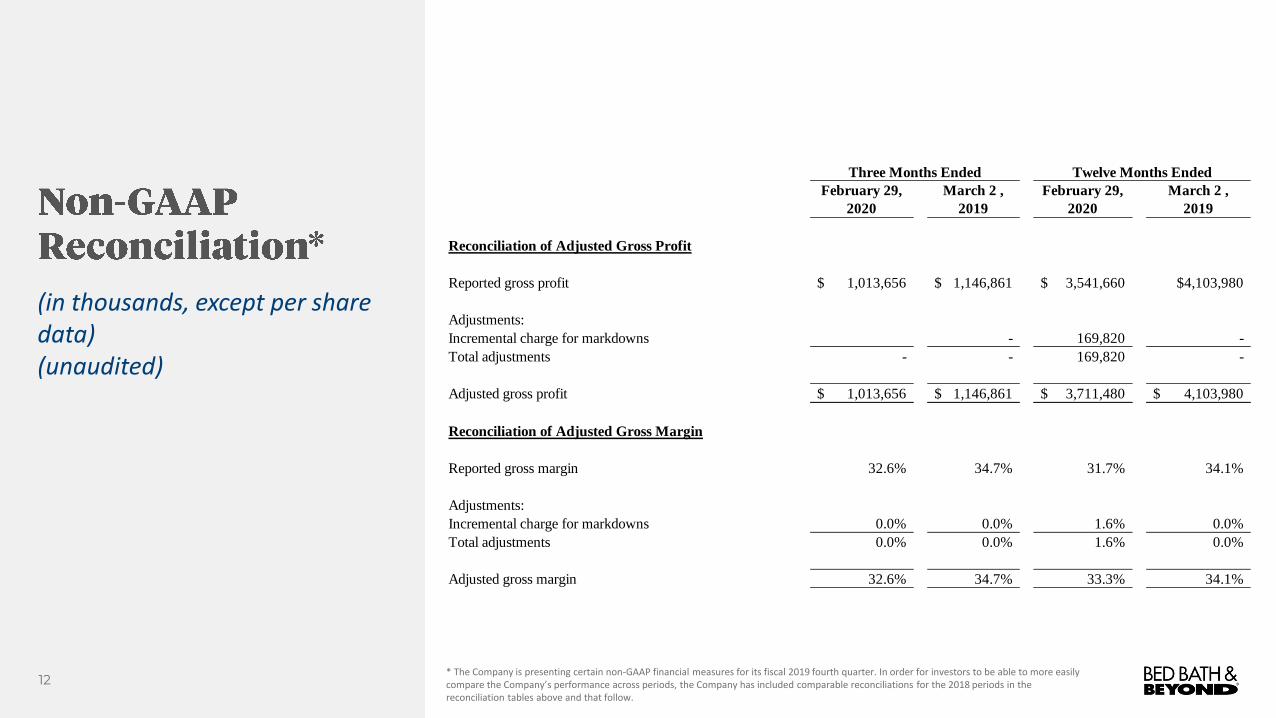
(in thousands, except per share data)(unaudited)
12* The Company is presenting certain non-GAAP financial measures for its fiscal 2019 fourth quarter. In order for investors to be able to more easily compare the Company’s performance across periods, the Company has included comparable reconciliations for the 2018 periods in the reconciliation tables above and that follow.
February 29,
2020
March 2 ,
2019
February 29,
2020
March 2 ,
2019
Reconciliation of Adjusted Gross Profit
Reported gross profit 1,013,656$ 1,146,861$ 3,541,660$ $4,103,980
Adjustments:
Incremental charge for markdowns - 169,820 -
Total adjustments - - 169,820 -
Adjusted gross profit 1,013,656$ 1,146,861$ 3,711,480$ 4,103,980$
Reconciliation of Adjusted Gross Margin
Reported gross margin 32.6% 34.7% 31.7% 34.1%
Adjustments:
Incremental charge for markdowns 0.0% 0.0% 1.6% 0.0%
Total adjustments 0.0% 0.0% 1.6% 0.0%
Adjusted gross margin 32.6% 34.7% 33.3% 34.1%
Three Months Ended Twelve Months Ended

13
(in thousands, except per share data)(unaudited)
* The Company is presenting certain non-GAAP financial measures for its fiscal 2019 fourth quarter. In order for investors to be able to more easily compare the Company’s performance across periods, the Company has included comparable reconciliations for the 2018 periods in the reconciliation tables above and that follow.
13
February 29,
2020
March 2 ,
2019
February 29,
2020
March 2 ,
2019
Reconciliation of Adjusted Selling, General and Administrative Expenses
Reported selling, general and administrative expenses 1,027,041$ 933,691$ 3,732,498$ 3,681,210$
Adjustments:
Severance costs (41,308) - (102,507) (13,892)
Shareholder activity costs - - (8,000) -
Loss from sale-leaseback transaction, including transaction fees (32,840) - (32,840) -
Gain on sale of a building - - 28,281
Total adjustments (74,148) - (143,347) 14,389
Adjusted selling, general and administrative expenses 952,893$ 933,691$ 3,589,151$ 3,695,599$
Reconciliation of Adjusted Selling, General and Administrative Expenses as a Percent of Net Sales
Reported selling, general and administrative expenses as a percent of net sales 33.1% 28.2% 33.4% 30.6%
Adjustments:
Severance costs (1.3%) 0.0% (0.9%) (0.1%)
Shareholder activity costs 0.0% 0.0% 0.0% 0.0%
Loss from sale-leaseback transaction, including transaction fees (1.1%) 0.0% (0.3%) 0.0%
Gain on sale of a building 0.0% 0.0% 0.0% 0.2%
Total adjustments (2.4%) 0.0% (1.2%) 0.1%
Adjusted selling, general and administrative expenses as a percent of net sales 30.7% 28.2% 32.2% 30.7%
Three Months Ended Twelve Months Ended

14
(in thousands, except per share data)(unaudited)
14* The Company is presenting certain non-GAAP financial measures for its fiscal 2019 fourth quarter. In order for investors to be able to more easily compare the Company’s performance across periods, the Company has included comparable reconciliations for the 2018 periods in the reconciliation tables above.
February 29,
2020
March 2 ,
2019
February 29,
2020
March 2 ,
2019
Reconciliation of Adjusted Effective Income Tax Rate
Reported effective income tax rate 32.3% 18.7%
Impact on operating loss and benefit for income taxes of goodwill and other
impairments, severance costs, and loss from sale-leaseback transaction,
including transaction fees
Adjusted effective income tax rate (3.3%) 19.7%
Reconciliation of Adjusted Net (Loss) Earnings
Reported net (loss) earnings (65,414)$ (253,793)$ (613,816)$ (137,224)$
Pre-tax adjustments:
Incremental charge for markdowns - - 169,820 -
Severance costs 41,308 - 102,507 13,892
Goodwill and other impairments (a) 67,821 509,905 509,226 509,905
Shareholder activity costs - 8,000 -
Loss from sale-leaseback transaction, including transaction fees 32,840 32,840
Gain on sale of a building - - (28,281)
Total pre-tax adjustments 141,969 509,905 822,393 495,516
Tax impact of adjustments (29,666) (97,286) (151,231) (93,456)
Total adjustments, after tax 112,303 412,619 671,162 402,060
Adjusted net (loss) earnings 46,889$ 158,826$ 57,346$ 264,836$
Reconciliation of Adjusted Net (Loss) Earnings per Diluted Share
Reported net (loss) earnings per diluted share (0.53)$ (1.92)$ (4.94)$ (1.02)$
Goodwill and other impairments, severance costs, shareholder activity costs,
incremental charge for markdowns, loss on sale leaseback
transaction, including transaction fees, and gain on sale of a building 0.91 3.12 5.40 2.99
Adjusted net (loss) earnings per diluted share 0.38$ 1.20$ 0.46$ 1.97$
(a) Goodwill and other impairments include: (1) goodwill, tradename, store asset and other impairments related to the North American Retail
reporting unit; and (2) tradename impairments related to the Institutional Sales reporting unit.
Three Months Ended Twelve Months Ended