April 12, 2019 federal and state laws. The school’s report ...
55
April 12, 2019 Dear Parents and Community Members: We are pleased to present you with the Annual Education Report (AER) which provides key information on the 2017-18 educational progress for the Innocademy Allegan Campus. The AER addresses the complex reporting information required by federal and state laws. The school’s report contains information about student assessment, accountability, and teacher quality. If you have any questions about the AER, please contact Marty Lappe for assistance. The AER is available for you to review electronically by visiting the following web site MI School Data Combined Report, or you may review a copy in the main office at your child’s school. For the 2017-18 school year, schools were identified using definitions and labels as required in the Every Student Succeeds Act (ESSA). A Targeted Support and Improvement (TSI) school is one that has at least one underperforming student subgroup. An Additional Targeted Support (ATS) school is one that has three or more underperforming student subgroups. A Comprehensive Support and Improvement (CSI) school is one whose performance is in the lowest 5% of all schools in the state or has a graduation rate at or below 67%. Some schools are not identified with any of these labels. In these cases, no label is given. * Note TSI and ATS definitions were changed for the 2018-19 school year per federal requirements. The new definitions are: TSI – The school has at least one subgroup performing in the bottom 25% within each applicable accountability index component. ATS – The school has met the criteria for TSI identification and has at least one subgroup performing at the same level as a CSI school. Our school has not been given one of these labels. However, one of our biggest challenges that we face is our student achievement assessment scores, particularly with the MSTEP. This year, we’re spending much more time attacking the assessment from both the academic and social-emotional aspects. Our interventionist is talking to all students about test taking strategies; our school social worker is talking to all students about test anxiety and ways to reduce the
Transcript of April 12, 2019 federal and state laws. The school’s report ...

April 12, 2019
Dear Parents and Community Members:
We are pleased to present you with the Annual Education Report (AER) which
provides key information on the 2017-18 educational progress for the Innocademy
Allegan Campus. The AER addresses the complex reporting information required by
federal and state laws. The school’s report contains information about student
assessment, accountability, and teacher quality. If you have any questions about
the AER, please contact Marty Lappe for assistance.
The AER is available for you to review electronically by visiting the following web
site MI School Data Combined Report, or you may review a copy in the main office
at your child’s school.
For the 2017-18 school year, schools were identified using definitions and labels as
required in the Every Student Succeeds Act (ESSA). A Targeted Support and
Improvement (TSI) school is one that has at least one underperforming student
subgroup. An Additional Targeted Support (ATS) school is one that has three or
more underperforming student subgroups. A Comprehensive Support and
Improvement (CSI) school is one whose performance is in the lowest 5% of all
schools in the state or has a graduation rate at or below 67%. Some schools are
not identified with any of these labels. In these cases, no label is given.
* Note TSI and ATS definitions were changed for the 2018-19 school year per
federal requirements. The new definitions are:
TSI – The school has at least one subgroup performing in the bottom 25%
within each applicable accountability index component.
ATS – The school has met the criteria for TSI identification and has at least
one subgroup performing at the same level as a CSI school.
Our school has not been given one of these labels. However, one of our biggest
challenges that we face is our student achievement assessment scores, particularly
with the MSTEP. This year, we’re spending much more time attacking the
assessment from both the academic and social-emotional aspects. Our
interventionist is talking to all students about test taking strategies; our school
social worker is talking to all students about test anxiety and ways to reduce the

stress; our teachers are providing opportunities for students to practice the test;
and our lead is talking to each individual student about his/her scores from last
year and the importance of putting forth his/her best effort during the test. We
believe that by implementing these strategies, our student achievement will
improve.
State law requires that we also report additional information.
STUDENT ASSIGNMENT PROCESS
Innocademy Allegan Campus has an open enrollment policy and does not
discriminate on the basis of intellectual or physical abilities, achievement or
aptitude, religion, race, or gender. In the event student enrollment applications
exceed available positions, a random selection lottery drawing is conducted under
the direction of a representative of the authorizer Lake Superior State University.
3-5 YEAR SCHOOL IMPROVEMENT PLAN
Innocademy Allegan Campus is in the fourth year of the School Improvement Plan.
Staff are working with students in goal areas of reading, writing and math.
Innocademy Allegan Campus' improvement team is focused on implementing
innovative, best practices in all content areas. Within the school improvement
process, staff are able to analyze data and adjust instruction with a goal of
improved student learning, as well as provide opportunities for flexible groupings
(just right learning groups).
CORE CURRICULUM
Innocademy Allegan Campus will continue to follow Common Core state standards.
These standards can be located at www.corestandards.org. In order to implement
these standards, we use approved resources, such as Lucy Calkins Reading and
Writing Workshop Curriculum, Words Their Way, Math Expressions, Battle Creek
Science, Nystrom, and Social Studies Alive. The school’s curriculum can be found at
our website. Innocademy Allegan Campus offers Just Right Learning groups in an
effort to meet the students’ individual needs. This is a three-prong approach, which
includes using academic data, social readiness, and parent conferences.
To strengthen our academic program, Innocademy Allegan Campus implements
additional experiences like:
1. Multi-Age Collaboration
2. Nature-based curriculum through a partnership with Outdoor Discovery Center
3. Stewardship
4. Capstone Trips: Extended Field Experiences
5. Special Education
6. Seven Habits of Happy Kids and Community Partnerships
7. 1:1 devices
8. MTSS Program

Innocademy Allegan offers a high quality, college and career-ready education within
an environment that focuses on development of the whole child and integrates
global awareness and acquisition of 21st Century Skills. Our students will graduate
from high school and participate in post-secondary education having demonstrated
the skills needed to become an active and productive citizen in a global community.
AGGREGATE STUDENT DATA
• Elementary or middle school assessment results on the Michigan Student
Test of Educational Progress (M-STEP), high school assessment results on the M-STEP component of the Michigan Merit Exam (MME), and assessment
results for students with disabilities on Michigan’s Alternative Assessment Program (MI-Access).
• Presents achievement data for all four tested subjects (English language arts, mathematics, science, and social studies) compared to targets for all
students as well as subgroups of students
ACCOUNTABILITY SCORECARD-DETAIL DATA AND STATUS
The accountability portion of the AER includes assessment proficiency and
participation rates, graduation or attendance rates, as well as accountability
scorecard status.
TEACHER QUALIFICATION DATA
• Identifies teacher qualifications at district and school levels
• Reports percentage of core academic classes taught by teachers not
considered highly qualified to teach such classes
NAEP DATA (NATIONAL ASSESSMENT OF EDUCATIONAL PROGRESS)
• Provides state results of the national assessment in mathematics and reading
every other year in grades 4 and 8
PARENTAL INVOLVMENT
Parent involvement is very important and encouraged at Innocademy Allegan
Campus. In addition to conferences, Innocademy Allegan Campus also holds four
parent meetings every year. We strive to communicate weekly through school-wide
emails and provide classroom updates at least once a month. There are several
volunteer opportunities for parents both at school and at home, as well as active
parent/teacher School Enhancement Team
On behalf of the Innocademy Allegan Campus staff, we would like to thank all of
those who have helped make our school an amazing place for children to learn.
Your patience, persistence, and willingness for change made this year possible.
Sincerely,
InnocademyAllegan Campus Team

04/09/2019
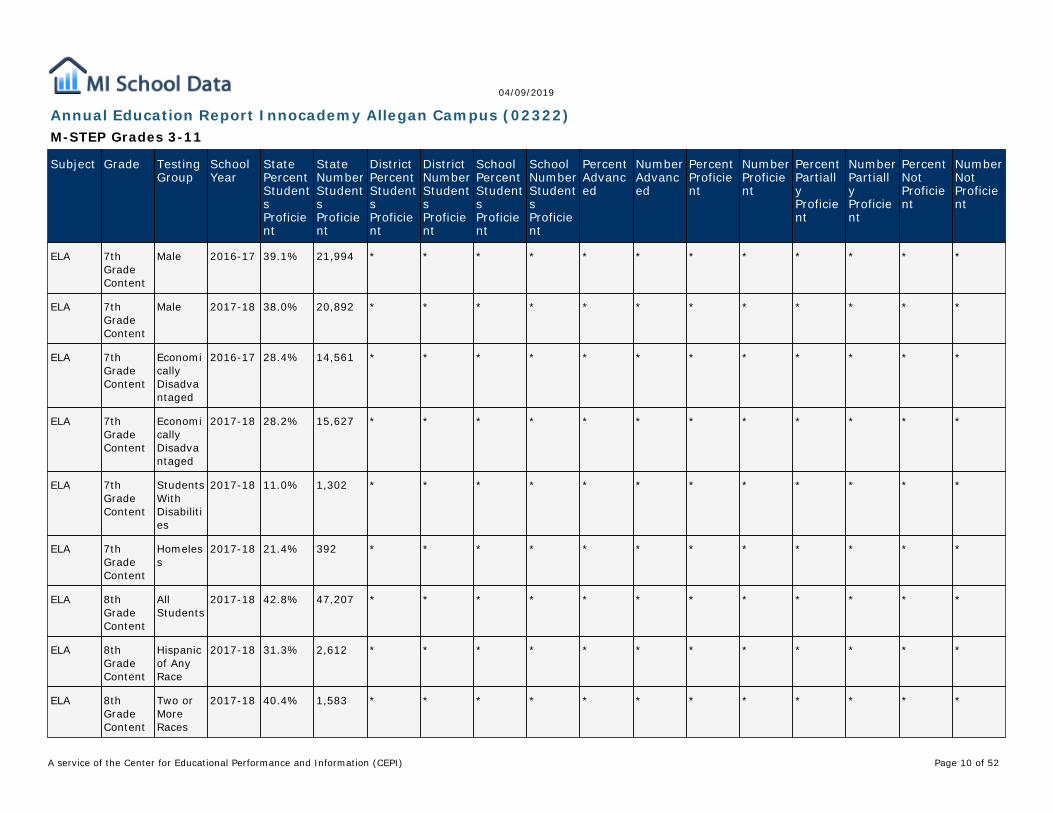
Annual Education Report Innocademy Allegan Campus (02322)M-STEP Grades 3-11
Subject Grade TestingGroup
SchoolYear
StatePercentStudentsProficient
StateNumberStudentsProficient
DistrictPercentStudentsProficient
DistrictNumberStudentsProficient
SchoolPercentStudentsProficient
SchoolNumberStudentsProficient
PercentAdvanced
NumberAdvanced
PercentProficient
NumberProficient
PercentPartiallyProficient
NumberPartiallyProficient
PercentNotProficient
NumberNotProficient
ELA 3rdGradeContent
AllStudents
2016-17 44.1% 46,000 * * * * * * * * * * * *
ELA 3rdGradeContent
AllStudents
2017-18 44.4% 45,377 50% 3 50% 3 50% <3 50% * 50% 3 50% 6
ELA 3rdGradeContent
Black orAfricanAmerican
2016-17 19.9% 3,785 * * * * * * * * * * * *
ELA 3rdGradeContent
Hispanicof AnyRace
2017-18 32.9% 2,721 * * * * * * * * * * * *
ELA 3rdGradeContent
Two orMoreRaces
2017-18 42.2% 1,967 * * * * * * * * * * * *
ELA 3rdGradeContent
White 2016-17 51.7% 35,180 * * * * * * * * * * * *
ELA 3rdGradeContent
White 2017-18 52.3% 34,541 * * * * * * * * * * * *
ELA 3rdGradeContent
Female 2016-17 47.7% 24,357 * * * * * * * * * * * *
ELA 3rdGradeContent
Female 2017-18 47.4% 23,793 * * * * * * * * * * * *
Page 1 of A service of the Center for Educational Performance and Information (CEPI) 52

04/09/2019
Annual Education Report Innocademy Allegan Campus (02322)M-STEP Grades 3-11
Subject Grade TestingGroup
SchoolYear
StatePercentStudentsProficient
StateNumberStudentsProficient
DistrictPercentStudentsProficient
DistrictNumberStudentsProficient
SchoolPercentStudentsProficient
SchoolNumberStudentsProficient
PercentAdvanced
NumberAdvanced
PercentProficient
NumberProficient
PercentPartiallyProficient
NumberPartiallyProficient
PercentNotProficient
NumberNotProficient
ELA 3rdGradeContent
Male 2016-17 40.7% 21,643 * * * * * * * * * * * *
ELA 3rdGradeContent
Male 2017-18 41.4% 21,584 * * * * * * * * * * * *
ELA 3rdGradeContent
EconomicallyDisadvantaged
2016-17 29.1% 15,756 * * * * * * * * * * * *
ELA 3rdGradeContent
EconomicallyDisadvantaged
2017-18 30.3% 17,477 50% <3 50% * 50% <3 50% <3 * 3 * 6
ELA 3rdGradeContent
StudentsWithDisabilities
2016-17 19.6% 2,238 * * * * * * * * * * * *
ELA 3rdGradeContent
StudentsWithDisabilities
2017-18 19.2% 2,210 * * * * * * * * * * * *
ELA 4thGradeContent
AllStudents
2016-17 44.2% 47,606 50% 4 50% 4 50% <3 50% * 50% <3 50% 7
ELA 4thGradeContent
AllStudents
2017-18 45.0% 47,227 * * * * * * * * * * * *
Page 2 of A service of the Center for Educational Performance and Information (CEPI) 52

04/09/2019
Annual Education Report Innocademy Allegan Campus (02322)M-STEP Grades 3-11
Subject Grade TestingGroup
SchoolYear
StatePercentStudentsProficient
StateNumberStudentsProficient
DistrictPercentStudentsProficient
DistrictNumberStudentsProficient
SchoolPercentStudentsProficient
SchoolNumberStudentsProficient
PercentAdvanced
NumberAdvanced
PercentProficient
NumberProficient
PercentPartiallyProficient
NumberPartiallyProficient
PercentNotProficient
NumberNotProficient
ELA 4thGradeContent
Black orAfricanAmerican
2016-17 19.2% 3,664 * * * * * * * * * * * *
ELA 4thGradeContent
Black orAfricanAmerican
2017-18 20.2% 3,803 * * * * * * * * * * * *
ELA 4thGradeContent
Hispanicof AnyRace
2016-17 32.7% 2,858 * * * * * * * * * * * *
ELA 4thGradeContent
Hispanicof AnyRace
2017-18 33.9% 2,917 * * * * * * * * * * * *
ELA 4thGradeContent
Two orMoreRaces
2016-17 40.1% 1,754 * * * * * * * * * * * *
ELA 4thGradeContent
White 2016-17 51.5% 36,664 * * * * * * * * * * * *
ELA 4thGradeContent
White 2017-18 52.5% 35,934 * * * * * * * * * * * *
ELA 4thGradeContent
Female 2016-17 48.6% 25,715 * * * * * * * * * * * *
ELA 4thGradeContent
Female 2017-18 48.1% 24,749 * * * * * * * * * * * *
Page 3 of A service of the Center for Educational Performance and Information (CEPI) 52

04/09/2019
Annual Education Report Innocademy Allegan Campus (02322)M-STEP Grades 3-11
Subject Grade TestingGroup
SchoolYear
StatePercentStudentsProficient
StateNumberStudentsProficient
DistrictPercentStudentsProficient
DistrictNumberStudentsProficient
SchoolPercentStudentsProficient
SchoolNumberStudentsProficient
PercentAdvanced
NumberAdvanced
PercentProficient
NumberProficient
PercentPartiallyProficient
NumberPartiallyProficient
PercentNotProficient
NumberNotProficient
ELA 4thGradeContent
Male 2016-17 39.9% 21,891 * * * * * * * * * * * *
ELA 4thGradeContent
Male 2017-18 42.1% 22,478 * * * * * * * * * * * *
ELA 4thGradeContent
EconomicallyDisadvantaged
2016-17 28.6% 15,744 * * * * * * * * * * * *
ELA 4thGradeContent
EconomicallyDisadvantaged
2017-18 30.4% 17,664 * * * * * * * * * * * *
ELA 4thGradeContent
StudentsWithDisabilities
2016-17 15.8% 1,893 * * * * * * * * * * * *
ELA 4thGradeContent
StudentsWithDisabilities
2017-18 17.6% 2,158 * * * * * * * * * * * *
ELA 5thGradeContent
AllStudents
2016-17 51.1% 55,086 * * * * * * * * * * * *
ELA 5thGradeContent
AllStudents
2017-18 46.5% 50,658 50% <3 50% * 50% <3 50% <3 <3 <3 * 8
Page 4 of A service of the Center for Educational Performance and Information (CEPI) 52

04/09/2019
Annual Education Report Innocademy Allegan Campus (02322)M-STEP Grades 3-11
Subject Grade TestingGroup
SchoolYear
StatePercentStudentsProficient
StateNumberStudentsProficient
DistrictPercentStudentsProficient
DistrictNumberStudentsProficient
SchoolPercentStudentsProficient
SchoolNumberStudentsProficient
PercentAdvanced
NumberAdvanced
PercentProficient
NumberProficient
PercentPartiallyProficient
NumberPartiallyProficient
PercentNotProficient
NumberNotProficient
ELA 5thGradeContent
Black orAfricanAmerican
2017-18 20.7% 3,978 * * * * * * * * * * * *
ELA 5thGradeContent
Hispanicof AnyRace
2016-17 39.4% 3,380 * * * * * * * * * * * *
ELA 5thGradeContent
Hispanicof AnyRace
2017-18 36.0% 3,222 * * * * * * * * * * * *
ELA 5thGradeContent
Two orMoreRaces
2016-17 48.2% 2,078 * * * * * * * * * * * *
ELA 5thGradeContent
Two orMoreRaces
2017-18 43.3% 1,959 * * * * * * * * * * * *
ELA 5thGradeContent
White 2016-17 58.6% 41,947 * * * * * * * * * * * *
ELA 5thGradeContent
White 2017-18 53.8% 38,604 * * * * * * * * * * * *
ELA 5thGradeContent
Female 2016-17 56.0% 29,914 * * * * * * * * * * * *
ELA 5thGradeContent
Female 2017-18 50.7% 27,038 * * * * * * * * * * * *
Page 5 of A service of the Center for Educational Performance and Information (CEPI) 52

04/09/2019
Annual Education Report Innocademy Allegan Campus (02322)M-STEP Grades 3-11
Subject Grade TestingGroup
SchoolYear
StatePercentStudentsProficient
StateNumberStudentsProficient
DistrictPercentStudentsProficient
DistrictNumberStudentsProficient
SchoolPercentStudentsProficient
SchoolNumberStudentsProficient
PercentAdvanced
NumberAdvanced
PercentProficient
NumberProficient
PercentPartiallyProficient
NumberPartiallyProficient
PercentNotProficient
NumberNotProficient
ELA 5thGradeContent
Male 2016-17 46.2% 25,172 * * * * * * * * * * * *
ELA 5thGradeContent
Male 2017-18 42.5% 23,620 * * * * * * * * * * * *
ELA 5thGradeContent
EconomicallyDisadvantaged
2016-17 35.3% 19,040 * * * * * * * * * * * *
ELA 5thGradeContent
EconomicallyDisadvantaged
2017-18 31.8% 18,816 50% <3 50% * 50% <3 50% <3 <3 <3 * 7
ELA 5thGradeContent
EnglishLearners
2016-17 24.5% 1,770 * * * * * * * * * * * *
ELA 5thGradeContent
EnglishLearners
2017-18 20.8% 1,576 * * * * * * * * * * * *
ELA 5thGradeContent
StudentsWithDisabilities
2016-17 16.7% 1,983 * * * * * * * * * * * *
ELA 5thGradeContent
StudentsWithDisabilities
2017-18 14.8% 1,846 * * * * * * * * * * * *
Page 6 of A service of the Center for Educational Performance and Information (CEPI) 52

04/09/2019
Annual Education Report Innocademy Allegan Campus (02322)M-STEP Grades 3-11
Subject Grade TestingGroup
SchoolYear
StatePercentStudentsProficient
StateNumberStudentsProficient
DistrictPercentStudentsProficient
DistrictNumberStudentsProficient
SchoolPercentStudentsProficient
SchoolNumberStudentsProficient
PercentAdvanced
NumberAdvanced
PercentProficient
NumberProficient
PercentPartiallyProficient
NumberPartiallyProficient
PercentNotProficient
NumberNotProficient
ELA 5thGradeContent
Homeless
2017-18 22.1% 456 * * * * * * * * * * * *
ELA 6thGradeContent
AllStudents
2016-17 43.6% 46,672 * * * * * * * * * * * *
ELA 6thGradeContent
AllStudents
2017-18 41.4% 44,939 * * * * * * * * * * * *
ELA 6thGradeContent
Hispanicof AnyRace
2016-17 31.6% 2,728 * * * * * * * * * * * *
ELA 6thGradeContent
Hispanicof AnyRace
2017-18 30.3% 2,638 * * * * * * * * * * * *
ELA 6thGradeContent
Two orMoreRaces
2017-18 38.1% 1,689 * * * * * * * * * * * *
ELA 6thGradeContent
White 2016-17 50.3% 36,045 * * * * * * * * * * * *
ELA 6thGradeContent
White 2017-18 48.0% 34,579 * * * * * * * * * * * *
ELA 6thGradeContent
Female 2016-17 48.7% 25,540 * * * * * * * * * * * *
Page 7 of A service of the Center for Educational Performance and Information (CEPI) 52

04/09/2019
Annual Education Report Innocademy Allegan Campus (02322)M-STEP Grades 3-11
Subject Grade TestingGroup
SchoolYear
StatePercentStudentsProficient
StateNumberStudentsProficient
DistrictPercentStudentsProficient
DistrictNumberStudentsProficient
SchoolPercentStudentsProficient
SchoolNumberStudentsProficient
PercentAdvanced
NumberAdvanced
PercentProficient
NumberProficient
PercentPartiallyProficient
NumberPartiallyProficient
PercentNotProficient
NumberNotProficient
ELA 6thGradeContent
Female 2017-18 45.7% 24,510 * * * * * * * * * * * *
ELA 6thGradeContent
Male 2016-17 38.7% 21,132 * * * * * * * * * * * *
ELA 6thGradeContent
Male 2017-18 37.2% 20,429 * * * * * * * * * * * *
ELA 6thGradeContent
EconomicallyDisadvantaged
2016-17 27.1% 14,054 * * * * * * * * * * * *
ELA 6thGradeContent
EconomicallyDisadvantaged
2017-18 26.8% 15,505 * * * * * * * * * * * *
ELA 6thGradeContent
StudentsWithDisabilities
2016-17 10.9% 1,275 * * * * * * * * * * * *
ELA 6thGradeContent
StudentsWithDisabilities
2017-18 11.0% 1,310 * * * * * * * * * * * *
ELA 6thGradeContent
Homeless
2017-18 19.1% 356 * * * * * * * * * * * *
Page 8 of A service of the Center for Educational Performance and Information (CEPI) 52

04/09/2019
Annual Education Report Innocademy Allegan Campus (02322)M-STEP Grades 3-11
Subject Grade TestingGroup
SchoolYear
StatePercentStudentsProficient
StateNumberStudentsProficient
DistrictPercentStudentsProficient
DistrictNumberStudentsProficient
SchoolPercentStudentsProficient
SchoolNumberStudentsProficient
PercentAdvanced
NumberAdvanced
PercentProficient
NumberProficient
PercentPartiallyProficient
NumberPartiallyProficient
PercentNotProficient
NumberNotProficient
ELA 7thGradeContent
AllStudents
2016-17 44.8% 49,372 * * * * * * * * * * * *
ELA 7thGradeContent
AllStudents
2017-18 43.4% 46,837 50% 5 50% 5 50% <3 50% * 50% 3 50% 3
ELA 7thGradeContent
Hispanicof AnyRace
2016-17 32.2% 2,658 * * * * * * * * * * * *
ELA 7thGradeContent
Hispanicof AnyRace
2017-18 32.4% 2,867 * * * * * * * * * * * *
ELA 7thGradeContent
Two orMoreRaces
2016-17 42.8% 1,655 * * * * * * * * * * * *
ELA 7thGradeContent
White 2016-17 51.0% 38,276 * * * * * * * * * * * *
ELA 7thGradeContent
White 2017-18 49.8% 35,929 50% 4 50% 4 50% <3 50% * 50% 3 50% 3
ELA 7thGradeContent
Female 2016-17 50.9% 27,378 * * * * * * * * * * * *
ELA 7thGradeContent
Female 2017-18 49.0% 25,945 * * * * * * * * * * * *
Page 9 of A service of the Center for Educational Performance and Information (CEPI) 52
04/09/2019
Annual Education Report Innocademy Allegan Campus (02322)M-STEP Grades 3-11
Subject Grade TestingGroup
SchoolYear
StatePercentStudentsProficient
StateNumberStudentsProficient
DistrictPercentStudentsProficient
DistrictNumberStudentsProficient
SchoolPercentStudentsProficient
SchoolNumberStudentsProficient
PercentAdvanced
NumberAdvanced
PercentProficient
NumberProficient
PercentPartiallyProficient
NumberPartiallyProficient
PercentNotProficient
NumberNotProficient
ELA 7thGradeContent
Male 2016-17 39.1% 21,994 * * * * * * * * * * * *
ELA 7thGradeContent
Male 2017-18 38.0% 20,892 * * * * * * * * * * * *
ELA 7thGradeContent
EconomicallyDisadvantaged
2016-17 28.4% 14,561 * * * * * * * * * * * *
ELA 7thGradeContent
EconomicallyDisadvantaged
2017-18 28.2% 15,627 * * * * * * * * * * * *
ELA 7thGradeContent
StudentsWithDisabilities
2017-18 11.0% 1,302 * * * * * * * * * * * *
ELA 7thGradeContent
Homeless
2017-18 21.4% 392 * * * * * * * * * * * *
ELA 8thGradeContent
AllStudents
2017-18 42.8% 47,207 * * * * * * * * * * * *
ELA 8thGradeContent
Hispanicof AnyRace
2017-18 31.3% 2,612 * * * * * * * * * * * *
ELA 8thGradeContent
Two orMoreRaces
2017-18 40.4% 1,583 * * * * * * * * * * * *
Page 10 of A service of the Center for Educational Performance and Information (CEPI) 52

04/09/2019
Annual Education Report Innocademy Allegan Campus (02322)M-STEP Grades 3-11
Subject Grade TestingGroup
SchoolYear
StatePercentStudentsProficient
StateNumberStudentsProficient
DistrictPercentStudentsProficient
DistrictNumberStudentsProficient
SchoolPercentStudentsProficient
SchoolNumberStudentsProficient
PercentAdvanced
NumberAdvanced
PercentProficient
NumberProficient
PercentPartiallyProficient
NumberPartiallyProficient
PercentNotProficient
NumberNotProficient
ELA 8thGradeContent
White 2017-18 48.4% 36,424 * * * * * * * * * * * *
ELA 8thGradeContent
Female 2017-18 49.0% 26,422 * * * * * * * * * * * *
ELA 8thGradeContent
Male 2017-18 36.8% 20,785 * * * * * * * * * * * *
ELA 8thGradeContent
EconomicallyDisadvantaged
2017-18 27.5% 15,044 * * * * * * * * * * * *
ELA 8thGradeContent
Homeless
2017-18 18.2% 297 * * * * * * * * * * * *
Mathematics
3rdGradeContent
AllStudents
2016-17 46.8% 48,992 * * * * * * * * * * * *
Mathematics
3rdGradeContent
AllStudents
2017-18 45.7% 46,886 50% 3 50% 3 50% <3 50% * 50% 4 50% 5
Mathematics
3rdGradeContent
Black orAfricanAmerican
2016-17 20.6% 3,912 * * * * * * * * * * * *
Mathematics
3rdGradeContent
Hispanicof AnyRace
2017-18 32.5% 2,705 * * * * * * * * * * * *
Page 11 of A service of the Center for Educational Performance and Information (CEPI) 52

04/09/2019
Annual Education Report Innocademy Allegan Campus (02322)M-STEP Grades 3-11
Subject Grade TestingGroup
SchoolYear
StatePercentStudentsProficient
StateNumberStudentsProficient
DistrictPercentStudentsProficient
DistrictNumberStudentsProficient
SchoolPercentStudentsProficient
SchoolNumberStudentsProficient
PercentAdvanced
NumberAdvanced
PercentProficient
NumberProficient
PercentPartiallyProficient
NumberPartiallyProficient
PercentNotProficient
NumberNotProficient
Mathematics
3rdGradeContent
Two orMoreRaces
2017-18 42.1% 1,968 * * * * * * * * * * * *
Mathematics
3rdGradeContent
White 2016-17 54.8% 37,396 * * * * * * * * * * * *
Mathematics
3rdGradeContent
White 2017-18 53.8% 35,669 * * * * * * * * * * * *
Mathematics
3rdGradeContent
Female 2016-17 45.0% 23,053 * * * * * * * * * * * *
Mathematics
3rdGradeContent
Female 2017-18 43.5% 21,895 * * * * * * * * * * * *
Mathematics
3rdGradeContent
Male 2016-17 48.5% 25,939 * * * * * * * * * * * *
Mathematics
3rdGradeContent
Male 2017-18 47.8% 24,991 * * * * * * * * * * * *
Mathematics
3rdGradeContent
EconomicallyDisadvantaged
2016-17 31.5% 17,140 * * * * * * * * * * * *
Mathematics
3rdGradeContent
EconomicallyDisadvantaged
2017-18 31.1% 18,017 50% <3 50% * 50% <3 50% <3 * 4 * 5
Page 12 of A service of the Center for Educational Performance and Information (CEPI) 52

04/09/2019
Annual Education Report Innocademy Allegan Campus (02322)M-STEP Grades 3-11
Subject Grade TestingGroup
SchoolYear
StatePercentStudentsProficient
StateNumberStudentsProficient
DistrictPercentStudentsProficient
DistrictNumberStudentsProficient
SchoolPercentStudentsProficient
SchoolNumberStudentsProficient
PercentAdvanced
NumberAdvanced
PercentProficient
NumberProficient
PercentPartiallyProficient
NumberPartiallyProficient
PercentNotProficient
NumberNotProficient
Mathematics
3rdGradeContent
StudentsWithDisabilities
2016-17 23.4% 2,701 * * * * * * * * * * * *
Mathematics
3rdGradeContent
StudentsWithDisabilities
2017-18 20.9% 2,421 * * * * * * * * * * * *
Mathematics
4thGradeContent
AllStudents
2016-17 42.0% 45,360 50% <3 50% <3 50% <3 50% <3 <3 <3 * 12
Mathematics
4thGradeContent
AllStudents
2017-18 42.0% 44,105 * * * * * * * * * * * *
Mathematics
4thGradeContent
Black orAfricanAmerican
2016-17 14.6% 2,787 * * * * * * * * * * * *
Mathematics
4thGradeContent
Black orAfricanAmerican
2017-18 15.2% 2,858 * * * * * * * * * * * *
Mathematics
4thGradeContent
Hispanicof AnyRace
2016-17 29.1% 2,556 * * * * * * * * * * * *
Mathematics
4thGradeContent
Hispanicof AnyRace
2017-18 29.1% 2,527 * * * * * * * * * * * *
Page 13 of A service of the Center for Educational Performance and Information (CEPI) 52

04/09/2019
Annual Education Report Innocademy Allegan Campus (02322)M-STEP Grades 3-11
Subject Grade TestingGroup
SchoolYear
StatePercentStudentsProficient
StateNumberStudentsProficient
DistrictPercentStudentsProficient
DistrictNumberStudentsProficient
SchoolPercentStudentsProficient
SchoolNumberStudentsProficient
PercentAdvanced
NumberAdvanced
PercentProficient
NumberProficient
PercentPartiallyProficient
NumberPartiallyProficient
PercentNotProficient
NumberNotProficient
Mathematics
4thGradeContent
Two orMoreRaces
2016-17 36.4% 1,596 * * * * * * * * * * * *
Mathematics
4thGradeContent
White 2016-17 49.7% 35,505 * * * * * * * * * * * *
Mathematics
4thGradeContent
White 2017-18 49.8% 34,165 * * * * * * * * * * * *
Mathematics
4thGradeContent
Female 2016-17 39.6% 20,977 * * * * * * * * * * * *
Mathematics
4thGradeContent
Female 2017-18 39.4% 20,299 * * * * * * * * * * * *
Mathematics
4thGradeContent
Male 2016-17 44.2% 24,383 * * * * * * * * * * * *
Mathematics
4thGradeContent
Male 2017-18 44.4% 23,806 * * * * * * * * * * * *
Mathematics
4thGradeContent
EconomicallyDisadvantaged
2016-17 25.8% 14,215 * * * * * * * * * * * *
Mathematics
4thGradeContent
EconomicallyDisadvantaged
2017-18 26.8% 15,586 * * * * * * * * * * * *
Page 14 of A service of the Center for Educational Performance and Information (CEPI) 52

04/09/2019
Annual Education Report Innocademy Allegan Campus (02322)M-STEP Grades 3-11
Subject Grade TestingGroup
SchoolYear
StatePercentStudentsProficient
StateNumberStudentsProficient
DistrictPercentStudentsProficient
DistrictNumberStudentsProficient
SchoolPercentStudentsProficient
SchoolNumberStudentsProficient
PercentAdvanced
NumberAdvanced
PercentProficient
NumberProficient
PercentPartiallyProficient
NumberPartiallyProficient
PercentNotProficient
NumberNotProficient
Mathematics
4thGradeContent
StudentsWithDisabilities
2016-17 16.7% 2,017 * * * * * * * * * * * *
Mathematics
4thGradeContent
StudentsWithDisabilities
2017-18 16.8% 2,072 * * * * * * * * * * * *
Mathematics
5thGradeContent
AllStudents
2016-17 35.0% 37,912 * * * * * * * * * * * *
Mathematics
5thGradeContent
AllStudents
2017-18 34.3% 37,429 50% <3 50% * 50% <3 50% <3 <3 <3 * 11
Mathematics
5thGradeContent
Black orAfricanAmerican
2017-18 9.4% 1,808 * * * * * * * * * * * *
Mathematics
5thGradeContent
Hispanicof AnyRace
2016-17 20.8% 1,794 * * * * * * * * * * * *
Mathematics
5thGradeContent
Hispanicof AnyRace
2017-18 21.5% 1,934 * * * * * * * * * * * *
Mathematics
5thGradeContent
Two orMoreRaces
2016-17 29.5% 1,274 * * * * * * * * * * * *
Mathematics
5thGradeContent
Two orMoreRaces
2017-18 29.7% 1,347 * * * * * * * * * * * *
Page 15 of A service of the Center for Educational Performance and Information (CEPI) 52

04/09/2019
Annual Education Report Innocademy Allegan Campus (02322)M-STEP Grades 3-11
Subject Grade TestingGroup
SchoolYear
StatePercentStudentsProficient
StateNumberStudentsProficient
DistrictPercentStudentsProficient
DistrictNumberStudentsProficient
SchoolPercentStudentsProficient
SchoolNumberStudentsProficient
PercentAdvanced
NumberAdvanced
PercentProficient
NumberProficient
PercentPartiallyProficient
NumberPartiallyProficient
PercentNotProficient
NumberNotProficient
Mathematics
5thGradeContent
White 2016-17 42.4% 30,455 * * * * * * * * * * * *
Mathematics
5thGradeContent
White 2017-18 41.3% 29,655 * * * * * * * * * * * *
Mathematics
5thGradeContent
Female 2016-17 32.6% 17,472 * * * * * * * * * * * *
Mathematics
5thGradeContent
Female 2017-18 31.4% 16,772 * * * * * * * * * * * *
Mathematics
5thGradeContent
Male 2016-17 37.4% 20,440 * * * * * * * * * * * *
Mathematics
5thGradeContent
Male 2017-18 37.1% 20,657 * * * * * * * * * * * *
Mathematics
5thGradeContent
EconomicallyDisadvantaged
2016-17 18.8% 10,174 * * * * * * * * * * * *
Mathematics
5thGradeContent
EconomicallyDisadvantaged
2017-18 19.6% 11,618 50% <3 50% * 50% <3 50% <3 <3 <3 * 9
Mathematics
5thGradeContent
EnglishLearners
2016-17 15.3% 1,158 * * * * * * * * * * * *
Page 16 of A service of the Center for Educational Performance and Information (CEPI) 52

04/09/2019
Annual Education Report Innocademy Allegan Campus (02322)M-STEP Grades 3-11
Subject Grade TestingGroup
SchoolYear
StatePercentStudentsProficient
StateNumberStudentsProficient
DistrictPercentStudentsProficient
DistrictNumberStudentsProficient
SchoolPercentStudentsProficient
SchoolNumberStudentsProficient
PercentAdvanced
NumberAdvanced
PercentProficient
NumberProficient
PercentPartiallyProficient
NumberPartiallyProficient
PercentNotProficient
NumberNotProficient
Mathematics
5thGradeContent
EnglishLearners
2017-18 15.8% 1,233 * * * * * * * * * * * *
Mathematics
5thGradeContent
StudentsWithDisabilities
2016-17 11.0% 1,313 * * * * * * * * * * * *
Mathematics
5thGradeContent
StudentsWithDisabilities
2017-18 10.3% 1,284 * * * * * * * * * * * *
Mathematics
5thGradeContent
Homeless
2017-18 12.1% 251 * * * * * * * * * * * *
Mathematics
6thGradeContent
AllStudents
2016-17 34.2% 36,642 * * * * * * * * * * * *
Mathematics
6thGradeContent
AllStudents
2017-18 34.6% 37,588 * * * * * * * * * * * *
Mathematics
6thGradeContent
Hispanicof AnyRace
2016-17 20.5% 1,778 * * * * * * * * * * * *
Mathematics
6thGradeContent
Hispanicof AnyRace
2017-18 22.1% 1,933 * * * * * * * * * * * *
Mathematics
6thGradeContent
Two orMoreRaces
2017-18 29.6% 1,309 * * * * * * * * * * * *
Page 17 of A service of the Center for Educational Performance and Information (CEPI) 52

04/09/2019
Annual Education Report Innocademy Allegan Campus (02322)M-STEP Grades 3-11
Subject Grade TestingGroup
SchoolYear
StatePercentStudentsProficient
StateNumberStudentsProficient
DistrictPercentStudentsProficient
DistrictNumberStudentsProficient
SchoolPercentStudentsProficient
SchoolNumberStudentsProficient
PercentAdvanced
NumberAdvanced
PercentProficient
NumberProficient
PercentPartiallyProficient
NumberPartiallyProficient
PercentNotProficient
NumberNotProficient
Mathematics
6thGradeContent
White 2016-17 41.0% 29,398 * * * * * * * * * * * *
Mathematics
6thGradeContent
White 2017-18 41.4% 29,843 * * * * * * * * * * * *
Mathematics
6thGradeContent
Female 2016-17 33.1% 17,427 * * * * * * * * * * * *
Mathematics
6thGradeContent
Female 2017-18 33.4% 17,949 * * * * * * * * * * * *
Mathematics
6thGradeContent
Male 2016-17 35.2% 19,215 * * * * * * * * * * * *
Mathematics
6thGradeContent
Male 2017-18 35.7% 19,639 * * * * * * * * * * * *
Mathematics
6thGradeContent
EconomicallyDisadvantaged
2016-17 18.0% 9,341 * * * * * * * * * * * *
Mathematics
6thGradeContent
EconomicallyDisadvantaged
2017-18 19.3% 11,173 * * * * * * * * * * * *
Mathematics
6thGradeContent
StudentsWithDisabilities
2016-17 8.1% 944 * * * * * * * * * * * *
Page 18 of A service of the Center for Educational Performance and Information (CEPI) 52

04/09/2019
Annual Education Report Innocademy Allegan Campus (02322)M-STEP Grades 3-11
Subject Grade TestingGroup
SchoolYear
StatePercentStudentsProficient
StateNumberStudentsProficient
DistrictPercentStudentsProficient
DistrictNumberStudentsProficient
SchoolPercentStudentsProficient
SchoolNumberStudentsProficient
PercentAdvanced
NumberAdvanced
PercentProficient
NumberProficient
PercentPartiallyProficient
NumberPartiallyProficient
PercentNotProficient
NumberNotProficient
Mathematics
6thGradeContent
StudentsWithDisabilities
2017-18 8.2% 977 * * * * * * * * * * * *
Mathematics
6thGradeContent
Homeless
2017-18 13.0% 242 * * * * * * * * * * * *
Mathematics
7thGradeContent
AllStudents
2016-17 36.2% 39,926 * * * * * * * * * * * *
Mathematics
7thGradeContent
AllStudents
2017-18 35.7% 38,560 50% <3 50% * 50% <3 50% <3 <3 <3 * 7
Mathematics
7thGradeContent
Hispanicof AnyRace
2016-17 21.2% 1,759 * * * * * * * * * * * *
Mathematics
7thGradeContent
Hispanicof AnyRace
2017-18 22.0% 1,960 * * * * * * * * * * * *
Mathematics
7thGradeContent
Two orMoreRaces
2016-17 31.9% 1,229 * * * * * * * * * * * *
Mathematics
7thGradeContent
White 2016-17 42.9% 32,196 * * * * * * * * * * * *
Mathematics
7thGradeContent
White 2017-18 42.6% 30,743 50% <3 50% * 50% <3 50% <3 <3 <3 * 7
Page 19 of A service of the Center for Educational Performance and Information (CEPI) 52

04/09/2019
Annual Education Report Innocademy Allegan Campus (02322)M-STEP Grades 3-11
Subject Grade TestingGroup
SchoolYear
StatePercentStudentsProficient
StateNumberStudentsProficient
DistrictPercentStudentsProficient
DistrictNumberStudentsProficient
SchoolPercentStudentsProficient
SchoolNumberStudentsProficient
PercentAdvanced
NumberAdvanced
PercentProficient
NumberProficient
PercentPartiallyProficient
NumberPartiallyProficient
PercentNotProficient
NumberNotProficient
Mathematics
7thGradeContent
Female 2016-17 35.1% 18,906 * * * * * * * * * * * *
Mathematics
7thGradeContent
Female 2017-18 34.6% 18,352 * * * * * * * * * * * *
Mathematics
7thGradeContent
Male 2016-17 37.3% 21,020 * * * * * * * * * * * *
Mathematics
7thGradeContent
Male 2017-18 36.7% 20,208 * * * * * * * * * * * *
Mathematics
7thGradeContent
EconomicallyDisadvantaged
2016-17 19.0% 9,741 * * * * * * * * * * * *
Mathematics
7thGradeContent
EconomicallyDisadvantaged
2017-18 19.9% 11,060 * * * * * * * * * * * *
Mathematics
7thGradeContent
StudentsWithDisabilities
2017-18 7.7% 903 * * * * * * * * * * * *
Mathematics
7thGradeContent
Homeless
2017-18 13.6% 250 * * * * * * * * * * * *
Mathematics
8thGradeContent
AllStudents
2017-18 33.6% 37,102 * * * * * * * * * * * *
Page 20 of A service of the Center for Educational Performance and Information (CEPI) 52

04/09/2019
Annual Education Report Innocademy Allegan Campus (02322)M-STEP Grades 3-11
Subject Grade TestingGroup
SchoolYear
StatePercentStudentsProficient
StateNumberStudentsProficient
DistrictPercentStudentsProficient
DistrictNumberStudentsProficient
SchoolPercentStudentsProficient
SchoolNumberStudentsProficient
PercentAdvanced
NumberAdvanced
PercentProficient
NumberProficient
PercentPartiallyProficient
NumberPartiallyProficient
PercentNotProficient
NumberNotProficient
Mathematics
8thGradeContent
Hispanicof AnyRace
2017-18 20.4% 1,707 * * * * * * * * * * * *
Mathematics
8thGradeContent
Two orMoreRaces
2017-18 29.4% 1,147 * * * * * * * * * * * *
Mathematics
8thGradeContent
White 2017-18 39.2% 29,464 * * * * * * * * * * * *
Mathematics
8thGradeContent
Female 2017-18 35.5% 19,135 * * * * * * * * * * * *
Mathematics
8thGradeContent
Male 2017-18 31.8% 17,967 * * * * * * * * * * * *
Mathematics
8thGradeContent
EconomicallyDisadvantaged
2017-18 17.9% 9,793 * * * * * * * * * * * *
Mathematics
8thGradeContent
Homeless
2017-18 9.9% 163 * * * * * * * * * * * *
Science 4thGradeContent
AllStudents
2016-17 14.6% 15,781 50% <3 50% * 50% <3 50% <3 <3 <3 * 10
Science 4thGradeContent
Black orAfricanAmerican
2016-17 2.8% 525 * * * * * * * * * * * *
Page 21 of A service of the Center for Educational Performance and Information (CEPI) 52

04/09/2019
Annual Education Report Innocademy Allegan Campus (02322)M-STEP Grades 3-11
Subject Grade TestingGroup
SchoolYear
StatePercentStudentsProficient
StateNumberStudentsProficient
DistrictPercentStudentsProficient
DistrictNumberStudentsProficient
SchoolPercentStudentsProficient
SchoolNumberStudentsProficient
PercentAdvanced
NumberAdvanced
PercentProficient
NumberProficient
PercentPartiallyProficient
NumberPartiallyProficient
PercentNotProficient
NumberNotProficient
Science 4thGradeContent
Hispanicof AnyRace
2016-17 6.7% 589 * * * * * * * * * * * *
Science 4thGradeContent
Two orMoreRaces
2016-17 13.0% 568 * * * * * * * * * * * *
Science 4thGradeContent
White 2016-17 18.2% 12,999 * * * * * * * * * * * *
Science 4thGradeContent
Female 2016-17 12.6% 6,689 * * * * * * * * * * * *
Science 4thGradeContent
Male 2016-17 16.5% 9,092 * * * * * * * * * * * *
Science 4thGradeContent
EconomicallyDisadvantaged
2016-17 6.8% 3,772 * * * * * * * * * * * *
Science 4thGradeContent
StudentsWithDisabilities
2016-17 5.3% 638 * * * * * * * * * * * *
Science 7thGradeContent
AllStudents
2016-17 22.7% 25,081 * * * * * * * * * * * *
Science 7thGradeContent
Hispanicof AnyRace
2016-17 11.8% 977 * * * * * * * * * * * *
Page 22 of A service of the Center for Educational Performance and Information (CEPI) 52

04/09/2019
Annual Education Report Innocademy Allegan Campus (02322)M-STEP Grades 3-11
Subject Grade TestingGroup
SchoolYear
StatePercentStudentsProficient
StateNumberStudentsProficient
DistrictPercentStudentsProficient
DistrictNumberStudentsProficient
SchoolPercentStudentsProficient
SchoolNumberStudentsProficient
PercentAdvanced
NumberAdvanced
PercentProficient
NumberProficient
PercentPartiallyProficient
NumberPartiallyProficient
PercentNotProficient
NumberNotProficient
Science 7thGradeContent
Two orMoreRaces
2016-17 21.0% 810 * * * * * * * * * * * *
Science 7thGradeContent
White 2016-17 27.5% 20,638 * * * * * * * * * * * *
Science 7thGradeContent
Female 2016-17 21.2% 11,397 * * * * * * * * * * * *
Science 7thGradeContent
Male 2016-17 24.3% 13,684 * * * * * * * * * * * *
Science 7thGradeContent
EconomicallyDisadvantaged
2016-17 10.5% 5,405 * * * * * * * * * * * *
SocialStudies
5thGradeContent
AllStudents
2016-17 21.6% 23,411 * * * * * * * * * * * *
SocialStudies
5thGradeContent
AllStudents
2017-18 18.3% 19,952 50% <3 50% * 50% <3 50% <3 * 3 * 8
SocialStudies
5thGradeContent
Black orAfricanAmerican
2017-18 4.7% 894 * * * * * * * * * * * *
SocialStudies
5thGradeContent
Hispanicof AnyRace
2016-17 11.4% 981 * * * * * * * * * * * *
Page 23 of A service of the Center for Educational Performance and Information (CEPI) 52

04/09/2019
Annual Education Report Innocademy Allegan Campus (02322)M-STEP Grades 3-11
Subject Grade TestingGroup
SchoolYear
StatePercentStudentsProficient
StateNumberStudentsProficient
DistrictPercentStudentsProficient
DistrictNumberStudentsProficient
SchoolPercentStudentsProficient
SchoolNumberStudentsProficient
PercentAdvanced
NumberAdvanced
PercentProficient
NumberProficient
PercentPartiallyProficient
NumberPartiallyProficient
PercentNotProficient
NumberNotProficient
SocialStudies
5thGradeContent
Hispanicof AnyRace
2017-18 9.5% 854 * * * * * * * * * * * *
SocialStudies
5thGradeContent
Two orMoreRaces
2016-17 18.8% 810 * * * * * * * * * * * *
SocialStudies
5thGradeContent
Two orMoreRaces
2017-18 15.3% 694 * * * * * * * * * * * *
SocialStudies
5thGradeContent
White 2016-17 26.7% 19,173 * * * * * * * * * * * *
SocialStudies
5thGradeContent
White 2017-18 22.4% 16,088 * * * * * * * * * * * *
SocialStudies
5thGradeContent
Female 2016-17 19.3% 10,329 * * * * * * * * * * * *
SocialStudies
5thGradeContent
Female 2017-18 16.3% 8,676 * * * * * * * * * * * *
SocialStudies
5thGradeContent
Male 2016-17 23.9% 13,082 * * * * * * * * * * * *
SocialStudies
5thGradeContent
Male 2017-18 20.3% 11,276 * * * * * * * * * * * *
Page 24 of A service of the Center for Educational Performance and Information (CEPI) 52

04/09/2019
Annual Education Report Innocademy Allegan Campus (02322)M-STEP Grades 3-11
Subject Grade TestingGroup
SchoolYear
StatePercentStudentsProficient
StateNumberStudentsProficient
DistrictPercentStudentsProficient
DistrictNumberStudentsProficient
SchoolPercentStudentsProficient
SchoolNumberStudentsProficient
PercentAdvanced
NumberAdvanced
PercentProficient
NumberProficient
PercentPartiallyProficient
NumberPartiallyProficient
PercentNotProficient
NumberNotProficient
SocialStudies
5thGradeContent
EconomicallyDisadvantaged
2016-17 10.0% 5,430 * * * * * * * * * * * *
SocialStudies
5thGradeContent
EconomicallyDisadvantaged
2017-18 8.9% 5,288 50% <3 50% * 50% <3 50% <3 * 3 * 6
SocialStudies
5thGradeContent
EnglishLearners
2016-17 4.6% 348 * * * * * * * * * * * *
SocialStudies
5thGradeContent
EnglishLearners
2017-18 4.0% 310 * * * * * * * * * * * *
SocialStudies
5thGradeContent
StudentsWithDisabilities
2016-17 6.4% 768 * * * * * * * * * * * *
SocialStudies
5thGradeContent
StudentsWithDisabilities
2017-18 5.4% 674 * * * * * * * * * * * *
SocialStudies
5thGradeContent
Homeless
2017-18 3.9% 81 * * * * * * * * * * * *
SocialStudies
8thGradeContent
AllStudents
2017-18 29.3% 32,248 * * * * * * * * * * * *
Page 25 of A service of the Center for Educational Performance and Information (CEPI) 52

04/09/2019
Annual Education Report Innocademy Allegan Campus (02322)M-STEP Grades 3-11
Subject Grade TestingGroup
SchoolYear
StatePercentStudentsProficient
StateNumberStudentsProficient
DistrictPercentStudentsProficient
DistrictNumberStudentsProficient
SchoolPercentStudentsProficient
SchoolNumberStudentsProficient
PercentAdvanced
NumberAdvanced
PercentProficient
NumberProficient
PercentPartiallyProficient
NumberPartiallyProficient
PercentNotProficient
NumberNotProficient
SocialStudies
8thGradeContent
Hispanicof AnyRace
2017-18 18.0% 1,504 * * * * * * * * * * * *
SocialStudies
8thGradeContent
Two orMoreRaces
2017-18 27.2% 1,061 * * * * * * * * * * * *
SocialStudies
8thGradeContent
White 2017-18 34.8% 26,174 * * * * * * * * * * * *
SocialStudies
8thGradeContent
Female 2017-18 26.5% 14,287 * * * * * * * * * * * *
SocialStudies
8thGradeContent
Male 2017-18 31.9% 17,961 * * * * * * * * * * * *
SocialStudies
8thGradeContent
EconomicallyDisadvantaged
2017-18 15.4% 8,366 * * * * * * * * * * * *
SocialStudies
8thGradeContent
Homeless
2017-18 9.6% 157 * * * * * * * * * * * *
Page 26 of A service of the Center for Educational Performance and Information (CEPI) 52

04/09/2019
Annual Education Report Innocademy Allegan Campus (02322)SAT
LocationName
School Year Subject StudentGroup
Mean SATScore
Benchmark Met orExceeded
% Met orExceeded
Did Not Meet % Did NotMeet
NumberAssessed
No Data to Display
Page 27 of A service of the Center for Educational Performance and Information (CEPI) 52

04/09/2019
Annual Education Report Innocademy Allegan Campus (02322)MI-Access Functional Independence
Subject Grade Testing Group School Year State PercentStudentsProficient
DistrictPercentStudentsProficient
School PercentStudentsProficient
PercentSurpassed
PercentAttained
PercentEmerging
ELA 4th GradeContent
All Students 2016-17 82.7% * * * * *
Mathematics 4th GradeContent
All Students 2016-17 68.3% * * * * *
Science 4th GradeContent
All Students 2016-17 54.4% * * * * *
ELA 4th GradeContent
White 2016-17 84.2% * * * * *
Mathematics 4th GradeContent
White 2016-17 71.7% * * * * *
Science 4th GradeContent
White 2016-17 59.1% * * * * *
ELA 4th GradeContent
Male 2016-17 81.1% * * * * *
Mathematics 4th GradeContent
Male 2016-17 69.6% * * * * *
Science 4th GradeContent
Male 2016-17 54.6% * * * * *
ELA 4th GradeContent
EconomicallyDisadvantaged
2016-17 83.7% * * * * *
Mathematics 4th GradeContent
EconomicallyDisadvantaged
2016-17 69.4% * * * * *
Science 4th GradeContent
EconomicallyDisadvantaged
2016-17 55.7% * * * * *
ELA 5th GradeContent
All Students 2017-18 80.3% * * * * *
Mathematics 5th GradeContent
All Students 2017-18 48.3% * * * * *
Page 28 of A service of the Center for Educational Performance and Information (CEPI) 52

04/09/2019
Annual Education Report Innocademy Allegan Campus (02322)MI-Access Functional Independence
Subject Grade Testing Group School Year State PercentStudentsProficient
DistrictPercentStudentsProficient
School PercentStudentsProficient
PercentSurpassed
PercentAttained
PercentEmerging
Social Studies 5th GradeContent
All Students 2017-18 32.0% * * * * *
ELA 5th GradeContent
White 2017-18 83.2% * * * * *
Mathematics 5th GradeContent
White 2017-18 52.1% * * * * *
Social Studies 5th GradeContent
White 2017-18 35.5% * * * * *
ELA 5th GradeContent
Male 2017-18 78.9% * * * * *
Mathematics 5th GradeContent
Male 2017-18 50.1% * * * * *
Social Studies 5th GradeContent
Male 2017-18 32.3% * * * * *
ELA 5th GradeContent
EconomicallyDisadvantaged
2017-18 80.8% * * * * *
Mathematics 5th GradeContent
EconomicallyDisadvantaged
2017-18 48.3% * * * * *
Social Studies 5th GradeContent
EconomicallyDisadvantaged
2017-18 32.6% * * * * *
Page 29 of A service of the Center for Educational Performance and Information (CEPI) 52

04/09/2019
Annual Education Report Innocademy Allegan Campus (02322)MI-Access Supported Independence
Subject Grade Testing Group School Year State PercentStudentsProficient
DistrictPercentStudentsProficient
School PercentStudentsProficient
PercentSurpassed
PercentAttained
PercentEmerging
No Data to Display
Page 30 of A service of the Center for Educational Performance and Information (CEPI) 52

04/09/2019
Annual Education Report Innocademy Allegan Campus (02322)MI-Access Participation
Subject Grade Testing Group School Year State PercentStudentsProficient
DistrictPercentStudentsProficient
School PercentStudentsProficient
PercentSurpassed
PercentAttained
PercentEmerging
No Data to Display
Page 31 of A service of the Center for Educational Performance and Information (CEPI) 52

04/09/2019
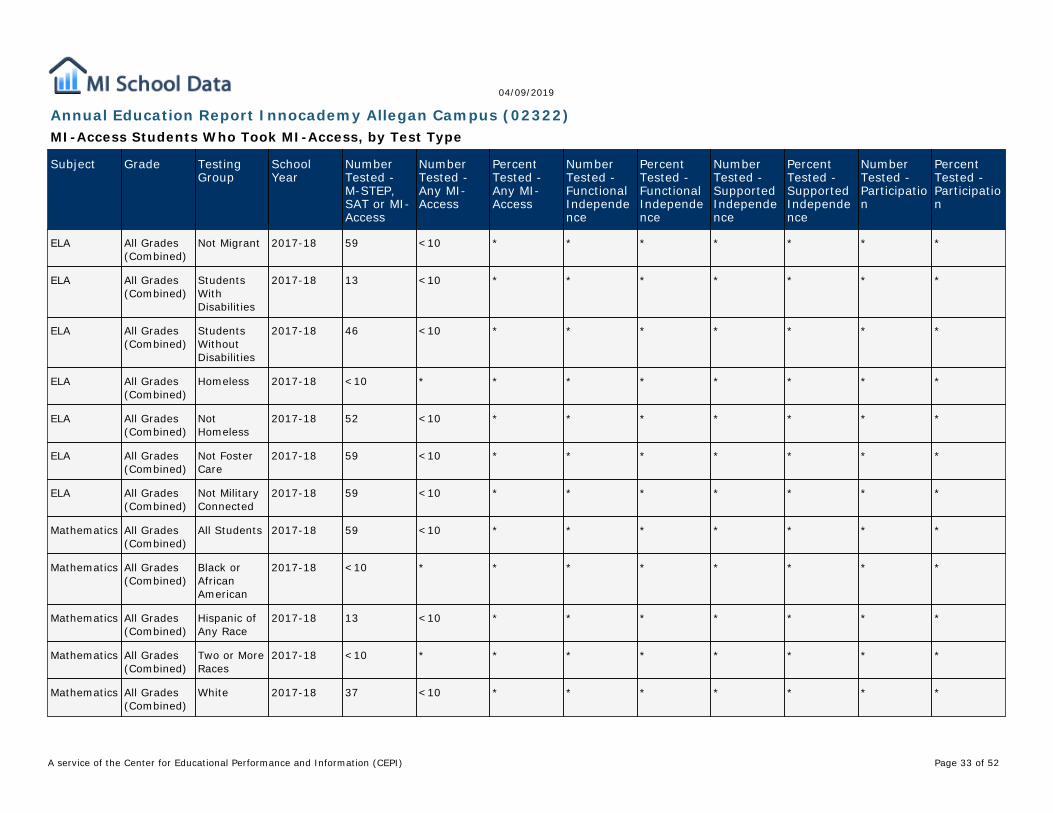
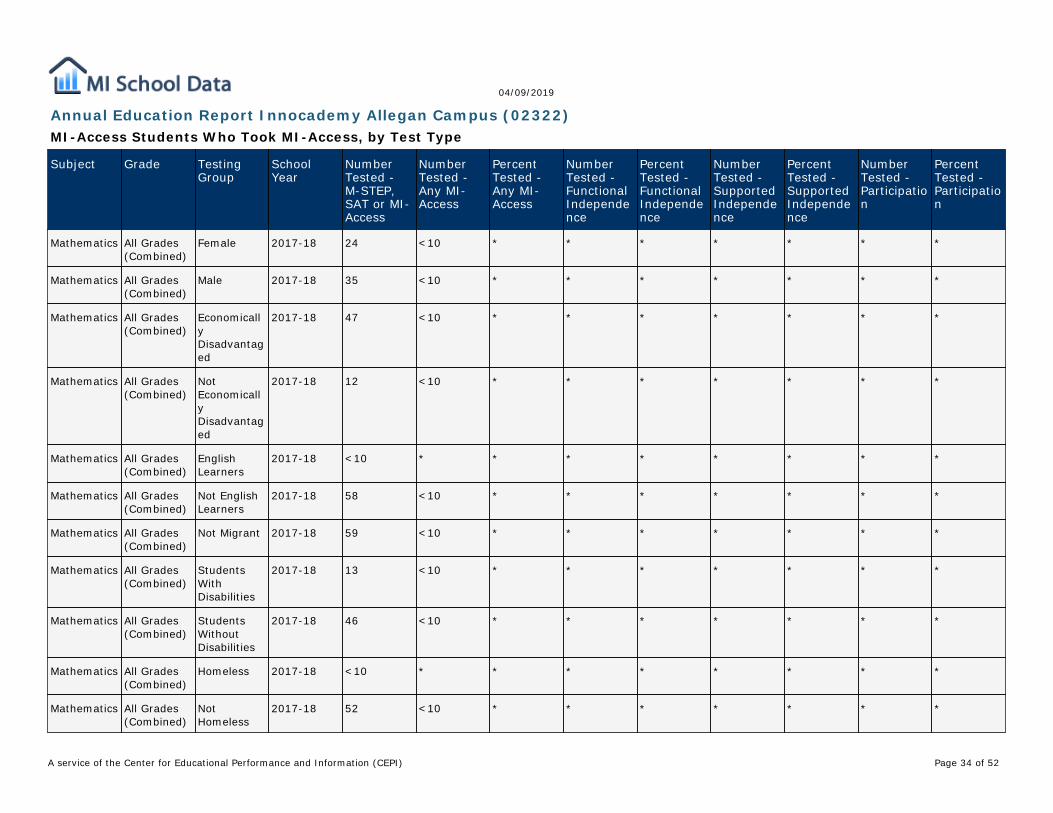
Annual Education Report Innocademy Allegan Campus (02322)MI-Access Students Who Took MI-Access, by Test Type
Subject Grade TestingGroup
SchoolYear
NumberTested -M-STEP,SAT or MI-Access
NumberTested -Any MI-Access
PercentTested -Any MI-Access
NumberTested -FunctionalIndependence
PercentTested -FunctionalIndependence
NumberTested -SupportedIndependence
PercentTested -SupportedIndependence
NumberTested -Participation
PercentTested -Participation
ELA All Grades(Combined)
All Students 2017-18 59 <10 * * * * * * *
ELA All Grades(Combined)
Black orAfricanAmerican
2017-18 <10 * * * * * * * *
ELA All Grades(Combined)
Hispanic ofAny Race
2017-18 13 <10 * * * * * * *
ELA All Grades(Combined)
Two or MoreRaces
2017-18 <10 * * * * * * * *
ELA All Grades(Combined)
White 2017-18 37 <10 * * * * * * *
ELA All Grades(Combined)
Female 2017-18 24 <10 * * * * * * *
ELA All Grades(Combined)
Male 2017-18 35 <10 * * * * * * *
ELA All Grades(Combined)
EconomicallyDisadvantaged
2017-18 47 <10 * * * * * * *
ELA All Grades(Combined)
NotEconomicallyDisadvantaged
2017-18 12 <10 * * * * * * *
ELA All Grades(Combined)
EnglishLearners
2017-18 <10 * * * * * * * *
ELA All Grades(Combined)
Not EnglishLearners
2017-18 58 <10 * * * * * * *
Page 32 of A service of the Center for Educational Performance and Information (CEPI) 52
04/09/2019
Annual Education Report Innocademy Allegan Campus (02322)MI-Access Students Who Took MI-Access, by Test Type
Subject Grade TestingGroup
SchoolYear
NumberTested -M-STEP,SAT or MI-Access
NumberTested -Any MI-Access
PercentTested -Any MI-Access
NumberTested -FunctionalIndependence
PercentTested -FunctionalIndependence
NumberTested -SupportedIndependence
PercentTested -SupportedIndependence
NumberTested -Participation
PercentTested -Participation
ELA All Grades(Combined)
Not Migrant 2017-18 59 <10 * * * * * * *
ELA All Grades(Combined)
StudentsWithDisabilities
2017-18 13 <10 * * * * * * *
ELA All Grades(Combined)
StudentsWithoutDisabilities
2017-18 46 <10 * * * * * * *
ELA All Grades(Combined)
Homeless 2017-18 <10 * * * * * * * *
ELA All Grades(Combined)
NotHomeless
2017-18 52 <10 * * * * * * *
ELA All Grades(Combined)
Not FosterCare
2017-18 59 <10 * * * * * * *
ELA All Grades(Combined)
Not MilitaryConnected
2017-18 59 <10 * * * * * * *
Mathematics All Grades(Combined)
All Students 2017-18 59 <10 * * * * * * *
Mathematics All Grades(Combined)
Black orAfricanAmerican
2017-18 <10 * * * * * * * *
Mathematics All Grades(Combined)
Hispanic ofAny Race
2017-18 13 <10 * * * * * * *
Mathematics All Grades(Combined)
Two or MoreRaces
2017-18 <10 * * * * * * * *
Mathematics All Grades(Combined)
White 2017-18 37 <10 * * * * * * *
Page 33 of A service of the Center for Educational Performance and Information (CEPI) 52
04/09/2019
Annual Education Report Innocademy Allegan Campus (02322)MI-Access Students Who Took MI-Access, by Test Type
Subject Grade TestingGroup
SchoolYear
NumberTested -M-STEP,SAT or MI-Access
NumberTested -Any MI-Access
PercentTested -Any MI-Access
NumberTested -FunctionalIndependence
PercentTested -FunctionalIndependence
NumberTested -SupportedIndependence
PercentTested -SupportedIndependence
NumberTested -Participation
PercentTested -Participation
Mathematics All Grades(Combined)
Female 2017-18 24 <10 * * * * * * *
Mathematics All Grades(Combined)
Male 2017-18 35 <10 * * * * * * *
Mathematics All Grades(Combined)
EconomicallyDisadvantaged
2017-18 47 <10 * * * * * * *
Mathematics All Grades(Combined)
NotEconomicallyDisadvantaged
2017-18 12 <10 * * * * * * *
Mathematics All Grades(Combined)
EnglishLearners
2017-18 <10 * * * * * * * *
Mathematics All Grades(Combined)
Not EnglishLearners
2017-18 58 <10 * * * * * * *
Mathematics All Grades(Combined)
Not Migrant 2017-18 59 <10 * * * * * * *
Mathematics All Grades(Combined)
StudentsWithDisabilities
2017-18 13 <10 * * * * * * *
Mathematics All Grades(Combined)
StudentsWithoutDisabilities
2017-18 46 <10 * * * * * * *
Mathematics All Grades(Combined)
Homeless 2017-18 <10 * * * * * * * *
Mathematics All Grades(Combined)
NotHomeless
2017-18 52 <10 * * * * * * *
Page 34 of A service of the Center for Educational Performance and Information (CEPI) 52

04/09/2019
Annual Education Report Innocademy Allegan Campus (02322)MI-Access Students Who Took MI-Access, by Test Type
Subject Grade TestingGroup
SchoolYear
NumberTested -M-STEP,SAT or MI-Access
NumberTested -Any MI-Access
PercentTested -Any MI-Access
NumberTested -FunctionalIndependence
PercentTested -FunctionalIndependence
NumberTested -SupportedIndependence
PercentTested -SupportedIndependence
NumberTested -Participation
PercentTested -Participation
Mathematics All Grades(Combined)
Not FosterCare
2017-18 59 <10 * * * * * * *
Mathematics All Grades(Combined)
Not MilitaryConnected
2017-18 59 <10 * * * * * * *
SocialStudies
All Grades(Combined)
All Students 2017-18 19 <10 * * * * * * *
SocialStudies
All Grades(Combined)
Black orAfricanAmerican
2017-18 <10 * * * * * * * *
SocialStudies
All Grades(Combined)
Hispanic ofAny Race
2017-18 <10 * * * * * * * *
SocialStudies
All Grades(Combined)
Two or MoreRaces
2017-18 <10 * * * * * * * *
SocialStudies
All Grades(Combined)
White 2017-18 10 <10 * * * * * * *
SocialStudies
All Grades(Combined)
Female 2017-18 <10 * * * * * * * *
SocialStudies
All Grades(Combined)
Male 2017-18 11 <10 * * * * * * *
SocialStudies
All Grades(Combined)
EconomicallyDisadvantaged
2017-18 16 <10 * * * * * * *
SocialStudies
All Grades(Combined)
NotEconomicallyDisadvantaged
2017-18 <10 * * * * * * * *
Page 35 of A service of the Center for Educational Performance and Information (CEPI) 52

04/09/2019
Annual Education Report Innocademy Allegan Campus (02322)MI-Access Students Who Took MI-Access, by Test Type
Subject Grade TestingGroup
SchoolYear
NumberTested -M-STEP,SAT or MI-Access
NumberTested -Any MI-Access
PercentTested -Any MI-Access
NumberTested -FunctionalIndependence
PercentTested -FunctionalIndependence
NumberTested -SupportedIndependence
PercentTested -SupportedIndependence
NumberTested -Participation
PercentTested -Participation
SocialStudies
All Grades(Combined)
EnglishLearners
2017-18 <10 * * * * * * * *
SocialStudies
All Grades(Combined)
Not EnglishLearners
2017-18 18 <10 * * * * * * *
SocialStudies
All Grades(Combined)
Not Migrant 2017-18 19 <10 * * * * * * *
SocialStudies
All Grades(Combined)
StudentsWithDisabilities
2017-18 <10 * * * * * * * *
SocialStudies
All Grades(Combined)
StudentsWithoutDisabilities
2017-18 14 <10 * * * * * * *
SocialStudies
All Grades(Combined)
Homeless 2017-18 <10 * * * * * * * *
SocialStudies
All Grades(Combined)
NotHomeless
2017-18 17 <10 * * * * * * *
SocialStudies
All Grades(Combined)
Not FosterCare
2017-18 19 <10 * * * * * * *
SocialStudies
All Grades(Combined)
Not MilitaryConnected
2017-18 19 <10 * * * * * * *
Page 36 of A service of the Center for Educational Performance and Information (CEPI) 52

04/09/2019
Annual Education Report Innocademy Allegan Campus (02322)Accountability Details Subject Data
TestingGroup
Subject StateTestedTotal
State NotTestedTotal
StatePercentProficient
DistrictTestedTotal
DistrictNotTestedTotal
DistrictPercentProficient*
SchoolTestedTotal
SchoolNotTestedTotal
SchoolPercentProficient**
AllStudents
ELA 98.7% 0.1% 47.33% 98.3% 0.0% N/A 98.3% 0.0% 22.41%
AllStudents
Mathematics
98.8% 1.2% 38.72% 100.0% 0.0% N/A 100.0% 0.0% 13.56%
AllStudents
Science 97.8% 2.2% N/A 100.0% 0.0% N/A 100.0% 0.0% N/A
AllStudents
SocialStudies
97.7% 2.3% 32.57% 100.0% 0.0% N/A 100.0% 0.0% 5.26%
AmericanIndian orAlaskaNative
ELA 97.8% 0.0% 38.17% N/A N/A N/A N/A N/A N/A
AmericanIndian orAlaskaNative
Mathematics
98.0% 2.0% 28.39% N/A N/A N/A N/A N/A N/A
AmericanIndian orAlaskaNative
Science 96.2% 3.8% N/A N/A N/A N/A N/A N/A N/A
AmericanIndian orAlaskaNative
SocialStudies
96.2% 3.8% 26.22% N/A N/A N/A N/A N/A N/A
Asian ELA 98.9% 1.2% 69.51% N/A N/A N/A N/A N/A N/A
Asian Mathematics
99.3% 0.7% 69.47% N/A N/A N/A N/A N/A N/A
Asian Science 99.0% 1.0% N/A N/A N/A N/A N/A N/A N/A
Asian SocialStudies
98.6% 1.4% 50.74% N/A N/A N/A N/A N/A N/A
Black orAfricanAmerican
ELA 97.9% 0.0% 23.02% <10 <10 <10 <10 <10 <10
Black orAfricanAmerican
Mathematics
98.0% 2.0% 13.99% <10 <10 <10 <10 <10 <10
Black orAfricanAmerican
Science 96.1% 3.9% N/A <10 <10 <10 <10 <10 <10
Black orAfricanAmerican
SocialStudies
96.0% 4.0% 11.40% <10 <10 <10 <10 <10 <10
Hispanic ofAny Race
ELA 98.7% 0.4% 35.55% 100.0% 0.0% N/A 100.0% 0.0% 38.46%
Page 37 of A service of the Center for Educational Performance and Information (CEPI) 52

04/09/2019
Annual Education Report Innocademy Allegan Campus (02322)Accountability Details Subject Data
TestingGroup
Subject StateTestedTotal
State NotTestedTotal
StatePercentProficient
DistrictTestedTotal
DistrictNotTestedTotal
DistrictPercentProficient*
SchoolTestedTotal
SchoolNotTestedTotal
SchoolPercentProficient**
Hispanic ofAny Race
Mathematics
98.8% 1.2% 25.34% 100.0% 0.0% N/A 100.0% 0.0% 15.38%
Hispanic ofAny Race
Science 97.7% 2.3% N/A <10 <10 <10 <10 <10 <10
Hispanic ofAny Race
SocialStudies
97.5% 2.5% 20.88% <10 <10 <10 <10 <10 <10
NativeHawaiianor OtherPacificIslander
ELA 98.1% 1.1% 51.03% N/A N/A N/A N/A N/A N/A
NativeHawaiianor OtherPacificIslander
Mathematics
97.9% 2.1% 38.63% N/A N/A N/A N/A N/A N/A
NativeHawaiianor OtherPacificIslander
Science 96.5% 3.5% N/A N/A N/A N/A N/A N/A N/A
NativeHawaiianor OtherPacificIslander
SocialStudies
96.2% 3.8% 33.46% N/A N/A N/A N/A N/A N/A
Two orMoreRaces
ELA 98.7% 0.0% 44.35% <10 <10 <10 <10 <10 <10
Two orMoreRaces
Mathematics
98.8% 1.2% 35.00% <10 <10 <10 <10 <10 <10
Two orMoreRaces
Science 97.8% 2.2% N/A <10 <10 <10 <10 <10 <10
Two orMoreRaces
SocialStudies
97.7% 2.3% 28.54% <10 <10 <10 <10 <10 <10
White ELA 98.9% 0.1% 53.90% 97.3% 0.0% N/A 97.3% 0.0% 19.44%
White Mathematics
99.0% 1.0% 45.19% 100.0% 0.0% N/A 100.0% 0.0% 16.22%
White Science 98.2% 1.8% N/A <10 <10 <10 <10 <10 <10
White SocialStudies
98.1% 1.9% 38.15% 100.0% 0.0% N/A 100.0% 0.0% 0.00%
Female ELA 98.8% 0.1% 51.36% 100.0% 0.0% N/A 100.0% 0.0% 20.83%
Page 38 of A service of the Center for Educational Performance and Information (CEPI) 52

04/09/2019
Annual Education Report Innocademy Allegan Campus (02322)Accountability Details Subject Data
TestingGroup
Subject StateTestedTotal
State NotTestedTotal
StatePercentProficient
DistrictTestedTotal
DistrictNotTestedTotal
DistrictPercentProficient*
SchoolTestedTotal
SchoolNotTestedTotal
SchoolPercentProficient**
Female Mathematics
98.9% 1.1% 37.11% 100.0% 0.0% N/A 100.0% 0.0% 4.17%
Female Science 98.0% 2.0% N/A <10 <10 <10 <10 <10 <10
Female SocialStudies
97.9% 2.1% 29.94% <10 <10 <10 <10 <10 <10
Male ELA 98.6% 0.1% 43.47% 97.1% 0.0% N/A 97.1% 0.0% 23.53%
Male Mathematics
98.7% 1.3% 40.26% 100.0% 0.0% N/A 100.0% 0.0% 20.00%
Male Science 97.7% 2.3% N/A 100.0% 0.0% N/A 100.0% 0.0% N/A
Male SocialStudies
97.5% 2.5% 35.10% 100.0% 0.0% N/A 100.0% 0.0% 9.09%
EconomicallyDisadvantaged
ELA 98.3% 0.1% 32.40% 97.9% 0.0% N/A 97.9% 0.0% 21.74%
EconomicallyDisadvantaged
Mathematics
98.4% 1.6% 23.76% 100.0% 0.0% N/A 100.0% 0.0% 14.89%
EconomicallyDisadvantaged
Science 96.9% 3.1% N/A 100.0% 0.0% N/A 100.0% 0.0% N/A
EconomicallyDisadvantaged
SocialStudies
96.8% 3.2% 18.67% 100.0% 0.0% N/A 100.0% 0.0% 6.25%
EnglishLearners
ELA 98.4% 1.8% 23.27% <10 <10 <10 <10 <10 <10
EnglishLearners
Mathematics
98.9% 1.1% 23.08% <10 <10 <10 <10 <10 <10
EnglishLearners
Science 98.1% 1.9% N/A <10 <10 <10 <10 <10 <10
EnglishLearners
SocialStudies
97.7% 2.3% 7.02% <10 <10 <10 <10 <10 <10
Migrant ELA 98.1% 0.8% 17.96% N/A N/A N/A N/A N/A N/A
Migrant Mathematics
97.8% 2.2% 14.81% N/A N/A N/A N/A N/A N/A
Migrant Science 95.5% 4.5% N/A N/A N/A N/A N/A N/A N/A
Migrant SocialStudies
94.4% 5.6% 10.70% N/A N/A N/A N/A N/A N/A
Page 39 of A service of the Center for Educational Performance and Information (CEPI) 52

04/09/2019
Annual Education Report Innocademy Allegan Campus (02322)Accountability Details Subject Data
TestingGroup
Subject StateTestedTotal
State NotTestedTotal
StatePercentProficient
DistrictTestedTotal
DistrictNotTestedTotal
DistrictPercentProficient*
SchoolTestedTotal
SchoolNotTestedTotal
SchoolPercentProficient**
StudentsWithDisabilities
ELA 97.4% 0.0% 24.46% 92.3% 0.0% N/A 92.3% 0.0% 16.67%
StudentsWithDisabilities
Mathematics
97.9% 2.1% 19.21% 100.0% 0.0% N/A 100.0% 0.0% 23.08%
StudentsWithDisabilities
Science 94.6% 5.4% N/A <10 <10 <10 <10 <10 <10
StudentsWithDisabilities
SocialStudies
94.4% 5.6% 12.66% <10 <10 <10 <10 <10 <10
Homeless ELA 95.9% 0.3% 25.16% <10 <10 <10 <10 <10 <10
Homeless Mathematics
96.2% 3.8% 17.34% <10 <10 <10 <10 <10 <10
Homeless Science 93.2% 6.8% N/A <10 <10 <10 <10 <10 <10
Homeless SocialStudies
93.2% 6.8% 13.58% <10 <10 <10 <10 <10 <10
FosterCare
ELA 94.4% 0.0% 25.58% N/A N/A N/A N/A N/A N/A
FosterCare
Mathematics
94.6% 5.4% 17.49% N/A N/A N/A N/A N/A N/A
FosterCare
Science 90.2% 9.8% N/A N/A N/A N/A N/A N/A N/A
FosterCare
SocialStudies
90.0% 10.0% 11.94% N/A N/A N/A N/A N/A N/A
MilitaryConnected
ELA 98.0% 0.0% 55.30% N/A N/A N/A N/A N/A N/A
MilitaryConnected
Mathematics
98.4% 1.6% 43.23% N/A N/A N/A N/A N/A N/A
MilitaryConnected
Science 97.4% 2.6% N/A N/A N/A N/A N/A N/A N/A
MilitaryConnected
SocialStudies
96.3% 3.7% 36.16% N/A N/A N/A N/A N/A N/A
Page 40 of A service of the Center for Educational Performance and Information (CEPI) 52

04/09/2019
Annual Education Report Innocademy Allegan Campus (02322)High School Graduation: Four-Year Adjusted Cohort Rate
Student Group Baseline Data Most RecentResults
Interim Objective Interim Objective Long-Term Target
No Data to Display
Page 41 of A service of the Center for Educational Performance and Information (CEPI) 52

04/09/2019
Annual Education Report Innocademy Allegan Campus (02322)Percentage of English Learners Making Progress in Achieving English Language Proficiency
Student Group Baseline Data(2016)
Most RecentResults (2018)
Interim Objective(2020)
Interim Objective(2022)
Long-Term Target(2025)
English Learners 46.41% <10 49.27% 50.69% 52.12%
Page 42 of A service of the Center for Educational Performance and Information (CEPI) 52

04/09/2019
Annual Education Report Innocademy Allegan Campus (02322)Accountability Details Attendance Data
Student Group Statewide District School
All Students 80.08% N/A 74.07%
* All data based on students enrolled for a full academic year.
Page 43 of A service of the Center for Educational Performance and Information (CEPI) 52

04/09/2019
Annual Education Report Innocademy Allegan Campus (02322)Academic Proficiency
Student Group Student Group Baseline Data (2016) Most Recent Results(2018)
Interim Objective(2020)
Interim Objective(2022)
Long-Term Target(2025)
All Students ELA 49.14% 22.41% 53.97% 56.38% 60.00%
EconomicallyDisadvantaged
ELA 32.83% 21.74% 44.90% 50.94% 60.00%
English Learners ELA 22.25% <10 39.03% 47.42% 60.00%
Students WithDisabilities
ELA 18.87% 16.67% 37.15% 46.29% 60.00%
Black or AfricanAmerican
ELA 23.26% <10 39.59% 47.75% 60.00%
Hispanic of Any Race ELA 36.15% 38.46% 46.75% 52.05% 60.00%
Two or More Races ELA 46.76% <10 52.64% 55.59% 60.00%
White ELA 56.05% 19.44% 57.81% 58.68% 60.00%
All Students Mathematics 37.55% 13.56% 41.99% 44.22% 47.55%
EconomicallyDisadvantaged
Mathematics 21.92% 14.89% 33.31% 39.01% 47.55%
English Learners Mathematics 21.04% <10 32.82% 38.71% 47.55%
Students WithDisabilities
Mathematics 15.57% 23.08% 29.78% 36.89% 47.55%
Black or AfricanAmerican
Mathematics 12.43% <10 28.04% 35.85% 47.55%
Hispanic of Any Race Mathematics 23.63% 15.38% 34.26% 39.58% 47.55%
Two or More Races Mathematics 34.42% <10 40.26% 43.17% 47.55%
White Mathematics 43.95% 16.22% 45.55% 46.35% 47.55%
Page 44 of A service of the Center for Educational Performance and Information (CEPI) 52

04/09/2019
Annual Education Report Innocademy Allegan Campus (02322)Accountability Index Data
School Name ProficiencyIndex Value
GrowthIndex Value
GraduationRate IndexValue
EL ProgressIndex Value
SchoolQuality/Student SuccessIndex Value
GeneralParticipationIndex Value
ELParticipationIndex Value
Overall IndexValue
Accountability Status
Reason forIdentification
InnocademyAlleganCampus
33.32 20.74 N/A N/A 76.46 100.00 N/A 37.24 N/A N/A
Page 45 of A service of the Center for Educational Performance and Information (CEPI) 52

04/09/2019
Annual Education Report Innocademy Allegan Campus (02322)Professional Qualifications of All Public Elementary and Secondary School Teachers
Other B.A. M.A. P.H.D.
Innocademy AlleganCampus (02322)
0 10 0 0
Professional Qualifications are defined by the State and may include information such as the degrees of public school teachers (e.g.,percentage of teachers with Bachelors Degrees or Masters Degrees) or the percentage of fully certified teachers
Inexperienced Teachers
Total Numberof StaffingGroup
NumberInexperienced
PercentInexperienced
Count High-PovertySchools
Percent High-PovertySchools
Count Low-PovertySchools
Percent Low-PovertySchools
InnocademyAlleganCampus(02322)
6.70 4.50 67.2% 4.50 67.2% N/A N/A
Inexperienced Principals and Other School Leaders
Total Numberof StaffingGroup
NumberInexperienced
PercentInexperienced
Count High-PovertySchools
Percent High-PovertySchools
Count Low-PovertySchools
Percent Low-PovertySchools
InnocademyAlleganCampus(02322)
0.20 0.20 100.0% 0.20 100.0% N/A N/A
Teacher Emergency or Provisional Credentials
Total Numberof Teachers
Number withEmergency orProvisionalCredentials
Percent withEmergency orProvisionalCredentials
Count High-PovertySchools
Percent High-PovertySchools
Count Low-PovertySchools
Percent Low-PovertySchools
InnocademyAlleganCampus(02322)
6.70 0.40 6.0% 0.40 6.0% N/A N/A
Out-of-Field Teachers
Total Numberof Teachers
Number ofOut-of-FieldTeachers
Percent ofOut-of-FieldTeachers
Count High-PovertySchools
Percent High-PovertySchools
Count Low-PovertySchools
Percent Low-PovertySchools
InnocademyAlleganCampus(02322)
6.70 1.60 23.9% 1.60 23.9% N/A N/A
Page 46 of A service of the Center for Educational Performance and Information (CEPI) 52

04/09/2019
Annual Education Report Innocademy Allegan Campus (02322)LEA School Improvement Fund Recipients
District Name School Name Type of School Funds Received StrategiesImplemented
No Data to Display
Page 47 of A service of the Center for Educational Performance and Information (CEPI) 52

04/09/2019
Annual Education Report Innocademy Allegan Campus (02322)NAEP Grade 4 Math
Percent ofStudents
Percent belowBasic
Percent Basic Percent Proficient Percent Advanced
All Students 100 25 39 28 7
MaleFemale
5050
2525
3942
2826
76
National LunchProgram EligibilityEligibleNot EligibleInfo not available
48431
4012‡
4236‡
1739‡
213‡
Race/EthnicityWhiteBlack or AfricanAmericanHispanicAsianAmerican Indian orAlaska NativeNative Hawaiian orOther PacificIslanderTwo or More Races
651785‡‡4
1755399‡‡24
41364321‡‡37
3491542‡‡26
81428‡‡12
Student classified ashaving a disabilitySDNot SD
1189
5921
2840
1130
28
Student is an EnglishLanguage LearnerELLNot ELL
892
4124
4039
1629
28
‡ Reporting Standards not met. Note: Observed differences are not necessarily statistically significant. Detail may not sum to totalbecause of rounding. SOURCE: U.S. Department of Education. Institute for Education Sciences. National Center for EducationStatistics. National Assessment of Educational Progress (NAEP) 2017 Mathematics Achievement.
Page 48 of A service of the Center for Educational Performance and Information (CEPI) 52

04/09/2019
Annual Education Report Innocademy Allegan Campus (02322)NAEP Grade 8 Math
Percent ofStudents
Percent belowBasic
Percent Basic Percent Proficient Percent Advanced
All Students 100 33 35 22 9
MaleFemale
5149
3532
3437
2123
107
National LunchProgram EligibilityEligibleNot EligibleInfo not available
41581
5220‡
3238‡
1329‡
213‡
Race/EthnicityWhiteBlack or AfricanAmericanHispanicAsianAmerican Indian orAlaska NativeNative Hawaiian orOther PacificIslanderTwo or More Races
7115741‡3
26674813‡‡40
38243623‡‡38
2781227‡‡16
101338‡‡6
Student classified ashaving a disabilitySDNot SD
4658
4520
3738
1529
313
Student is an EnglishLanguage LearnerELLNot ELL
694
7531
2326
224
#9
‡ Reporting Standards not met. NOTE: Observed differences are not necessarily statistically significant. Detail may not sum to totalbecause of rounding. SOURCE: U.S. Department of Education. Institute for Education Sciences. National Center for EducationStatistics. National Assessment of Educational Progress (NAEP) 2017 Mathematics Achievement.
Page 49 of A service of the Center for Educational Performance and Information (CEPI) 52

04/09/2019
Annual Education Report Innocademy Allegan Campus (02322)NAEP Grade 4 Reading
Percent ofStudents
Percent belowBasic
Percent Basic Percent Proficient Percent Advanced
All Students 100 33 35 22 9
MaleFemale
5149
3532
3437
2123
107
National LunchProgram EligibilityEligibleNot EligibleInfo not available
41581
5220‡
3238‡
1329‡
213‡
Race/EthnicityWhiteBlack or AfricanAmericanHispanicAsianAmerican Indian orAlaska NativeNative Hawaiian orOther PacificIslanderTwo or More Races
7115741‡3
26674813‡‡40
38243623‡‡38
2781227‡‡16
101338‡‡6
Student classified ashaving a disabilitySDNot SD
4658
4520
3738
1529
313
Student is an EnglishLanguage LearnerELLNot ELL
694
7531
2336
224
#9
# Rounds to zero‡ Reporting Standards not met. NOTE: Observed differences are not necessarily statistically significant. Detail may not sum to totalbecause of rounding. SOURCE: U.S. Department of Education, Institute of Education Sciences, National Center for EducationStatistics, National Assessment of Educational Progress (NAEP), 2017 Reading Assessment.
Page 50 of A service of the Center for Educational Performance and Information (CEPI) 52
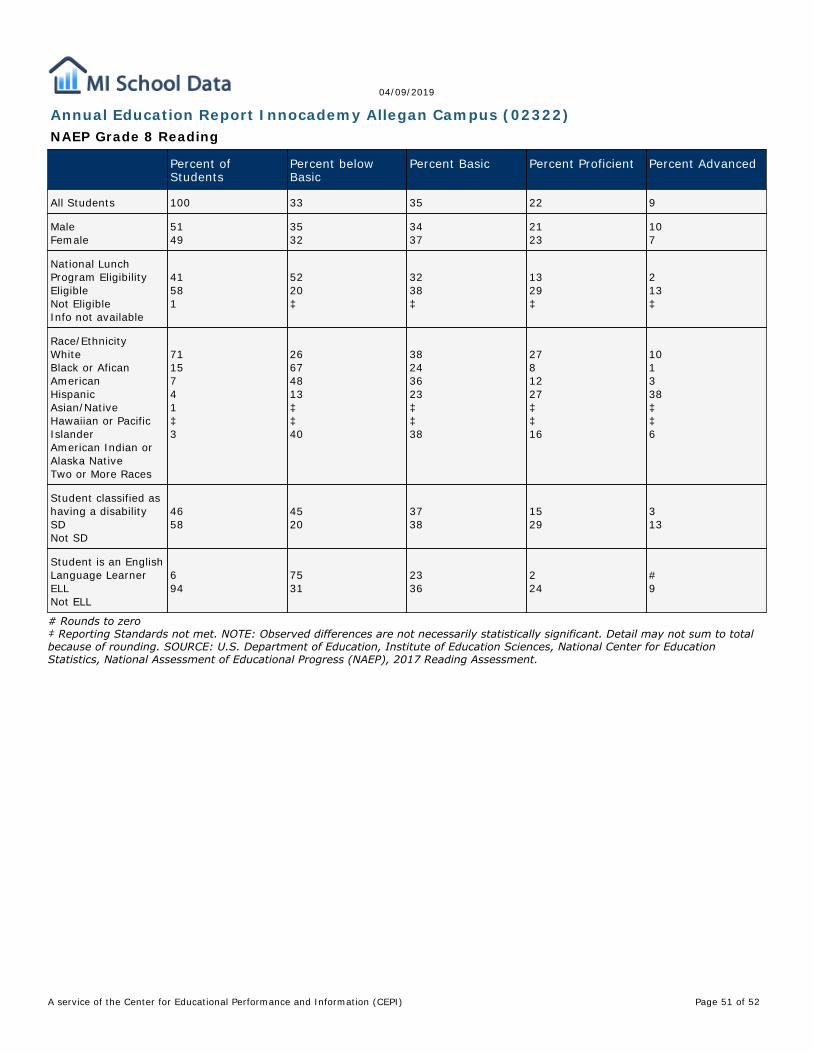
04/09/2019
Annual Education Report Innocademy Allegan Campus (02322)NAEP Grade 8 Reading
Percent ofStudents
Percent belowBasic
Percent Basic Percent Proficient Percent Advanced
All Students 100 33 35 22 9
MaleFemale
5149
3532
3437
2123
107
National LunchProgram EligibilityEligibleNot EligibleInfo not available
41581
5220‡
3238‡
1329‡
213‡
Race/EthnicityWhiteBlack or AficanAmericanHispanicAsian/NativeHawaiian or PacificIslanderAmerican Indian orAlaska NativeTwo or More Races
7115741‡3
26674813‡‡40
38243623‡‡38
2781227‡‡16
101338‡‡6
Student classified ashaving a disabilitySDNot SD
4658
4520
3738
1529
313
Student is an EnglishLanguage LearnerELLNot ELL
694
7531
2336
224
#9
# Rounds to zero‡ Reporting Standards not met. NOTE: Observed differences are not necessarily statistically significant. Detail may not sum to totalbecause of rounding. SOURCE: U.S. Department of Education, Institute of Education Sciences, National Center for EducationStatistics, National Assessment of Educational Progress (NAEP), 2017 Reading Assessment.
Page 51 of A service of the Center for Educational Performance and Information (CEPI) 52

04/09/2019
Annual Education Report Innocademy Allegan Campus (02322)NAEP Participation Data
Grade Subject Participation Ratefor Students withDisabilities
Standard Error Participation Ratefor Limited EnglishProficient Students
Standard Error
4 MathReading
8182
2.73.3
9490
2.73.4
8 MathReading
8584
2.42.4
8692
3.21.9
Page 52 of A service of the Center for Educational Performance and Information (CEPI) 52