April 12-13, 2010 PEÑASQUITO TOUR · In-Pit Crushing & Conveying Identified significant operating...
45
1 1 April 12-13, 2010 PEÑASQUITO TOUR
Transcript of April 12-13, 2010 PEÑASQUITO TOUR · In-Pit Crushing & Conveying Identified significant operating...
1 1
April 12-13, 2010
PEÑASQUITO TOUR

2
FORWARD-LOOKING STATEMENTS
2
This presentation contains “forward-looking statements”, within the meaning of the United States Private Securities Litigation Reform Act of
1995 and applicable Canadian securities legislation, concerning the business, operations and financial performance and condition of
Goldcorp Inc. (“Goldcorp”). Forward-looking statements include, but are not limited to, statements with respect to the future price of gold,
silver, copper, lead and zinc, the estimation of mineral reserves and resources, the realization of mineral reserve estimates, the timing and
amount of estimated future production, costs of production, capital expenditures, costs and timing of the development of new deposits,
success of exploration activities, permitting time lines, hedging practices, currency exchange rate fluctuations, requirements for additional
capital, government regulation of mining operations, environmental risks, unanticipated reclamation expenses, timing and possible outcome
of pending litigation, title disputes or claims and limitations on insurance coverage. Generally, these forward-looking statements can be
identified by the use of forward-looking terminology such as “plans”, “expects” or “does not expect”, “is expected”, “budget”, “scheduled”,
“estimates”, “forecasts”, “intends”, “anticipates” or “does not anticipate”, “believes” or variations of such words and phrases or statements that
certain actions, events or results “may”, “could”, “would”, “might” or “will be taken”, “occur” or “be achieved”. Forward-looking statements are
subject to known and unknown risks, uncertainties and other factors that may cause the actual results, level of activity, performance or
achievements of Goldcorp to be materially different from those expressed or implied by such forward-looking statements, including but not
limited to: risks related to the integration of acquisitions; risks related to international operations; risks related to joint venture operations;
actual results of current exploration activities; actual results of current reclamation activities; conclusions of economic evaluations; changes in
project parameters as plans continue to be refined; future prices of gold, silver, copper, lead and zinc; possible variations in ore reserves,
grade or recovery rates; failure of plant, equipment or processes to operate as anticipated; accidents, labour disputes; delays in obtaining
governmental approvals or financing or in the completion of development or construction activities and other risks of the mining industry, as
well as those factors discussed in the section entitled “Description of the Business – Risk Factors” in Goldcorp’s annual information form for
the year ended December 31, 2008 available at www.sedar.com. Although Goldcorp has attempted to identify important factors that could
cause actual results to differ materially from those contained in forward-looking statements, there may be other factors that cause results not
to be as anticipated, estimated or intended. There can be no assurance that such statements will prove to be accurate, as actual results and
future events could differ materially from those anticipated in such statements. Accordingly, readers should not place undue reliance on
forward-looking statements. Goldcorp does not undertake to update any forward-looking statements that are included in this document,
except in accordance with applicable securities laws.

3 3
GROWING:
EFFICIENT:
STRONG:
STABLE:
GROWTH LEADER
LOW-COST PRODUCER
OUTSTANDING BALANCE SHEET
LOW POLITICAL RISK

4
GOLDCORP: THE GROWTH CONTINUES
4
2004 2005 2006 2007 2008 2009 2010* 2011* 2012* 2013* 2014*
3.8 Moz
*Au production estimates 2010 - 2014
5
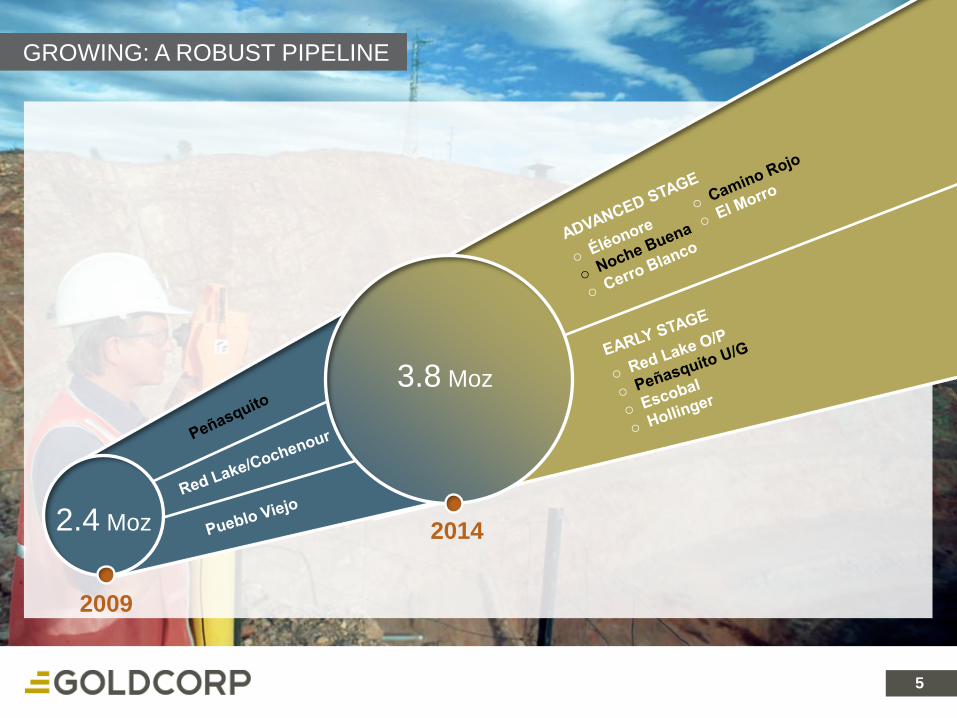
GROWING: A ROBUST PIPELINE
5
2.4 Moz
3.8 Moz
2014
2009

6
STRONG: OUTSTANDING BALANCE SHEET (AS OF DEC. 31, 2009)
Cash
6
$874.6M
Convertible senior notes $862.5M
Available debt facility $1.5B
Average annual cash flow over next 5 years ~$1.5B
Debt : Total capitalization < 0.01 : 1
Exceptionally strong balance sheet
7
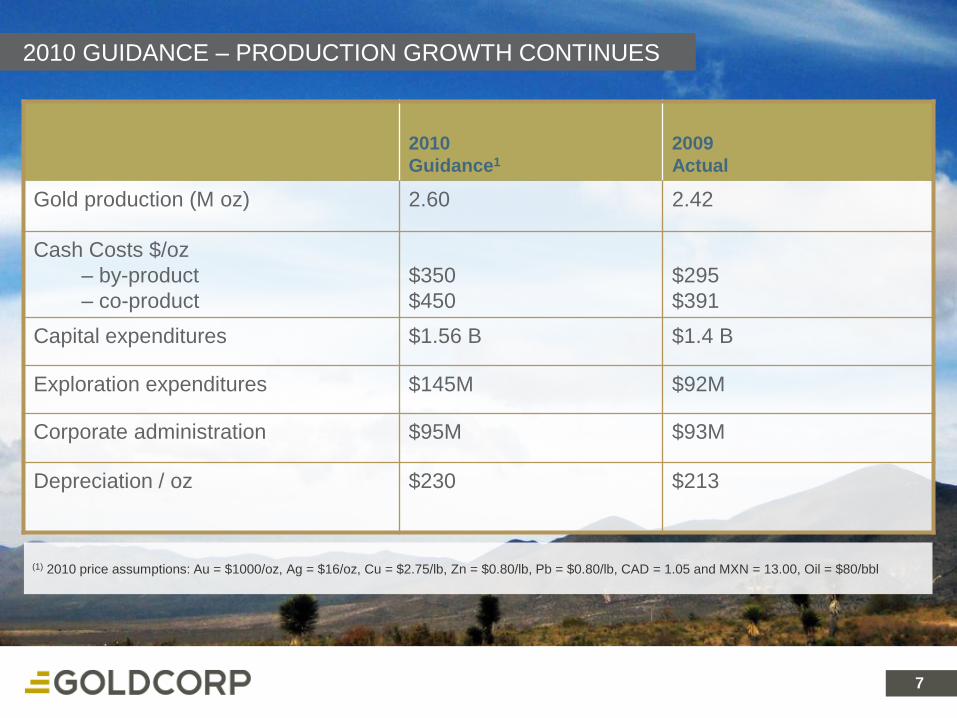
(1) 2010 price assumptions: Au = $1000/oz, Ag = $16/oz, Cu = $2.75/lb, Zn = $0.80/lb, Pb = $0.80/lb, CAD = 1.05 and MXN = 13.00, Oil = $80/bbl
2010 GUIDANCE – PRODUCTION GROWTH CONTINUES
2010
Guidance1
2009
Actual
Gold production (M oz) 2.60 2.42
Cash Costs $/oz
– by-product
– co-product
$350
$450
$295
$391
Capital expenditures $1.56 B $1.4 B
Exploration expenditures $145M $92M
Corporate administration $95M $93M
Depreciation / oz $230 $213
7

8
STABLE: LOW POLITICAL RISK PROFILE
8
CANADA
Red Lake 3.4 675,000
Porcupine 2.8 280,000
Musselwhite 2.1 260,000
UNITED STATES
Marigold (66.7%) 1.6 120,000
Wharf 0.2 65,000
MEXICO
Peñasquito 17.8 180,000
Los Filos 5.7 300,000
San Dimas 0.9 110,000
El Sauzal 0.3 155,000
CENTRAL AND SOUTH AMERICA
Marlin 2.1 290,000
Alumbrera (37.5%) 1.5 165,000
2010E Au
(oz)
Au reserves
(Moz)
FOCUS IN THE AMERICAS
2.6 Moz2010E GOLD PRODUCTION

9 8
PEÑASQUITOPROJECT OPTIMIZATION
BACKGROUND
PRODUCTION
EXPLORATION

10
PEÑASQUITO
10
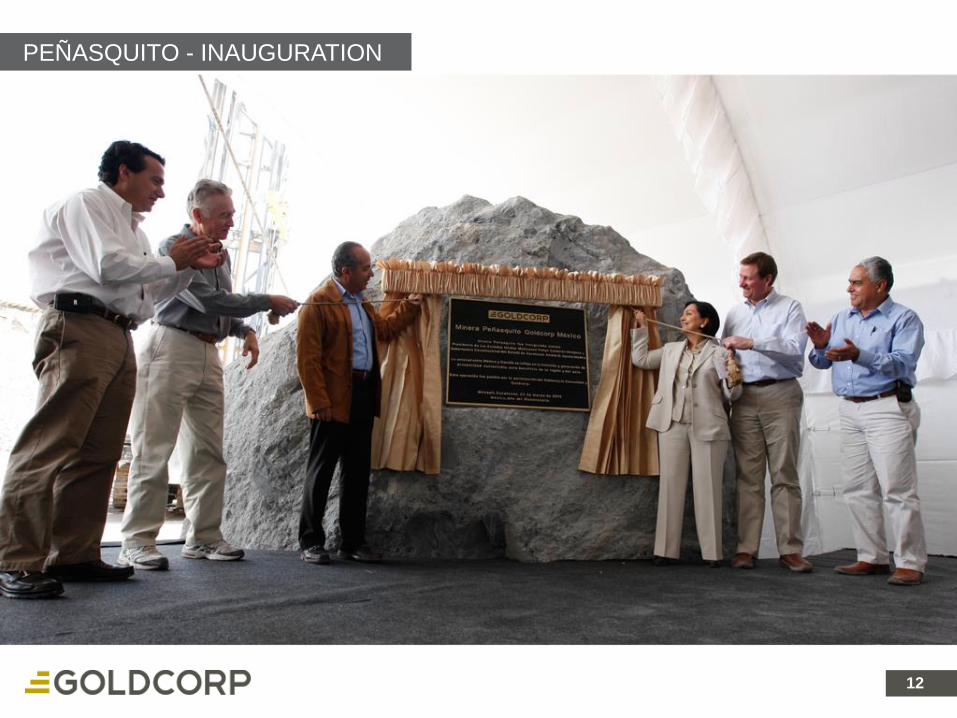
One of the world’s
largest new mines
Inauguration – March 23, 2010

11 11
PEÑASQUITO - INAUGURATION
12 12
PEÑASQUITO - INAUGURATION

13
PEÑASQUITO LOCATION
13
Mazatlan
TorreónSmelter
Herrmosillo
Zacatecas
Saltillo
Mexico City
Chihuahua
Los Mochis
Peñasquito
Los Filos
San Dimas
El Sauzal
BACKGROUND

14
PEÑASQUITO SITE MAP
14
BACKGROUND
15
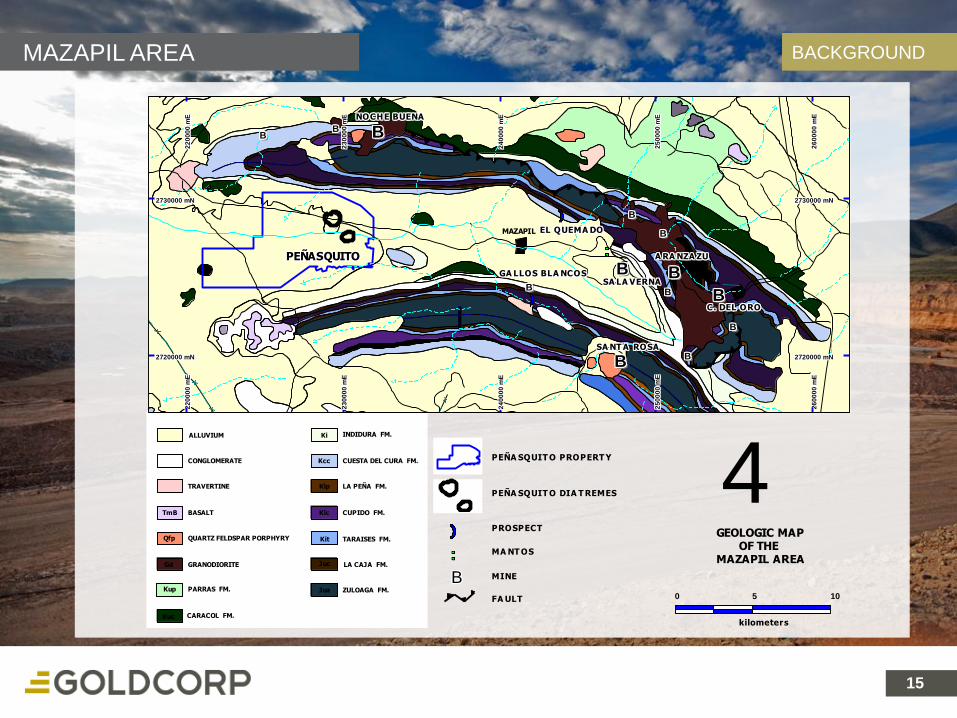
MAZAPIL AREA
15
LA CAJA FM.
TARAISES FM.
CUPIDO FM.
LA PEÑA FM.
Klc
Kit
Juc
Juz
Ki
Klp
KccCONGLOMERATE CUESTA DEL CURA FM.
ALLUVIUM INDIDURA FM.
ZULOAGA FM.
QUARTZ FELDSPAR PORPHYRY
GRANODIORITE
CARACOL FM.
PARRAS FM.
BASALT
TRAVERTINE
Gd
Kuc
Kup
Qfp
TmB
II
BBBBBBBBBB
BBBBBBBBBB
BBBBBBBBBB
BBBBBBBBBB
BBBBBBBBBB
BBBBBBBBBBBBBBBBBBBB
BBBBBBBBBB
BBBBBBBBBB
BBBBBBBBBB
B
BBBBBBBB
B
BBBBBBBBBBBBBBBBBBBBBBBBBBBBBB
26
00
00
mE
26
00
00
mE
26
00
00
mE
26
00
00
mE
26
00
00
mE
26
00
00
mE
26
00
00
mE
26
00
00
mE
26
00
00
mE
2730000 mN2730000 mN2730000 mN2730000 mN2730000 mN2730000 mN2730000 mN2730000 mN2730000 mN
26
00
00
mE
26
00
00
mE
26
00
00
mE
26
00
00
mE
26
00
00
mE
26
00
00
mE
26
00
00
mE
26
00
00
mE
26
00
00
mE
2720000 mN2720000 mN2720000 mN2720000 mN2720000 mN2720000 mN2720000 mN2720000 mN2720000 mN
24
00
00
mE
24
00
00
mE
24
00
00
mE
24
00
00
mE
24
00
00
mE
24
00
00
mE
24
00
00
mE
24
00
00
mE
24
00
00
mE
24
00
00
mE
24
00
00
mE
24
00
00
mE
24
00
00
mE
24
00
00
mE
24
00
00
mE
24
00
00
mE
24
00
00
mE
24
00
00
mE
25
00
00
mE
25
00
00
mE
25
00
00
mE
25
00
00
mE
25
00
00
mE
25
00
00
mE
25
00
00
mE
25
00
00
mE
25
00
00
mE
25
00
00
mE
25
00
00
mE
25
00
00
mE
25
00
00
mE
25
00
00
mE
25
00
00
mE
25
00
00
mE
25
00
00
mE
25
00
00
mE
22
00
00
mE
22
00
00
mE
22
00
00
mE
22
00
00
mE
22
00
00
mE
22
00
00
mE
22
00
00
mE
22
00
00
mE
22
00
00
mE
23
00
00
mE
23
00
00
mE
23
00
00
mE
23
00
00
mE
23
00
00
mE
23
00
00
mE
23
00
00
mE
23
00
00
mE
23
00
00
mE
2730000 mN2730000 mN2730000 mN2730000 mN2730000 mN2730000 mN2730000 mN2730000 mN2730000 mN
22
00
00
mE
22
00
00
mE
22
00
00
mE
22
00
00
mE
22
00
00
mE
22
00
00
mE
22
00
00
mE
22
00
00
mE
22
00
00
mE
23
00
00
mE
23
00
00
mE
23
00
00
mE
23
00
00
mE
23
00
00
mE
23
00
00
mE
23
00
00
mE
23
00
00
mE
23
00
00
mE
2720000 mN2720000 mN2720000 mN2720000 mN2720000 mN2720000 mN2720000 mN2720000 mN2720000 mN
0 5 10
kilometers
BBBBBBBBB
PEÑA SQUIT O PROPERT Y
PEÑA SQUIT O DIA T REMES
PROSPECT
MA NT OS
MINE
FA ULT
GA LLOS BLA NCOSGA LLOS BLA NCOSGA LLOS BLA NCOSGA LLOS BLA NCOSGA LLOS BLA NCOSGA LLOS BLA NCOSGA LLOS BLA NCOSGA LLOS BLA NCOSGA LLOS BLA NCOS
PEÑASQUITOPEÑASQUITOPEÑASQUITOPEÑASQUITOPEÑASQUITOPEÑASQUITOPEÑASQUITOPEÑASQUITOPEÑASQUITO
NOCHE BUENANOCHE BUENANOCHE BUENANOCHE BUENANOCHE BUENANOCHE BUENANOCHE BUENANOCHE BUENANOCHE BUENA
EL QUEMA DOEL QUEMA DOEL QUEMA DOEL QUEMA DOEL QUEMA DOEL QUEMA DOEL QUEMA DOEL QUEMA DOEL QUEMA DO
SA LA VERNASA LA VERNASA LA VERNASA LA VERNASA LA VERNASA LA VERNASA LA VERNASA LA VERNASA LA VERNA
A RA NZA ZUA RA NZA ZUA RA NZA ZUA RA NZA ZUA RA NZA ZUA RA NZA ZUA RA NZA ZUA RA NZA ZUA RA NZA ZU
C. DEL OROC. DEL OROC. DEL OROC. DEL OROC. DEL OROC. DEL OROC. DEL OROC. DEL OROC. DEL ORO
SA NT A ROSASA NT A ROSASA NT A ROSASA NT A ROSASA NT A ROSASA NT A ROSASA NT A ROSASA NT A ROSASA NT A ROSA
GEOLOGIC MAP OF THEMAZAPIL AREA
4
MAZAPIL
BACKGROUND

16
GEOLOGY
16
BACKGROUND
17
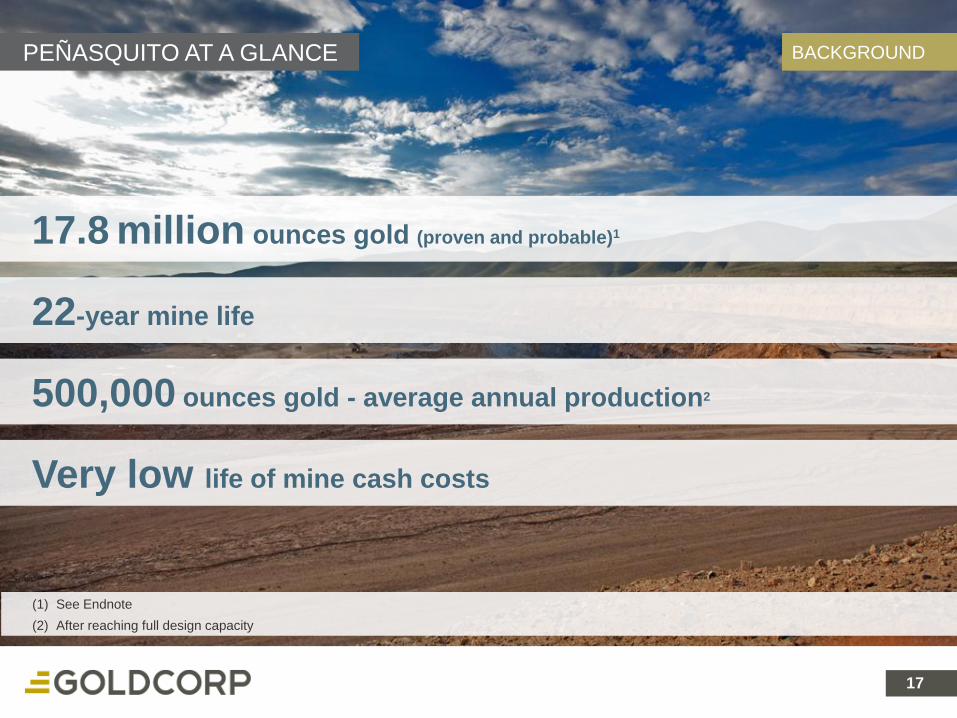
PEÑASQUITO AT A GLANCE
17
17.8 million ounces gold (proven and probable)1
22-year mine life
500,000 ounces gold - average annual production2
Very low life of mine cash costs
(1) See Endnote
(2) After reaching full design capacity
BACKGROUND

18
FOCUS IN 2010
18
Commissioning of Line 2
Commercial production
Operation refinement
Forecast gold production – 180,000 ounces Au
HPGR start up
BACKGROUND

19 19
SAG LINE 2 BACKGROUND

20
RAMPING UP PRODUCTION
20
Q4/10
Q3/10
Q2/09
130,000 tonnes/day
100,000 tonnes/day
50,000 tonnes/day
THROUGHPUT
High-Pressure Grinding Rolls
SAG Line 2
SAG Line 1
Q2/11
BACKGROUND
21
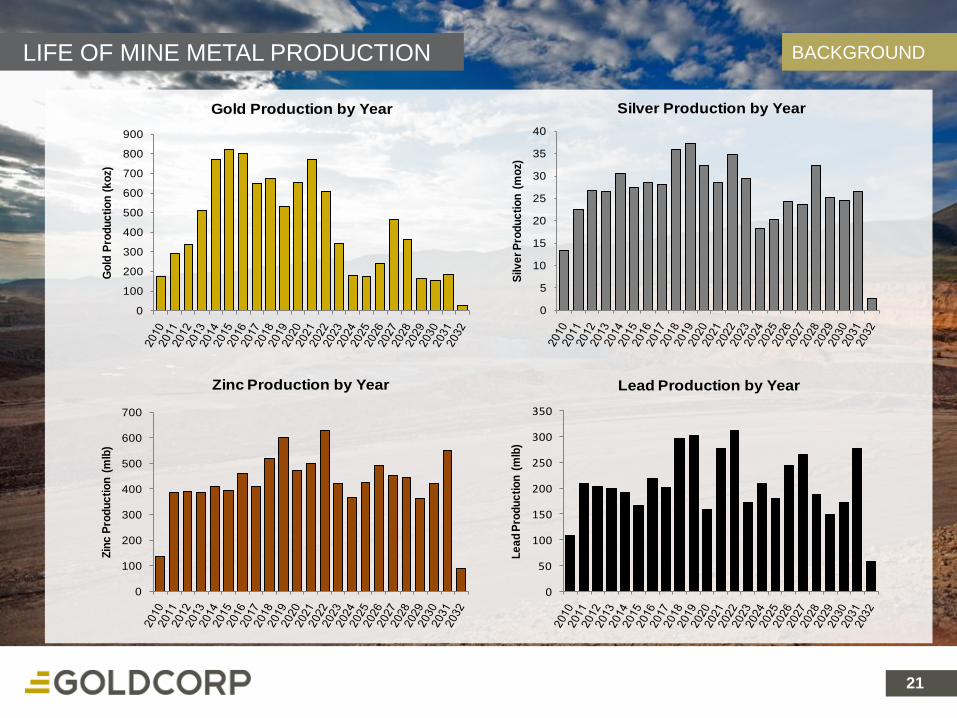
LIFE OF MINE METAL PRODUCTION
21
BACKGROUND
0
100
200
300
400
500
600
700
800
900
Go
ld P
rod
uc
tio
n (
ko
z)Gold Production by Year
0
5
10
15
20
25
30
35
40
Silv
er
Pro
du
cti
on
(m
oz)
Silver Production by Year
0
100
200
300
400
500
600
700
Zin
c P
rod
uc
tio
n (
mlb
)
Zinc Production by Year
0
50
100
150
200
250
300
350
Le
ad
Pro
du
cti
on
(m
lb)
Lead Production by Year

22
FIRST QUARTER PRODUCTION
22
PRODUCTION
Q1-10 Actual
Tonnes Mined – Ore (mt) 6.334
Tonnes Mined – Waste (mt) 36.81
Sulphide Production
Gold (oz) 11,400
Silver (oz) 1,352,900
Zinc (lbs) 17,462,500
Lead (lbs) 11,790,700
Oxide Production
Gold (oz) 19,300
Silver (oz) 725,300

23
MINING
23
PRODUCTION

24
DAILY MINE PRODUCTION
24
PRODUCTION
-
100,000
200,000
300,000
400,000
500,000
600,000
700,000
800,000
To
nn
es p
er
Day
2008 2009 2010
Daily 30 Day Avg
(1) As of April 6, 2010

25
MINING
25
PRODUCTION

26
PROCESSING
26
PRODUCTION

27
MILL PRODUCTION
27
PRODUCTION
Actual
Jan ‘10 Feb ‘10 Mar ’10 Q1-10
Total Throughput (t) 715,612 859,251 1,427,405 3,002,268
Average
daily throughput (t/d)
23,854 30,688 46,045 33,358
Peak throughput (t/d) 50,145 53,726 59,747 59,747

28
CONCENTRATE GRADES
28
Lead Conc. Expected (1)
Qu
alit
y
Lead 52 – 58% Pb
Gold 20 – 45 g/t Au
Silver 2,000 – 4,000 g/t Ag
Zinc Conc. Expected (1)
Qu
alit
y
Zinc 52 – 57% Zn
Gold 2 – 5 g/t Au
Silver 300 – 400 g/t Ag
2009 Actual Q1-10 Actual
55.3 58.5
33.3 34.2
4,178 3,876
Zn 7.3% 5.5
2009 Actual Q1-10 Actual
54.8 55.7
4.4 3.6
662 567
Pb 3.3% 2.4
(1) From Analyst Day May 2009
PRODUCTION
29
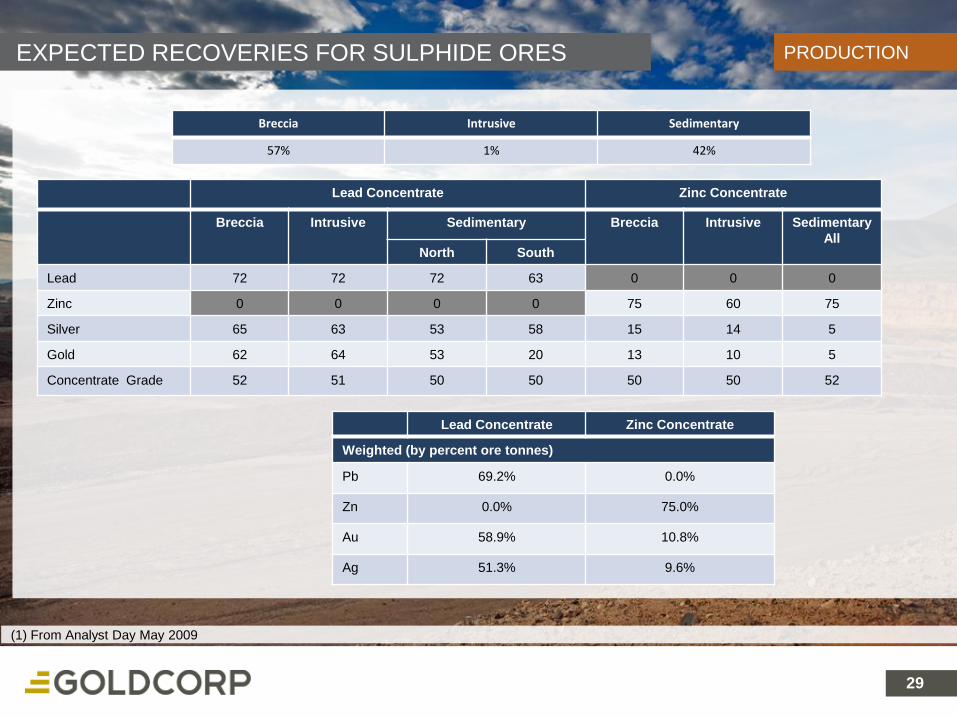
EXPECTED RECOVERIES FOR SULPHIDE ORES
29
Lead Concentrate Zinc Concentrate
Weighted (by percent ore tonnes)
Pb 69.2% 0.0%
Zn 0.0% 75.0%
Au 58.9% 10.8%
Ag 51.3% 9.6%
PRODUCTION
(1) From Analyst Day May 2009
Lead Concentrate Zinc Concentrate
Breccia Intrusive Sedimentary Breccia Intrusive Sedimentary
AllNorth South
Lead 72 72 72 63 0 0 0
Zinc 0 0 0 0 75 60 75
Silver 65 63 53 58 15 14 5
Gold 62 64 53 20 13 10 5
Concentrate Grade 52 51 50 50 50 50 52
Breccia Intrusive Sedimentary
57% 1% 42%
30
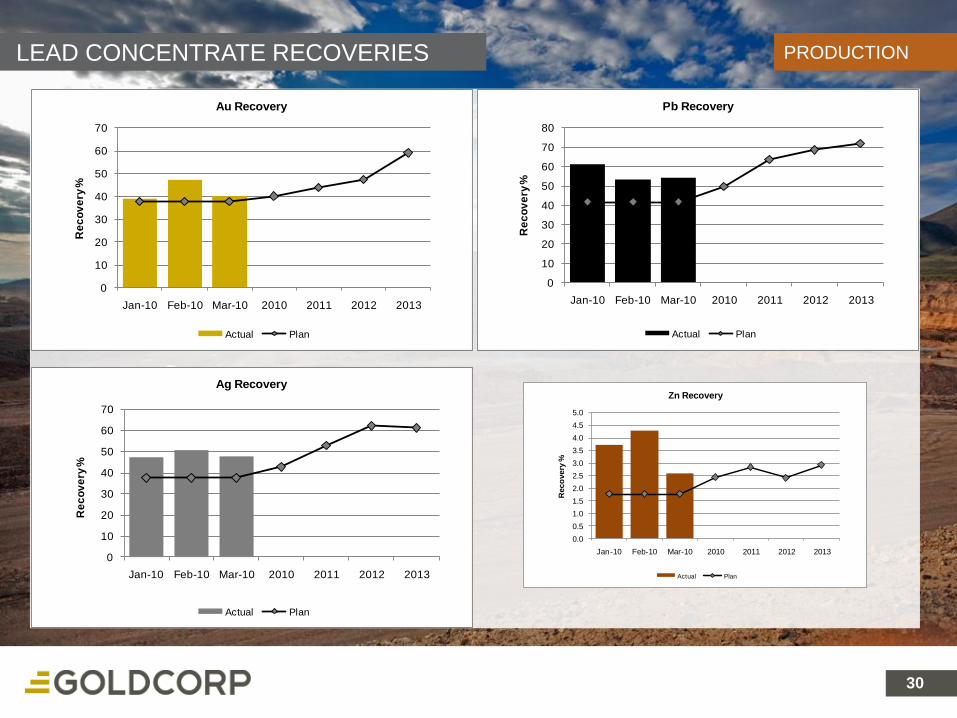
LEAD CONCENTRATE RECOVERIES
30
PRODUCTION
0
10
20
30
40
50
60
70
Jan-10 Feb-10 Mar-10 2010 2011 2012 2013
Re
co
ve
ry %
Au Recovery
Actual Plan
0
10
20
30
40
50
60
70
80
Jan-10 Feb-10 Mar-10 2010 2011 2012 2013
Re
co
ve
ry %
Pb Recovery
Actual Plan
0
10
20
30
40
50
60
70
Jan-10 Feb-10 Mar-10 2010 2011 2012 2013
Re
co
ve
ry %
Ag Recovery
Actual Plan
0.0
0.5
1.0
1.5
2.0
2.5
3.0
3.5
4.0
4.5
5.0
Jan-10 Feb-10 Mar-10 2010 2011 2012 2013
Reco
very
%
Zn Recovery
Actual Plan

31
ZINC CONCENTRATE RECOVERIES
31
PRODUCTION
0
2
4
6
8
10
12
Jan-10 Feb-10 Mar-10 2010 2011 2012 2013
Re
co
ve
ry %
Au Recovery
Actual Plan
0
2
4
6
8
10
12
14
16
Jan-10 Feb-10 Mar-10 2010 2011 2012 2013
Re
co
ve
ry %
Ag Recovery
Actual Plan
0.0
0.5
1.0
1.5
2.0
2.5
3.0
3.5
4.0
4.5
5.0
Jan-10 Feb-10 Mar-10 2010 2011 2012 2013
Re
co
ve
ry %
Pb Recovery
Actual Plan
0
10
20
30
40
50
60
70
80
Jan-10 Feb-10 Mar-10 2010 2011 2012 2013
Re
co
ve
ry %
Zn Recovery
Actual Plan
32
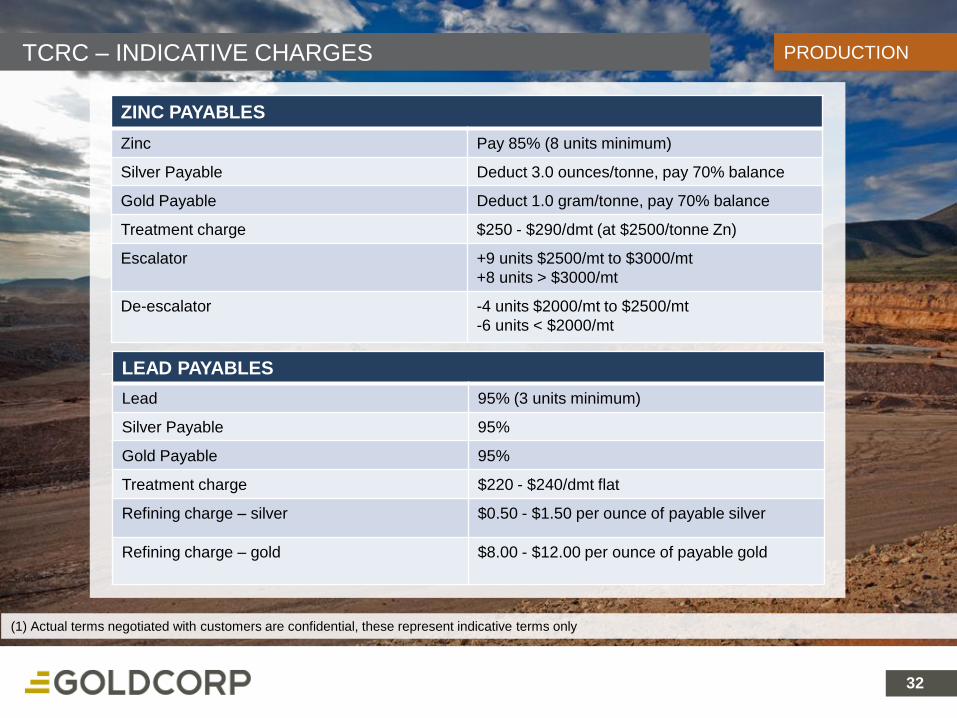
TCRC – INDICATIVE CHARGES
32
ZINC PAYABLES
Zinc Pay 85% (8 units minimum)
Silver Payable Deduct 3.0 ounces/tonne, pay 70% balance
Gold Payable Deduct 1.0 gram/tonne, pay 70% balance
Treatment charge $250 - $290/dmt (at $2500/tonne Zn)
Escalator +9 units $2500/mt to $3000/mt
+8 units > $3000/mt
De-escalator -4 units $2000/mt to $2500/mt
-6 units < $2000/mt
LEAD PAYABLES
Lead 95% (3 units minimum)
Silver Payable 95%
Gold Payable 95%
Treatment charge $220 - $240/dmt flat
Refining charge – silver $0.50 - $1.50 per ounce of payable silver
Refining charge – gold $8.00 - $12.00 per ounce of payable gold
PRODUCTION
(1) Actual terms negotiated with customers are confidential, these represent indicative terms only
33
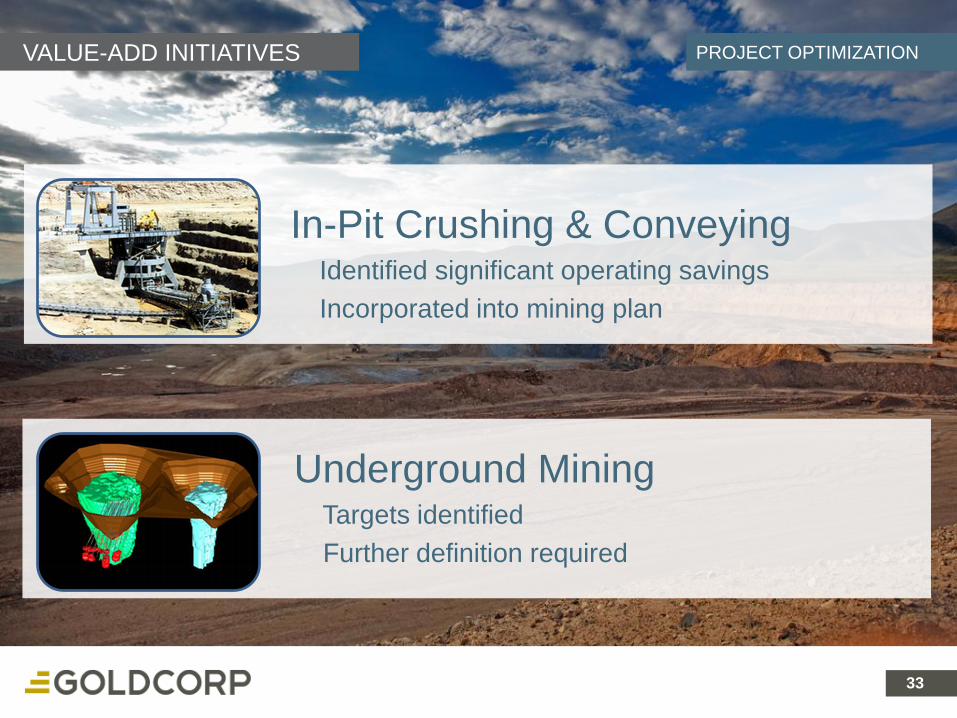
VALUE-ADD INITIATIVES
33
In-Pit Crushing & ConveyingIdentified significant operating savings
Incorporated into mining plan
Underground MiningTargets identified
Further definition required
PROJECT OPTIMIZATION

34
IN-PIT CRUSHING & CONVEYING
34
24 Fewer haul trucks
- Capital savings
Convey 150,000 t/d waste
Lower operating costs increases reserves ~5%
Commence operation 1Q’13- Delivery in 2012
- Arroyo diversion completed
PROJECT OPTIMIZATION
Crusher orders have one year lead-time* Based on $0.55 /litre & $0.08 /kWh
Capital expenditure - $155M

35
IPCC CONVEYOR ROUTE
35
PROJECT OPTIMIZATION
Existing Ore Conveyor
Proposed Conveyor Route
Proposed Waste Dump

36 36
PEÑASQUITO – SW PEÑASCO MANTOS
Peñasco Chile Colorado/Brecha Azul
Mantos
Looking East
PROJECT OPTIMIZATION

37 37
PEÑASQUITO – UNDERGROUND STUDY
Underground Mine Planning
PROJECT OPTIMIZATION

38 38
$16 millionTotal 2010 exploration
investment
EXPLORATION

39 39
PEÑASQUITO REGIONAL TARGETS EXPLORATION

40
NOCHE BUENA: SUPPLEMENTING PEÑASQUITO
40
In-fill drilling and feasibility study
Test bulk and high grade underground resources
Evaluate regional targets
Exploration budget - $6.5 million
EXPLORATION

41
CAMINO ROJO: SUPPLEMENTING PEÑASQUITO
41
3.4 million Au ounces M&I; 0.6 million Au ounces inferred
60.7 million Ag ounces M&I; 7.6 million Ag ounces inferred
Synergies with Peñasquito
Addition of new exploration targets in a core district
EXPLORATION
Exploration budget - $5 million
42 42
ON SCHEDULE, ON BUDGET
SIGNIFICANT UPSIDE REMAINS
DE-RISKING WITH EACH MILESTONE
OPERATIONAL PRODUCTION ACHIEVED
PEÑASQUITO KEY
TAKEAWAYS

43 43
GROWTH LEADER
LOW-COST PRODUCER
OUTSTANDING BALANCE SHEET
LOW POLITICAL RISK
A SUPERIOR INVESTMENT
PROPOSITION

44 44
1. Total cash costs are defined as cost of sales divided by ounces of gold and silver sold or pounds of copper sold. The calculation of totalcash costs per ounce of gold is net of by-product sales revenue (by product copper revenue for Alumbrera; by-product silver revenue forMarlin at market silver prices; and by-product silver revenue for Luismin of $3.95 per silver ounce sold to Silver Wheaton). Goldcorp hasincluded a non-GAAP performance measure, total cash costs per gold ounce, throughout this presentation. Goldcorp reports total cashcosts on a sales basis. In the gold mining industry, this is a common performance measure but does not have any standardizedmeaning, and is a non-GAAP measure. Goldcorp follows the recommendations of the Gold Institute standard. Goldcorp believes that, inaddition to conventional measures, prepared in accordance with GAAP, certain investors use this information to evaluate Goldcorp’sperformance and ability to generate cash flow. Accordingly, it is intended to provide additional information and should not be consideredin isolation or as a substitute for measures of performance prepared in accordance with GAAP
2. All Mineral Reserves and Mineral Resources have been calculated as at December 31, 2009 in accordance with the standards of theCanadian Institute of Mining, Metallurgy and Petroleum and National Instrument 43-101, or the AusIMM JORC equivalent. CautionaryNote to United States Investors Concerning Estimates of Measured, Indicated and Inferred Resources. United States investors areadvised that while such terms are recognized and required by Canadian regulations, the United States Securities and ExchangeCommission does not recognize them. “Inferred Mineral Resources” have a great amount of uncertainty as to their existence, and as totheir economic and legal feasibility. It cannot be assumed that all or any part of an Inferred Mineral Resource will ever be upgraded to ahigher category. Under Canadian rules, estimates of Inferred Mineral Resources may not form the basis of feasibility or other economicstudies. United States investors are cautioned not to assume that all or any part of Goldcorp’s Measured or Indicated Mineral Resourceswill ever be converted into Mineral Reserves. United States investors are also cautioned not to assume that all or any part of an InferredMineral Resource exists, or is economically or legally mineable. Calculations have been prepared by employees of Goldcorp, its jointventure partners or its joint venture operating companies, as applicable, under the supervision of Maryse Belanger, Director TechnicalServices. Reserve calculations incorporate current and/or expected mine plans and cost levels at each property. Varying cut-off gradeshave been used depending on the mine and type of ore contained in the reserves. Goldcorp’s normal data verification procedures havebeen employed in connection with the calculations. For a breakdown of Reserves and Resources by category and for a more detaileddescription of the key assumptions, parameters and methods used in calculating Goldcorp’s Reserves and Resources, see Goldcorp’sAnnual information Form/ Form 40-F on file with Canadian provincial securities regulatory authorities and the U.S. Securities andExchange Commission.
3. Goldcorp’s exploration programs are designed and conducted under the supervision of Charlie Ronkos, Vice President, Exploration ofGoldcorp. For information on geology, exploration activities generally, and drilling and analysis procedures on Goldcorp’s materialproperties, see Goldcorp’s Annual Information Form/Form 40-F on file with Canadian provincial securities regulatory authorities and theU.S. Securities and Exchange Commission.
ENDNOTES
45