Apresentação do PowerPoint · FINANCIAL HIGHLIGHTS For the 3rd consecutive quarter, we...
16
Marfrig Earnings Conference Call August, 2019 2Q19
Transcript of Apresentação do PowerPoint · FINANCIAL HIGHLIGHTS For the 3rd consecutive quarter, we...

MarfrigEarnings Conference Call
August, 2019
2Q19
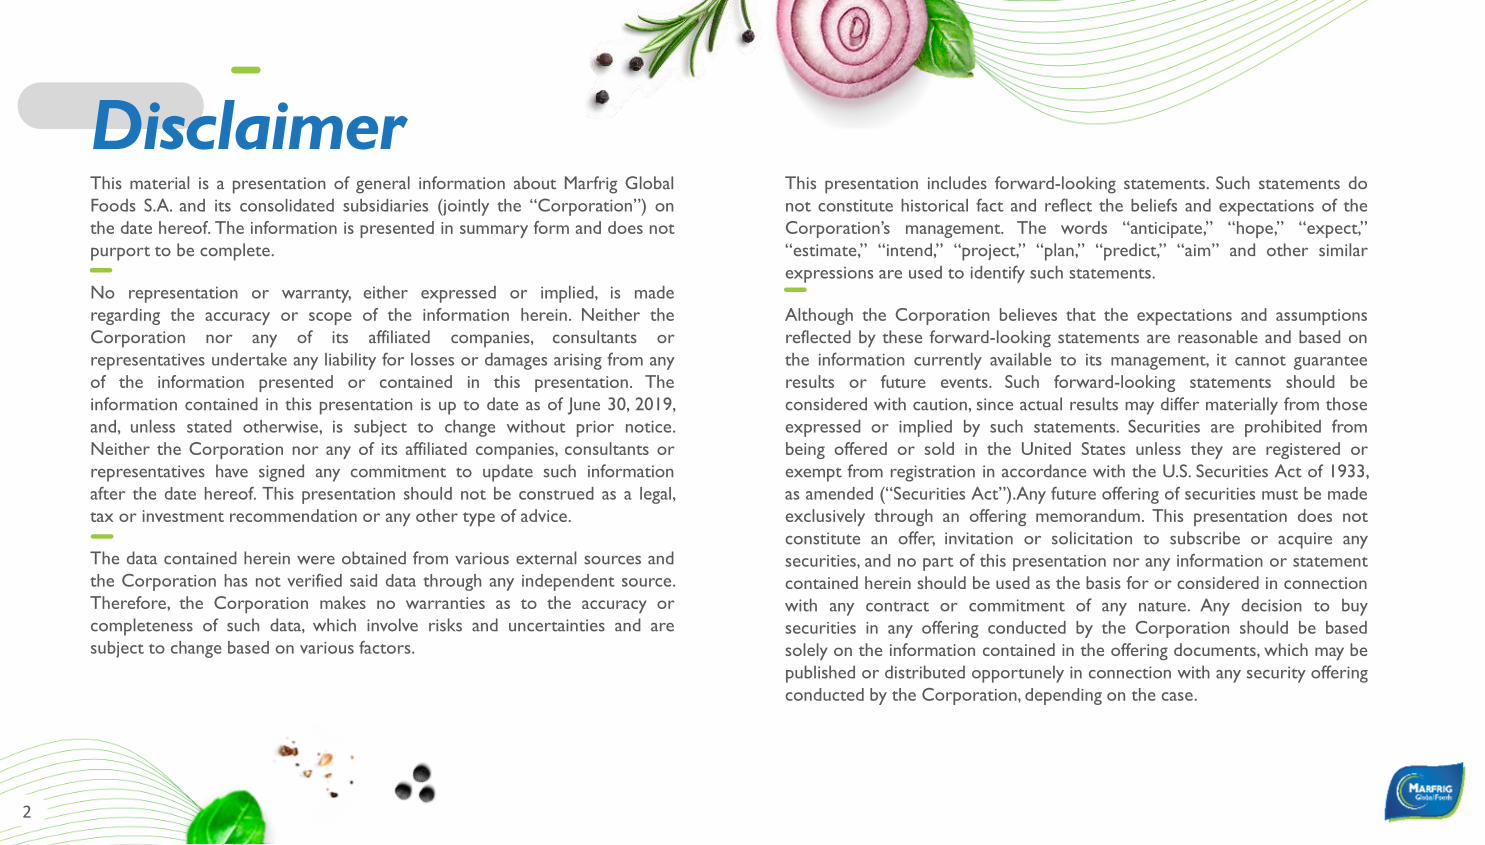
This material is a presentation of general information about Marfrig Global
Foods S.A. and its consolidated subsidiaries (jointly the “Corporation”) on
the date hereof. The information is presented in summary form and does not
purport to be complete.
No representation or warranty, either expressed or implied, is made
regarding the accuracy or scope of the information herein. Neither the
Corporation nor any of its affiliated companies, consultants or
representatives undertake any liability for losses or damages arising from any
of the information presented or contained in this presentation. The
information contained in this presentation is up to date as of June 30, 2019,
and, unless stated otherwise, is subject to change without prior notice.
Neither the Corporation nor any of its affiliated companies, consultants or
representatives have signed any commitment to update such information
after the date hereof. This presentation should not be construed as a legal,
tax or investment recommendation or any other type of advice.
The data contained herein were obtained from various external sources and
the Corporation has not verified said data through any independent source.
Therefore, the Corporation makes no warranties as to the accuracy or
completeness of such data, which involve risks and uncertainties and are
subject to change based on various factors.
DisclaimerThis presentation includes forward-looking statements. Such statements do
not constitute historical fact and reflect the beliefs and expectations of the
Corporation’s management. The words “anticipate,” “hope,” “expect,”
“estimate,” “intend,” “project,” “plan,” “predict,” “aim” and other similar
expressions are used to identify such statements.
Although the Corporation believes that the expectations and assumptions
reflected by these forward-looking statements are reasonable and based on
the information currently available to its management, it cannot guarantee
results or future events. Such forward-looking statements should be
considered with caution, since actual results may differ materially from those
expressed or implied by such statements. Securities are prohibited from
being offered or sold in the United States unless they are registered or
exempt from registration in accordance with the U.S. Securities Act of 1933,
as amended (“Securities Act”).Any future offering of securities must be made
exclusively through an offering memorandum. This presentation does not
constitute an offer, invitation or solicitation to subscribe or acquire any
securities, and no part of this presentation nor any information or statement
contained herein should be used as the basis for or considered in connection
with any contract or commitment of any nature. Any decision to buy
securities in any offering conducted by the Corporation should be based
solely on the information contained in the offering documents, which may be
published or distributed opportunely in connection with any security offering
conducted by the Corporation, depending on the case.
2

FINANCIAL HIGHLIGHTS
❑ For the 3rd consecutive quarter, we achievement net profit. In 2Q19, net income was R$ 86.5 million, compared tothe loss of R$ 582 million in the same period of 2018
❑ Net Revenue of R$ 12.2 billion
❑ Adjusted EBITDA of R$ 1.111 million and margin was 9.1%
❑ Operating Cash Flow of R$ 876 million and Free Cash Flow of R$ 408 million (Cash flow before dividend payments tothird parties and acquisitions)
INVESTMENTS:
Conclusion of Acquisition of Iowa Premium. This operation adds 1,100 head / day to the slaughter capacity of our operation inNorth America, which now totals 13,100 heads/day . The acquisition price was approximately US$ 150 million, where each partnercontributed the amount proportional to their participation (being US$ 75mm to Marfrig).
LIABILITY MANAGEMENT:
❑ We have successfully completed another exercise to reduce the cost of our debt, by issuing US$ 1 billion inbonds maturing in 2026 and coupon 7% p.a., and repurchase part of bonds 2021 and 2023 , with coupons of 11.25%and 8.0% p.a., respectively
2Q19 Highlights
3

Strategic Highlights
44
SUSTAINABILITY:
For the seventh consecutive year, we received the stamp that certifies compliance with the AmazonianLivestock Public Commitment, from independent international consultancy DNV-GL, specializes in business andenvironmental risk analysis.
COMMITMENT TO SUSTAINABLE VALUE GENERATION:
❑ We issue the first “Sustainable Transition Bond” in Brazil. With a value of US$ 500 million, maturingin 2029 and coupon of 6.625% per year, this is the longest and lowest bond rate of the Company. The fundsshould only be used to purchase cattle in the Amazon Biome, producers that meet the environmental andsocioeconomic requirements determined in the operation.
❑ Moreover, this was the first 10-year bond issued by the Company and was placed with the lowestinterest coupon ever. This issue has important significance, because it recognizes the work focusedon sustainability and financial discipline.

• ADM will be responsible for supplying the mainraw material used in the process.
• Marfrig will produce, sell and distribute theproducts for food service and retail. It will alsolaunch its own brand.
• Sales will start to Burger King on 3Q19
Strategic Highlights
5
Agreement with Archer Daniels Midland Company (ADM) to jointly develop plant-based products.
PRODUCTS AND CUSTOMERS:

OPERATIONS’ RESULTS

North America Operating Highlights
❑ Revenue growth was driven by higher domestic volume and average price due to continued growth in demand for beefprotein and the expansion of the Moultrie plant which allowed us to increase our sales to a major supermarket chain.
❑ Gross profit stable compared to same period last year where the increase in the “cutout ratio”¹ from 1.85 in 2Q18 to 1.86in 2Q19 was offset by the loss of carcass yield, due to weather conditions in the main cattle-supplying regions.
71-“cutout ratio” is the average price of beef divided by the average cost of cattle
404 415
69 70
2Q18 2Q19
473 485
2.5%
Volume (thousand tons)
299 2902,200
2Q18 2Q19
2,247
1,901 1,957
2.1%
Net Revenue (US$ Million)
External Market Domestic Market
Gross Profit (US$ Million)
290 288
13.2%
2Q18
12.8%
2Q19
-0.7%
Gross Margin Gross ProfitExternal Market Domestic Market
+3%
+1%
+3%
-3%

Operating Highlights South America
❑ The lower sales volume was due to the lower slaughter level in the quarter. Sales to overseas markets were influenced bystrong demand mainly for China and the Middle East;
❑ The lower gross profit of the operation is explained by the lower sales volume. Margin was impacted by higher cattle costs inBrazil and Uruguay. In Brazil, cattle prices were pressured by exchange variation and higher demand from the foreignmarket. In Uruguay, the cost of cattle is impacted by one of the lower levels of available stock due to live cattle exports andrising Chinese demand. 8
Volume (thousand tons)
3,447
1,648
2Q18 2Q19
3,168
1,520
1,652
1,795
+8.8%
Net Revenue (US$ Million)
External Market Domestic Market
Gross Profit (R$ Milion)
405 395
12.80%
2Q18
11.50%
2Q19
-2.3%
Gross Margin Gross Profit
260 238
95 110
2Q18 2Q19
355 348
-2.0%
External Market Domestic Market
-9%
+16%
+0,3%
+18%

CONSOLIDATED RESULTS 2Q19

Consolidated Highlights
❑ Increase of net revenue, Adjusted EBITDA and margin Adjusted EBITDA 30bps, due to the devaluationof the real associate to sales increase in North America's domestic market and higher volumes for theexport market in South America.
❑ Positive net income for the third consecutive quarter. In 2Q19 we recorded a profit of R$ 87 million,compared to the loss of R$ 582 million in 2Q18, due to the good results of Operation North America.
10
12,241
2Q18 2Q19
11,147
9.8%
Net Revenue (R$ Million)
980
9.1%8.8%
2Q18 2Q19
1,111
13.3%
Adj. EBITDA Margin Adj. EBITDA
Adj. EBITDA (R$ Million)
828 833
2Q18 2Q19
0.6%
Abate (mil cabeças)Volume (thousand tons)
-582
87
2Q18 2Q19
+669
Net Income (R$ Million)
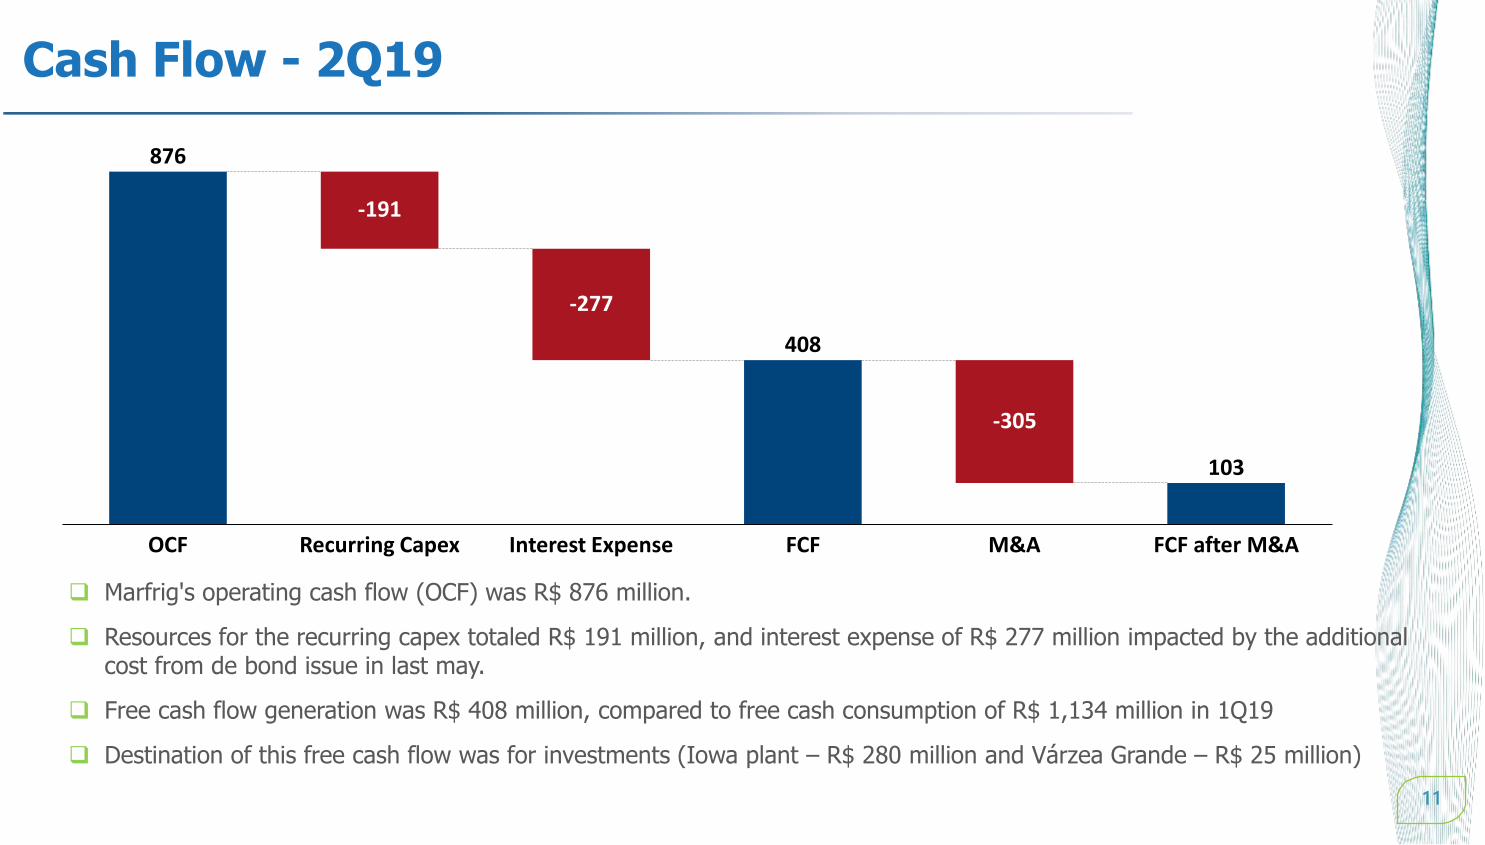
Cash Flow - 2Q19
❑ Marfrig's operating cash flow (OCF) was R$ 876 million.
❑ Resources for the recurring capex totaled R$ 191 million, and interest expense of R$ 277 million impacted by the additional cost from de bond issue in last may.
❑ Free cash flow generation was R$ 408 million, compared to free cash consumption of R$ 1,134 million in 1Q19
❑ Destination of this free cash flow was for investments (Iowa plant – R$ 280 million and Várzea Grande – R$ 25 million)
11
876
408
103
FCF after M&A
-305
OCF
-191
Recurring Capex
-277
FCFInterest Expense M&A

Debt and Leverage - 2Q19
1Q19
2.762.65
2Q19
3,507 3,810+8.6%
Adj. EBITDA (R$ Million) and Leverage
Long Term Debt Structure and Cost Reduction Actions
❑ Net debt was $ 2,639 million, 6% higher than 1Q19, mainly explained by the payment of dividends to third parties ofUS$ 151 million and the investment of approximately $ 75 million to acquire Iowa Premium, partially offset by freecash flow (R$ 408 million)
❑ With the improvement in adjusted EBITDA, due to the growing improvement of the business, leverage dropped againto 2.65x
❑ Cost Reduction and Increased Average Debt Term occurred due to the funding of US$ 1 billion with coupon of 7% p.a.and maturity in 2026 and partial refinancing of bonds 2021 and 2023 , with coupons of 11.25% and 8.0% p.a.respectively. 12
DEBT PROFILE 1Q19 2Q19
Gross Debt (US $ Million) 4,181 4,319
Cash (US $ Millions) 1,694 1,680
Net Debt (US $ Million) 2,487 2,639
Average Cost (% YoY) 6.94 6.73
Average term (years) 3.65 4.49
Leverage (Net Debt/Adj. EBITDA) 2,76x 2,65x
13
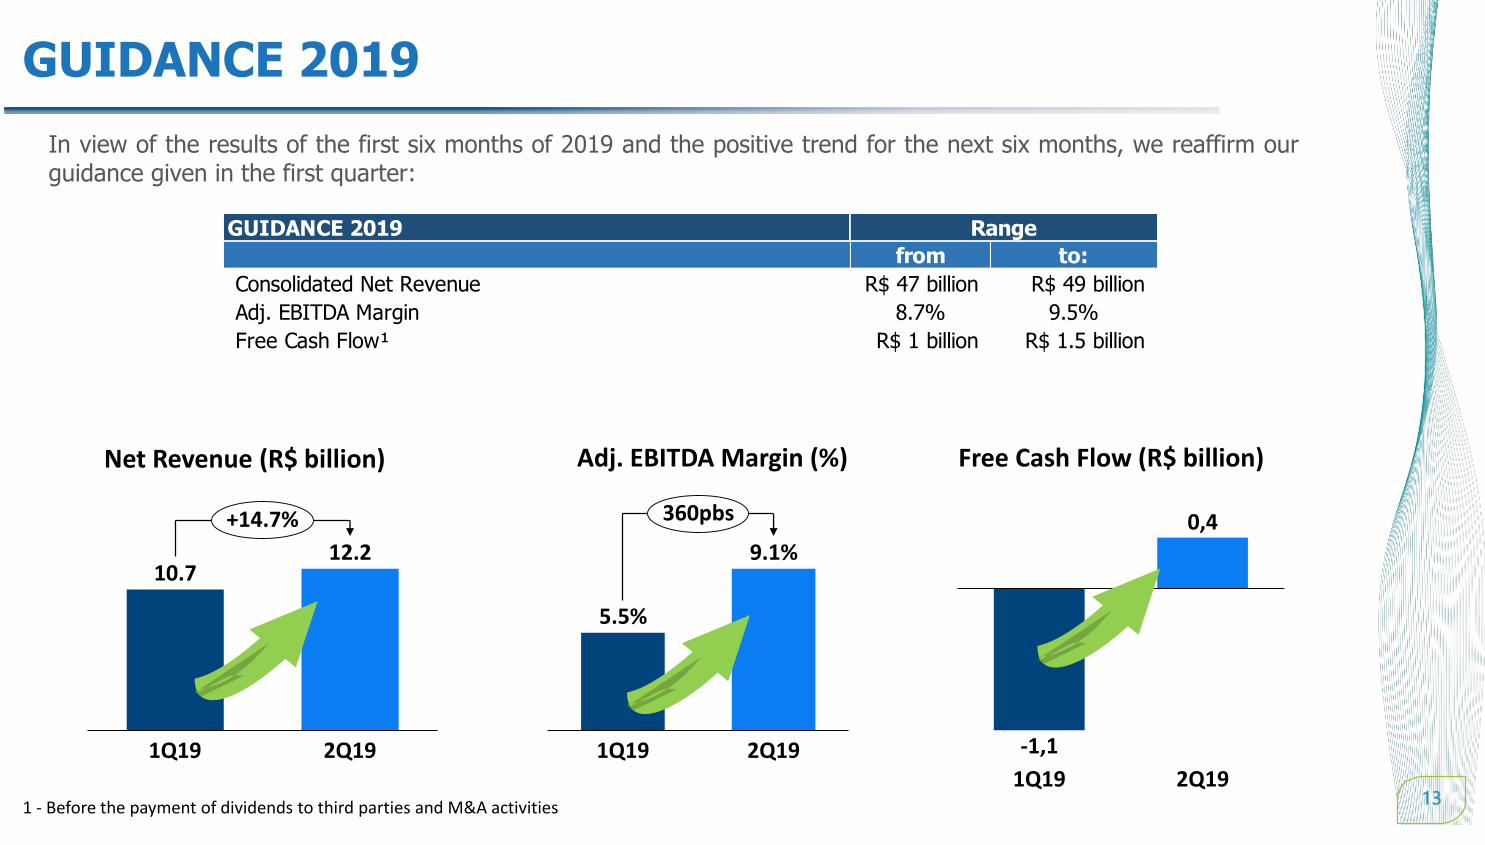
GUIDANCE 2019
13
In view of the results of the first six months of 2019 and the positive trend for the next six months, we reaffirm ourguidance given in the first quarter:
10.7
1Q19 2Q19
12.2
+14.7%
5.5%
1Q19
9.1%
2Q19
360pbs
-1,1
0,4
1Q19 2Q19
Net Revenue (R$ billion) Adj. EBITDA Margin (%) Free Cash Flow (R$ billion)
1 - Before the payment of dividends to third parties and M&A activities
GUIDANCE 2019
from to:
Consolidated Net Revenue R$ 47 billion R$ 49 billion
Adj. EBITDA Margin 8.7% 9.5%
Free Cash Flow¹ R$ 1 billion R$ 1.5 billion
Range

FINAL REMARKS

15
Final considerations
Sustainability
Financial
StrengthCorporate
Governance
Operational
Excellence
Sustainable Value
Generation
Products and
Customers
Operational
Excellence
Corporate
Governance
Customers
and Products
Financial
Strength
Sustainability
• DNV-GL stamp for the seventh consecutive year without notes in the cattle
buying auditorium
• Issue of the 1st sustainable bond in Brazil;
• Partnership with Embrapa
• Launch of the vegetable based hamburger line;
• Burger King Supply Agreement
• Optimization of commercial areas between operations;
• Turn-around in Argentina's assets - Quickfood;
• Restructuring of the Várzea Grande Complex
• 3rd consecutive quarter generating profit;
• Significant improvement in cash flow;
• Low leverage
• Review and approval of new corporate governance policies;
• Creation of the sustainability committee.

Investor
Relations
www.marfrig.br/ir