Apresentação 1Q13 EN
42
Earnings Results 1 1 Earnings Results 1Q13
-
Upload
generalshoppingriweb -
Category
Economy & Finance
-
view
96 -
download
1
Transcript of Apresentação 1Q13 EN
Earnings Results
11
Earnings Results 1Q13

Disclaimer
This presentation contains statements that are forward-looking within the meaning of Section 27A of theSecurities Act of 1933 and Section 21E of the Securities Exchange Act of 1934. Such forward-lookingg gstatements are only predictions and are not guarantees of future performance. Investors are cautionedthat any such forward-looking statements are and will be, as the case may be, subject to many risks,uncertainties and factors relating to the operations and business environments of General Shoppingand its subsidiaries that may cause the actual results of the companies to be materially different fromany future results expressed or implied in such forward-looking statements.
This material is published solely for informational purposes and is not to be construed as a solicitation oran offer to buy or sell any securities or related financial instruments and should not be treated as givinginvestment advice It is not targeted to the specific investment objectives financial situation orinvestment advice. It is not targeted to the specific investment objectives, financial situation orparticular needs of any recipient. No representation or warranty, either express or implied, is provided inrelation to the accuracy, completeness or reliability of the information contained herein. This materialshould not be regarded by recipients as a substitute for the exercise of their own judgment.
Any opinions expressed in this material are expressed as of this date and subject to change withoutnotice and General Shopping is not under the obligation to update or keep current the informationcontained herein. General Shopping and the respective affiliates, directors, partners and employeesaccept no liability whatsoever for any loss or damage of any kind arising out of the use of all or any partp y y g y g y pof this material. You should consult with your own legal, regulatory, tax, business, investment, financialand accounting advisers to the extent that you deem it necessary, and make your own investment,hedging and trading decision (including decisions regarding the suitability of this transaction) basedupon your own judgment and advice from such advisers as you deem necessary and not upon any
222
views expressed in this material.

Agenda
Sector Overview
Company OverviewCompany Overview
Financial Performance
333
Sector Overview
44
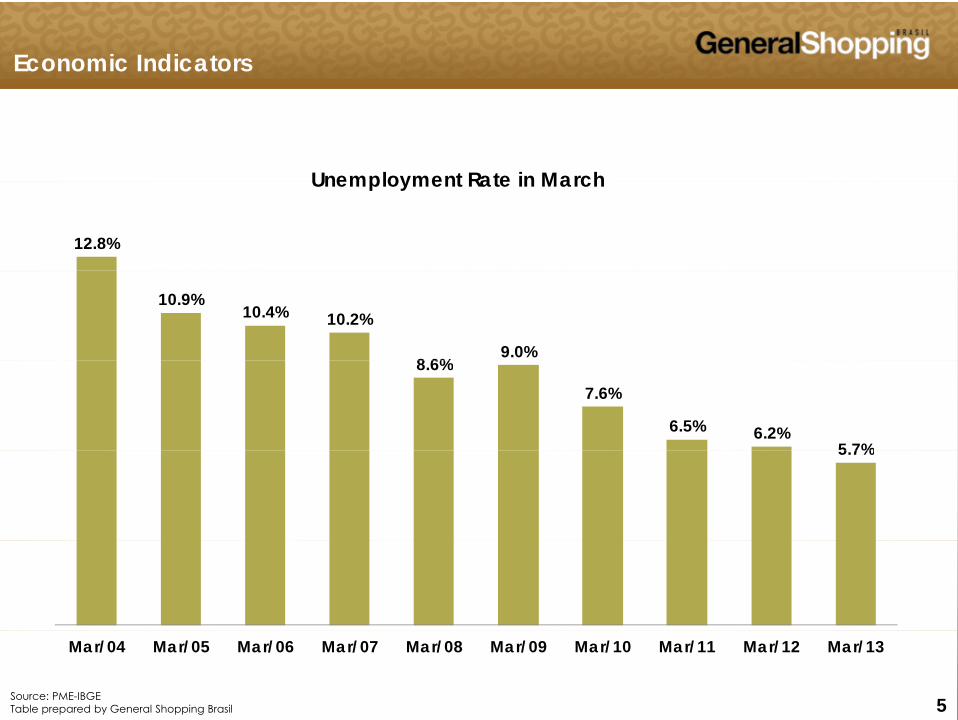
Economic Indicators
Unemployment Rate in March
12.8%
Unemployment Rate in March
10.9%10.4% 10.2%
8 6%9.0%
8.6%7.6%
6.5% 6.2%5 7%5.7%
555
Mar/04 Mar/05 Mar/06 Mar/07 Mar/08 Mar/09 Mar/10 Mar/11 Mar/12 Mar/13
Source: PME-IBGETable prepared by General Shopping Brasil

Economic Indicators
Real Income of the Employed Population¹
36 0
38.7 39.5
R$ billion
28 930.6
31.733.6
36.0
24.4 25.326.5
28.9
Mar/04 Mar/05 Mar/06 Mar/07 Mar/08 Mar/09 Mar/10 Mar/11 Mar/12 Mar/13
666
Mar/04 Mar/05 Mar/06 Mar/07 Mar/08 Mar/09 Mar/10 Mar/11 Mar/12 Mar/13
Source: PME-IBGE; Table prepared by General Shopping Brasil(1)Based on the employed population and their average income

Credit Performance
Credit Volume – Individuals
Volume and Monthly Change
660
690
720
750
24%
26%
(t-12) R$ billion
540
570
600
630
660
20%
22%
420
450
480
510
14%
16%
18%
300
330
360
390
10%
12%
777Source: Central BankTable prepared by General Shopping Brasil

Credit Performance
Default RateIndividuals and General
8.07.7
7.47.9
General Individuals
5.7
888Source: Central BankTable prepared by General Shopping Brasil

Economic Indicators
Consumer Confidence IndexIndex - Quarterly Moving Average
125
130
110
115
120
90
95
100
105
80
85
90
999Source: Fundação Getulio Vargas - FGVTable prepared by General Shopping Brasil

Retail Performance
Sales Volume - Monthly change (%)As compared with same year-ago period
15.7
12.5
4.04.5
1.3
101010Source: PMC-IBGETable prepared by General Shopping Brasil

Retail Growth
Retail Industry: Monthly Change (VS Same Year-Ago Period) of Sales Volume (Jan/11-Mar/13)
515253545
Total ‐ RetailBooks, newspapers, magazines and
stationeryOffice supplies and equipment, personal
computer and telecomOther personal and domestic products
Jan‐11 8.3 12.5 7.4 4.9
Feb‐11 8.5 14.9 14.8 12.5
‐25‐15‐55
Feb 11 8.5 14.9 14.8 12.5
Mar‐11 4.0 ‐1.2 4.2 4.6
Apr‐11 10.2 5.8 ‐0.8 12.1
May‐11 6.3 8.3 23.2 3.3
Jun‐11 7.1 9.0 34.7 3.2
Jul‐11 7.1 6.8 16.2 2.9
Aug‐11 6.3 5.2 26.3 1.7
Sep‐11 5.2 2.7 7.6 ‐0.1
Oct‐11 4.2 4.4 28.8 0.5
Nov‐11 6.7 5.5 24.7 2.6
Dec‐11 6.7 ‐2.3 34.8 3.4
Jan‐12 7 8 9 8 32 9 13 1Jan‐12 7.8 9.8 32.9 13.1
Feb‐12 10.6 ‐0.2 33.5 5.0
Mar‐12 12.5 4.9 27.3 9.5
Apr‐12 6.0 ‐4.0 33.2 2.6
May‐12 8.3 2.0 17.2 8.2
Jun‐12 9.4 9.5 ‐18.5 6.6
Jul‐12 7.2 6.3 11.3 6.4
Aug‐12 10.0 4.8 11.1 10.6
Sep‐12 8.5 4.1 ‐0.4 7.5
Oct‐12 9.2 11.1 16.1 13.6
Nov‐12 8.5 11.2 ‐0.8 18.5
D 12 5 1 4 9 23 3 10 0
111111Source: Brazilian Institute of Geography and Statistics (IBGE)Table prepared by General Shopping Brasil
Dec‐12 5.1 4.9 ‐23.3 10.0
Jan‐13 5.9 5.4 8.8 13.9
Feb‐13 ‐0.3 6.9 5.3 6.3
Mar‐13 4.5 3.9 ‐2.2 14.9

Retail Growth
10152025
Retail Industry: Monthly Change (VS Same Year-Ago Period) of Sales Volume (Jan/11-Mar/13)
Total ‐ Retail Supermarkets and hypermarkets Fabrics, clothing and footwearFurniture and white/durable
goodsPharmaceutical, medical, orthopedic and cosmetics
Jan‐11 8.3 4.2 9.8 19.1 12.7
Feb‐11 8.5 2.7 14.2 20.3 10.6
‐505
8.5 2.7 14.2 20.3 10.6
Mar‐11 4.0 1.4 5.7 11.2 5.3
Apr‐11 10.2 10.6 1.5 19.3 10.5
May‐11 6.3 1.9 5.6 20.4 12.0
Jun‐11 7.1 2.7 11.3 16.4 12.8
Jul‐11 7.1 4.6 1.4 21.1 10.4
Aug‐11 6.3 3.9 0.8 16.9 9.5
Sep‐11 5.2 3.5 0.7 16.0 10.9
Oct‐11 4.2 2.3 ‐2.2 13.1 7.5
Nov‐11 6.7 6.2 0.4 12.3 8.4
Dec‐11 6.7 4.6 0.8 15.3 7.0
Jan‐12 7 8 8 5 1 5 13 2 8 6Jan‐12 7.8 8.5 1.5 13.2 8.6
Feb‐12 10.6 13.3 ‐3.2 13.5 9.5
Mar‐12 12.5 12.4 4.3 20.9 14.2
Apr‐12 6.0 3.6 ‐1.4 12.5 9.3
May‐12 8.3 8.8 4.0 9.3 12.3
Jun‐12 9.4 11.1 0.6 15.6 11.3
Jul‐12 7.2 5.0 5.7 12.6 11.4
Aug‐12 10.0 8.5 8.4 15.3 12.8
Sep‐12 8.5 9.9 5.4 6.2 8.2
Oct‐12 9.2 6.6 4.5 13.8 13.0
Nov‐12 8.5 8.3 6.5 8.5 9.6
Dec 12 5 1 6 6 3 2 9 0 3 6
121212
Dec‐12 5.1 6.6 3.2 9.0 3.6
Jan‐13 5.9 3.4 5.0 5.8 10.4
Feb‐13 ‐0.3 ‐2.1 ‐1.0 ‐1.0 6.9
Mar‐13 4.5 4.0 5.9 ‐0.8 4.7Source: Brazilian Institute of Geography and Statistics (IBGE)Table prepared by General Shopping Brasil
Company Overview
1313

Differentials
Market-driven company with retail approach
B and C consumption classes as target market
Innovative complementary services
Majority ownership: 81.5% average interestj g
141414

General Shopping Brasil
Poli Shopping Guarulhos 50.0% 4,527 2,264 15,400Internacional Shopping 100.0% 75,958 75,958 -
Own GLAExpansion (m2)
Shopping Center Interest Total GLA(m²)
Own GLA(m²)
Auto Shopping 100.0% 11,477 11,477 -Shopping Light 85.0% 14,140 12,019 -Santana Parque Shopping 50.0% 26,538 13,269 -Suzano Shopping 100.0% 19,583 19,583 -Cascavel JL Shopping 85 5% 8 877 7 590 2 953Cascavel JL Shopping 85.5% 8,877 7,590 2,953Top Center Shopping 100.0% 6,369 6,369 -Parque Shopping Prudente 100.0% 15,148 15,148 -Poli Shopping Osasco 100.0% 3,218 3,218 -Shopping do Vale 84.4% 16,487 13,913 -S opp g do a e 8 . % 6, 87 3,9 3 Unimart Shopping Campinas 100.0% 14,961 14,961 -Outlet Premium São Paulo 50.0% 17,716 8,858 -Parque Shopping Barueri 48.0% 37,420 17,962 -Outlet Premium Brasília 50.0% 16,094 8,047 -Shopping Bonsucesso 100.0% 24,437 24,437 -
81.5% 312,950 255,073 18,353
Greenfield Interest Total GLA(m²)
Own GLA(m²)
Parque Shopping Sulacap 51.0% 29,932 15,265 Outlet Premium Salvador* 98.0% 27,000 26,460 Outlet Premium Rio de Janeiro* 98.0% 32,000 31,360 Convention Center 100.0% 25,730 25,730 P Sh i M i 96 5% 30 492 29 425
( ) ( )
151515
Parque Shopping Maia 96.5% 30,492 29,425 Parque Shopping Atibaia 100.0% 24,043 24,043
90.0% 169,197 152,283(*) Company may sell up to 48% of the project to BR Partners Fund.
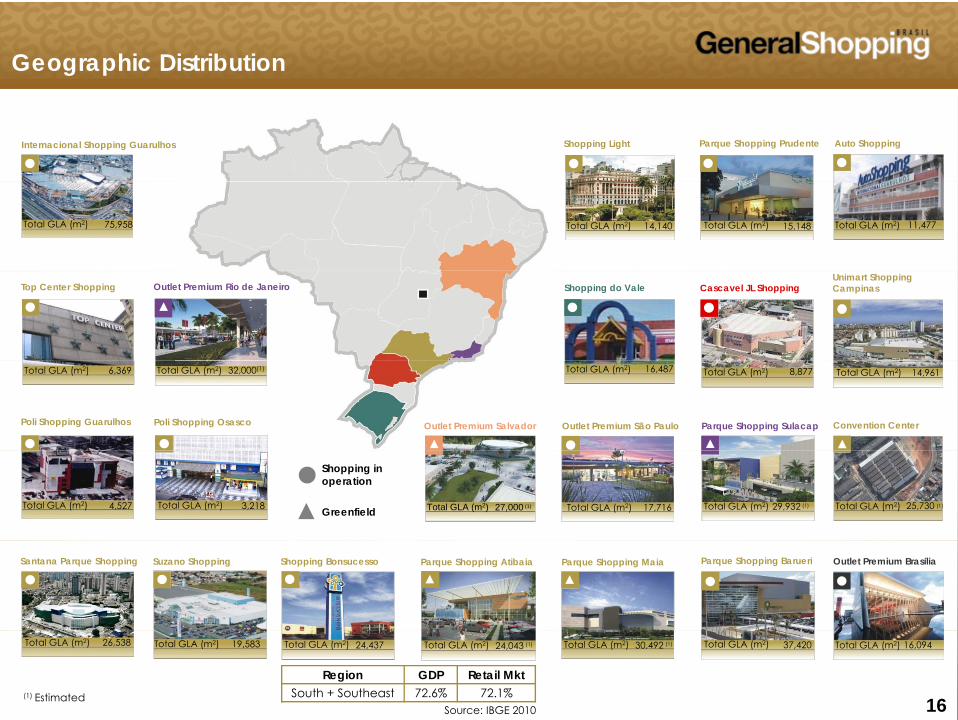
Geographic Distribution
Internacional Shopping Guarulhos Shopping Light Parque Shopping Prudente Auto Shopping
8
15,148Total GLA (m2) Total GLA (m2) 11,47775,958Total GLA (m2) 14,140Total GLA (m2)
Top Center Shopping Shopping do Vale Cascavel JL ShoppingUnimart Shopping CampinasOutlet Premium Rio de Janeiro
Poli Shopping Guarulhos Poli Shopping Osasco Outlet Premium São Paulo Convention Center
16,487Total GLA (m2) 8,877Total GLA (m2)6,369Total GLA (m2)
Outlet Premium Salvador
32,000(1)Total GLA (m2) 14,961Total GLA (m2)
Parque Shopping Sulacap
Greenfield
Shopping inoperation
25,730Total GLA (m2)4,527Total GLA (m2) 3,218Total GLA (m2) (1)27,000 (1)Total GLA (m2) 29,932 (1)Total GLA (m2)17,716Total GLA (m2)
Santana Parque Shopping Suzano Shopping Outlet Premium BrasíliaParque Shopping Maia Parque Shopping BarueriParque Shopping AtibaiaShopping Bonsucesso
161616
26,538Total GLA (m2) 19,583Total GLA (m2) 16,094 Total GLA (m2)
(1) EstimatedSource: IBGE 2010
30,492 (1)Total GLA (m2)
Region GDP Retail MktSouth + Southeast 72.6% 72.1%
24,437 Total GLA (m2) (1)24,043Total GLA (m2) 37,420 Total GLA (m2)

Geographic Distribution
GDP(1) Number of Shopping Centers(2)
4%13%
9%
5%14%
9%
R$ 202 billionR$ 508 billionR$ 351 billion
186041 9%
56%
18%
9%55%
17%
R$ 2,088 billionR$ 622 billion
Total GDP: R$ 3,770 billion Total Number of Shopping Centers: 455
25482
Retail Sales(1) GLA(2)
g
R$ 74 billionR$ 314 billionR$ 181 billion
4%15%
3%15%
400,211 m²1,660,728 m²
859,200 m²R$ 181 billionR$ 1,062 billionR$ 402 billion
9%52%
20%
8%59%
15%
859,200 m6,586,741 m²1,660,242 m²
171717(1) Source: IBGE 2010(2) Source: ABRASCE – December 2012
Total Retail Sales: R$ 2,033 billion Total GLA: 11,167,122 m²
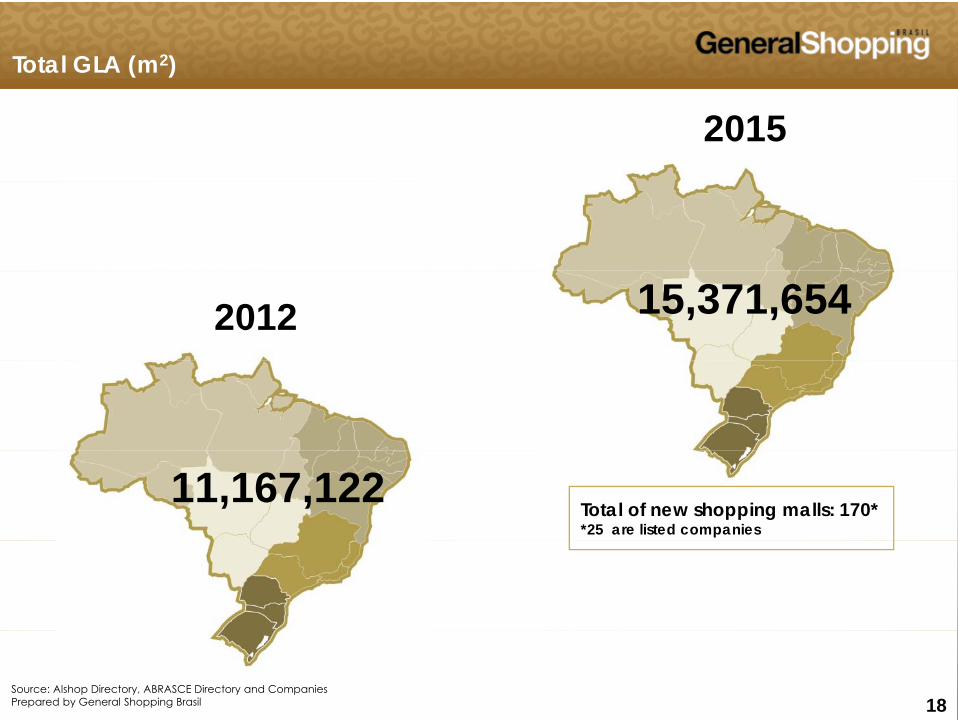
Total GLA (m2)
2015
15,371,6542012
11,167,122Total of new shopping malls: 170**25 are listed companies
181818Source: Alshop Directory, ABRASCE Directory and CompaniesPrepared by General Shopping Brasil

Portfolio
Total GLA Evolution (m2)
188,051 501,001
50,131
98,822 19,69617,919
37,420PreIPO
88,962
191919Dec/06 Dec/07 Dec/08 Dec/09 Dec/11 Dec/12 2013/2014 TOTAL GLA

Diversified Growth Strategy
Consolidation Own GLA(1)Own GLA(1)
Shopping center acquisitions
Greenfields Concluded G fi ld
Greenfields d D l t
31.9%
35 3%
Concept and development of new shopping centers
Expansions
Greenfieldsunder Development
23.9%
8.9%
35.3%Expansions
Interest stake increase in assets GLA expansion of the original portfolio Implementation of mixed use projects Acquisitions8.9% Implementation of mixed-use projects
Synergies + Profitability
Turnaround
Acquisitions
Expansions
Turnaround
Remodeling and retrofit of tenant mix Innovation in complementary services
202020(1) Considering current shopping centers, expansions and announced greenfields.

Outlet Premium Salvador - Greenfield
Outlet Premium Salvador
Type: Outlet
Stake: 98%
Influence area (inhabitants): super-regional
Description: Third Outlet in the country with forecast to open in 2013.
Located next to Salvador, the biggest city in northeastern states, on
the road to the tourism resortsthe road to the tourism resorts.
212121

Outlet Premium Salvador - Greenfield
222222

Outlet Premium Rio de Janeiro - Greenfield
Outlet Premium Rio de Janeiro
Type: Outlet
Stake: 98 %
Infl ence area: s per regionalInfluence area: super-regional
Description: Fourth outlet in the country. Located next to the city of Rio
de Janeiro, with easy access from the city of Rio de Janeiro, mountain de Janeiro, with easy access from the city of Rio de Janeiro, mountain
cities, Santos Dumont and Galeão airports and close to the future
metropolitan beltway.
232323

Outlet Premium Rio de Janeiro - Greenfield
242424

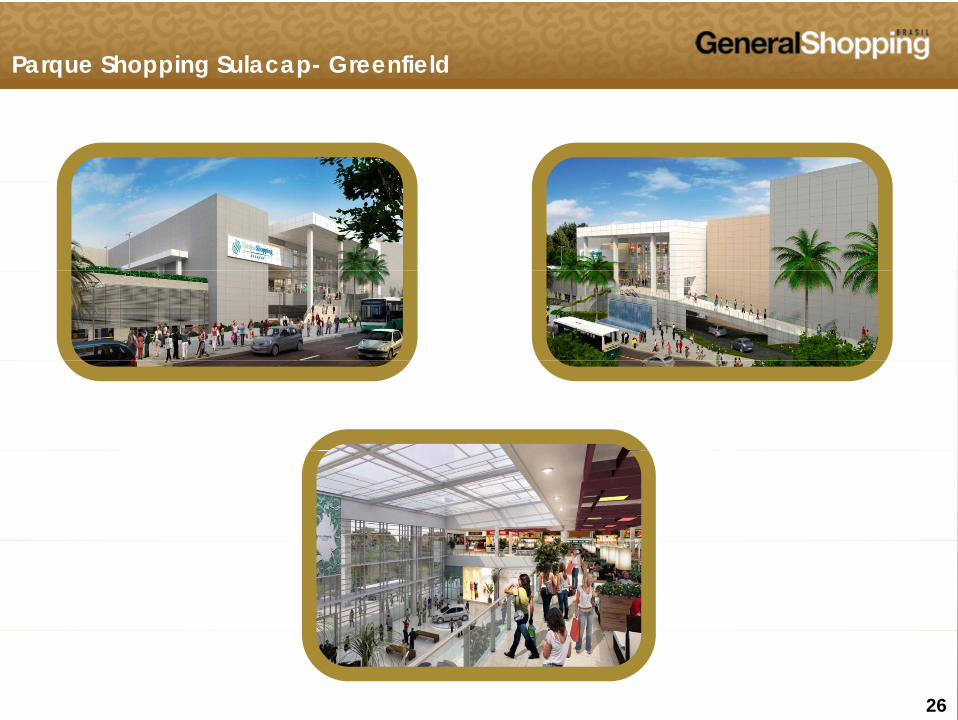
Parque Shopping Sulacap- Greenfield
Parque Shopping Sulacap
Type: Neighborhood
Stake: 51%
Total GLA: 29 932 m2Total GLA: 29,932 m2
% of B and C classes: 78%
Influence area: 670 thousand peopleInfluence area: 670 thousand people
252525
Parque Shopping Sulacap- Greenfield
262626

Parque Shopping Maia- Greenfield
Parque Shopping Maia
Type: Neighborhood
Stake: 96,5%
Total GLA: 30 492 m2Total GLA: 30,492 m2
Social Classes: A, B and C
Overall Population (within 5Km): 737 thousand peopleOverall Population (within 5Km): 737 thousand people
272727

Parque Shopping Maia- Greenfield
282828

Increasing Complementary Services Activities
Management Parking Water Energy
ISG Auto
AtlasAuto Poli
Light Stake HeldR ibl f l i th
Santana *
Cascavel
Suzano Energy100%
► Responsible for planning the energy supply and leasing of the equipment for its transmission and distribution
► Engaged in water supply Cascavel Prudente
Parque Poli Shopping
Osasco
Wass
I Park
100%
100%
► Engaged in water supply planning and its treatment and distribution
► Controls and manages
Top Center Do Vale Unimart
C i
I Park
GSB Adm
100%
100%
parking lots
► Manages operations of shopping centers
Campinas Outlet Premium
São Paulo Parque Shopping
Barueri ASG Adm100%
pp g
► Manages the operations of Auto Shopping
292929
Outlet PremiumBrasília
Services currently provided to the mall Potential services / currently being implemented * Partial
ShoppingBonsucesso

Stock Performance
Stock Performance(Basis 100 – DEC 31, 2008)
R$ 11.15*391.2%*
500550600650700
54,936*46.3%*200
250300350400450500
050
100150200
ec‐08
an‐09
eb‐09
ar‐09
pr‐09
ay‐09
un‐09
ul‐09
ug‐09
ep‐09
ct‐09
ov‐09
ec‐09
an‐10
eb‐10
ar‐10
pr‐10
ay‐10
un‐10
ul‐10
ug‐10
ep‐10
ct‐10
ov‐10
ec‐10
an‐11
eb‐11
ar‐11
pr‐11
ay‐11
un‐11
ul‐11
ug‐11
ep‐11
ct‐11
ov‐11
ec‐11
an‐12
eb‐12
ar‐12
pr‐12
ay‐12
un‐12
ul‐12
ug‐12
ep‐12
ct‐12
ov‐12
ec‐12
an‐13
eb‐13
ar‐13
pr‐13
De Ja Fe Ma
Ap
Ma Ju Ju Au Se Oc
No De Ja Fe Ma
Ap
Ma Ju Ju Au Se Oc
No De Ja Fe Ma
Ap
Ma Ju Ju Au Se Oc
No De Ja Fe Ma
Ap
Ma Ju Ju Au Se Oc
No De Ja Fe Ma
Ap
GSHP3 Ibovespa
303030(*) In MAY 15, 2013Until MAR 28, 2013: GSHP3 = 455.1%
Ibovespa = 48.9%

Liquidity
GSHP312,625
13,164
13,391
13,561 Volume (R$ thousand)
1 1051,886
6,263 5,254
3,911 3,236 3,077
5,945
8,196
6,569
5,864 6,660
278,611
574 712 568 809 1,105 4,545
Hiring of newMarket Maker
XP I ti t
64,685 91,672
65,527 66,365 59,840
102,614
64,746
150,268
92,470
156,813
122,759
58,566
86,804
XP Investimentos
22,902 13,294 4,231 6,394 17,971
42,790 59,840 58,566
45,608
1Q08 2Q08 3Q08 4Q08 1Q09 2Q09 3Q09 4Q09 1Q10 2Q10 3Q10 4Q10 1Q11 2Q11 3Q11 4Q11 1Q12 2Q12 3Q12 4Q12 1Q13
313131
Trading Volume Number of Trades

Shareholders
Nr. Shares Type of investor (*)
40.6%
Nr. Shares Type of investor Controlling shareholder 30,000,000 -
55.4% - Brazilian59.4%
55.4% Brazilian
41.6% - Foreign
3.0% - Individual
Free float 20,480,600
Free float Controlling shareholder
Total 50,480,600 -
Market-making activities (through broker XP Investimentos) since October/10
Listed since July 2007
Market-making activities (through broker XP Investimentos) since October/10
323232(*) Position as of May 10, 2013

Financial Performance
3333

Gross Revenue – R$ million
RENTAL REVENUE BREAKDOWN - 1Q13
5 3%TOTAL GROSS REVENUE
54.5 33.3% 9.7%
3.9%6.8%
5.3%
8.9
13.2 40.9
49.2% 74.3%
Minimum Rent Percentage on Sales
32.0 41.3
28.9%
SERVICES REVENUE BREAKDOWN 1Q13
Key Money AdvertisingStraight-lining Revenue
1Q12 1Q13
Rent Services
SERVICES REVENUE BREAKDOWN - 1Q13
10.5%
12.1%
68.7%
8.7%
343434
Parking Energy Water Management

Performance
Description 1Q12 1Q13 Chg %
A GLA ( 2) 212 989 255 073 19 8%
GSB (Total)
Average GLA (m2) 212,989 255,073 19.8%
Rent (R$/m2) 150.36 161.89 7.7%Services (R$/m2) 41.71 51.96 24.7%
Total (R$/m2) 192.07 213.85 11.3%
353535
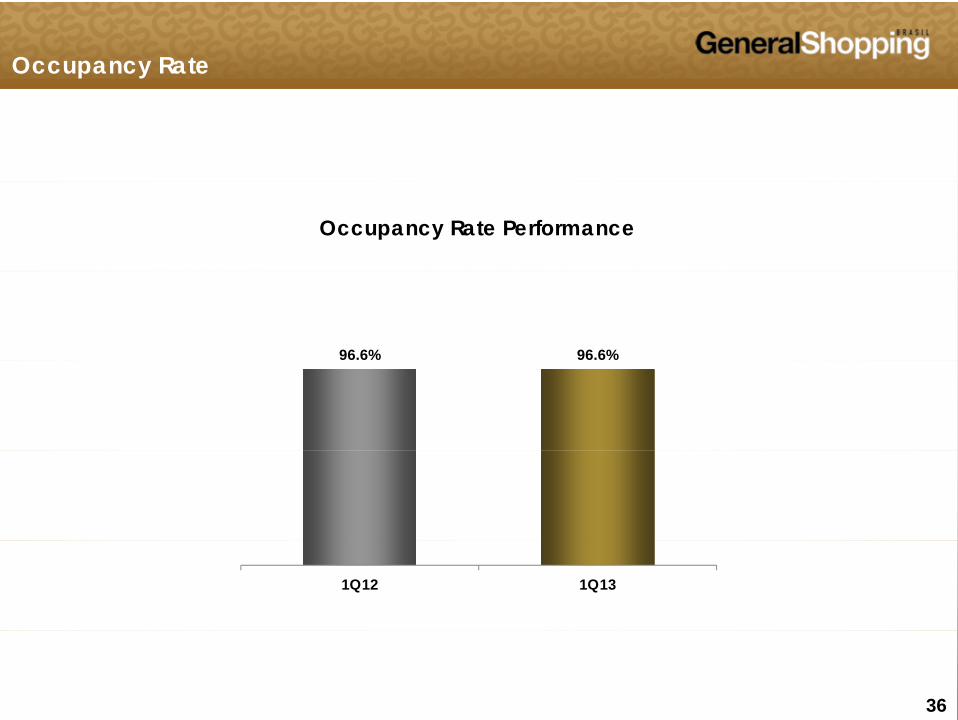
Occupancy Rate
Occupancy Rate Performance
96.6% 96.6%
1Q12 1Q13
363636

Services Revenue – R$ million
1st Quarter
Parking Energy Water Management Total1Q12 6 2 1 0 1 0 0 7 8 9 1Q12 6.2 1.0 1.0 0.7 8.9 1Q13 9.1 1.2 1.4 1.6 13.3
373737

Performance Indicators – R$ million
70.4% 69.0%
Adjusted EBITDA and Margin
88.0% 87.2%
NOI Consolidated and Margin
34 430.0% 28.6%
26.8
34.4
33.543.5
Adjusted FFOAdjusted Net Result
1Q12 1Q131Q12 1Q13
10.86.8
-7.3
383838-1.2
1Q12 1Q131Q12 1Q13
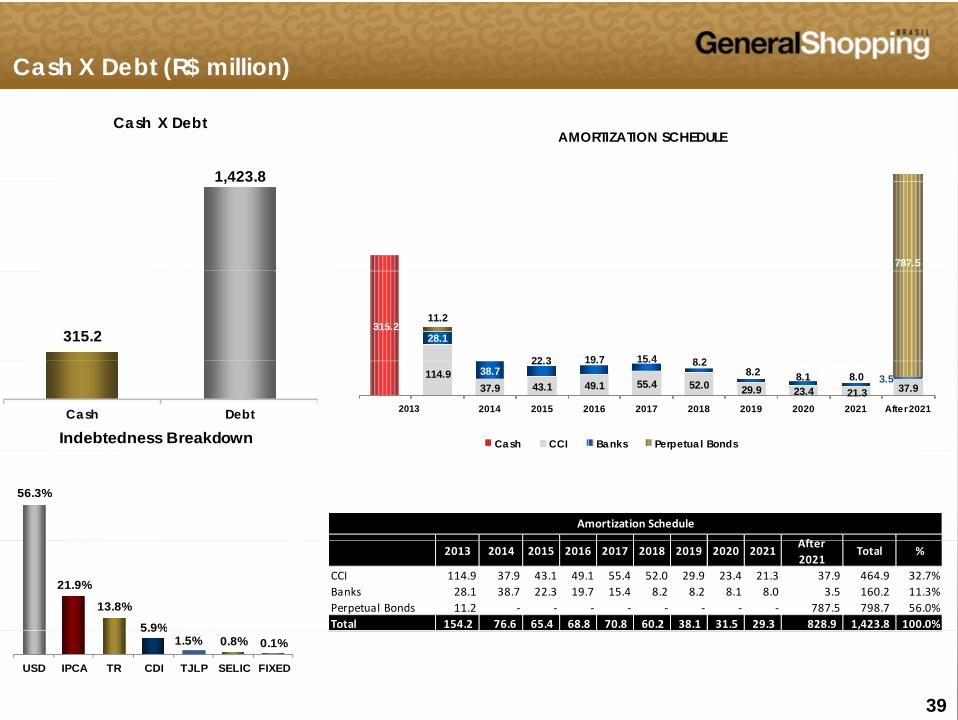
Cash X Debt (R$ million)
AMORTIZATION SCHEDULE
1,423.8
Cash X Debt
787.5
1,423.8
315.228.1
22 3 19 7 15.4 8 2
11.2
315.2
114.937.9 43.1 49.1 55.4 52.0 29.9 23.4 21.3 37.938.7
22.3 19.7 15.4 8.28.2 8.1 8.0 3.5
2014 2015 2016 2017 2018 2019 2020 2021 After 2021
Cash CCI Banks Perpetual Bonds
2013Cash Debt
Indebtedness Breakdown
56.3%
Aft
Amortization Schedule
21.9%
13.8%
5.9%
2013 2014 2015 2016 2017 2018 2019 2020 2021After2021
Total %
CCI 114.9 37.9 43.1 49.1 55.4 52.0 29.9 23.4 21.3 37.9 464.9 32.7%Banks 28.1 38.7 22.3 19.7 15.4 8.2 8.2 8.1 8.0 3.5 160.2 11.3%Perpetual Bonds 11.2 ‐ ‐ ‐ ‐ ‐ ‐ ‐ ‐ 787.5 798.7 56.0%Total 154.2 76.6 65.4 68.8 70.8 60.2 38.1 31.5 29.3 828.9 1,423.8 100.0%
393939
5.9%1.5% 0.8% 0.1%
USD IPCA TR CDI TJLP SELIC FIXED
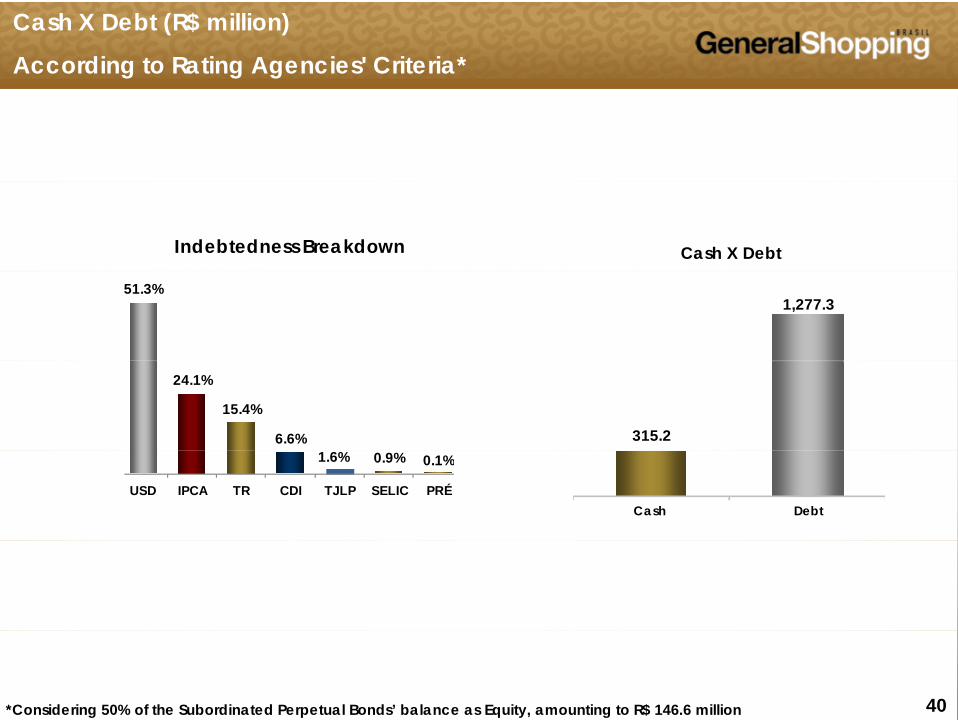
Cash X Debt (R$ million)
According to Rating Agencies' Criteria*
Indebtedness Breakdown Cash X Debt
51.3%1,277.3
24.1%
15.4%
6.6% 315.21.6% 0.9% 0.1%
USD IPCA TR CDI TJLP SELIC PRÉCash Debt
404040*Considering 50% of the Subordinated Perpetual Bonds’ balance as Equity, amounting to R$ 146.6 million

Investment Properties- R$ million
I t t P ti
379.1
Investment Properties
2 527 5 (1)
2,906.6 (2)
2,527.5 (1)
1,569.3
(1) Total value of investment properties (malls in operation) according tothe Valuation Report of CB Richard Ellis on basis date 12/31/2012.Theaveragerateof discount to the cash flowwas8 99%
958.2
Book Value Adjustments to Fair Value (Operational Assets) Constructions in Progress
Theaveragerateof discount to the cash flowwas8.99%
(2) Total value of investment properties and land value, consideringconstruction in progress .
414141
Book Value Adjustments to Fair Value (Operational Assets) Constructions in Progress
Contacts
GSB INVESTOR RELATIONSGSB INVESTOR RELATIONS
Alessandro Poli VeroneziIR Officer
Marcio SniokaMarcio SniokaIR Superintendent
55 11 3159-510055 11 3159 5100
www.generalshopping.com.br
424242