APRC Canadian Automotive Manufacturing … APRC Canadian Automotive Manufacturing Industry Profile...
16
Automotive Policy Research Centre APRC Canadian Automotive Manufacturing Industry Profile 2014 Brendan A. Sweeney, Ph.D. 10/22/2014
Transcript of APRC Canadian Automotive Manufacturing … APRC Canadian Automotive Manufacturing Industry Profile...
Automotive PolicyResearch Centre
APRC Canadian Automotive Manufacturing Industry Profile 2014
Brendan A. Sweeney, Ph.D.
10/22/2014
Intr
oduc
tion
Eco
nom
ic C
ontr
ibut
ions
1 APRC Canadian Automotive Manufacturing Industry Profile 2014
Introduction Every year, the APRC publishes a profile of the Canadian automotivemanufacturing industry. These annual reports present key metrics, includingcontributions to GDP, employment, sales, trade, and a geographic profile of theindustry. This particular report provides evidence of a sustained improvement inproductionandemploymentsince2009.ThereportalsoillustratestheextenttowhichautomotivemanufacturingisimportanttotheCanadianeconomy,andparticularlytocommunitiesinsouthernOntario.However,itemphasizessomeconcerningtrends,includingagrowingtradedeficitinautomotiveparts,widespreadplantclosures,andproduction and employment levels that aremuch lower than those in the decadebetween1997and2007.
Economic Contributions
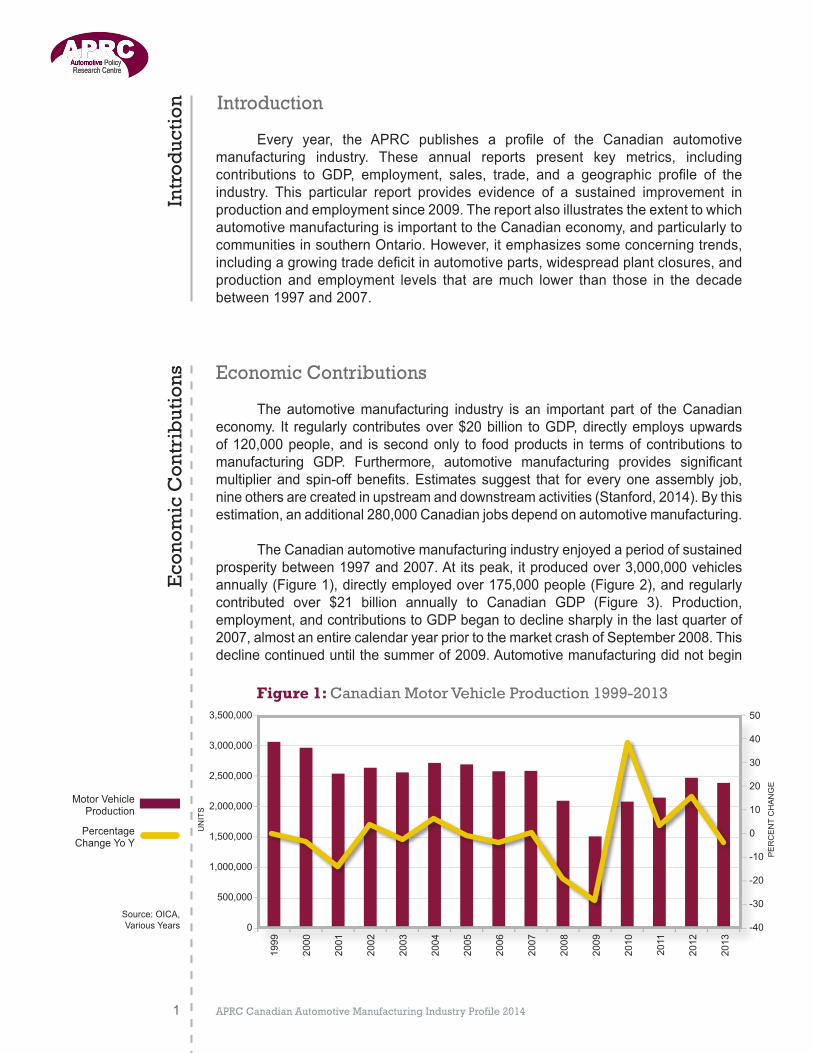
The automotivemanufacturing industry is an important part of theCanadianeconomy. It regularlycontributesover$20billion toGDP,directlyemploysupwardsof120,000people,and issecondonly to foodproducts in termsofcontributions tomanufacturing GDP. Furthermore, automotive manufacturing provides significantmultiplierandspin-off benefits.Estimatessuggest that foreveryoneassembly job,nineothersarecreatedinupstreamanddownstreamactivities(Stanford,2014).Bythisestimation,anadditional280,000Canadianjobsdependonautomotivemanufacturing.
TheCanadianautomotivemanufacturingindustryenjoyedaperiodofsustainedprosperitybetween1997and2007.Atitspeak,itproducedover3,000,000vehiclesannually(Figure1),directlyemployedover175,000people(Figure2),andregularlycontributed over $21 billion annually to Canadian GDP (Figure 3). Production,employment,andcontributionstoGDPbegantodeclinesharplyinthelastquarterof2007,almostanentirecalendaryearpriortothemarketcrashofSeptember2008.Thisdeclinecontinueduntilthesummerof2009.Automotivemanufacturingdidnotbegin
Figure 1: Canadian Motor Vehicle Production 1999-2013 3,500,000
3,000,000
2,500,000
2,000,000
1,500,000
1,000,000
500,000
0
1999
2000
2001
2002
2003
2004
2005
2006
2007
2008
2009
2010
2011
2012
2013
50
40
30
20
10
0
-10
-20
-30
-40
MotorVehicleProduction
PercentageChangeYoY
Source:OICA,VariousYears
BILLIONSOFDOLLARS
UNITS
PERCENTCHANGE
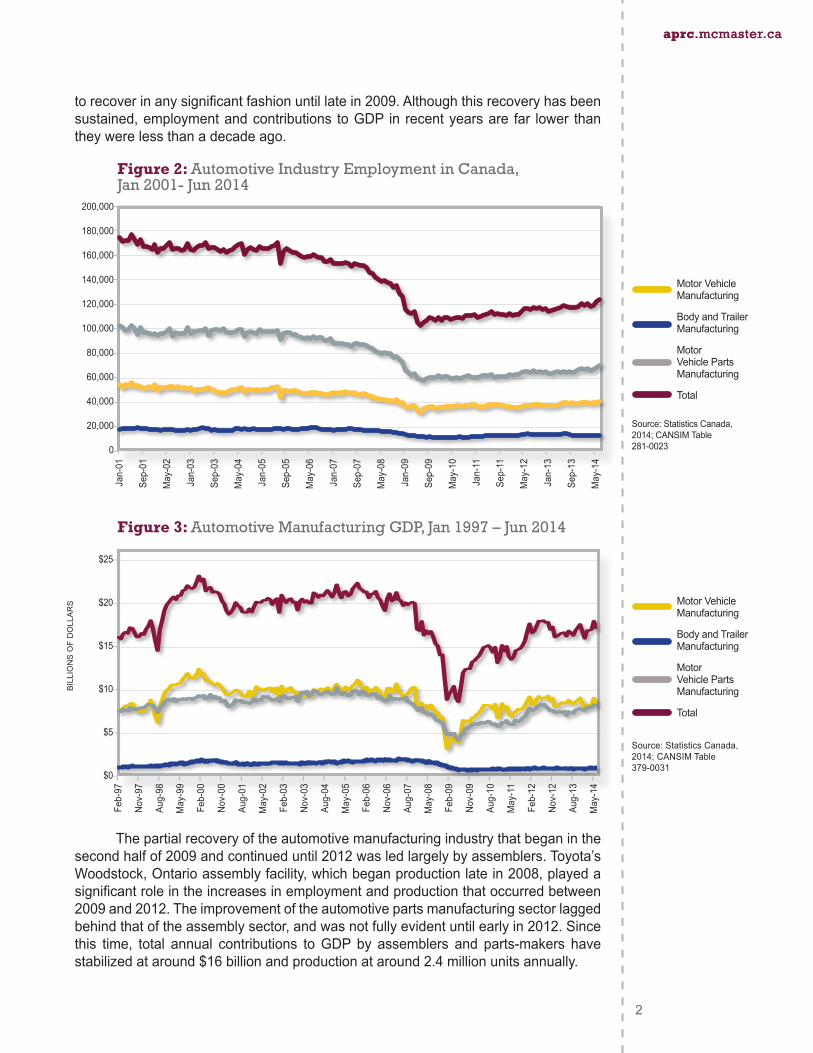
torecoverinanysignificantfashionuntillatein2009.Althoughthisrecoveryhasbeensustained,employmentandcontributions toGDP in recentyearsare far lower thantheywerelessthanadecadeago.
Thepartialrecoveryoftheautomotivemanufacturingindustrythatbeganinthesecondhalfof2009andcontinueduntil2012wasledlargelybyassemblers.Toyota’sWoodstock,Ontarioassemblyfacility,whichbeganproductionlatein2008,playedasignificantroleintheincreasesinemploymentandproductionthatoccurredbetween2009and2012.Theimprovementoftheautomotivepartsmanufacturingsectorlaggedbehindthatoftheassemblysector,andwasnotfullyevidentuntilearlyin2012.Sincethis time, total annual contributions toGDP by assemblers and parts-makers havestabilizedataround$16billionandproductionataround2.4millionunitsannually.
Figure 3: Automotive Manufacturing GDP, Jan 1997 – Jun 2014
APRC Canadian Automotive Manufacturing Industry Profile 2014 2
aprc.mcmaster.caaprc.mcmaster.ca
200,000
180,000
160,000
140,000
120,000
100,000
80,000
60,000
40,000
20,000
0
Jan-01
Sep-01
May-02
Jan-03
Sep-03
May-04
Jan-05
Sep-05
May-06
Jan-07
Sep-07
May-08
Jan-09
Sep-09
May-10
Jan-11
Sep-11
May-12
Jan-13
Sep-13
May-14
$25
$20
$15
$10
$5
$0
Feb-97
Nov-97
Aug-98
May-99
Feb-00
Nov-00
Aug-01
May-02
Feb-03
Nov-03
Aug-04
May-05
Feb-06
Nov-06
Aug-07
May-08
Feb-09
Nov-09
Aug-10
May-11
Feb-12
Nov-12
Aug-13
May-14
Figure 2: Automotive Industry Employment in Canada, Jan 2001- Jun 2014
Source:StatisticsCanada,2014;CANSIMTable281-0023
MotorVehicleManufacturing
BodyandTrailerManufacturing
Motor VehicleParts Manufacturing
Total
MotorVehicleManufacturing
BodyandTrailerManufacturing
Motor VehicleParts Manufacturing
Total
Source:StatisticsCanada,2014;CANSIMTable379-0031
BILLIONSOFDOLLARS
APRC Canadian Automotive Manufacturing Industry Profile 20143
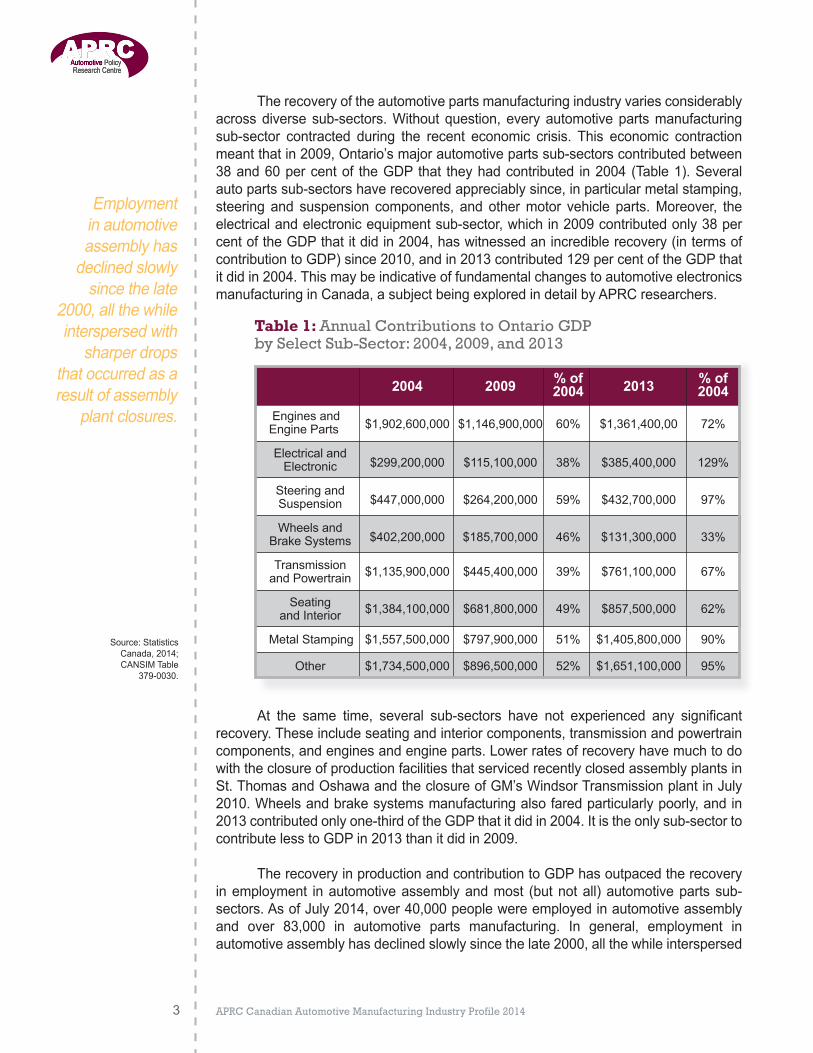
Therecoveryoftheautomotivepartsmanufacturingindustryvariesconsiderablyacrossdiversesub-sectors.Withoutquestion,everyautomotivepartsmanufacturingsub-sector contracted during the recent economic crisis. This economic contractionmeantthatin2009,Ontario’smajorautomotivepartssub-sectorscontributedbetween38and60percentof theGDPthat theyhadcontributed in2004(Table1).Severalautopartssub-sectorshaverecoveredappreciablysince,inparticularmetalstamping,steering and suspension components, and othermotor vehicle parts.Moreover, theelectricalandelectronicequipmentsub-sector,whichin2009contributedonly38percentoftheGDPthatitdidin2004,haswitnessedanincrediblerecovery(intermsofcontributiontoGDP)since2010,andin2013contributed129percentoftheGDPthatitdidin2004.ThismaybeindicativeoffundamentalchangestoautomotiveelectronicsmanufacturinginCanada,asubjectbeingexploredindetailbyAPRCresearchers.
At the same time, several sub-sectors have not experienced any significantrecovery.Theseincludeseatingandinteriorcomponents,transmissionandpowertraincomponents,andenginesandengineparts.LowerratesofrecoveryhavemuchtodowiththeclosureofproductionfacilitiesthatservicedrecentlyclosedassemblyplantsinSt.ThomasandOshawaandtheclosureofGM’sWindsorTransmissionplantinJuly2010.Wheelsandbrakesystemsmanufacturingalsofaredparticularlypoorly,andin2013contributedonlyone-thirdoftheGDPthatitdidin2004.Itistheonlysub-sectortocontributelesstoGDPin2013thanitdidin2009.
TherecoveryinproductionandcontributiontoGDPhasoutpacedtherecoveryinemployment inautomotiveassemblyandmost (butnotall)automotivepartssub-sectors.AsofJuly2014,over40,000peoplewereemployedinautomotiveassemblyand over 83,000 in automotive parts manufacturing. In general, employment inautomotiveassemblyhasdeclinedslowlysincethelate2000,allthewhileinterspersed
Employmentinautomotiveassemblyhasdeclinedslowlysincethelate
2000,allthewhileinterspersedwith
sharperdropsthatoccurredasaresultofassembly
plantclosures.
2004 2009 % of 2013 % of 2004 2004 Enginesand $1,902,600,000 $1,146,900,000 60% $1,361,400,00 72%EngineParts Electricaland Electronic $299,200,000 $115,100,000 38% $385,400,000 129% Steeringand
$447,000,000 $264,200,000 59% $432,700,000 97% Suspension Wheelsand
$402,200,000 $185,700,000 46% $131,300,000 33%
BrakeSystems Transmission $1,135,900,000 $445,400,000 39% $761,100,000 67% andPowertrain Seating $1,384,100,000 $681,800,000 49% $857,500,000 62% andInterior MetalStamping $1,557,500,000 $797,900,000 51% $1,405,800,000 90% Other $1,734,500,000 $896,500,000 52% $1,651,100,000 95%
Table 1: Annual Contributions to Ontario GDP by Select Sub-Sector: 2004, 2009, and 2013
$300,000
$250,000
$200,000
$150,000
$100,000
$50,000
$0
Source:StatisticsCanada,2014;CANSIMTable
379-0030.
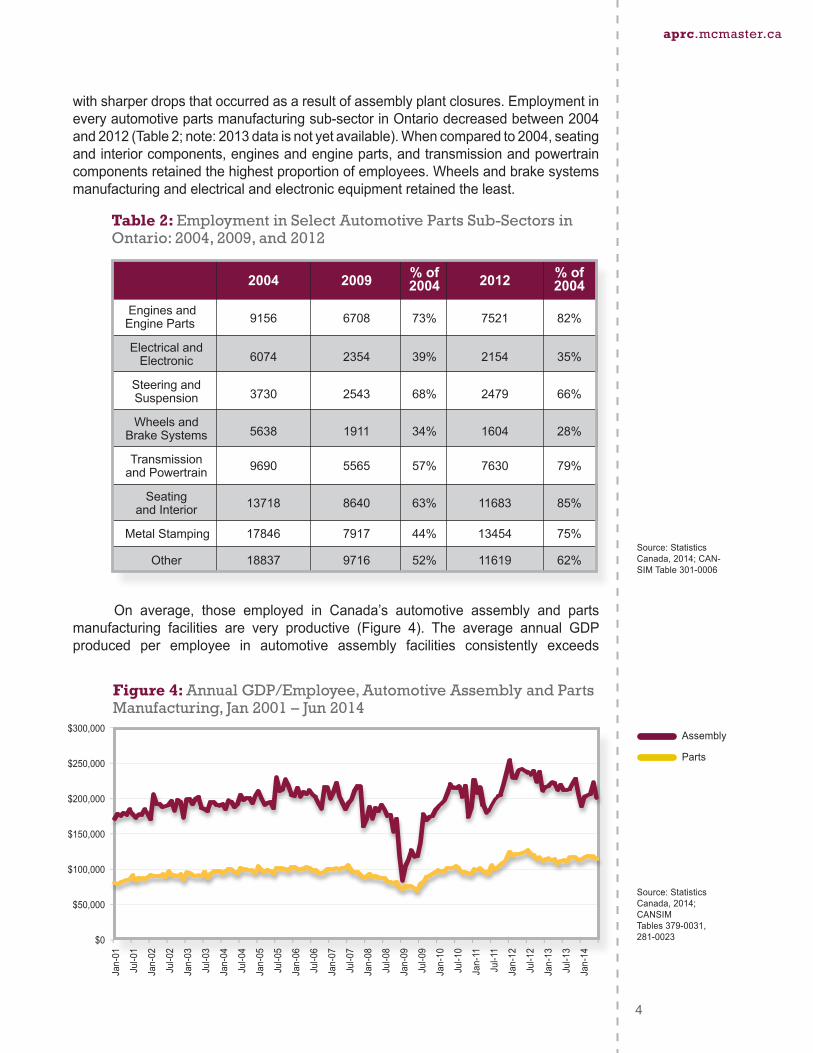
withsharperdropsthatoccurredasaresultofassemblyplantclosures.Employmentineveryautomotivepartsmanufacturingsub-sectorinOntariodecreasedbetween2004and2012(Table2;note:2013dataisnotyetavailable).Whencomparedto2004,seatingandinteriorcomponents,enginesandengineparts,andtransmissionandpowertraincomponentsretainedthehighestproportionofemployees.Wheelsandbrakesystemsmanufacturingandelectricalandelectronicequipmentretainedtheleast.
On average, those employed in Canada’s automotive assembly and partsmanufacturing facilities are very productive (Figure 4). The average annual GDPproduced per employee in automotive assembly facilities consistently exceeds
4
aprc.mcmaster.ca
2004 2009 % of 2012 % of 2004 2004 Enginesand 9156 6708 73% 7521 82%EngineParts Electricaland Electronic 6074 2354 39% 2154 35% Steeringand
3730 2543 68% 2479 66% Suspension Wheelsand
5638 1911 34% 1604 28%
BrakeSystems Transmission 9690 5565 57% 7630 79% andPowertrain Seating 13718 8640 63% 11683 85% andInterior MetalStamping 17846 7917 44% 13454 75% Other 18837 9716 52% 11619 62%
Table 2: Employment in Select Automotive Parts Sub-Sectors in Ontario: 2004, 2009, and 2012
Jan-01
Jul-01
Jan-02
Jul-02
Jan-03
Jul-03
Jan-04
Jul-04
Jan-05
Jul-05
Jan-06
Jul-06
Jan-07
Jul-07
Jan-08
Jul-08
Jan-09
Jul-09
Jan-10
Jul-10
Jan-11
Jul-11
Jan-12
Jul-12
Jan-13
Jul-13
Jan-14
$300,000
$250,000
$200,000
$150,000
$100,000
$50,000
$0
Figure 4: Annual GDP/Employee, Automotive Assembly and Parts Manufacturing, Jan 2001 – Jun 2014
Source:StatisticsCanada,2014;CAN-SIMTable301-0006
Assembly
Parts
Source:StatisticsCanada,2014;CANSIM Tables379-0031,281-0023
$200,000. This is extremely high, even when compared to other capital intensive manufacturing industries such as primary metals, aerospace, chemicals, and pulp and paper (see Sweeney, 2013). The increasingly high rates of average annual GDP produced per employee are attributable to the productivity and skills of Canadian automotive workers and increased rates of capital intensity.
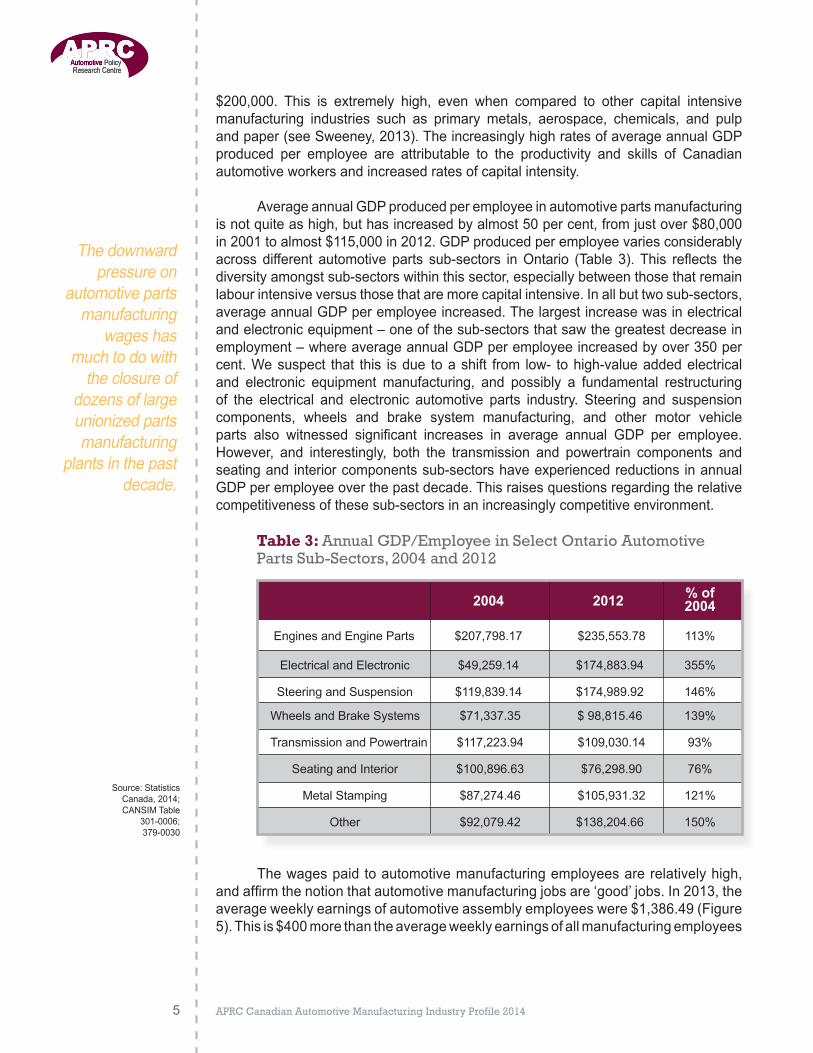
Average annual GDP produced per employee in automotive parts manufacturing is not quite as high, but has increased by almost 50 per cent, from just over $80,000 in 2001 to almost $115,000 in 2012. GDP produced per employee varies considerably across different automotive parts sub-sectors in Ontario (Table 3). This reflects the diversity amongst sub-sectors within this sector, especially between those that remain labour intensive versus those that are more capital intensive. In all but two sub-sectors, average annual GDP per employee increased. The largest increase was in electrical and electronic equipment – one of the sub-sectors that saw the greatest decrease in employment – where average annual GDP per employee increased by over 350 per cent. We suspect that this is due to a shift from low- to high-value added electrical and electronic equipment manufacturing, and possibly a fundamental restructuring of the electrical and electronic automotive parts industry. Steering and suspension components, wheels and brake system manufacturing, and other motor vehicle parts also witnessed significant increases in average annual GDP per employee. However, and interestingly, both the transmission and powertrain components and seating and interior components sub-sectors have experienced reductions in annual GDP per employee over the past decade. This raises questions regarding the relative competitiveness of these sub-sectors in an increasingly competitive environment.
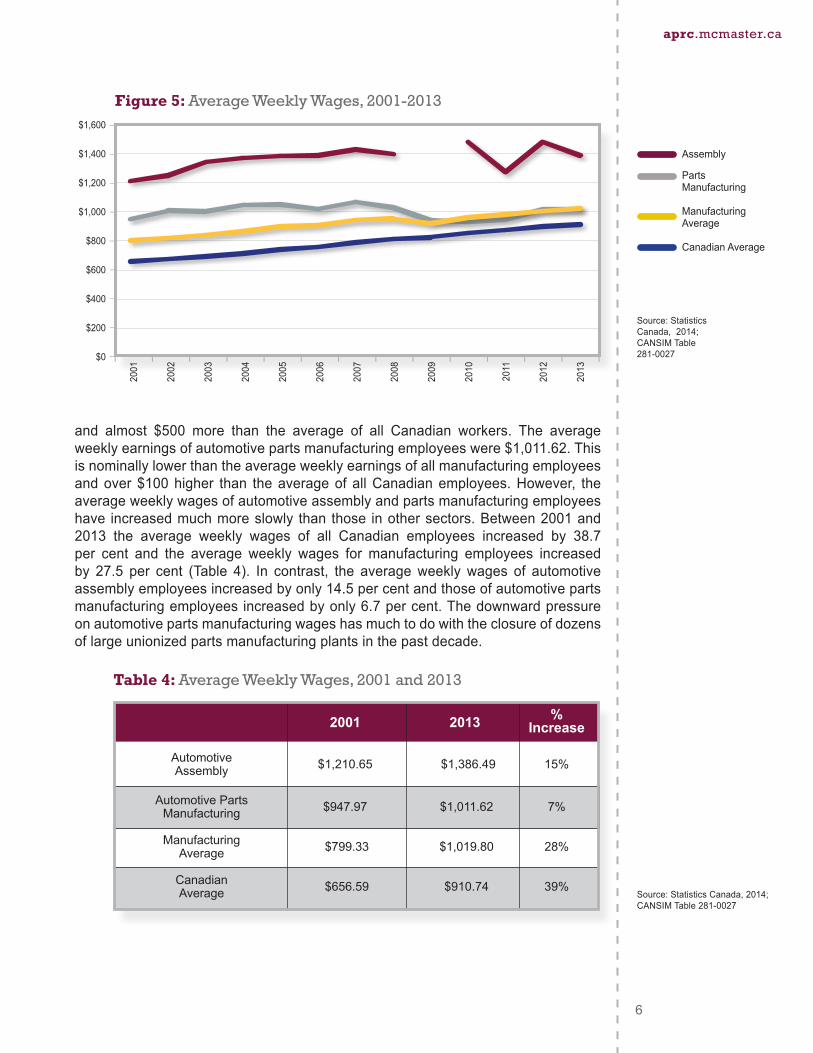
The wages paid to automotive manufacturing employees are relatively high, and affirm the notion that automotive manufacturing jobs are ‘good’ jobs. In 2013, the average weekly earnings of automotive assembly employees were $1,386.49 (Figure 5). This is $400 more than the average weekly earnings of all manufacturing employees
APRC Canadian Automotive Manufacturing Industry Profile 20145
2004 2012 % of 2004 Engines and Engine Parts $207,798.17 $235,553.78 113%
Electrical and Electronic $49,259.14 $174,883.94 355%
Steering and Suspension $119,839.14 $174,989.92 146% Wheels and Brake Systems $71,337.35 $ 98,815.46 139% Transmission and Powertrain $117,223.94 $109,030.14 93% Seating and Interior $100,896.63 $76,298.90 76%
Metal Stamping $87,274.46 $105,931.32 121%
Other $92,079.42 $138,204.66 150%
Table 3: Annual GDP/Employee in Select Ontario Automotive Parts Sub-Sectors, 2004 and 2012
Source: Statistics Canada, 2014; CANSIM Table
301-0006; 379-0030
The downward pressure on
automotive parts manufacturing
wages has much to do with
the closure of dozens of large unionized parts manufacturing
plants in the past decade.
APRC Canadian Automotive Manufacturing Industry Profile 2014 6
aprc.mcmaster.ca
and almost $500 more than the average of all Canadian workers. The average weekly earnings of automotive parts manufacturing employees were $1,011.62. This is nominally lower than the average weekly earnings of all manufacturing employees and over $100 higher than the average of all Canadian employees. However, the average weekly wages of automotive assembly and parts manufacturing employees have increased much more slowly than those in other sectors. Between 2001 and 2013 the average weekly wages of all Canadian employees increased by 38.7 per cent and the average weekly wages for manufacturing employees increased by 27.5 per cent (Table 4). In contrast, the average weekly wages of automotive assembly employees increased by only 14.5 per cent and those of automotive parts manufacturing employees increased by only 6.7 per cent. The downward pressure on automotive parts manufacturing wages has much to do with the closure of dozens of large unionized parts manufacturing plants in the past decade.
$1,600
$1,400
$1,200
$1,000
$800
$600
$400
$200
$0
2001
2002
2003
2004
2005
2006
2007
2008
2009
2010
2011
2012
2013
Figure 5: Average Weekly Wages, 2001-2013
2001 2013 % Increase Automotive $1,210.65 $1,386.49 15% Assembly Automotive Parts $947.97 $1,011.62 7% Manufacturing
Manufacturing $799.33 $1,019.80 28% Average Canadian $656.59 $910.74 39% Average
Table 4: Average Weekly Wages, 2001 and 2013
Assembly
Parts Manufacturing
Manufacturing Average
Canadian Average
Source: Statistics Canada, 2014; CANSIM Table 281-0027
Source: Statistics Canada, 2014; CANSIM Table 281-0027
BILLIONSOFDOLLARS
BILLIONSOFDOLLARS
APRC Canadian Automotive Manufacturing Industry Profile 20147
Trade
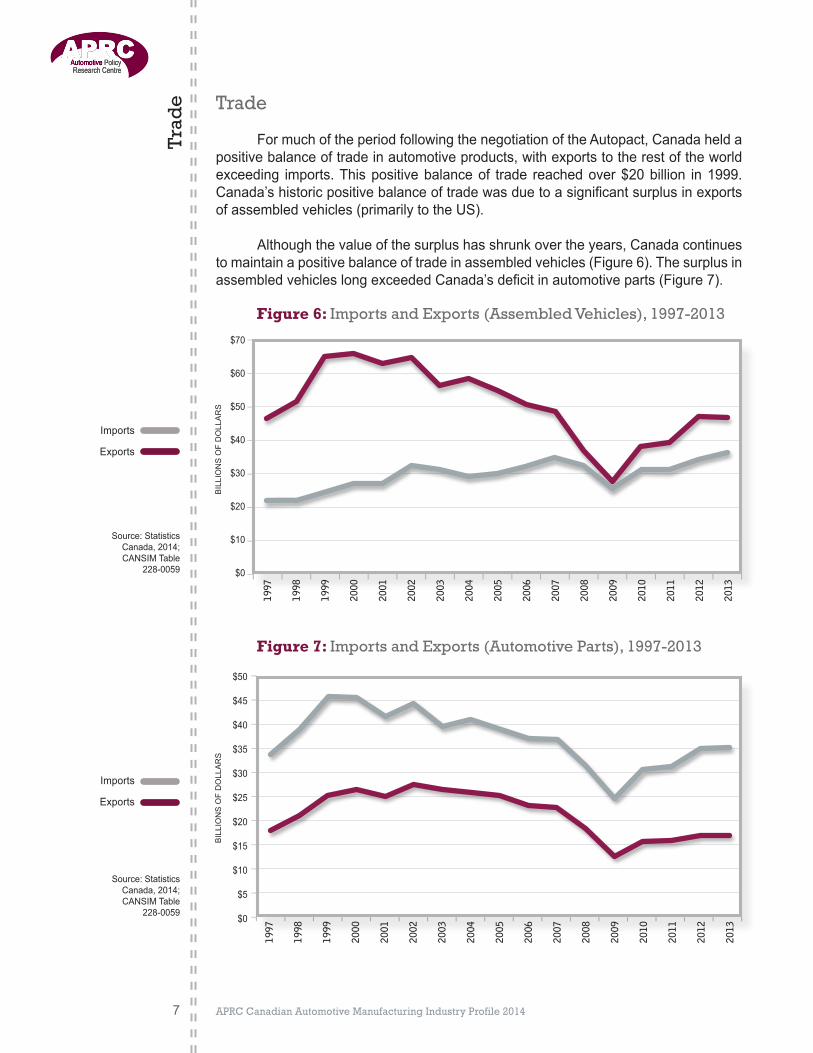
FormuchoftheperiodfollowingthenegotiationoftheAutopact,Canadaheldapositivebalanceoftradeinautomotiveproducts,withexportstotherestoftheworldexceeding imports.Thispositivebalanceof trade reachedover$20billion in1999.Canada’shistoricpositivebalanceoftradewasduetoasignificantsurplusinexportsofassembledvehicles(primarilytotheUS). Althoughthevalueofthesurplushasshrunkovertheyears,Canadacontinuestomaintainapositivebalanceoftradeinassembledvehicles(Figure6).ThesurplusinassembledvehicleslongexceededCanada’sdeficitinautomotiveparts(Figure7).
Trad
e
1997
1998
1999
2000
2001
2002
2003
2004
2005
2006
2007
2008
2009
2010
2011
2012
2013
$70
$60
$50
$40
$30
$20
$10
$0
Figure 6: Imports and Exports (Assembled Vehicles), 1997-2013
$50
$45
$40
$35
$30
$25
$20
$15
$10
$5
$0
1997
1998
1999
2000
2001
2002
2003
2004
2005
2006
2007
2008
2009
2010
2011
2012
2013
Figure 7: Imports and Exports (Automotive Parts), 1997-2013
Imports
Exports
Source:StatisticsCanada,2014;CANSIMTable
228-0059
Source:StatisticsCanada,2014;CANSIMTable
228-0059
Imports
Exports
APRC Canadian Automotive Manufacturing Industry Profile 2014
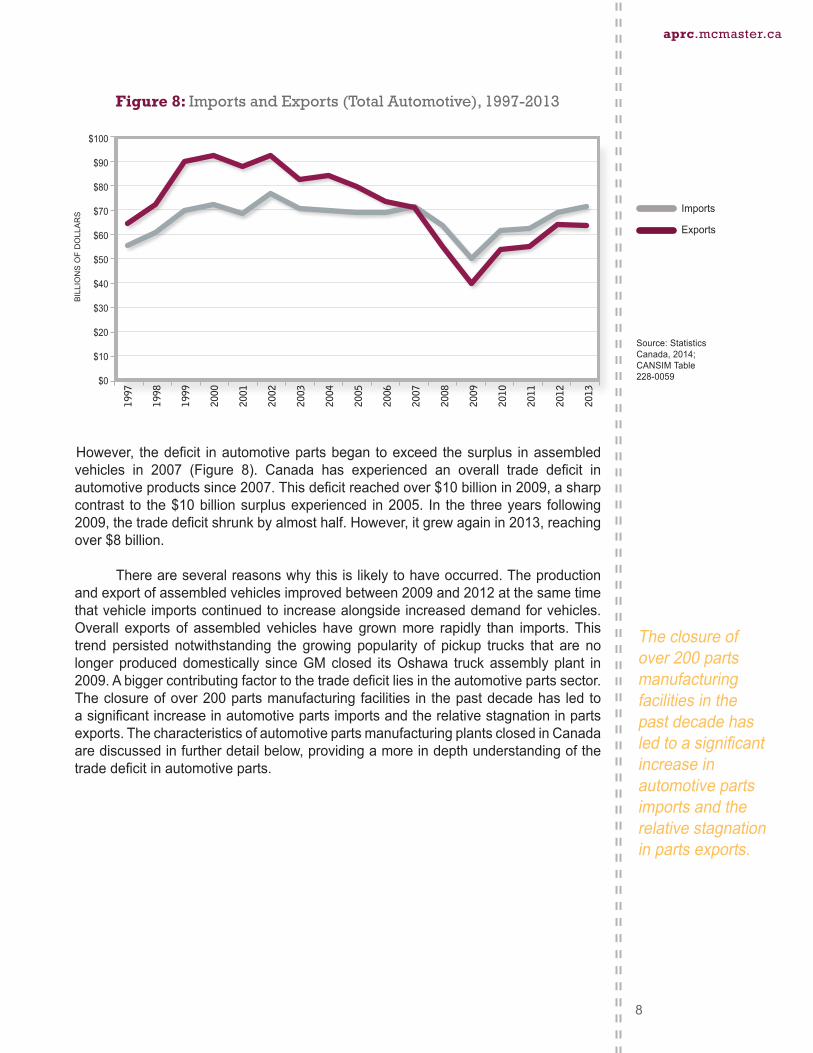
However, thedeficit inautomotivepartsbegan toexceed thesurplus inassembledvehicles in 2007 (Figure 8). Canada has experienced an overall trade deficit inautomotiveproductssince2007.Thisdeficitreachedover$10billionin2009,asharpcontrast to the$10billionsurplusexperienced in2005. In the threeyears following2009,thetradedeficitshrunkbyalmosthalf.However,itgrewagainin2013,reachingover$8billion.
Thereareseveralreasonswhythisislikelytohaveoccurred.Theproductionandexportofassembledvehiclesimprovedbetween2009and2012atthesametimethatvehicleimportscontinuedtoincreasealongsideincreaseddemandforvehicles.Overall exports of assembled vehicles have grownmore rapidly than imports.Thistrend persisted notwithstanding the growing popularity of pickup trucks that are nolonger produceddomestically sinceGMclosed itsOshawa truckassemblyplant in2009.Abiggercontributingfactortothetradedeficitliesintheautomotivepartssector.Theclosureofover200partsmanufacturingfacilities in thepastdecadehas ledtoasignificantincreaseinautomotivepartsimportsandtherelativestagnationinpartsexports.ThecharacteristicsofautomotivepartsmanufacturingplantsclosedinCanadaarediscussedinfurtherdetailbelow,providingamoreindepthunderstandingofthetradedeficitinautomotiveparts.
8
aprc.mcmaster.ca
Figure 8: Imports and Exports (Total Automotive), 1997-2013
$100
$90
$80
$70
$60
$50
$40
$30
$20
$10
$0
1997
1998
1999
2000
2001
2002
2003
2004
2005
2006
2007
2008
2009
2010
2011
2012
2013
Imports
Exports
Source:StatisticsCanada,2014;CANSIMTable228-0059
BILLIONSOFDOLLARS
Theclosureofover200partsmanufacturingfacilitiesinthepastdecadehasledtoasignificantincreaseinautomotivepartsimportsandtherelativestagnationinpartsexports.
APRC Canadian Automotive Manufacturing Industry Profile 2014
Sale
s
10
Sales
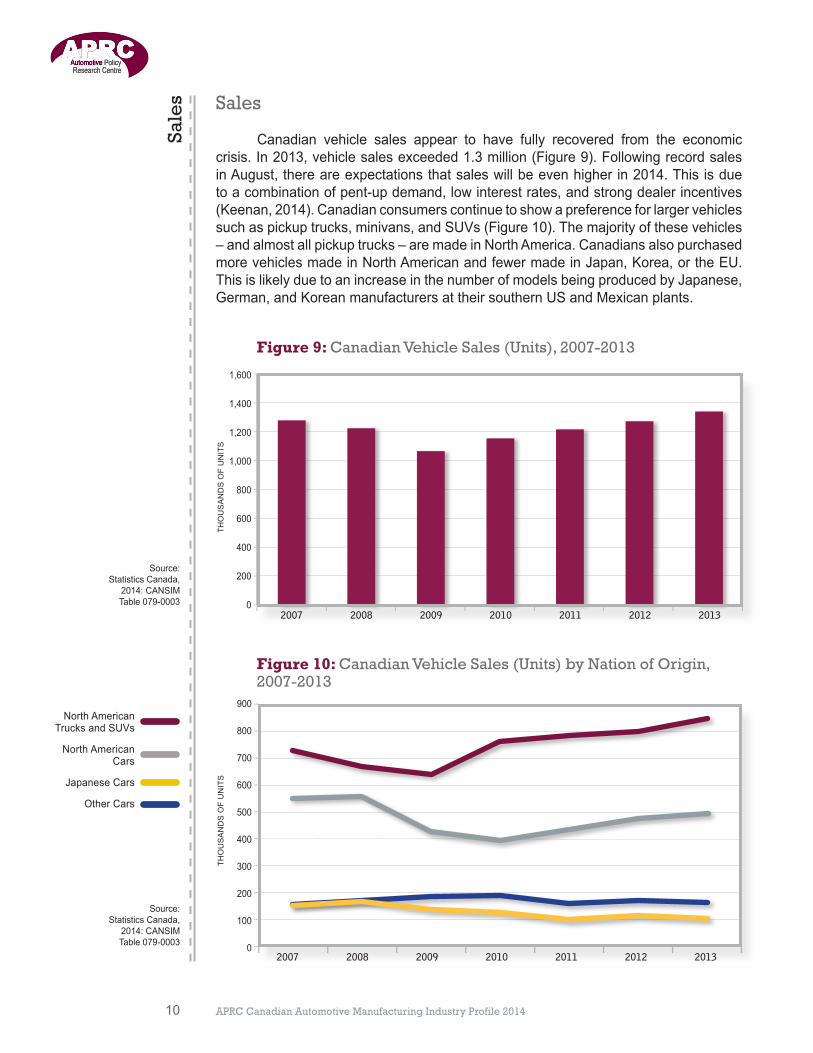
Canadian vehicle sales appear to have fully recovered from the economiccrisis.In2013,vehiclesalesexceeded1.3million(Figure9).FollowingrecordsalesinAugust,thereareexpectationsthatsaleswillbeevenhigherin2014.Thisisduetoacombinationofpent-updemand,lowinterestrates,andstrongdealerincentives(Keenan,2014).Canadianconsumerscontinuetoshowapreferenceforlargervehiclessuchaspickuptrucks,minivans,andSUVs(Figure10).Themajorityofthesevehicles–andalmostallpickuptrucks–aremadeinNorthAmerica.CanadiansalsopurchasedmorevehiclesmadeinNorthAmericanandfewermadeinJapan,Korea,ortheEU.ThisislikelyduetoanincreaseinthenumberofmodelsbeingproducedbyJapanese,German,andKoreanmanufacturersattheirsouthernUSandMexicanplants.
1,600
1,400
1,200
1,000
800
600
400
200
02007 2008 2009 2010 2011 2012 2013
Figure 9: Canadian Vehicle Sales (Units), 2007-2013
900
800
700
600
500
400
300
200
100
02007 2008 2009 2010 2011 2012 2013
Figure 10: Canadian Vehicle Sales (Units) by Nation of Origin, 2007-2013
NorthAmericanTrucksandSUVs
NorthAmericanCars
JapaneseCars
OtherCars
Source: StatisticsCanada,
2014:CANSIMTable079-0003
Source: StatisticsCanada,
2014:CANSIM Table079-0003
THOUSANDSOFUNITS
THOUSANDSOFUNITS
APRC Canadian Automotive Manufacturing Industry Profile 2014 11
Geo
gra
phy
and
Pro
duc
tion
Loc
atio
n
aprc.mcmaster.ca
Geography and Production Location
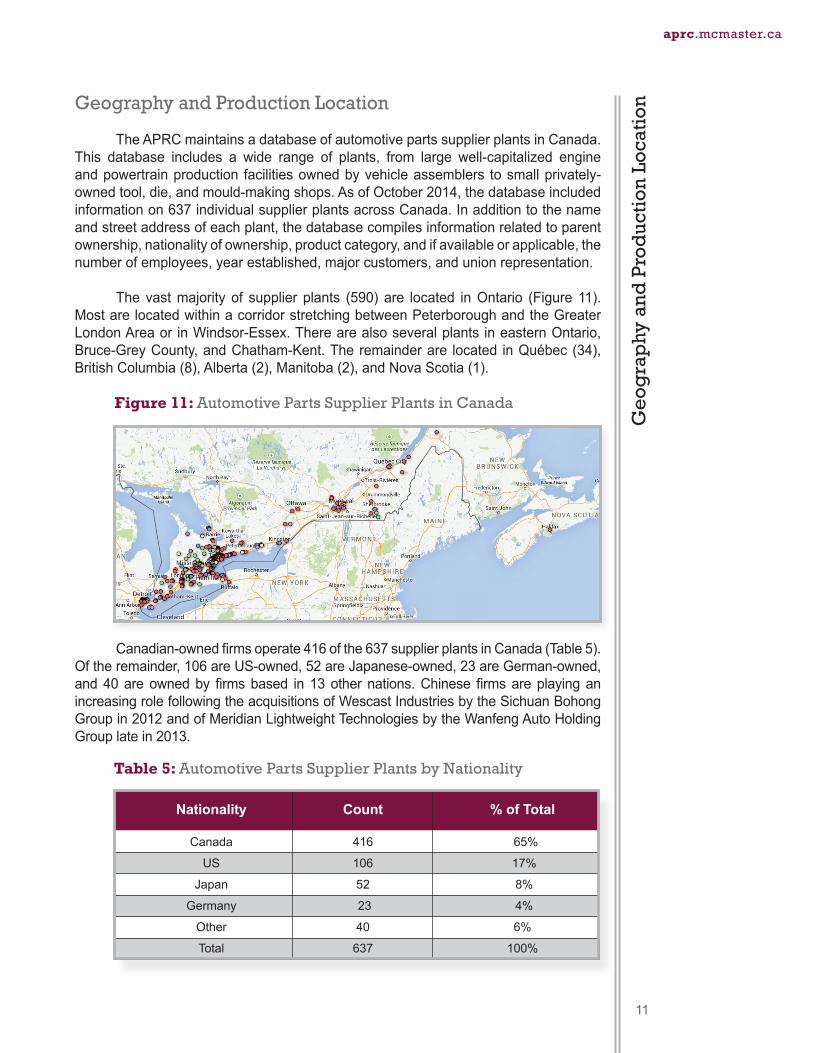
TheAPRCmaintainsadatabaseofautomotivepartssupplierplantsinCanada.This database includes a wide range of plants, from large well-capitalized engineandpowertrainproduction facilitiesownedbyvehicleassemblers tosmallprivately-ownedtool,die,andmould-makingshops.AsofOctober2014,thedatabaseincludedinformationon637individualsupplierplantsacrossCanada.Inadditiontothenameandstreetaddressofeachplant,thedatabasecompilesinformationrelatedtoparentownership,nationalityofownership,productcategory,andifavailableorapplicable,thenumberofemployees,yearestablished,majorcustomers,andunionrepresentation. Thevastmajority of supplier plants (590)are located inOntario (Figure11).MostarelocatedwithinacorridorstretchingbetweenPeterboroughandtheGreaterLondonAreaor inWindsor-Essex.TherearealsoseveralplantsineasternOntario,Bruce-GreyCounty,andChatham-Kent.Theremainderare located inQuébec(34),BritishColumbia(8),Alberta(2),Manitoba(2),andNovaScotia(1).
Canadian-ownedfirmsoperate416ofthe637supplierplantsinCanada(Table5).Oftheremainder,106areUS-owned,52areJapanese-owned,23areGerman-owned,and40areownedbyfirmsbased in13othernations.ChinesefirmsareplayinganincreasingrolefollowingtheacquisitionsofWescastIndustriesbytheSichuanBohongGroupin2012andofMeridianLightweightTechnologiesbytheWanfengAutoHoldingGrouplatein2013.
Figure 11: Automotive Parts Supplier Plants in Canada
Nationality Count % of Total
Canada 416 65% US 106 17% Japan 52 8% Germany 23 4%
Other 40 6%
Total 637 100%
Table 5: Automotive Parts Supplier Plants by Nationality
APRC Canadian Automotive Manufacturing Industry Profile 201412
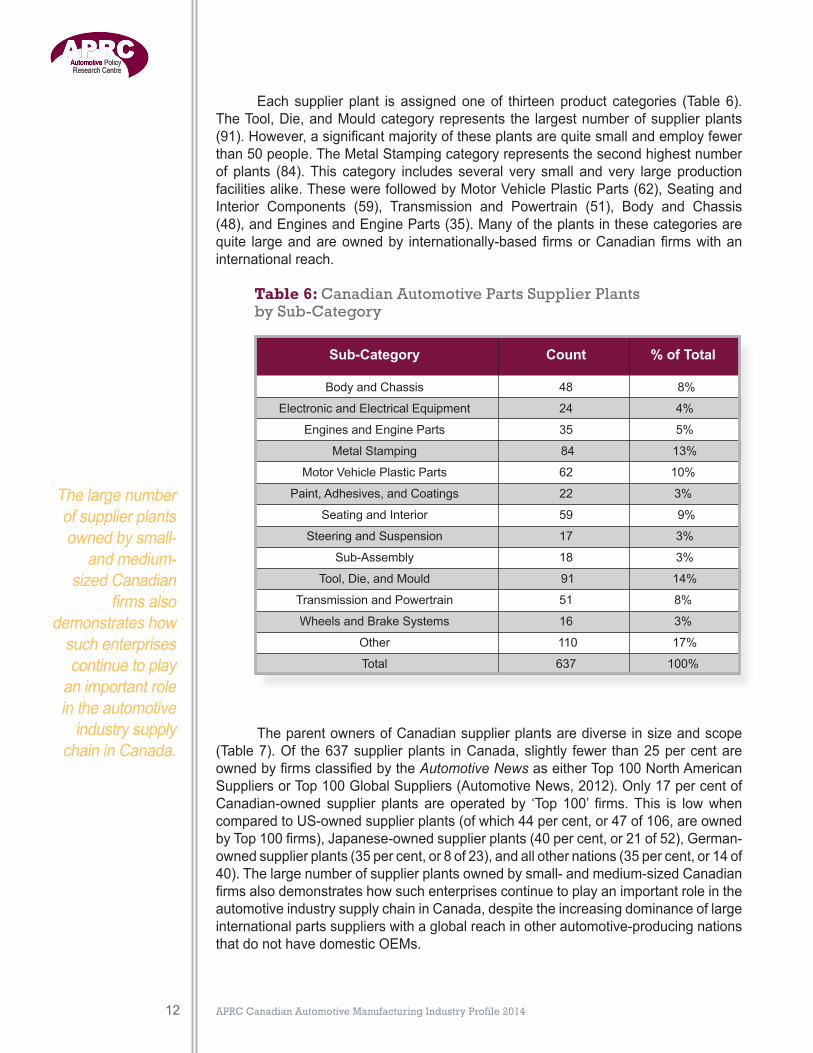
Eachsupplier plant is assignedoneof thirteenproduct categories (Table6).TheTool,Die,andMouldcategoryrepresents the largestnumberofsupplierplants(91).However,asignificantmajorityoftheseplantsarequitesmallandemployfewerthan50people.TheMetalStampingcategoryrepresentsthesecondhighestnumberof plants (84).This category includes several very small and very largeproductionfacilitiesalike.ThesewerefollowedbyMotorVehiclePlasticParts(62),SeatingandInterior Components (59), Transmission and Powertrain (51), Body and Chassis(48),andEnginesandEngineParts(35).Manyoftheplantsinthesecategoriesarequite largeandareownedby internationally-basedfirmsorCanadianfirmswithaninternationalreach.
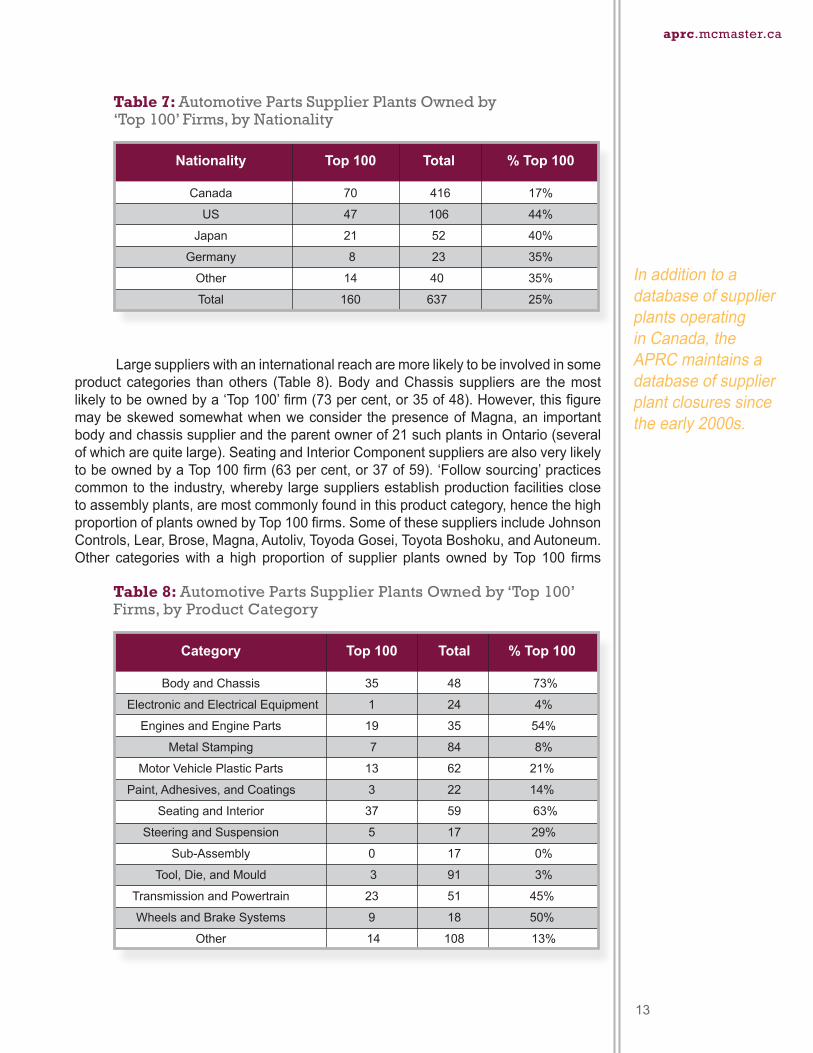
TheparentownersofCanadiansupplierplantsarediverseinsizeandscope(Table7).Of the637supplierplants inCanada,slightly fewer than25percentareownedbyfirmsclassifiedbytheAutomotive NewsaseitherTop100NorthAmericanSuppliersorTop100GlobalSuppliers(AutomotiveNews,2012).Only17percentofCanadian-owned supplier plants are operated by ‘Top 100’ firms.This is lowwhencomparedtoUS-ownedsupplierplants(ofwhich44percent,or47of106,areownedbyTop100firms),Japanese-ownedsupplierplants(40percent,or21of52),German-ownedsupplierplants(35percent,or8of23),andallothernations(35percent,or14of40).Thelargenumberofsupplierplantsownedbysmall-andmedium-sizedCanadianfirmsalsodemonstrateshowsuchenterprisescontinuetoplayanimportantroleintheautomotiveindustrysupplychaininCanada,despitetheincreasingdominanceoflargeinternationalpartssupplierswithaglobalreachinotherautomotive-producingnationsthatdonothavedomesticOEMs.
Sub-Category Count % of Total BodyandChassis 48 8% ElectronicandElectricalEquipment 24 4% EnginesandEngineParts 35 5% MetalStamping 84 13%
MotorVehiclePlasticParts 62 10%
Paint,Adhesives,andCoatings 22 3%
SeatingandInterior 59 9% SteeringandSuspension 17 3% Sub-Assembly 18 3% Tool,Die,andMould 91 14%
TransmissionandPowertrain 51 8%
WheelsandBrakeSystems 16 3% Other 110 17%
Total 637 100%
Table 6: Canadian Automotive Parts Supplier Plants by Sub-Category
Thelargenumberofsupplierplantsownedbysmall-
andmedium-sizedCanadian
firmsalsodemonstrateshowsuchenterprisescontinuetoplayanimportantroleintheautomotiveindustrysupply
chaininCanada.
APRC Canadian Automotive Manufacturing Industry Profile 2014 13
InadditiontoadatabaseofsupplierplantsoperatinginCanada,theAPRCmaintainsadatabaseofsupplierplantclosuressincetheearly2000s.
aprc.mcmaster.ca
Largesupplierswithaninternationalreacharemorelikelytobeinvolvedinsomeproductcategories thanothers (Table8).BodyandChassissuppliersare themostlikelytobeownedbya‘Top100’firm(73percent,or35of48).However,thisfiguremaybeskewedsomewhatwhenweconsider thepresenceofMagna,an importantbodyandchassissupplierandtheparentownerof21suchplantsinOntario(severalofwhicharequitelarge).SeatingandInteriorComponentsuppliersarealsoverylikelytobeownedbyaTop100firm(63percent,or37of59).‘Followsourcing’practicescommontotheindustry,wherebylargesuppliersestablishproductionfacilitiesclosetoassemblyplants,aremostcommonlyfoundinthisproductcategory,hencethehighproportionofplantsownedbyTop100firms.SomeofthesesuppliersincludeJohnsonControls,Lear,Brose,Magna,Autoliv,ToyodaGosei,ToyotaBoshoku,andAutoneum.Other categorieswith a high proportion of supplier plants owned byTop 100 firms
Nationality Top 100 Total % Top 100 Canada 70 416 17% US 47 106 44% Japan 21 52 40% Germany 8 23 35%
Other 14 40 35%
Total 160 637 25%
Table 7: Automotive Parts Supplier Plants Owned by ‘Top 100’ Firms, by Nationality
Category Top 100 Total % Top 100 BodyandChassis 35 48 73% ElectronicandElectricalEquipment 1 24 4% EnginesandEngineParts 19 35 54% MetalStamping 7 84 8%
MotorVehiclePlasticParts 13 62 21%
Paint,Adhesives,andCoatings 3 22 14%
SeatingandInterior 37 59 63% SteeringandSuspension 5 17 29% Sub-Assembly 0 17 0% Tool,Die,andMould 3 91 3%
TransmissionandPowertrain 23 51 45%
WheelsandBrakeSystems 9 18 50% Other 14 108 13%
Table 8: Automotive Parts Supplier Plants Owned by ‘Top 100’ Firms, by Product Category
APRC Canadian Automotive Manufacturing Industry Profile 201414
include Engines and Engine Parts (54 per cent, or 19 of 35), Wheels and BrakeSystems(50percent,or9of18),andTransmissionandPowertrainComponents(45percent,or23of51).ThesupplierplantsleastlikelytobeownedbyaTop100firmareSub-Assembly(none),Tool,Die,andMould(lessthan3percent,or3of91),andElectricalandElectronicEquipment(4percent,or1of24).
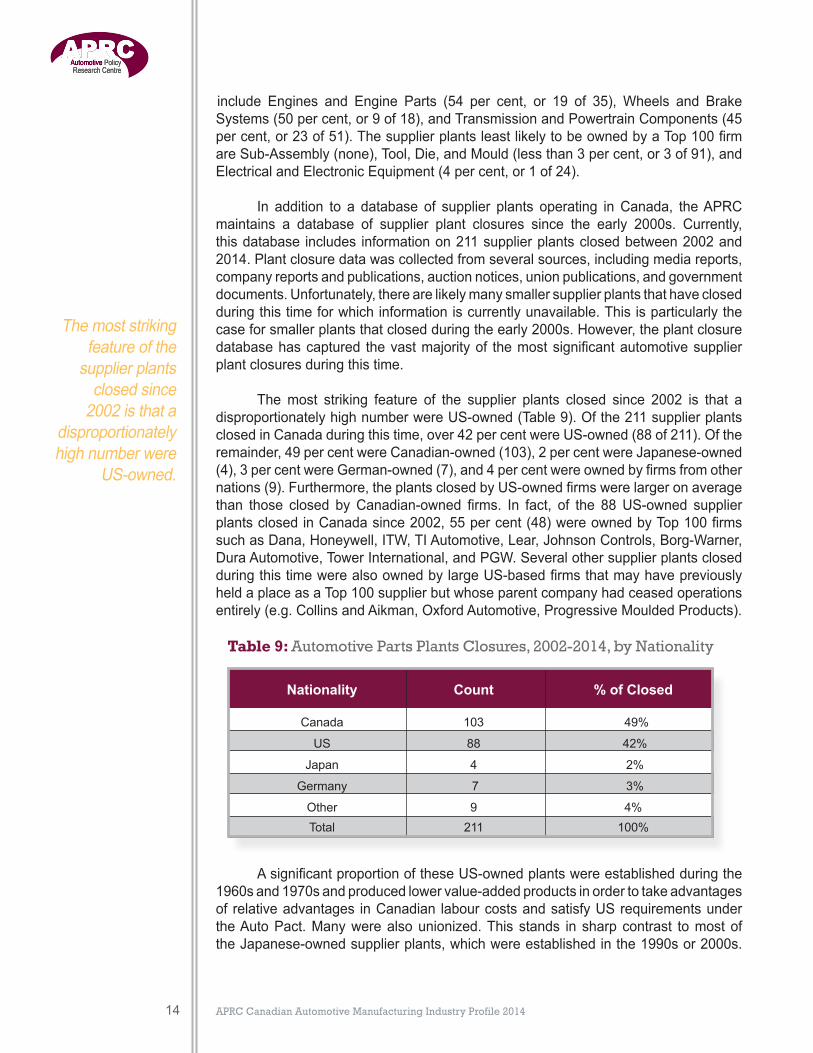
In addition to a database of supplier plants operating inCanada, theAPRCmaintains a database of supplier plant closures since the early 2000s. Currently,thisdatabase includes informationon211supplierplantsclosedbetween2002and2014.Plantclosuredatawascollectedfromseveralsources,includingmediareports,companyreportsandpublications,auctionnotices,unionpublications,andgovernmentdocuments.Unfortunately,therearelikelymanysmallersupplierplantsthathaveclosedduringthistimeforwhichinformationiscurrentlyunavailable.Thisisparticularlythecaseforsmallerplantsthatclosedduringtheearly2000s.However,theplantclosuredatabasehascaptured thevastmajorityof themostsignificantautomotivesupplierplantclosuresduringthistime.
Themost striking feature of the supplier plants closed since 2002 is that adisproportionatelyhighnumberwereUS-owned(Table9).Ofthe211supplierplantsclosedinCanadaduringthistime,over42percentwereUS-owned(88of211).Oftheremainder,49percentwereCanadian-owned(103),2percentwereJapanese-owned(4),3percentwereGerman-owned(7),and4percentwereownedbyfirmsfromothernations(9).Furthermore,theplantsclosedbyUS-ownedfirmswerelargeronaveragethan those closed byCanadian-owned firms. In fact, of the 88US-owned supplierplantsclosedinCanadasince2002,55percent(48)wereownedbyTop100firmssuchasDana,Honeywell,ITW,TIAutomotive,Lear,JohnsonControls,Borg-Warner,DuraAutomotive,TowerInternational,andPGW.SeveralothersupplierplantsclosedduringthistimewerealsoownedbylargeUS-basedfirmsthatmayhavepreviouslyheldaplaceasaTop100supplierbutwhoseparentcompanyhadceasedoperationsentirely(e.g.CollinsandAikman,OxfordAutomotive,ProgressiveMouldedProducts).
AsignificantproportionoftheseUS-ownedplantswereestablishedduringthe1960sand1970sandproducedlowervalue-addedproductsinordertotakeadvantagesof relativeadvantages inCanadian labourcostsandsatisfyUSrequirementsundertheAutoPact.Manywerealsounionized.This stands in sharpcontrast tomostoftheJapanese-ownedsupplierplants,whichwereestablishedinthe1990sor2000s.
Nationality Count % of Closed Canada 103 49% US 88 42% Japan 4 2% Germany 7 3%
Other 9 4% Total 211 100%
Table 9: Automotive Parts Plants Closures, 2002-2014, by Nationality
Themoststrikingfeatureofthesupplierplantsclosedsince2002isthata
disproportionatelyhighnumberwere
US-owned.
APRC Canadian Automotive Manufacturing Industry Profile 2014 15
TheplantclosuredatabasealsoidentifiesageographicshiftintheCanadianautomotivemanufacturingindustry.Ingeneral,therehasbeenashiftawayfromproductioninperipheralregionsandregionswithoutassemblyfacilities.
Con
clus
ion
aprc.mcmaster.ca
However,manyoftheUS-ownedplantswereantiquatedandbecameuncompetitivefollowing theendof theAutoPact in2001, theappreciationof theCanadiandollar,anddecliningproductionvolumesbetween2007and2009.BasedontheAPRCplantclosure database, the average age of US-owned Top 100 suppliers at the time ofclosurewas43.2years,andtheaveragedatethattheywereestablishedwas1964.
Theplantclosuredatabasealso identifiesageographicshift in theCanadianautomotive manufacturing industry. In general, there has been a shift away fromproduction in peripheral regions and regions without assembly facilities. SeveralcommunitiesinnearnorthernOntario(e.g.Sudbury),theMuskokas(e.g.Bracebridge),and Grey County (e.g. Owen Sound) have lost nearly all of their supplier plants.TheSouthwesternOntariocommunitiesofChatham-Kent,Sarnia,andWallaceburgalso lost a large proportion of their supplier plants, despite their relative proximityto automotive clusters in the Windsor and London areas. At the same time, adisproportionate amount of supplier plants in the eastern GTA closed (includingDurhamRegionandScarborough),despitethepresenceofGM’sOshawaAssemblycomplex, the northeasternmost automotive assembly plant in NorthAmerica. Mostof theplants that remain in theeasternGTAareownedby largeUSandCanadianfirms(e.g.Lear,JohnsonControls,Martinrea,Inteva,WoodbridgeFoam)thatservicethenearbyGMplantalmostexclusively.WhattheeasternGTAlacksarethediversenetworks of second- and third-tier parts suppliers and mould-makers prevalent inotherareasofOntariowhereOEMassemblyandpowertrainproductionfacilitiesarelocated (e.g.Windsor,westernGTA,Kitchener-WaterlooandCambridge).Thismaybeaconsequenceof theclosureofGM’s truckassemblyplant in2009and recentuncertaintyregardingthefutureofoneofthetworemainingcarassemblyplants.
Conclusion
The Canadian automotive manufacturing has partially recovered from theturmoil of the 2008-9 financial crisis.While it is unlikely that the industrywill soonemploy asmany people or contribute asmuch toGDP as it did in the late 1990sandearly2000s,itappearstohavestabilizedtosomedegree.RecenthiringatFord,Toyota,andChryslerassemblyplantsandGM’sdecisiontodelaytheplannedclosureoftheOshawaConsolidatedplantoffersomeoptimismfortheindustrymovingforward.However,thetradedeficit,whichaftershrinkingforthreestraightyearsgrewin2013(anditisexpectedthatitwillgrowagainin2014)isanissuethattheAPRCcontinuestoexamine,especiallyconsideringthestrengthofvehiclesales inrecentyearsandtheclosuresofpartssupplierplants.Canada’sdiminishedshareofNorthAmericanproductionisalsoanongoingcauseforconcern.
APRC Canadian Automotive Manufacturing Industry Profile 2014
Ref
eren
ces
16
References
AutomotiveNews(2012)TopSuppliers:NorthAmerica,Europe,andtheWorld.SpecialSupplementtoAutomotive News,June17,2013.
Keenan,Greg(2014)Autosalesreachrecordon‘flashinggreen’indicators.The Globe and Mail,September3,2014.
OICA (1999-2013) Various Production Statistics. http://www.oica.net/category/production-statistics/Lastaccessed:October16,2014.
Stanford,Jim(2014)Canada’sAuto Industryand theNewFreeTradeAgreements:SortingThroughtheImpacts.CanadianCentreforPolicyAlternatives,April2014.StatisticsCanada(2014)CANSIMTable079-0003.New motor vehicle sales Canada, provinces and territories, monthly.
StatisticsCanada(2014)CANSIMTable228-0059.Merchandise imports and exports, customs and balance of payments basis for all countries, by seasonal adjustment and North American Product Classification System (NAPCS), monthly (dollars x 1,000,000).Unadjusted.
StatisticsCanada(2014)CANSIMTable281-0023.Employment (SEPH), unadjusted for seasonal variation, by type of employee for selected industries classified using the North American Industry Classification System (NAICS), monthly (persons).
StatisticsCanada(2014)CANSIMTable281-0027.Average weekly earnings (SEPH), by type of employee for selected industries classified using the North American Industry Classification System (NAICS), annual (current dollars).
StatisticsCanada(2014)CANSIMTable301-0006.Principal statistics for manufacturing industries, by North American Industry Classification System (NAICS), annual.
StatisticsCanada (2014)CANSIMTable 379-0030.Gross domestic product (GDP) at basic prices, by North American Industry Classification System (NAICS), provinces and territories, annual (dollars). 2007 constant prices.
StatisticsCanada (2014)CANSIMTable 379-0031. Gross domestic product (GDP) at basic prices, by North American Industry Classification System (NAICS), monthly (dollars). 2007 constant prices.