APPROVED Marcel RĂDUCAN, Minister of Regional Development ...
50
1 APPROVED Marcel RĂDUCAN, Minister of Regional Development and Construction Stamp”____”___________2012 PUBLIC POLICY PROPOSAL ON BALANCED URBAN DEVELOPMENT IN THE REPUBLIC OF MOLDOVA CHIŞINĂU 2012
Transcript of APPROVED Marcel RĂDUCAN, Minister of Regional Development ...

1
APPROVED
Marcel RĂDUCAN, Minister of Regional
Development and Construction
Stamp”____”___________2012
PUBLIC POLICY PROPOSAL ON BALANCED URBAN DEVELOPMENT IN THE REPUBLIC OF MOLDOVA
CHIŞINĂU 2012

2
Content
INTRODUCTION.................................................................................................................................... 4
ACRONYMS ............................................................................................................................................ 6
I. BACKGROUND ............................................................................................................................. 7
1.1 General information .................................................................................................................. 7
1.2 Migration/Population................................................................................................................. 8
1.3 Economic Activity ................................................................................................................... 10
1.4 Poverty..................................................................................................................................... 10
1.5 Regional Development in National Strategic Documents ....................................................... 11
II. LEGAL FRAMEWORK ON URBAN DEVELOPMENT IN THE REPUBLIC OF ............ 12
MOLDOVA ............................................................................................................................................ 12
2.1 Legal Frameork of Regional Development ............................................................................. 12
2.2 Institutional Framework of Regional Development ................................................................ 13
2.3 Strategic Framework of Regional Development ..................................................................... 13
LEGAL FRAMEWORK ON URBAN DEVELOPMENT OF THE EUROPEAN UNION .......... 14
3.1 Land arrangement .................................................................................................................... 14
3.2 Sustainable Development ........................................................................................................ 14
3.3 Spatial Development ............................................................................................................... 15
3.4 Urban planning ........................................................................................................................ 15
iii. OTHER COUNTRIES’ EXPERIENCE RELEVANT FOR URBAN DEVELOPMENT ........ 15
4.1 UE Experience – brief historical background ......................................................................... 15
4.2 Romania’s Experience ............................................................................................................. 16
4.3 The Experience of the Baltic States ........................................................................................ 17
4.4 Slovenia’s Experience ............................................................................................................. 17
III. THE NEED FOR INTERVENTION AND THE IDENTIFIED PROBLEM ......................... 17
5.1 The Need for Intervention ....................................................................................................... 17
5.2 Identified Problem ................................................................................................................... 18
5.3 Causes of the Problem ............................................................................................................. 19
5.4 Effects of the Problems ........................................................................................................... 22
IV. OBJECTIVES AND BENEFICIARIES OF PUBLIC POLICY ............................................. 22
6.1 General Objectives .................................................................................................................. 22
6.2 Specific Objectives .................................................................................................................. 22
6.3 Policy Beneficiaries ................................................................................................................. 22
V. OPtions for problem solution ...................................................................................................... 23
7.1 Introduction for the Analysis of Options ................................................................................. 23
7.2 Investment Profile of the North Development Region ............................................................ 23
7.3 Investment Profile of Center Development ............................................................................. 24
7.4 Investment profile of the South Development Region ............................................................ 25
7.5 National Fund for Regional Development .............................................................................. 25
VI. OPtion 0: STATUS QUO ............................................................................................................ 27
8.1 Fiscal Impact ........................................................................................................................... 27
8.2 Administrative Impact ........................................................................................................ 28
8.3 Economic Impact ..................................................................................................................... 29

3
8.4 Social Impact ........................................................................................................................... 30
8.5 Risks ........................................................................................................................................ 30
VII. OPTION 1: establishing economic growth clusters in a single level........................................ 30
9.1 The Theory of Economic Development Clusters .................................................................... 30
9.2 The Case of the Republic of Moldova ..................................................................................... 31
9.3 Fiscal Impact ........................................................................................................................... 34
9.4 Administrative Impact ............................................................................................................. 35
9.5 Economic Impact .................................................................................................................... 36
9.6 Social Impact .......................................................................................................................... 36
9.7 Risks ....................................................................................................................................... 37
VIII. RECOMMENDED OPTION ...................................................................................................... 37
IX. APPENDICES............................................................................................................................... 38

4
INTRODUCTION
The balanced development of cities in Moldova is part of the Action Plan of the Government of the Republic of Moldova for 2011-2014, "Balanced Local and Regional Development" component, "Development of the National Urban Development Program" objective. The Plan will provide for the mechanisms and instruments for the development of city-centers of economic growth, development of the concept of metropolitan area.
As instructed by the State Chancellery of the Republic of Moldova in the second half of 2012 a new stage of the process of development of Public Policy Proposals was conducted based on the ex-ante impact analysis prior to decision. The analyzed topics were agreed between the State Chancellery and each ministry. To this end, the Ministry of Construction and Regional Development has identified the policy proposal related to balanced urban development of cities in the Republic of Moldova.
The process of Public Policy Proposals development was based on the Methodological guide for ex-ante evaluation of the impact of public policies proposed by the State Chancellery.
To ensure the proper preparation and conducting of the impact assessment of Public policy proposals, a Working Group was created on May 17, 2012. The group consisted of representatives of the MRDC, State Chancellery, representatives of local public administrations, academics, development partners and the civil society.
The working group met in 5 sessions and completed a series of steps set out in the Methodological guide proposed by the State Chancellery: problem analysis and identification, definition of objectives, identification and analysis of options. In this context, the macroeconomic indicators required for the analysis from primary and secondary sources were collected, the experience of other countries was studied, various interviews and focus groups were conducted on issues relevant for balanced urban development. Ultimately, the costs and benefits were estimated and the assessment of fiscal, administrative, economic and social impact was performed for each of the proposed options. The public policy proposal benefitted from technical assistance provided by experts from the Republic of Moldova and the EU (Poland, Romania, Spain), with which the Ministry of Regional Development and Construction cooperates under various technical assistance and twinning projects.
Thus, the transparency of development of Public policy proposals related to balanced urban development of cities in Moldova was ensured, by including all stakeholders in the process.
The identified problem concerns the existence of a "pronounced gap in the economic development of cities and towns in Moldova". In this context, the general objective of the Public policy was formulated as follows: "Ensuring sustainable economic development of cities and towns in Moldova".
For a detailed definition and concretization of the general objective, the Working Group, following discussions and analyzes, set the following 2 specific objectives:
1. Increased fixed capital investment per capita in small towns by 35% by 2016 (from 2592 lei per capita in 2010 to 3500 lei per capita in 2016) and by 80% by 2020 (from 2592 lei per capita in 2010 to 4665 lei per capita in 2020).
2. Reduced poverty in small towns by 4 percentage points (from 14.2% in 2010 to 10.2% by 2016) and by 8 percentage points by 2020 (to 6.2%).

5
Options identified in the Public policy proposals were: 0. Status Quo - non-intervention, 1. Establishing economic growth clusters in a single level, 2. Establishing clusters in 2 levels: economic growth clusters and urban development clusters (option disqualified by the working group).
Following the analysis of impacts and generated benefits, the working group proposed to implement Option 1, which involves identifying the following six cities as growth clusters in Moldova, as follows: Edinet, Soroca, Ungheni, Orhei, Cahul, Comrat.

6
ACRONYMS
LPA - Local public administration
SB - State budget
NFRD - National Fund for Regional Development
GD - Government Decision
SADI - Small Areas Deprivation Index
ISPA - Instrument for Structural Policies for Pre-Accession
MRDR - Ministry of Regional Development and Construction
PPP - Public policy proposal
GUP - General urban development plan
NSPP - National spatial plan
NDR - North Development Region
CDR - Center Development Region
SDR - South Development Region
SAPARD - Special Accession Program for Agriculture and Rural Development
EU - European Union
TULN - Territorial unit on the left bank of the Nistru River
NBM - National Bank of Moldova

7
I. BACKGROUND
1.1 General information
The role of cities in the socio-economic development is determinant and significant, as national and regional economies are based largely on the intensity and level of activities in urban centers. Certain cities determine the intensity and the level of development of a country primarily in terms of economic, but also social, educational, cultural etc. development.
Against the backdrop of a highly urbanized Europe, Moldova entered the third millennium as the least urbanized European country1 (41.6% as of January 1, 2011) 2. The role of cities is crucial in ensuring the development of a society, as national and regional economies are based largely on urban centers. In this context, the UN Global Report on cities in 2001 provides for a direct link between the level of development of a society and its level of urbanization and quality of urban management3. Thus, it is already well known that economic growth of a state is a derivative of urban development and regional organization of production factors.
After having declared its independence, Moldova has experienced a series of socio-economic changes. On the background of those changes, most of the cities in the Republic of Moldova (except Chisinau, Balti, Tiraspol, Bender) were affected by the phenomenon of urban decline as manifested by economic decline, rising unemployment, population migration, declining population number. The decrease in revenues of the urban population and related effects, as well as the declining budget of local authorities have resulted in declining public investment in basic infrastructure of cities, deterioration of urban life, with impact on the quality of life of urban and adjacent rural dwellers.
There has been no geographically uniform economic development in Moldova. Therefore, the economic growth has tended to concentrate in certain areas/cities (for various reasons: historical, geographical, political, etc.), leaving other areas and cities in a situation more or less of underdevelopment. The dependence of the socio-economic development of cities on a limited number of large industrial enterprises has led to economic and social problems as a result of their restructuring or closure.
At the same time, urban development faced a number of problems related to the centralized system of decision-making and planning: obsolete general development plans of cities, damaged social infrastructure, the need for reconstruction of existing housing stock, etc.
Although the positive impact of the cities of Chisinau and Balti on the country's development by the driving role in economy is recognized, there are certain imbalances of development, standard of living between these and other towns, but also between regions and cities. Thus, compared with European countries, Moldova is distinguished by a very pronounced economic polarization; half of its gross domestic product is generated in the capital city, where only a quarter of the population is concentrated. The most visible evidence of this economic polarization is concentration of economic activity, of the
1 Ghenadie Ivascenco, „State of the Nation Rreport 2007: Regional Moldova "2009 2 The Republic of Moldova continues to be the country with the lowest degree of urbanization in Europe: 41.6% of people live in urban and 58.4% - in rural areas as on January 1, 2011. 48.5% of the urban population lives in Chisinau. The annual rate of urbanization is 0.9% (2010). Expert calculations, NBS data. 3 http://www.unhabitat.org/pmss/listItemDetails.aspx?publicationID=2101
8
best human resources and infrastructure in the capital. Other cities are some islets of a more or less active economic life. With a high density of businesses, Chisinau concentrates most labor resources employed in economic activities. Since 1995 Moldova's capital has been the largest recipient of investment, which has consolidated its position in relation to other regional cities. Chisinau was able to give companies what they seek in the first place: a market with great potential and an infrastructure of a better quality than in other cities. One of the main causes that led to the concentration of production factors mainly in Chisinau and Balti, which prompted the decision of companies to invest more in these cities is the availability of skilled labor. The needs of skilled labor with relevant skills for companies are easier to be met within these cities, since the most and the prestigious educational institutions in the country are located also here.
This economic - geographical structure is confirmed clearly by a number of indicators: migration, poverty, the number and density of companies, number of employees, value of sales, budget development, etc.
1.2 Migration/Population
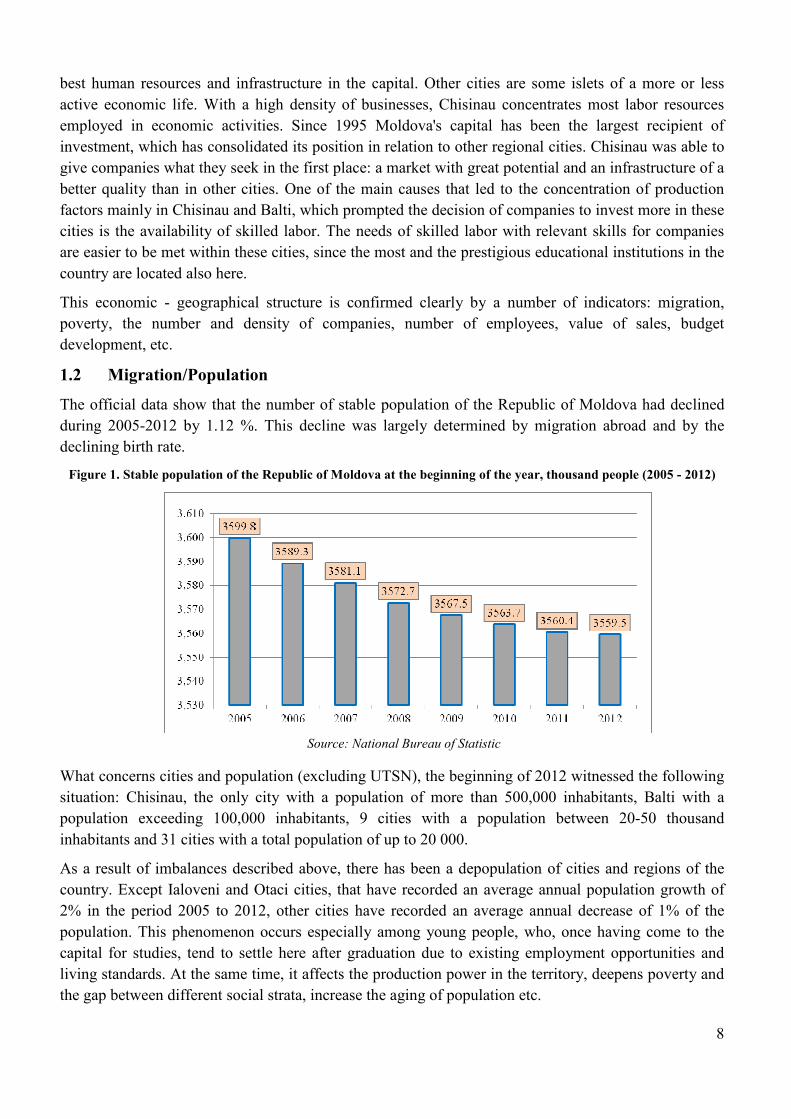
The official data show that the number of stable population of the Republic of Moldova had declined during 2005-2012 by 1.12 %. This decline was largely determined by migration abroad and by the declining birth rate.
Figure 1. Stable population of the Republic of Moldova at the beginning of the year, thousand people (2005 - 2012)
Source: National Bureau of Statistic
What concerns cities and population (excluding UTSN), the beginning of 2012 witnessed the following situation: Chisinau, the only city with a population of more than 500,000 inhabitants, Balti with a population exceeding 100,000 inhabitants, 9 cities with a population between 20-50 thousand inhabitants and 31 cities with a total population of up to 20 000.
As a result of imbalances described above, there has been a depopulation of cities and regions of the country. Except Ialoveni and Otaci cities, that have recorded an average annual population growth of 2% in the period 2005 to 2012, other cities have recorded an average annual decrease of 1% of the population. This phenomenon occurs especially among young people, who, once having come to the capital for studies, tend to settle here after graduation due to existing employment opportunities and living standards. At the same time, it affects the production power in the territory, deepens poverty and the gap between different social strata, increase the aging of population etc.
9
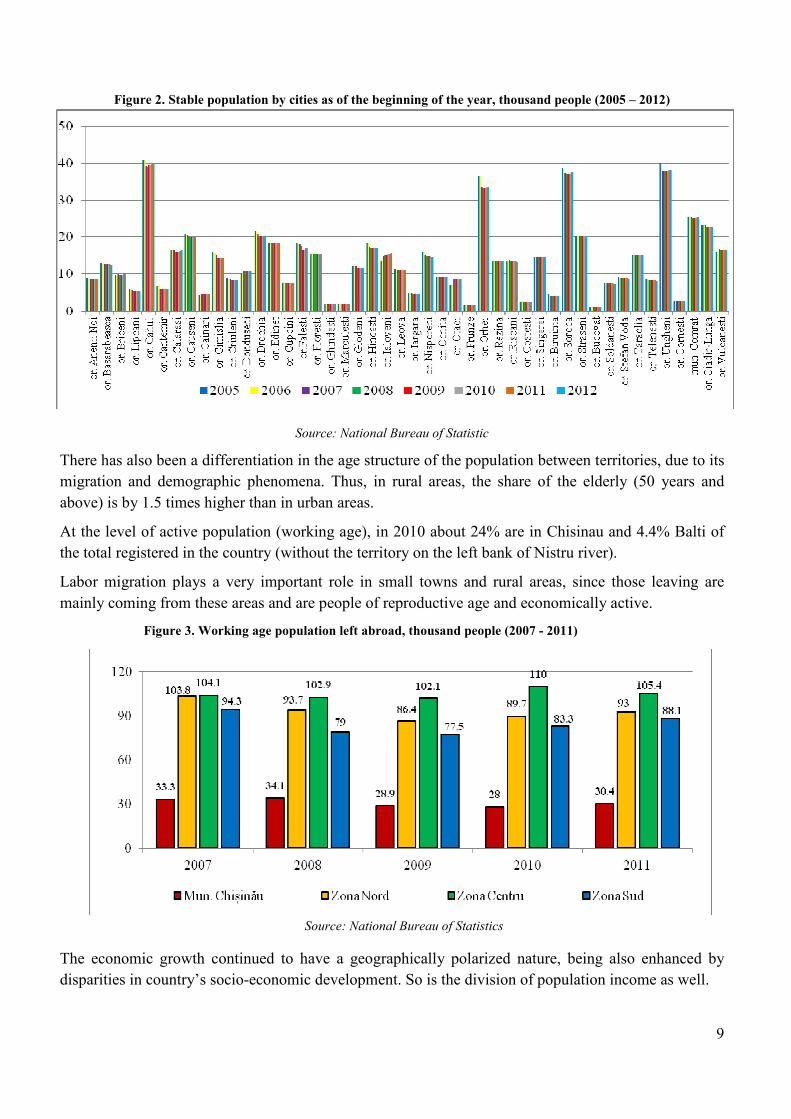
Figure 2. Stable population by cities as of the beginning of the year, thousand people (2005 – 2012)
Source: National Bureau of Statistic
There has also been a differentiation in the age structure of the population between territories, due to its migration and demographic phenomena. Thus, in rural areas, the share of the elderly (50 years and above) is by 1.5 times higher than in urban areas.
At the level of active population (working age), in 2010 about 24% are in Chisinau and 4.4% Balti of the total registered in the country (without the territory on the left bank of Nistru river).
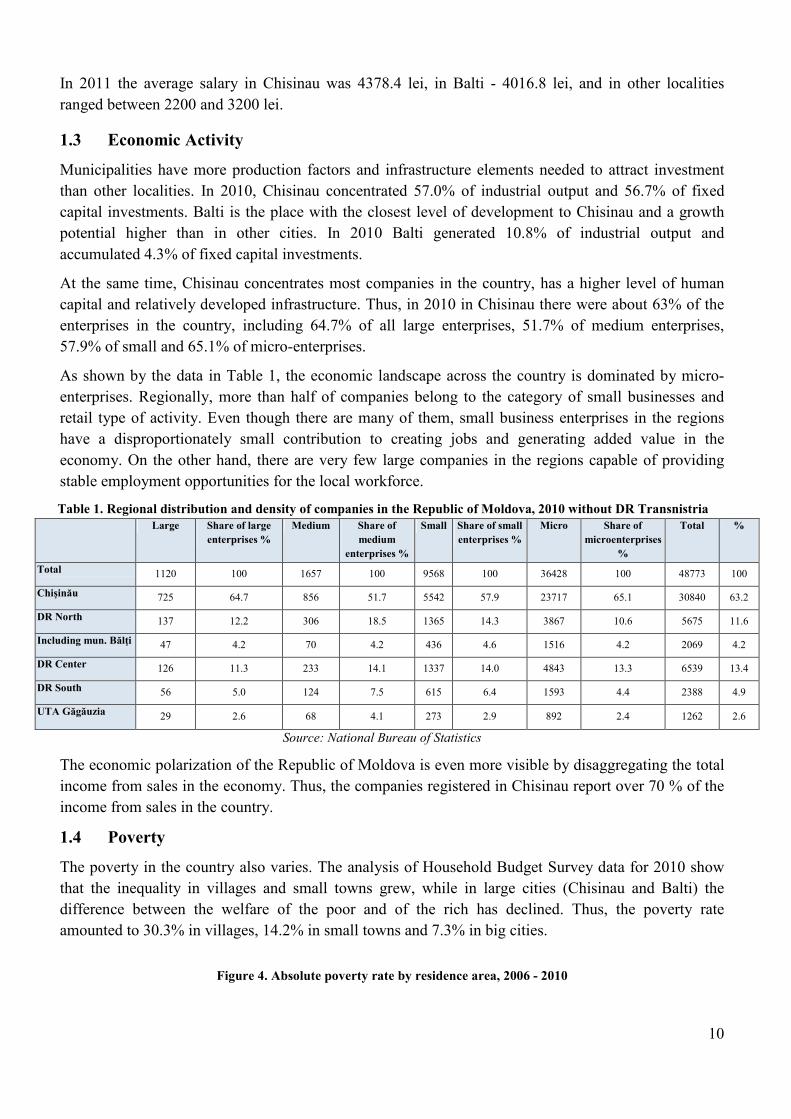
Labor migration plays a very important role in small towns and rural areas, since those leaving are mainly coming from these areas and are people of reproductive age and economically active.
Figure 3. Working age population left abroad, thousand people (2007 - 2011)
Source: National Bureau of Statistics
The economic growth continued to have a geographically polarized nature, being also enhanced by disparities in country’s socio-economic development. So is the division of population income as well.
10
In 2011 the average salary in Chisinau was 4378.4 lei, in Balti - 4016.8 lei, and in other localities ranged between 2200 and 3200 lei.
1.3 Economic Activity
Municipalities have more production factors and infrastructure elements needed to attract investment than other localities. In 2010, Chisinau concentrated 57.0% of industrial output and 56.7% of fixed capital investments. Balti is the place with the closest level of development to Chisinau and a growth potential higher than in other cities. In 2010 Balti generated 10.8% of industrial output and accumulated 4.3% of fixed capital investments.
At the same time, Chisinau concentrates most companies in the country, has a higher level of human capital and relatively developed infrastructure. Thus, in 2010 in Chisinau there were about 63% of the enterprises in the country, including 64.7% of all large enterprises, 51.7% of medium enterprises, 57.9% of small and 65.1% of micro-enterprises.
As shown by the data in Table 1, the economic landscape across the country is dominated by micro-enterprises. Regionally, more than half of companies belong to the category of small businesses and retail type of activity. Even though there are many of them, small business enterprises in the regions have a disproportionately small contribution to creating jobs and generating added value in the economy. On the other hand, there are very few large companies in the regions capable of providing stable employment opportunities for the local workforce.
Table 1. Regional distribution and density of companies in the Republic of Moldova, 2010 without DR Transnistria
Large Share of large
enterprises %
Medium Share of
medium
enterprises %
Small Share of small
enterprises %
Micro Share of
microenterprises
%
Total %
Total 1120 100 1657 100 9568 100 36428 100 48773 100
Chişinău 725 64.7 856 51.7 5542 57.9 23717 65.1 30840 63.2
DR North 137 12.2 306 18.5 1365 14.3 3867 10.6 5675 11.6
Including mun. Bălţi 47 4.2 70 4.2 436 4.6 1516 4.2 2069 4.2
DR Center 126 11.3 233 14.1 1337 14.0 4843 13.3 6539 13.4
DR South 56 5.0 124 7.5 615 6.4 1593 4.4 2388 4.9
UTA Găgăuzia 29 2.6 68 4.1 273 2.9 892 2.4 1262 2.6
Source: National Bureau of Statistics
The economic polarization of the Republic of Moldova is even more visible by disaggregating the total income from sales in the economy. Thus, the companies registered in Chisinau report over 70 % of the income from sales in the country.
1.4 Poverty
The poverty in the country also varies. The analysis of Household Budget Survey data for 2010 show that the inequality in villages and small towns grew, while in large cities (Chisinau and Balti) the difference between the welfare of the poor and of the rich has declined. Thus, the poverty rate amounted to 30.3% in villages, 14.2% in small towns and 7.3% in big cities.
Figure 4. Absolute poverty rate by residence area, 2006 - 2010

11
Source: Household Budget Survey, NBS
Analyzed by statistical areas, the poverty rate is found to be inconsistent between the North, Center and South regions, though with a large difference compared to Chisinau.
Figure 5. Evolution of poverty rate in Moldova, by regions, 2006 - 2010
Source: Household Budget Survey, NBS
1.5 Regional Development in National Strategic Documents
The Government, through the program "European Integration: Freedom, Democracy, Welfare" 2011-2014 committed itself to distribute equally opportunities for sustainable distribute throughout the country, as the country’s small towns are very important elements in promoting territorially balanced economic and social development, particularly through their role as link between the urban and rural areas.
In Moldova, regional development was included in the Economic Growth and Poverty Reduction Strategy for 2004-2006, where it was identified as one of the top priorities "regional development,
improved conditions for sustainable growth throughout the country."
Later, the problem of inter- and intra-regional disparities was also reflected in the National Development Strategy 2008-2011. According to the strategy, regional development was one of the five national priorities with the overall goal of achieving "a balanced and sustainable social and economic development throughout the country by coordinating development efforts within the regions." This

12
document refers to differences in socio - economic development between Chisinau and Balti municipalities and the rest of the country. The regional development model specified in the strategy is reflected in the Law no. 438 - XVI of 28 December 2006 on regional development in Moldova, the objective of which is obtaining balanced and sustainable socio-economic development throughout the country. Thus, both the Strategy and the Law on Regional Development mention the need to accelerate the development of cities as "growth clusters", which would implicitly contribute to regional development. In the first stage of implementation of regional development policy, emphasis was put on some social assistance programs aimed at assisting disadvantaged areas and in a later stage the emphasis will be on focusing efforts to boost growth rates in areas with economic potential.
This PPP aims to intervene in order to boost the development of cities that have economic potential and therefore lead to overall development of the country and fighting disparities. However, the current policy is not intended to limit the development of Chisinau and Balti municipalities, and does not cancel other state policies to reduce regional disparities (e.g. providing social benefits).
Because of insufficient statistical data, the analysis of towns in Transnistria development region has not been made.
II. LEGAL FRAMEWORK ON URBAN DEVELOPMENT IN THE REPUBLIC OF
MOLDOVA
2.1 Legal Framework of Regional Development
In the Republic of Moldova, the legal framework on urban development consists of a set of legal and normative acts, the main of which are:
1. Law no. 764 of 27.12.2001 on administrative-territorial organization of the republic of Moldova; according to the Law, in the Republic of Moldova there are:
• 5 municipalities (Chişinău, Bălţi, Bender, Comrat, Tiraspol);
• 60 towns (including Transnistrian region).
Each city has different relationships with the adjacent area, thus defining the area of urban influence. Most cities (on the right bank) are district centers, which means that they play a significant role (economic, administrative, social) in the rural areas within their area of influence (delimited by district boundaries).
2. Law no. 438 of 28.12.2006 on regional development in the Republic of Moldova defines the main objectives and principles, the functional development regions on the territory of the Republic of Moldova, the manner of interregional cooperation, the institutional framework, specific instruments for regional development policy, means for creation and operation of development regions (1% of revenue approved in the State Budget for the corresponding year). According to the law, the National Regional Development Strategy is developed at the national level, while for each region (North, Center and South) the Regional Development Strategy is developed for each region, identifying priorities and implementing measures at regional level.

13
The regional development model, introduced by the Law on regional development in Moldova provides for the creation of large regions, responsible for strategic planning, which would complement the existing territorial - administrative structure. This approach offers the possibility of reducing costs (by achieving economies of scale) and enhancing the strategic planning capacities, while maintaining public services closer to the people - at local and district levels.
3. Law no. 835 of 17.05.1996 on Urban Planning and Spatial Planning Principles. According to the law, one of the major objectives of spatial planning is the balanced economic and social development while respecting the specificity of each area and improving the quality of human life and human communities;
4. Law no. 436 of 28.12.2006 on local government provides the basic principles of local government: local autonomy and decentralization of public services.
5. GD No. 127 of 08.02.2008 on the measures to enforce the Law no. 438 - XVI of 28.12.2006 on
regional development in the Republic of Moldova, which includes the following:
• Regulation of the National Coordination Council for Regional Development;
• Framework Regulation of the Regional Development Council;
• Framework Regulation of the Regional Development Agency;
• Regulation on formation and use of funds of the National Fund for Regional Development.
2.2 Institutional Framework of Regional Development
The law on regional development provides for two levels of organization of the institutional framework for regional development: national and regional level.
National level:
• National Coordination Council for Regional Development;
• Ministry of Regional Development and Construction (General Directorate for Regional Development);
• National Fund for Regional Development.
Regional level:
• Regional Development Councils (North, Center, South);
• Regional Development Agencies (North, Center and South).
2.3 Strategic Framework of Regional Development
National level:
• National Strategy for Regional Development (2010 - 2012)4 - Single Document Program (2010 - 2012) - Annual implementation plan
Regional level
• Regional Development Strategy (for each of the regions North, Center and South) 2010 - 2016 - Regional Operation Plan (2010 - 2012), approved by the RDC - Annual Activity Plan
4 A new Strategy is currently being developed.

14
According to the law no. 438 of 28.12.2006 on regional development in the Republic of Moldova, the country is divided into 5 regional development regions, of which only 3 (North, Center and South) are currently operating:
Table 2. Structure of Regional Development Regions, according to the Law no. 438 of 28.12.2006 on regional
development in the Republic of Moldova
Development regions Administrative-territorial units Inhabitants in the
region (early 2012)
North
Bălţi municipality, the districts: Briceni, Donduşeni, Drochia, Edineţ, Făleşti, Floreşti, Glodeni, Ocniţa, Rîşcani, Sângerei, Soroca
1,002,600
Center
Districts: Anenii Noi, Călăraşi, Criuleni, Dubăsari, Hînceşti, Ialoveni, Nisporeni, Orhei, Rezina, Străşeni, Şoldăneşti, Teleneşti, Ungheni
1,062,000
South Districts: Basarabeasca, Cahul, Cantemir, Căuşeni, Cimişlia, Leova, Ştefan Vodă, Taraclia
538,900
Autonomous territorial
unit Găgăuzia Comrat, Ceadâr -Lunga, Vulcăneşti 161,700
Chisinau municipality 794,800
Transnistria Administrative territorial units on the left bank of Nistru river, including Tiraspol and Bender municipalities
-
LEGAL FRAMEWORK ON URBAN DEVELOPMENT OF THE EUROPEAN
UNION
3.1 Land arrangement
• Spatial Development Scheme - EU, Potsdam, May 1999
This document establishes guidelines for spatial development policy in the EU: developing a balanced and polycentric urban system and a new town - rural areas relationship; ensuring parity of access to infrastructure and information, sustainable development, smart management and protection of nature and cultural heritage.
• European Territorial Agenda, May 2007
In the context of territorial cohesion policy, the Agenda established polycentric development and innovation by creating networks of urban areas and cities as a priority. In this context, it is stipulated that cities that function as regional centers should cooperate as parts of polycentric pattern to give a part of their added value for other cities in rural and remote areas and in areas with challenges and specific geographical needs.
3.2 Sustainable Development
• Leipzig Charter on Sustainable Development of Cities, 24 - 25 May 2007
This document states that Europe needs strong cities, and integrated urban development should be applied consistently across Europe, the best framework being the one established at national and European level.

15
• Toledo Declaration on Urban Development, June 22, 2010
This statement reiterated the need to promote smarter, sustainable and socially inclusive urban development. Thus, it stressed the need to implement integrated urban development strategies, adopting a holistic and comprehensive vision of the city, with regional development perspective to promote in a harmonious and integrated manner all dimensions of urban sustainability, as well as new developments and existing areas of the city as a benchmark.
• The document Rio +20 "The Future That We Want," June 22, 2012
The main objectives of this document are: 1. Promoting green economic development in the context of sustainable development and poverty reduction; 2. Strengthening institutional network to promote sustainable development. One of the thematic areas of the document is sustainable urban development and human settlements. Thus, it is stipulated that if cities / human settlements are well planned and developed, especially by using integrated planning and management tools, they can ensure and promote the development of a sustainable society in terms of economic, social and environmental issues.
3.3 Spatial Development
• European Perspective on Spatial Development - Potsdam, May 1999
This document states clearly that in order to ensure a balanced regional development it is necessary to focus on a polycentric approach, thus avoiding concentration of resources, population and economic development only in certain urban centers. Thus, the concept of polycentricism is a central instrument adopted by the EU as the main means of balancing the future spatial development.
3.4 Urban planning
• European Parliament resolution no. 2008/2130 (INI) on the urban dimension of cohesion policy stresses the importance of prioritizing funding for projects related to urban development plans
• The European Commission launched "Guide on urban dimension in community policies" for actors involved in urban development. It identifies initiatives with direct and indirect implications on urban development and provides an overview of Community policies for the period 2007-2013.
III. OTHER COUNTRIES’ EXPERIENCE RELEVANT FOR URBAN DEVELOPMENT
4.1 UE Experience – brief historical background
The Working Group for PPP development examined the experience of Romania, the Baltic States and Slovenia in regional and urban development. These experiences are relevant for Moldova due to similarities in territorial size, population, history, mentality, etc.

16
• The year 1986 is marked by adoption of the Single European Market Program and signing of the Single European Act. The Single European Act lays the foundation for an independent cohesion policy.
• The year 1988, in parallel with a considerable increase in the Community budget allocations, is marked by recognition of the importance of Structural Funds, a name used for solidarity funds aimed at reducing regional disparities at the community level.
• With the entry into force in 1993 of the Maastricht Treaty, the economic and social cohesion becomes, together with economic and monetary union and the single market, one of the main objectives of the European Union (EU). Also, the Cohesion Fund is established, in order to support environmental and transport projects in the least prosperous Member States (Spain, Portugal, Greece, Ireland).
• In 2000, to promote economic and social development of the countries of Central and Eastern Europe, candidates for accession to the European Union, the PHARE program is complemented by the Instrument for Structural Policies for Pre-Accession (ISPA) and the Special Accession Program for Agriculture and Rural Development (SAPARD).
• The Treaty of Lisbon (2007) adds without changing fundamentally the legal provisions of cohesion policy, a new dimension, namely "territorial cohesion", with an impact on the understanding and implementation of cohesion policy. The "Community Strategic Guidelines on Cohesion 2007 - 2013", which sets out guidelines for the cohesion policy for the period 2007 - 2013, specifies the ways in which urban dimension of cohesion policy can be taken into account in preparing operational programs financed from structural Funds: actions to promote cities as motors of regional development, aimed at increasing competitiveness, support actions to promote internal cohesion of cities by supporting distressed neighborhoods, particularly through environmental rehabilitation, rehabilitation of certain areas, conservation and development of cultural and historical heritage, actions aimed at promoting a balanced, polycentric development of the territory of the European Union, by developing national and community urban networks.
4.2 Romania’s Experience
In Romania, the regional development policy began to take shape with the PHARE program operation in 1996. Two years later, in 1998, the legal framework for its development was established, by Law no. 151 of July 15, 1998 on regional development in Romania, which sets national policy objectives in the field, the institutions involved, specific skills and tools to promote regional development policy. Currently, in Romania there are 8 development regions, formed by voluntary association of neighboring counties without being territorial administrative units and without having legal personality. The main objective of regional development policy was aimed at reducing regional imbalance, especially by stimulating balanced development and revitalization of disadvantaged areas (with delayed development) and preventing the creation of new imbalances. Later, in conjunction with the country’s regional development policy in the process of developing the National Strategic Reference Framework 2007-2013 (NSRF), among the strategic objectives for 2007-2013, the need to support the development of existing growth clusters or clusters under development was established. So, the Romanian reference document for programming Structural and Cohesion Funds, established a strategic priority dedicated to promoting balanced regional development. Under this priority cities are considered key elements to achieving the objective of ensuring social, economic and territorial cohesion at the national level, mentioning that urban areas "act as engines of economic development for regions and sub - regions

17
and, in particular, for the neighboring areas." 5 In this context, it is stated that the focus will be to create conditions to explore the urban potential, the economic growth of cities, creating jobs and promoting social cohesion in the regions.
4.3 The Experience of the Baltic States
The regional policy in Lithuania is seen as executed by:
• Means to mainstream regional dimension into sectoral strategies and programs (horizontal approach);
• Regional programs for solution of very specific regional problems (vertical approach);
• Local and regional initiatives funded from local budgets, state budget, EU’s structural support (vertical approach).
In Estonia, the regional development policy aims at economic development of all regions, not just those disadvantaged. Thus, the development regions in Estonia, 12 in number, were concentrated around the major urban areas. The Regional Development Strategy of Estonia, 2005-2015, expressly states that the overall objective of regional development policy by 2015 is to ensure the sustainable development of all regions, taking into account the benefits of development and inherent characteristics of each region, as well as the competitive advantages of each region. The basic principles of regional development policy in Estonia were focused on supporting local initiative, the sustainability of development projects and supporting innovation. Urban areas have played a special role in regional development policy and are perceived as genuine regional development centers.
4.4 Slovenia’s Experience
Today Slovenia is one of the most polycentric European countries, despite the fact that it is a small country in size. This is largely due to effective synergy of regional and spatial development policies. Thus, the concept of polycentric development was used both as a tool for development of urban centers and as a tool for balanced development. There are no administrative regions in Slovenia. According to the statistical tool NUTS 3, in Slovenia there are 12 development regions, which are mainly concentrated around urban centers. Regional and spatial development policy in Slovenia has been directed mainly to the economic development of regions, rather than to reducing disparities.
III. THE NEED FOR INTERVENTION AND THE IDENTIFIED PROBLEM
5.1 The Need for Intervention
The need for intervention results from the key concerns identified during problem analysis, and namely:
• Concentration of economic growth, driven by investment in the fixed capital in Chisinau and Balti areas. This resulted in the increase of disparities between the capital and Balti and other cities and development regions. Thus, Moldova is likely to lose its urban / regional economic development support centers;
• Socio - economic decline of many urban centers and their declining role in the development of adjacent areas;
5 National Strategic Reference Framework 2007-2013 Romania, pag.121.

18
• Loss of urban functions of many cities, generated by industrial restructuring, mass migration of the population;
5.2 Identified Problem
The economy of the Republic of Moldova has recorded during the last decade an economic growth, which was not enough to solve serious social problems and eradicate poverty. It also failed to reduce the development gap with the developed countries and the region. Compared with the European countries, Moldova is distinguished by a very pronounced economic polarization. One reason for this is explained by the slow development of the country’s regional centers. In this context, the identified
problem for this policy is formulated as follows: "Gap in the economic development of cities in the
Republic of Moldova". Appendix 1 shows the problem tree which was developed and discussed within the working group.
Rationale: For various reasons (previously described above) the cities in Moldova experienced a different level of economic development. Chisinau is the most advanced area. The phenomenon observed today is the large gap in development between the country’s localities, primarily between big cities (Chisinau and Balti) and other towns, as well as between small towns. This phenomenon, and as well as the economic growth is measured by a Proxy
6 indicator - investment in fixed capital, as it explains, to a large extent, the cities’ development level. Thus, in 2010, Balti had 2.5 times less investment in fixed capital per capita compared to Chisinau (3794.7 lei vs. 9431.5 lei), while the rest of the country had, in average, 4.8 times less investment in fixed capital per capita compared to Chisinau (1946.1 lei vs. 9431.5 lei).
On the other hand, urbanization is in many ways a beneficial phenomenon, as it leads to increased economies of scale, concentration of resources and population, growing rates of return, etc.
Investments are necessary to generate regional growth, create more jobs, ensure better remuneration of employees and improve business and financial performance.
6 In statistics, a Proxy indicator may not, in itself, measure a phenomenon directly, but it may be determined or represent a
"condition", if no data are available.

19
Figure 6. Investment in fixed capital per capita by districts, 2010
Source: Map developed by experts based on National Bureau of Statistics data
5.3 Causes of the Problem
There are many reasons for small investments per capita in the cities of Moldova (except Chisinau and Balti) and these are grouped into several categories: causes related to the limited scope of services in regions, deficient tax system and limited economy of scale, causes related to poor management of development processes, causes determined by limited access to transport hubs, another group of causes related to low interest of investors in cities in the regions and a group of causes related to outdated or nonexistent planning tools.
Limited scope of services and lack of infrastructure in cities is one of the causes of the identified problem. Thus, the economic entities are willing to invest in places where there is some kind of more or less developed infrastructure.

20
Tax system deficiency has been identified as another cause of low investment in cities in the regions. The current public finance system creates a moral hazard, because local authorities have no motivation to broaden the tax base and increase their revenue share, they rely heavily on transfers made from the center. The local authorities do not have their own sources of significant income and cannot take decisions and solve many problems independently. Local taxes generate small amounts, which account for a small share of local budgets - less than 15% of local budgets. Moreover, it has been noted that LPA authorities have a limited ability to change the level or the basis of local taxes provided by the Tax Code and to establish their own tax breaks for local taxes. The tax system deficiency is also determined by an eroded tax base. This leads to its restriction, to decrease in own local revenues and reduced tax equity by favoring certain undertakings or social groups.
Another sub-cause of tax system deficiency is the inefficient system of transfers between CPA and LPA, which discourages the localities’ own tax effort. Currently, LPA budgets are supplemented by transfers based on the principle of equity. Thus, the LPAs which have the capacity to increase their revenues through own initiatives can be put in the position of being penalized indirectly by reducing the amount of transfer to the local budget. Another shortcoming of the system is related to the unjustified transfer in two steps - first to the budget of districts and then to the budgets of Ist level LPAs.
The financial system deficiency is also a result of the fact that in Moldova the transfer of responsibilities was not performed in parallel with the transfer of resources required for their fulfillment. This led to pronounced vertical imbalances in funding. Thus, the exercise of these powers is difficult and sometimes even impossible for smaller administrative - territorial units or those with reduced budgets. At the same time, there is no mechanism that would guarantee the financial resources necessary in the medium and long term for the exercise and performance of powers transferred by the state.
Reduced economy of scale; the Republic of Moldova is a geographically small country, and distances between localities are very small. These small distances have no beneficial role in strengthening the economic integrity of the country, as long as some localities are practically isolated from others because of poor transport infrastructure and because these communities are not attractive as a place to live. Consequently, this leads to depreciation of human and productive capital. This prevents exploitation of comparative advantages that these communities have in the regional and national economy.
Insufficient management of local development processes is another cause of the low level of investment in the cities of the regions. This is in turn determined by other sub-causes related to the capacity of the LPA in managing these processes and lack of transparency. Many local authorities do not perceive attracting investments as part of their skills and priority obligations. Thus, they understand attracting investments as promotion of community development projects funded by international donors and not encouraging private, local or foreign investment. The sustainable economic development of cities and regions largely depends on the capacity of local authorities to identify specific opportunities for private investors and to promote them in a manner beneficial to citizens and investors. In this context, it adds another sub-question related to transparency. Thus, many companies are not satisfied with the quality of dialogue and transparency of interaction with LPA. For instance, they complain about not very good relations with local authorities7 since the latter do not provide access to public property in a transparent
7 This information was received in the focus groups held with businesses

21
and fair manner. Moreover, it is noted that public authorities often unlawfully retain issuing the necessary documents that would allow starting the production process. Modest developments of towns in the region have also been caused by the fact that the tax base applied by local authorities can be an eroded one. Narrowing the tax base compared to funding needs is demonstrated by the continuous decrease of current income share. Thus, In 2004 current revenues exceeded 50% of the total revenue of the budgets of IInd level territorial administrative units, while in the first half of 2009 it barely reached a quarter of total revenues. The decline in revenues was caused not only by unfavorable economic developments, but also by certain legislative decisions, such as the introduction since 2008 of zero tax on reinvested income and revenues belonging to the administrative units. All these causes are complemented by the unfair distribution of resources to maintain urban housing.
The limited access of the towns in regions to transport hubs is another cause of low investment in the regions. This is determined both by road network density and road infrastructure quality. Thus, poor quality roads may reject a number of investors from investing capital in regional towns, choosing rather to invest in Chisinau and Balti, which have a relatively developed road infrastructure.
Low investment in towns in the regions and largely due to the low interest of investors in these towns. In this context, according to a number of investors, complex regulations by IInd level local authorities often influence the business environment in that locality, generating corruption and reducing the investment attractiveness of the locality8. Such abusive regulations are largely related to issuance of certificates of operation of the business units, issuance of building authorizations, urban planning certificates and land lease. Moreover, the low attractiveness of towns for investment is determined also by the lack of qualified human resources necessary for economic activities9. Thus, it was found that in districts / cities where there are educational institutions (vocational schools, colleges), companies are tempted to invest more.
Outdated or nonexistent planning tools are another cause of low investment in the regions. Many localities in the country have not drawn clear and realistic prospects of long-term economic development. Currently few of localities in Moldova have credible development strategies or socio - economic development plans. Even if they do something in practice to attract investment, these are rather some sporadic activities. It is also noted that many localities do not have urban spatial plans. According to the Ministry of Regional Development and Construction, 57 urban localities currently have planning documentation developed and in 19 localities such documentation is under development, this number accounting for 29% of the total urban localities. It was also found that most of the General urban plans of localities are not integrated into the strategies for socio - economic development, and this has a negative impact on the sustainable development of communities.
8 Valeriu Prohniţchi, Alex Oprunenco, Ana Popa, Adrian Lupuşor, „Investment Attractiveness of the Regions of the
Republic of Moldova”, Chişinău 2010. 9 Focus group held with entrepreneurs from Development Regions

22
5.4 Effects of the Problems
This problem affects urban development in the regions and results in the damage of the existing infrastructure. These in turn produce effects on the low level of own revenues of towns which consequently will have a major impact on the incomes of the population in the regions, and the gap in the income of the population in the regions and the capital city will be even more pronounced. Thus, the gap in income levels and in the standard of living of the population in towns in the regions compared to the population of Chisinau and Balti is quite pronounced. In this context, the average salary in 2011 was MDL 4378.4 in Chisinau and 4016.8 in Balti, while the national average amounted to 3193.9 lei. Non-intervention in the current situation may lead to even deeper gaps in the future. The low income of the population in the regions affects public welfare and living conditions and the lack of income consequently results in a higher index of poverty and other social problems derived from them.
Moreover, the lack of investment in the regions reduces the possibility of employing local people, leading ultimately to increased unemployment. All these short backs increase the risk of migration, both internal and external. A part of the population will continue to migrate to the capital, and some will seek a job abroad. These phenomena may ultimately result in depopulation of regions and decrease the demographic index.
Another effect of the problem is related to concentration of production factors mainly in Chisinau and
Balti, since these two towns / cities have the best climate in the country for an economic activity, the best human resources and the best infrastructure.
IV. OBJECTIVES AND BENEFICIARIES OF PUBLIC POLICY
6.1 General Objectives
The general objective defined for the purpose of implementing the public policy proposal is: “Ensuring sustainable economic development of towns in the Republic of Moldova”.
6.2 Specific Objectives
• Increased investment in fixed capital per capita in small towns by 35% by 2016 (from 2592 lei per capita in 2010 to 3500 lei per capita in 2016) and by 80% by 2020 (from 2592 lei per capita in 2010 to 4665 lei per capita in 2020);
• Reducing poverty in small towns by 4 percentage points (from 14.2% in 2010 to 10.2% by 2016) and by 8 percentage points by 2020 (to 6.2%).
6.3 Policy Beneficiaries
The concept of public policy proposal was established as developed for the following categories of beneficiaries:
1. Urban population 2. Population from areas adjacent to urban localities 3. Ist and IInd level public administration authorities.
In this context, the designed public policy proposal will help increase the level of economic development not only through interventions at the central level, but also with the active involvement of
23
the aforementioned categories, which are some of the conditions necessary for a good implementation of all planned activities.
V. OPTIONS FOR PROBLEM SOLUTION
7.1 Introduction for the Analysis of Options
3 options have been identifies for the public policy proposal, namely:
Option 0. Status quo – nonintervention; Option 1. Establishment of economic growth clusters in a single level; Option 2. Establishment of clusters in two levels: economic growth clusters and urban
development clusters10.
According to the Law no. 764 of 27.12.2001 on administrative-territorial organization of the Republic of Moldova, there are:
• municipalities (Chisinau, Balti, Bender, Comrat, Tiraspol);
• 60 cities and towns (including the transnistrian region). Each town has different relationships with the adjacent area, thus defining its area of urban influence. Most towns (on the right bank of Nistru river) are district centers, which means that they play a significant role (economic and administrative) in areas within their area of influence (delimited by district boundaries). Overall, among development regions, the highest concentration of towns is in the North (20 of the total of 60 towns), and the lowest in the Region ATU Gagauzia (4 towns. In South Development Region there are 10 towns and in the Central Development Region - 14. Of all towns, 31 towns in the Republic of Moldova have a population of less than 20 000 inhabitants, 9 towns have between 20 - 50 000, 1 town (Balti) - 143 thousand, and Chisinau - 663 thousand inhabitants.
7.2 Investment Profile of the North Development Region
The North Development Region11 is positioned, compared to CDR and SDR relatively better in terms of current investment, stability and diversification of investment flows. In the North Development Region there are more economic opportunities for the employment of the population, migration flows are less intense and entrepreneurial attractiveness remains traditionally stronger than in other regions of the country. The towns in the North Region revolve economically and commercially towards Balti municipality, which is basically the pivot of the whole region and the economic development center that serves as a good prerequisite for the development of small and medium-sized enterprises located in the towns of the region. Also, some towns in the Northern Region (especially Briceni, Lipcani and
10 Another option proposal from the working group was to identify clusters in 2 levels: economic growth clusters and urban development clusters. The premise for the idea is that most cities are district centers and besides their administrative role they can attract a certain funding for investment, thereby boosting both their development and the development of localities in their area of influence. Such a structure of clusters exist in countries with a large territory and where the need for several levels of development centers for coverage is justified. For the current policy this option was discarded, because the concept is inconsistent with option 1 and is, in fact, an alternative option, or it largely repeats the status quo. From a practical perspective, the combination of growth clusters + urban development clusters may be achieved when the same percentage of the budget will be allocated to both clusters, to minimize the impacts of the policy. 11 Adrian Lupuşor, Alex Oprunenco, Ana Popa, Victor Prohniţchi, Iulia Sîrghi, Valeriu Prohniţchi „Investment Problems and Solutions for the Northern Region”, Expert Group, Chişinău 2010

24
Ocnita) are attracted by other economic centers as well, such as Moghiliov - Podolskii and Chernivtsi (Ukraine) and Botosani (Romania), while Soroca by Iampoli, Ukraine. These cross-border economic links lead to strengthening internal cohesion of Northern Development Region.
The North DR is the place of intersection of major national and international transport road and rail arteries. The infrastructure potential of the region is completed by the former military airport of Marculesti converted into free economic zone. Regarding the intra-regional road network, the distance between the extreme points is about 170 km north-south and about 130 km on the west-east direction. On average, the towns in the North DR are located at a distance of 55.3 km from the city of Balti. The total length of public roads in North DR is about 3.4 thousand km or 36.2 of the total length of roads in the country. Of these 31% are national hard surface roads. The density of railroad in Northern DR is of 33.6 km/100km2. The density of railway network in North DR is the lowest in the country - 2.1 km/100km2 and is below the average in the country. The main railway nodes of North DR are in Balti and Ocnita12.
The towns in North DR are, overall, more industrialized than in the Center and South DR, mainly due to the large number of industrial enterprises in Balti, Edinet, Cupcini, Drochia, Floresti and Soroca. Over 50% of industrial potential is concentrated in Balti. Agriculture is very important for the districts of North DR, especially for the towns adjacent to Balti (Glodeni, Sangerei, Riscani) and serves as sources of agricultural products for the population of the city. All sugar industry of the country is located in the region.
7.3 Investment Profile of Center Development
The Center Development Region13 ranks first in terms of investment attractiveness. Since the region is located around Chisinau, investment processes are largely influenced by it. The main cluster of the country influences the adjacent towns from the Central Region both beneficially for the investment processes (providing larger markets for the sale of food and agricultural products of towns adjacent to the capital city) and negatively by absorbing a large part of investment, providing better production and social infrastructure to investors than any other place in the country.
Although the towns in the Central Region cities also have some industrial potential, it is mainly represented by wine factories, dairy or meat products, i.e. food and wine-growing related industries (Hincesti, Calarasi, Nisporeni, Straseni, Orhei). 14
In terms of infrastructure, the Central Region has the following features: regarding the interregional road network, it is found that the maximum distance between the localities of the central region on North-South direction is around 180 km, and on the East - West - 120 km, providing for the possibility of linking localities through transit through Chisinau. The distance between the main urban centers (Ialoveni, Straseni, Ungheni, Orhei, Hancesti) does not exceed 150 km.
The Central region is crossed by a dense network of international roads: European Economic Corridor IX, Budapest - Odessa Economic Corridor, Giurgiulesti-Briceni Corridor.
12 Ministry of Regional Development and Construction, Regional Development Strategy, Development Region Center, approved by Center Regional Development Council no. 04/02 of 23.03.2010. 13 Adrian Lupuşor, Alex Oprunenco, Ana Popa, Victor Prohniţchi, Iulia Sîrghi, Valeriu Prohniţchiţchi „Investment Problems and Solutions for the Center Region””, Expert Group, Chişinău 2010 14 Ministry of Regional Development and Construction, Regional Development Strategy, Center Development Region, approved by Center Regional Development Council 04/02 din 23.03.2010.

25
7.4 Investment profile of the South Development Region
The South Development Region15 has been historically less developed by the Center and North regions. Despite the fact that there was no essential difference a decade ago between DD South and DR ATU Gagauzia in terms of investment attractiveness and quality of business processes at regional level (the two regions forming a natural economic region), the ATU Gagausia has recently shown a more pronounced investment dynamic, exceeding in this context the investment performance of the South DR. In terms of economy, South DR does not revolve around a more pronounced internal economic center such as Balti for North. South DR is more focused on agriculture compared to other regions.
Infrastructure: The total length of public roads in South Development Region accounts for about 22.4% of the total length of roads in the country. Of these, 23.7% are national roads with hard surface and 21.7% local roads, of which only 20% have rigid pavement. Because of the much lower density of local roads compared to DR Center and DR North and very poor quality of these roads, major urban centers have direct transport links or links through the town of Cimislia, which plays the function of point of transit between South and South - East regions. The density of the railway network in South DR is 4.7 km / 100km2, which is the highest compared to the average for the country of 3.3 km/100km2. DR South is the only region with access to the see through the coastal portion of the Danube river, namely the Giurgiulesti port. Ther3e are 3 free economic zones in the region: the FEZ "Tvardita", "Production Park Taraclia" and Giurgiulesti International Port.
7.5 National Fund for Regional Development
The Fund accounts for 1% of revenues to the state budget for a fiscal year. According to the Operations Manual, the NFRD is the main source of funding through which the Regional Development Agencies may sign contracts on provision of works and services, procurement of goods, aiming explicitly at promoting regional development. From the operational point of view, the funds for the regional development projects are provided to the RDAs through the Treasury of the Republic of Moldova. Currently, the NFRD pursues two framework objectives, namely:
1. Allocation of resources to support the development of regions, especially in disadvantaged areas;
2. Enhancing possibilities / functional capacities of institutions capable of implementing regional development strategies.
Thus, the first objective of regional development provides for a balanced and sustainable socio-economic development throughout the country and reducing of disparities between the socio-economic development levels of different regions / areas and those within each area. The distribution of financial allocations from the National Fund for Regional Development during the years 2008-2012 is shown in Figure 7.
Figure 7. Budget allocated to NFRD for the years 2008-2012, million lei
15 Adrian Lupuşor, Alex Oprunenco, Ana Popa, Victor Prohniţchi, Iulia Sîrghi, Valeriu Prohniţchi „Investment Problems and Solutions for the South Region”, Expert Group, Chişinău 2010

26
Source of data: MRDC
The first call for proposals, financed from the NFRD took place in 2010. After the first call 135 applications were submitted, of which 56 projects were included in the Single document program for
2010-2012. Are currently being implemented 2916 projects are currently being implemented. The established funding priorities are:
1. Rehabilitation of physical infrastructure 2. Support for private sector development, especially in rural areas; 3. improving the environment and tourism attractiveness.
The beneficiaries eligible to participate in the call for proposals are 1st and 2nd level LPAs. According to application instructions, projects with a regional impact, fulfilling the conditions concerning the quality, maturity and sustainability of the project are selected. Currently, the funding is provided only if the project proposal can result in achievement of priority objectives. No criteria are established that would make any reference to the rate of economic recovery and the economic impact of the project on adjacent area or region. Thus, of the 31 projects accepted for funding from NFRD, following a call for proposals in 2010, 12 were submitted by towns’ mayoralties. Other projects were submitted by rural localities, without meeting the criteria of economic profitability. Thus, both towns and rural areas are left for free competition by accessing funding from the same source, without having a separate axis for each of them17. So far, financial resources from the NFRD were targeted as a priority to disadvantaged areas. Thus, the funded projects have rather the character of social assistance programs aimed at providing support to disadvantaged areas and not further enhance growth rates in areas / towns with economic potential. Following the second call for proposals 202 concept notes were registered. Districts that submitted most concept notes are: Orhei - 18, Ialoveni-14, Hincesti - 13, Leova-10, Cahul - 9, Cimislia - 9. This shows the ability of LPA in writing projects and attracting investments and a better identification of problems facing local communities.
Further, we will analyze these options, the advantages and the predictable risks, as well as their fiscal, administrative, economic and social impact.
16 There was a total number of 31 projects, but 2 of them were completed in 2011 17 See the experience of Romania and Poland

27
VI. OPTION 0: STATUS QUO
The towns of Moldova play an important role primarily because they concentrate a large part of the population - 673 thousand in early 2011, accounting for approx. 19% of the total (without Chisinau, Balti and the territory on the left bank of Nistru river). This figure has been decreasing during the recent years and most likely will continue to decline. Chisinau plays a dominant role for the national economy and will continue to play it, followed by Balti. The other towns will have the same local role, first as regional centers (most) and as a market for farmers in the district. The quality and the productivity of the labor force will continue to be below the level of the first two cities, and may gradually degrade due to migration. Gaps will increase in the level of investment and economic activity in localities which will revolve around Chisinau, followed by Balti (in 2010, about 66% of companies were concentrated in Chisinau and 4.4% in Balti). This, however, will negatively affect incomes of the remaining cities (average nominal salary in 2011 was 4378 lei in Chisinau, 4017 in Balti, while the average salary in other cities was 2720 lei). However, the potential and infrastructure will remain under the required level. According SADI in 2009, only 54% of towns (except Chisinau and Balti) had more than 2/3 of road rigid coated. An argument in favor of the status quo is that 1% of the state's budget allocated to the NFRD allows the towns to apply equally for financing development projects. However, the experience shows that most projects are more social in nature, aimed at disadvantaged urban areas without relying on performance and competitiveness indicators. Preserving the current situation will result in continuing non-uniform practices for approving projects without submitting economically motivated applications in large part because of the limited capacity of LPAs. This was demonstrated by the use of money from the fund to date: 135.4 million lei were allocated in 2010, of which 113.75 million were capitalized; 163.8 million were allocated in 2011, of which 122 were capitalized. Another argument in favor of the status quo is that a document is being prepared currently by which some district centers, i.e. Soroca, Ungheni, Orhei and Cahul will be granted the status of municipalities. If the document is approved and these towns will become municipalities, a positive change in the role of these cities for the economic development of tows and regions and the standard of living of the population may take place18.
8.1 Fiscal Impact
The fiscal impact was analyzed in terms of efficiency of regional development projects financed from the state budget, regardless of the fund or shape through which investments were made. Thus, the comparative analysis of investing a conventional amount of 100 million in development projects for the towns of the country (except municipalities Chisinau and Balti and cities in the region on the left bank of the Nistru river) was performed for the period 2013 to 2020. Calculations are presented in the table below. As shown, costs occur in the first two years (based on previous project implementation experience) and benefits begin to appear from year 3.
Table 3. Fiscal impact, status quo option
Years 2013 2014 2015 2016 2017 2018 2019 2020
18 Concept on granting the municipality status to several cities, district centers, working document

28
Status quo
Cost, million lei 50.0 50.0 0 0 0 0 0 0 Benefits, million lei 0 0 21.71 21.71 21.71 21.71 21.71 21.71 Net benefits, million lei
-50 -50 21.71 21.71 21.71 21.71 21.71 21.71
Internal rate of return, percent
7.00%
Amount of net benefits, million lei
30.26
Discount rate, per cent 5.00%
Net discount value, million lei
7.33
Net benefits of the status quo option would be equivalent to 30.26 million lei for the corresponding period (at an internal rate of return of 7%19). To find the benefits today, a discount rate should be applied. To ensure assessment of public policy options, based on the same criteria, the ex-ante guide recommends using the interest rate set by the National Bank as the discount rate (currently 5%). Thus, the present value of the benefits would be equal to 7.33 million lei. From the NFRD, during 2010 – 2012, were financed projects that included urban localities as well were financed totaling 81.4 million lei, approx. 50% of the allocated amount. Assuming that NFRD allocations will remain constant in the future, the amount allocated to development projects in urban areas will be directly proportional to the increase / allocations from the state budget. However, following granting the status of municipality to the towns Ungheni, Cahul, Soroca and Orhei, it was estimated that their budgets will increase by 20%20.
8.2 Administrative Impact
The current option provides for additional actions at regional policy level and institutional level. First it should be noted that MRDC is working on a new National Regional Development Strategy for the period 2013-2015, which involves changing the method of selecting projects funded from NFRD and updating regional strategies. Pending approval of the Strategy, no change will be made to NFRD management tools. Rural localities will apply for investment projects from the same position with urban localities. Projects will be funded irrespective of the fact whether they show a profitable rate of return. However, granting the status of municipality to some district centers involves (working document) the following changes21:
• The Law on administrative-territorial organization no. 764/2001 will be amended as
follows:
Art 4 and Art. 8 will be amended by extending the list of municipalities with other 4 cities: Cahul Orhei, Soroca and Ungheni, annexes to the Law 764/2001 will be amended, so that the
19 Rata internă de rentabilitate a investiţiei reprezintă rata de randament la care investiția este fructificată. Pentru calcule a
fost folosită funcția IRR oferită de Excel The internal rate of return on investment is the rate of return on which the
investment is returned. The IRR functions provided by Excel was used for calculations 20 Concept on granting the municipality status to several cities, district centers, working document 21 Concept on granting the municipality status to several cities, district centers, working document

29
structure of the new municipalities will include suburbs for which the current status of administrative unit with legal personality within municipality will be preserved.
• The Law on local public administration no. 436/2006 will be amended as follows:
Criteria for assigning the cities a significant role in the socio-economic and territorial status of municipality will be established, municipalities will be empowered with the responsibility to provide public services not only for the residential city, but also for the localities included into it; forms of inter-municipality cooperation between cities and suburbs will be defined expressly, competences similar to those of the district councils in relationships with the localities included in municipalities will be established.
• The Law on local public finance no. 397/2003, the Tax Code and the Law on the budgetary
system and the budgetary process no. 847/1996 will be amended as follows:
The possibilities for increasing the share of own revenues in municipal budgets by sharing some sources of revenue will be extended, provisions concerning transfers will be preserved, possibilities of collecting new revenues will be regulated, the newly created municipalities will establish direct inter-budget relations with the Ministry of Finance, based on the model of Chisinau and Balti municipalities.
Subsequently, upon the approval by Parliament of these amendments, other relevant amendments in some Decisions of the Government will be required, such as Government Decision on the structure and staff of the mayoralties of villages (communes), towns (municipalities) no. 688 of 10.06.2003; Government Decision on the structure and staff of decentralized public services of ministries, departments and other central administrative authorities no. 735 of 16.06.2003, etc.
8.3 Economic Impact
Under this option, the Government will continue funding projects from the NFRD (and other funds) aimed at improving infrastructure in the regions, the quality of service, promoting tourism. As it done today as well, based on the application and selection procedure, some projects will be implemented in towns. This will have a positive impact on currently operating businesses and may become a reason for investment for other companies. The number of projects and the amount allocated to them may increase if the state budget is increased. However, current projects are unable to make a profound change in most towns and cities. In 2009, according to SADI, only 54% of towns (except Chisinau and Balti) had over 2/3 of the roads with rigid pavement). Thus, under the current conditions, Chisinau and Balti are more attractive for investment (in 2010, about 66% of businesses were concentrated in Chisinau and 4.% in Balti). In the end, the large gap in investments between Chisinau and other towns of the country will be maintained.
Also, based on the trend reported by businesses in interviews for this PPP (see Appendix 4), the companies outside Chisinau face and will continue to face a shortage of labor force (in number and quality) because of migration to the capital and / or abroad.

30
8.4 Social Impact
According to the SADI for 2009, on the right bank of the Nistru river, except Chisinau and Balti there were:
• 71% towns in which more than 2/3 of the houses and apartments were connected to water supply;
• 29% of towns in which more than 2/3 of the houses and apartments were connected to sewerage;
• 52% of towns in which more than 2/3 of houses and apartments were connected to central gas network;
• 83% of towns in which more than 2/3 of houses and apartments were connected to internet;
• 4% of the cities in which more than 2/3 of the houses and apartments were connected to the Internet.
Currently, there are 12 ongoing projects supported by NFRD, also covering towns. Assuming that these projects will be completed, there will be a positive impact on the population, particularly on the poor. Of the current situation is simply maintained, the impact will be relatively small because of the low number of infrastructure projects and their size. Since the economic growth will continue to be geographically polarized, disparities in the socio-economic development of Chisinau, Balti and other towns and cities will increase. In this context, the urban population will still have limited access to quality services, and the gap in the living conditions of the population will increase. Although the poverty rate decreased during 2006 – 2010, in other cities it is still twice as high as in Chisinau and Balti (14.2% versus 7.3% in 2010).
8.5 Risks
If the existing situation continues and no interventions are made, there are the following risks:
• Concentration of economic, financial, investment, human resources only in Chisinau and Balti municipalities;
• Deepening disparities in investment and economic activity, as well as in the standards of living;
• Urban decline and loss of urban functions by cities in the regions and "ruralization" of the lifestyle
VII. OPTION 1: ESTABLISHING ECONOMIC GROWTH CLUSTERS IN A SINGLE LEVEL
9.1 The Theory of Economic Development Clusters
The fundamentals of development clusters theory were laid in the early 1960s by Francois Perroux. According to this theory, the cluster allows a better balance of regions’ development and occupies a strategic place in the development of land use policies. He also shows that economic growth clots around growth clusters and spreads with varying intensities to other economic sectors. It is also shown that there may be natural growth clusters, determined by the presence of energy sources, raw materials, concentration of certain industries, infrastructure, labor force, while other regions that do not have all that must look for compensatory clusters, i.e. encourage the development of competitive advantages. Thus, for the second case, the town with a growth exceeding the growth of other towns is considered the engine for growth, taking into account two possible effects: propagation of growth and its slowing

31
down. If the first effect is stronger, a semblance of towns can be reached, if not, the result is polarization. The goal of regional policies arising from this theory is to fight against the forces that lead to polarization and to enhance the propagation effects.
In the regional practice there is a trend of creating regions – epicenters or clusters formed around certain cities as centers of concentration of the administrative, social and economic activity. The growth cluster concept has been implemented in over 30 countries, including Ireland, the UK and Italy, and in the developing countries of the Latin America, Southeast Asia and Africa.
The polycentric development is the way in which regional policies combine aspects related to competitiveness and cohesion, which in turn is generally equated with the absence of regional disparities.
9.2 The Case of the Republic of Moldova
This option assumes that the urban structure should be organized in a way to boost competitiveness and economic growth, thus creating prerequisites for urbanization and industrialization.
In this context, the economic growth cluster should be seen as a coordinating center of human settlements system, which can be used as a tool in achieving the goal of regional development, namely a balanced territorial development of the country regions.
This option implies a downwards approach, where based on meeting of certain criteria, performance analysis (accumulation of income to local budget), some towns or cities are identified as centers of economic growth.
Identification of certain cities as economic growth clusters can be a key element in ensuring the country's development due to the effect of concentration of state resources, investors and human capital. They can take advantage of economies of agglomeration which will induce further economic growth, creation of jobs, enhancing of productivity and development impact on the surrounding small towns and adjacent rural areas, thus contributing to the development of the entire region.
A cluster of economic growth in the region should be, according to the theory, a larger town offering business and citizens virtually the same services as larger cities (Chisinau and Balti) and employment opportunities for the local population.
To identify cluster cities under the current option, the working group analyzed a number of indicators (of those statically available) and selected the most relevant indicators, grouping them into seven categories. These categories are presented below:
Criteria for the selection of economic development clusters:
1. Economically active population and administrative area
Number of economically active population Administrative area of the city
2. Access infrastructure Access to railroad Access to the international road Airport The quality of roads (over 2/3 of local roads with rigid pavement)

32
3. Urban infrastructure
Connection to water supply Connection to gas pipeline Connection to sewerage system Connection to fixed phone line Connection to internet
4. Economic potential/Economic development level Sales revenue of local enterprises Investment in fixed capital Volume of paid services rendered to population Own revenues in the local budget
5. Business support infrastructure
Free economic zones Representatives of the Chamber of Commerce and Industry Business associations Commercial banks
6. Research capacity – universities, educational institutions
Presence of higher education institutions Number of secondary vocational education institutions Number of colleges
7. Presence of consular offices
Each category above was assigned a certain score (based on aggregate indicators it contains), which was later assigned a coefficient taking into account the importance of the group and the results of the econometric analysis (Appendix 3). The score obtained for each town is as follows:
Polarization coefficient Polarization coefficient CAHUL 995 CRIULENI 581
MUN.COMRAT 978 BASARABEASCA 538
SOROCA 906 ŞTEFAN VODĂ 526
UNGHENI 885 BRICENI 521
ORHEI 873 GLODENI 491
EDINEȚ 844 NISPORENI 482
CEADIR-LUNGA 753 LIPCANI 462
TARACLIA 722 CANTEMIR 462
HÎNCEŞTI 709 LEOVA 462
VULCĂNESTI 708 OCNIŢA 461
FLOREŞTI 704 DONDUŞENI 460
STRĂŞENI 698 COSTEŞTI 458

33
CIMIŞLIA 692 OTACI 438
REZINA 677 TELENEŞTI 432
DROCHIA 671 CĂINARI 403
CĂLARAŞI 656 SOLDANEŞTI 368
CĂUŞENI 656 IARGARA 338
ANENII NOI 622 MĂRCULEŞTI 328
FĂLEŞTI 622 CORNEŞTI 318
IALOVENI 621 GHINDEŞTI 288
SÎNGEREI 606 BUCOVĂŢ 288
CUPCINI 598 BIRUINŢA 283
RÎŞCANI 596 FRUNZĂ 238
It should be noted that the exercise did not include a number of tows which are either nit part if this option (Chisinau and Balti, towns within Chisinau municipalities), or because of lack of data and limited intervention possibilities at the moment (towns on the left bank of the Nisru river).
Table 4. Indicator groups’ coefficient
Active
economic
population and
administrative
area
Access
infrastructure
Urban
infrastructure
Economic
indicators
Business
support
Higher
education
Professional
schools and
colleges
Consular
offices
30% 15% 15% 25% 5% 5% 4% 1%
The demarcation line for identification of clusters was established as shown in the diagram below (a "rift" between 2 groups of towns on the basis of the polarization coefficient can be seen; at the same time, these towns obtained from 80% of maximum polarization coefficient). Since the assignment of the coefficient above includes some subjectivity, several simulations with different values have been tried. As a result, the hierarchy of towns changed every time, but the first six cities continued to be at a certain distance from the rest.
Figure 7. Placement of towns based on polarization coefficient. Experts’ calculations

34
Following the application of the criteria defined above and based on the assigned score, the following 6 towns can become regional economic growth clusters: Cahul, Comrat, Ungheni, Soroca, Orhei,
Edineţ. The identified national clusters correspond to certain concentrations of industries, where investments have important effects on the regional economy. At the same time, the econometric analysis established that these towns have had an improved performance in terms of accumulation of local budget revenues.
9.3 Fiscal Impact
The fiscal impact was analyzed in terms of efficiency of regional development projects financed from the state budget, regardless of the fund or shape through which investments were made.
Thus, the comparative analysis of investing a conventional amount of 100 million lei into development projects for country’s towns vs. the clusters identified for 2013 - 2012 (except Chisinau and Balti and towns on the left bank of Nistru river) was performed. The economic effect that may be achieved in the 6 towns identified as economic growth clusters was calculated as follows:
Economic effect = average budget own revenues (Edinet, Soroca, Ungheni, Orhei, Cahul,
Comrat) / average own revenues of all towns and cities = 2.32
The clusters proved to be more efficient in terms of accumulation of own budget revenues compared to all towns by about 2.32 times. It is true that they are larger than other towns, have more economically active population, have certain advantages, but this means in particular that they will be more effective in return on investment than other towns. It should be noted that only the own revenue of towns was taken into account, excluding the transfers from the state budget. Calculations are presented in the table below:
Table 5. Fiscal Impact
Polarization coefficient

35
Years 2013 2014 2015 2016 2017 2018 2019 2020
Option 1
Cost, million lei 50 50 0 0 0 0 0 0
Benefits, million lei 0 0 29.53 29.53 29.53 29.53 29.53 29.53
Net benefits, million lei -50 -50 29.53 29.53 29.53 29.53 29.53 29.53
Internal rate of return, percent
16.24%
Amount of net benefits, million lei
77.18
Discount rate, per cent 5.00% Net discount value, million lei
45.13
Difference in net benefits, million lei 46.92 Difference in net discounted value, million lei 37.80
As shown, costs occur in the first two years, 50 million for each year (based on current experience of project implementation), and the benefits occur starting with the first year of successful project completion - 2015. Investment projects usually imply an internal rate of return. If a rate of return of 7% is acceptable, for the projects in any towns in the country (excluding Chisinau and Balti), than the projects to be implemented in the clusters will have a rate of about 16.24% (7% * 2.32). Net benefits of the current options would be equivalent to 77.18 million lei. Discounted at a rate of 5% (calculated by the NBM), the value of benefits would be 45.13 million lei. The net discounted value is positive in case of both options, recommending the investment. Only in the case of option 0, this would be of 7.33 million lei, while in case of option 1 - 45.13 million lei. The surplus in favor of option 1 is 38.80 million lei. The effects generated by investment were estimated for the economic period 2013 - 2020, so at the end of the forecast horizon there can be a residual value (the investment is able to generate economic benefits beyond the last year of operation).
The calculation above is a hypothetical one and shows the efficiency of the investment in the case of each option. The benefits may be larger, if there are more allocations. At the same time, we must take into account the fact that during 2013 - 2020 several projects will be implemented (in several calls for proposals), which means that there will be more benefits and differences between them in the options.
9.4 Administrative Impact
This option implies major changes in regional development policy. From the administrative point of view, measures related to amendment of legal framework are required for this option. Thus, the Law no. 438/-XVI of 28.12.2006 on regional development should be amended by including provisions related to measures to support economic growth clusters and establishing priority axis for this purpose and main directions of development of these towns and the economic sectors into which this economic growth translates. Nomination of such urban centers as growth clusters involves development of a GD. Additionally, appropriate measures will be taken to review the Regional Development Strategy and subsequent legal acts.
The following actions are required locally: 1. Updating the National Plan for Urban Development; 2. Developing local strategic planning documents (Edinet, Soroca, Ungheni, Orhei, Cahul,
Comrat) for a long period of time - 7 to 10 years; 3. Establishing clear development targets both for the cities and the adjacent areas;

36
4. Strengthening the capacity in developing complex regional development projects with impact on the region;
5. Establishing sustainable partnerships between the localities falling within the range of influence of urban growth clusters
9.5 Economic Impact
Strengthening the regional position of economic growth clusters and at the same time enhancing their functions will result in creation of areas of social and economic convergence. It is acknowledged than when the state comes to support certain localities/centers with economic potential with resources, it has a positive influence on public sector players.
The relationship between public and private investment is the subject of many theoretical and empirical studies.22 2324Thus, some studies show that in the short term, each percentage point increase in public investment in fixed capital is associated with an increase by approximately 0.6 percentage points of annual private investment in equipment and development. In 2010, the rate of public investments in fixed capital in the 6 cities identified as economic growth clusters was approximately 16%. Thus, their increase by e.g. 4 percentage points (14.2 million lei) would generate an increase by about 2.4 percentage points in private investments in fixed capital (approximately 8.5 million annually).
As migration is characteristic mainly to small towns and rural areas, the volume of funds transferred from abroad have a leading role in the welfare of the population in these areas. Thus, besides consumption or investment in real estate in Chisinau, people may be motivated to channel these remittances to small businesses or real estate in the clusters.
9.6 Social Impact
Designation of the cities of Edinet, Soroca, Ungheni, Orhei, Cahul, Comrat as economic growth clusters will transform them into "regional capitals". This means, in addition to investment and infrastructure projects, extending the range of public services and improving their quality at the level of those available in big cities (Chisinau and Balti). These cities with regional core role will have an impact not only on the population of cities, but also on the population of adjacent areas. The influence of big cities on smaller, secondary centers in the surrounding area is based on the hierarchical structuring of services.
Since the residence environment is one of the factors most strongly correlated with the welfare of the population, a significant effect targeted by this option is to reduce poverty in the small towns. The average absolute poverty rate in urban areas was 10.4% in 2010, decreasing by 2.2 percentage points compared with 2009 and by 4.8 percentage points compared with 2008. Although declining, in 2010 the poverty rate in small towns (14.2%.) was twice as high as in Chisinau and Balti (7.3%).
Creating clusters may have an ambiguous economic impact - the return on investment in Chisinau and Balti is higher and therefore this option results in loss of efficiency, at least in the short term, however it will produce social impact. An additional investment in Chisinau makes more money, but does not produce less poor. This relationship is reversed in the clusters and their surrounding areas - even if the
22 http://college.holycross.edu/eej/Volume32/V32N3P479_492.pdf 23 http://www.ecb.int/pub/pdf/scpwps/ecbwp864.pdf 24 http://www.iese.ac.mz/lib/saber/oa_20.pdf

37
return on investment is lower (compared to investing the same amount in Chisinau and Balti), the added benefit is that poverty reduction impact will be more pronounced.
9.7 Risks
• Lack of capacity in the public administration of cities to develop and implement large projects with impact on development of the adjacent areas;
• Unwillingness of other line ministries to link policies with the existing policy of establishing economic growth clusters, thus excluding clusters established under the priorities of funds managed by them.
VIII. RECOMMENDED OPTION
The option recommended by the Ministry of Regional Development and Construction is: Option 1: establishing economic growth clusters in a single level
Promoting a balanced polycentric urban network will help increase economic activities, especially by encouraging entrepreneurship, increasing productivity and implementing technologies in accordance with the European standards for regional development. Currently, the role of most cities and towns is limited to executing administrative functions. The insufficient services, living conditions, etc. in the peripheral areas raise problems of increasing significantly the anthropogenic load while approaching the capital city.

38
IX. APPENDICES
Appendix no. 1 Problem Tree
Decalaj în nivelul dezvoltării economice a oraşelor din Republica Moldova
Concentrarea factorilor de producere în Chişinău
Acces limitat la nodurile de transport (pentru unele localităţi
urbane)Sfera serviciilor limitată în
regiuniInteres redus al investitorilor
faţă de oraşe
Gestionarea ineficientă a
proceselor de dezvoltare
Economia de scară redusă în regiuni
(lipsa avantajelor de cost producere, lipsa eficienței în producere, lipsa avantajului
competitiv general)
Instrumentariul de planificare
urbană depăşit sau inexistent
Capacităţi limitate ale autorităţilor APL
Transparenţă limitată în relaţiile dintre APL şi investitori
Repartizarea inechitabilă şi insuficientă a resurselor financiare către orașe
Distanţa dintre orașe față de mun. Chişinău şi Bălţi nu a
existat necesitatea dezvoltării altor orașe datorită distanței
scurte față de Chișinău
Infrastructura subdezvoltată a drumurilor locale
Insuficienţa numerică a forţei de muncă în orașe/regiuni
Forţa de muncă necalificată în orașe/regiuni comparativ cu
mun. Chișinău
Climat investiţional nefavorabil în orașe
71% din localități nu disoun de planuri urbanistice (actualizate)
Planuri/Strategii de dezvoltare socio-economică neintegrate cu
PUG-urile
Dezvoltarea diferențiată și lentă a oraşelor
Degradarea infrastructurii existenteîn orașe/regiuni
Nivelul scăzut al veniturilor în bugetele oraşelor
Oportunităţi reduse de angajare pentru populaţia locală
Atractivitatea scăzută a oraşelor pentru fonduri şi investiţii străine
Şomaj ridicat în orașe/regiuni comparativ cu mun. Chișinău Migraţia internă Migraţia externă
Depopularea oraşelor
Dezechilibrarea structurii populaţiei după profesionalism şi
vârstă în orașe/regiuniScăderea indicilor demografici
Venituri relativ reduse a populaţiei din oraşele comparativ
cu mun. Chișinău
Bunăstarea scăzută a populaţiei
Rata înaltă a sărăciei
Concentrarea business-ului în Chișinău
Resurse insuficiente pentru menținerea carcasei urbanistice
Sistem fiscal deficient (pentru acumularea veniturilor în
bugetele locale)
Resurse financiare limitate pentru actualizarea PUG-urilor

39
Appendix no. 2 NFRD Management Scheme

40
Appendix no. 3 Analysis of development potential of cities and towns in the Republic of
Moldova
Object of the study: 65 towns in the Republic of Moldova, including 11 on the left bank of the Nistru river. For most analyzes information about the 54 towns and cities on the right bank of the Nistru river was used, since more data were identified for them.
Data: Information for the 54 towns refers to the situation in 2009, as many indicators are available only until this year and are data collected for SADI (cities). The analysis began with a set of over 50 variables that were tested and were selected only those that truly influence the development of towns were selected.
Mains Assumption of the study: This analysis was based on the assumption that income accumulated in the local budget is the development potential of each town. If the revenue exceeds the expected amount (average for the country), the towns will better develop its potential and vice versa.
Secondary assumption of the study: The local budget is a variable approximating the city’s development level. The higher the budget, the more intense the economic activity in the city. But budget components should be considered separately, since it has been shown that there is no mathematical relation between them. There are towns receiving large amounts transferred from the state budget, but do not have their own large revenues and vice versa.
Methodology: Two models were developed to explain the factor in favor of accumulation of local budget revenue and factors explaining transfers to local budgets. In both models different factors can be identified, as the revenues are rather related to the economic and development potential of the city, while transfers - to the need to spend money, especially for social purposes.
Factors: For the first model, it was identified that local budget revenues could depend on human potential (the number of economically active people minus the unemployed), on the infrastructure (over 2/3 of the population has access to fixed telephony, water supply, sewerage, gas and internet), the size of the town (administrative area in square kilometers) and access infrastructure (presence of railway, airport, and easy access to the international road).
For the second model, it was found that the volume of transfers may depend on education (it can be estimated whether as educational expenses or the number of educational institutions), the number of pensioners and other factors.
The econometric model identifies factors that explain better the amount of local budget revenues and the volume of transfers to local budget, to later identify the towns and cities that operate under or over their potential.
Model 1. Factors explaining the truest level of earnings to the local budget.
The following factors are analyzed under the model: Infrastructure:
• Urban
o 2/3 of the population has access to fixed telephony o 2/3 of the population has access to water supply

41
o 2/3 of the population has access to sewerage system o 2/3 of the population has access to the gas supply o 2/3 of the population has Internet access
• Access
o The city has access to rail road o The city has access to international road o The city has access to an airport o Over 2/3 of local roads are with rigid pavement.
Size:
• Surface of the locality (km2)
Economic potential:
• Number of economically active people
• Number of industrial enterprises
Distinct factors:
• The fact that the city is a district center
• The fact that the city is a municipality
• The fact that the city is the capital.
Following the initial analysis of the variables, it was shown that the economic potential factors explain the same thing and there is a strong relationship between the number of industrial companies and the number of economically active persons. Thus, it was decided to keep only the human potential in the model.
The models reveal a direct link, although statistically not very significant, between infrastructure and the level of revenues. The presence of urban infrastructure is significant for p <0.05, which means that, on average, for each of the 5 selected services (water supply, sewerage, telephone, internet and gas), which is available for at least 65% of the population of the town, the budget of the town/municipality obtains by MDL 1.2 million more. We can consider this surplus as a bonus for efficiency, thanks to a better access to infrastructure or as a differentiation between towns with a better infrastructure and those with a weaker infrastructure. The access to the transport communication infrastructure (international road, railway or airport) provides, on average, an additional benefit of 587 thousand lei for each access road of the three listed. This amount is not very significant statistically, but the fact that this coefficient is positive shows that the access to a better transport infrastructure provides certain advantages to a town.
The driving factor for generation of revenues in local budget is though the economically active population. Through its work, it generates budget revenues both from contributions and personal taxes and through indirect taxes paid through the economic activity of enterprises. This is the most significant factor and there is a strong and direct relationship between the number of economically active population and budget revenues. Its availability ensures not only a present potential, but also a potential for the future.
However, to demonstrate that towns differ (or not) from each other, the working group tried to estimate whether the productivity (in this case we understand productivity as the average

42
contribution of an economically active person to the local budget during one year) of economically active population is different in district centers, municipalities, the capital and other towns.
It was found that the economically active population in cities with a larger number of economically active population and in the capital differs from other towns' population by higher productivity. Likewise, district centers are different from the towns that do not have the status of municipality or district center. This can be explained by the services, infrastructure, level of education of the economically active population of Chişinău and its higher remuneration. At the same time, the productivity of population of Chisinau is also determined by its density within Chisinau (numerically, the population of Chisinau is comparable to the population of development regions of the Republic of Moldova).
The area of the locality is also important, although it does not brig a consistent added value. It may be assumed that a part of productivity provided by efficient use of the available territory is also found in the productivity of the economically active population. On average, each square kilometer brings an additional amount of MDL 31,000 to the local budget annually, in addition to productivity provided by the economically active population.
Revenues
depend on: Coef. Significance Interpretation
EAP 1.117 *** On average, each town obtains 1117 lei annually as revenue from each economically active person. This factor applies to the towns which are not district centers or municipalities.
Total area 31.074 ** Each square kilometer of town area generates an average additional amount of 31.074 lei to the local budget.
EAPCap 0.335 *** Residents of the capital generate on the average by 335 lei more to the local budget that in other municipalities.
AEPMun 1.316 ***
A worker in a municipality generates by 1316 lei more than one in a town that does not have this status of municipality, generating on average 1172 + 1316 = 2488 lei per year to the local budget.
AEPDc 0.525 * A worker in a district center generates 525 lei more than one in a city that does not have the status of district center, on average generating 1172 + 525 = 1697 lei per year to the local budget.
Urban
infrastructure 1202.7 *
Each unit of the 5 selected infrastructure facilities (water supply, sewerage, telephone, internet, gas), where it is accessible for at least 65% of the population, brings an additional revenue of 1.2 million lei.
Transport
infrastructure 587.36
Presence of each of the following ways of communication: international road, railway or airport provides, on average, a bonus of 587,000 lei to the local budget.
Note: * - p<0.05, ** - P<0.01, *** - p<0.001
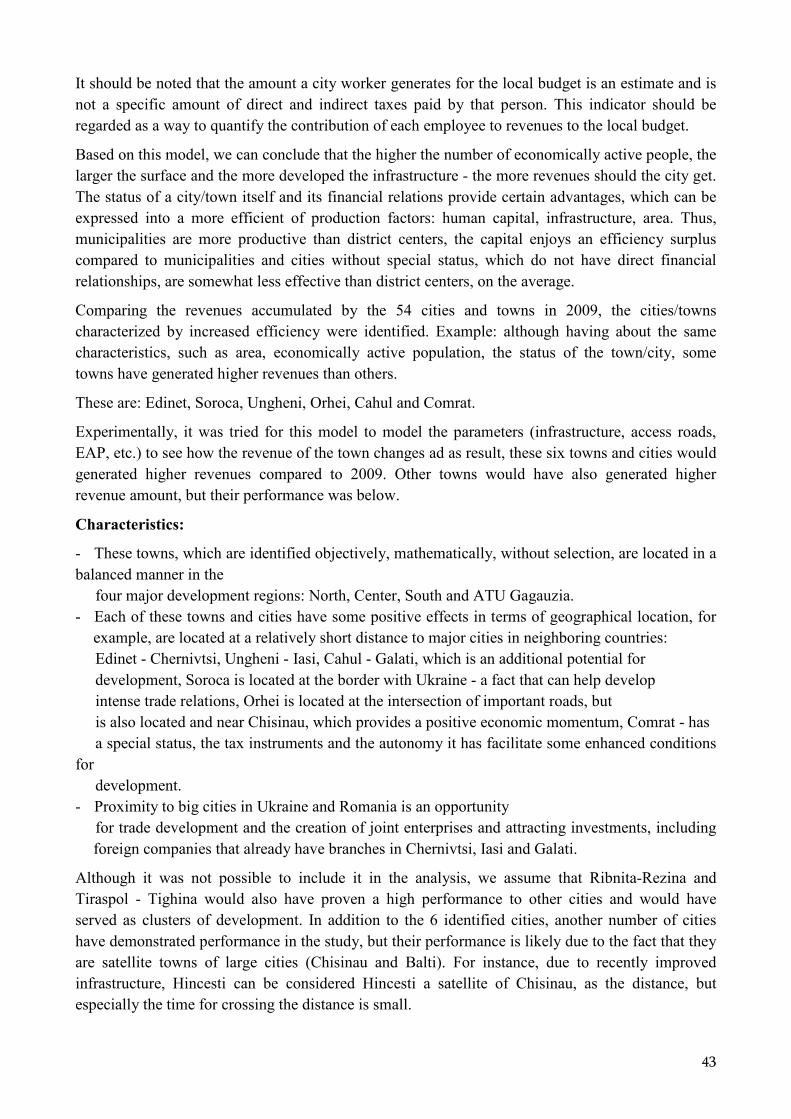
43
It should be noted that the amount a city worker generates for the local budget is an estimate and is not a specific amount of direct and indirect taxes paid by that person. This indicator should be regarded as a way to quantify the contribution of each employee to revenues to the local budget.
Based on this model, we can conclude that the higher the number of economically active people, the larger the surface and the more developed the infrastructure - the more revenues should the city get. The status of a city/town itself and its financial relations provide certain advantages, which can be expressed into a more efficient of production factors: human capital, infrastructure, area. Thus, municipalities are more productive than district centers, the capital enjoys an efficiency surplus compared to municipalities and cities without special status, which do not have direct financial relationships, are somewhat less effective than district centers, on the average.
Comparing the revenues accumulated by the 54 cities and towns in 2009, the cities/towns characterized by increased efficiency were identified. Example: although having about the same characteristics, such as area, economically active population, the status of the town/city, some towns have generated higher revenues than others.
These are: Edinet, Soroca, Ungheni, Orhei, Cahul and Comrat.
Experimentally, it was tried for this model to model the parameters (infrastructure, access roads, EAP, etc.) to see how the revenue of the town changes ad as result, these six towns and cities would generated higher revenues compared to 2009. Other towns would have also generated higher revenue amount, but their performance was below.
Characteristics:
- These towns, which are identified objectively, mathematically, without selection, are located in a balanced manner in the four major development regions: North, Center, South and ATU Gagauzia. - Each of these towns and cities have some positive effects in terms of geographical location, for
example, are located at a relatively short distance to major cities in neighboring countries: Edinet - Chernivtsi, Ungheni - Iasi, Cahul - Galati, which is an additional potential for development, Soroca is located at the border with Ukraine - a fact that can help develop intense trade relations, Orhei is located at the intersection of important roads, but is also located and near Chisinau, which provides a positive economic momentum, Comrat - has a special status, the tax instruments and the autonomy it has facilitate some enhanced conditions for development. - Proximity to big cities in Ukraine and Romania is an opportunity for trade development and the creation of joint enterprises and attracting investments, including
foreign companies that already have branches in Chernivtsi, Iasi and Galati.
Although it was not possible to include it in the analysis, we assume that Ribnita-Rezina and Tiraspol - Tighina would also have proven a high performance to other cities and would have served as clusters of development. In addition to the 6 identified cities, another number of cities have demonstrated performance in the study, but their performance is likely due to the fact that they are satellite towns of large cities (Chisinau and Balti). For instance, due to recently improved infrastructure, Hincesti can be considered Hincesti a satellite of Chisinau, as the distance, but especially the time for crossing the distance is small.

44
Appendix no. 4 Focus group questionnaire: Business environment
1. Have you planned from the start to invest in the city X? Or have you shifted over time? 2. What are the determinants that influenced your decision to invest in city X?
• Tax facilities
• Attractive investment environment
• City’s development and potential
• Local (skilled) labor force
• Corruption / bureaucracy in other cities (Chisinau)
• Other 3. How do you assess the level and quality of the business environment / investment
opportunities in city X?
• Completely unsatisfactory
• Unsatisfactory
• Mostly satisfactory
• Completely satisfactory 4. What was the main source of information on which you based the decision to invest in city
X?
• Specialized websites
• Specialized magazines
• Other business people
• From other sources 5. How do you assess the development of your investments in city X? Will your business
continue?
• Descending
• Constant
• Ascending 6. Have you faced directly the issue of corruption? In what context?
• Upon registration of the company
• Upon obtaining permits
• During procurement processes
• Other
• I have faced no cases of corruption 7. What, in your opinion, are the main socio-cultural issues that affect your confidence in the
investment environment of the city?
• Difficult communication due to different perceptions of business principles
• Attitude to work
• Level of education and training
• Immigration / emigration
• Other 8. How easy was it to find your workforce needed to run your business?
• Easy
• Moderate
• Difficult

45
9. What factors would determine to invest more in city X or in other cities in Moldova, except Chisinau?
• Level of taxes
• Labor force
• Competitive market
• Low price of investment (land, buildings)
• Government intervention in supporting certain cities 10. Which government measures do you consider useful for developing a conductive investment
environment in cities (except Chisinau)?
• More efficient public services for business support
• Online licensing and registration system
• E-government services • Other

46
Appendix no. 5 Multi-criteria Analysis
This technique is recommended for stage 5. of ex-ante analysis "Comparison of options and selecting the recommended option". This allows evaluation of options taking into account the different types of impact or impact issues, each of them having their own weight. The multi-criteria analysis consists of the following steps:
1. Each type of impact or aspect of impact must be assessed using a scale from -5 (highly negative impact) to +5 (highly positive impact) based on the following principles:
• Fiscal Impact
(-5) - Highly negative fiscal impact. Major public budget expenditure; (+5) - Highly positive fiscal impact Positive action on the public budget.
• Economic impact
(-5) - Highly negative economic impact. Severely affects the businesses; (+5) - Highly positive economic impact Positive action on businesses, increased income.
• Administrative impact
(-5) - Highly negative administrative impact. Need for major administrative resources; (+5) - Highly positive administrative impact Does not require administrative costs and resources.
• Social impact
(-5) - Highly negative social impact. High burden on the population; (+5) - Highly positive social impact Major benefits for the population. Poverty reduction.
2. Each type of impact or aspect of impact must be weighted according to its importance, based on the total share of 100%.
3. The weighted value of all policy options is calculated by multiplying the value of the impact with its weight. The option with the highest score will be recommended.

47
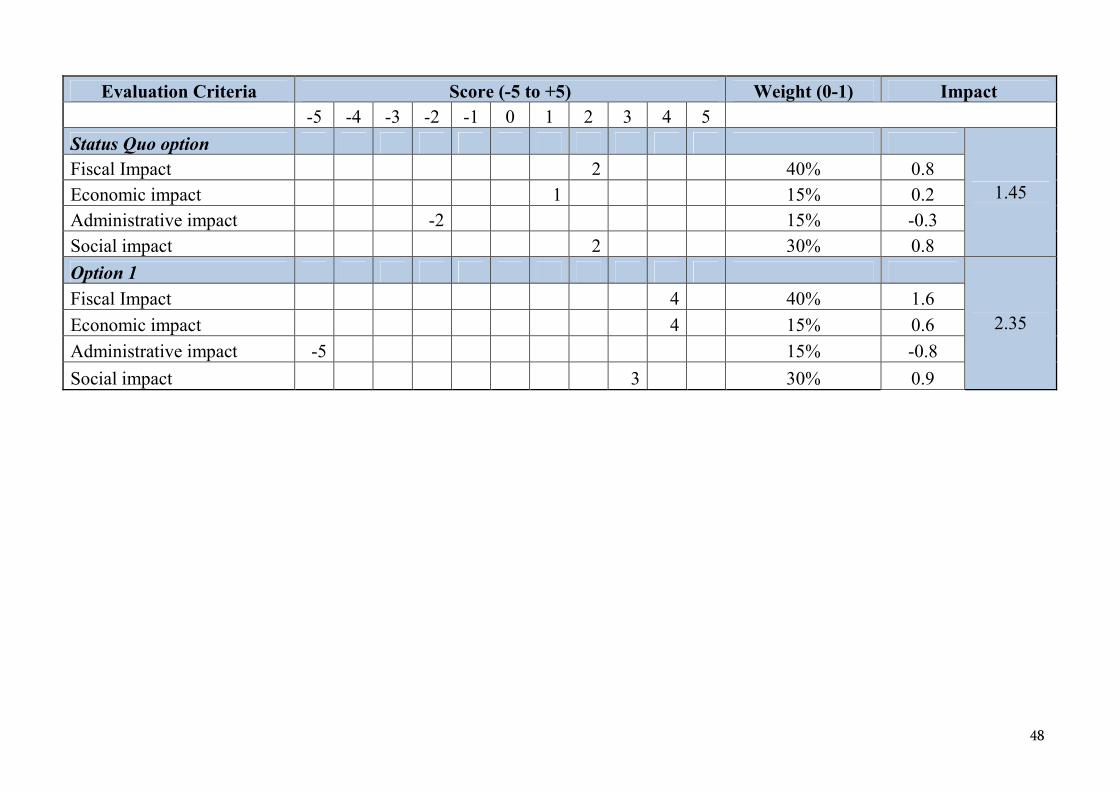
48
Evaluation Criteria Score (-5 to +5) Weight (0-1) Impact -5 -4 -3 -2 -1 0 1 2 3 4 5
Status Quo option
1.45 Fiscal Impact 2 40% 0.8
Economic impact 1 15% 0.2 Administrative impact -2 15% -0.3
Social impact 2 30% 0.8
Option 1
2.35 Fiscal Impact 4 40% 1.6
Economic impact 4 15% 0.6
Administrative impact -5 15% -0.8
Social impact 3 30% 0.9
49
Appendix no. Consultation process synthesis
The Ministry of Regional Development and Construction initiated the consultation process with the creation of the working group for ex-ante impact assessment of the public policy proposed for consideration. Parties to the process represented the following governmental and non-governmental organizations: Ministry of Regional Development and Construction, State Chancellery, Ministry of Economy, Ministry of Finance, Regional Development Agencies, Regional Development Councils, LPA, Expert Group, CALM, IDEA Institute, representatives of the academics and development partners.
Several meetings of the working group were organized during the process of data collection and analysis, including with involvement of experts in the area. The draft policy proposal was placed for information and consultation on the web page of the Ministry of Regional Development and Construction, under "Decisional transparency” category.
During the public discussion, held on October 4, 2012 the basic principles of the ex-ante analysis and the results of the impact assessment of identified options were presented. The public discussion was moderated by Mr. Veaceslav Gututui, Deputy Minister of Regional Development and Construction. The participants in the meeting welcomed the initiative of the Ministry of Regional Development and Construction to develop such a policy and appreciated the results of the analysis carried out by the working group and the speakers’ positions were not polarizing. Thus, the following opinions on this proposal were expressed:
Mrs. Lupan, from Orhei mayoralty, mentioned that she had participated in the meetings of the Working Group on granting the status of municipalities to a number of cities (Soroca, Orhei, Ungheni and Cahul) at the State Chancellery and asked if these two policies were different or intersected.
Mr. Andros, head of policy and regional cooperation department of MRDC, explained that the balanced urban development policy refers mainly to the economic development of cities and territories adjacent to them, identification of additional funding sources, while the policy promoted by the State Chancellery was about administrative changes (merging small towns around the major towns and establishing municipalities).
Mr. Guţuţui explained that the MRDC launched the policy in May 2012, while the State Chancellery in July - August. The public policy on providing the status of municipalities is part of this policy. For example, in Romania this policy is realized in two levels: cities - clusters of economic growth and cities - clusters of urban development, but given that Moldova is a small country and the distance between towns is negligible, such an option, although suggested by the working group, was disqualified.
Mr. Andros presented the indicators and the methodology used in identifying the six cities. Based on the calculations, cities that can attract investment and have the capacity to develop adjacent territories were identified.
Mr. George Ursoi, consultant at the State Chancellery, asked to what extent the policy promoted by the MRDC matched the policy developed by the State Chancellery.
Mr. Guţuţui explained that the Ministry worked separately from the State Chancellery on the policy, but these two policies may be combined at the next level of decision. Of the 6 cities identified by the MRDC as growth clusters, 4 are already present in the draft policy on providing the

50
municipality status. The latter will have a different approach from instruments applied in promotion of policies. The municipality status does not mean financial benefits, increased opportunities to attract investment, but only some changes in the fiscal relations between the state, the municipality and other localities. The policy proposal was referred to the document promoted by the State Chancellery and other relevant policy documents.
Mr. Bînzaru, Head of General Directorate for Regional Development spoke about the fact that after the adoption of the legislative package on the status of municipality, the cities concerned would receive 20% additional annual budget and that some smaller towns would be included in the new administrative units.
Mr. Andros stressed that so far, projects financed from the NFRD mainly had a social approach and the public policy on balanced urban development was oriented towards economic development of the areas concerned, attracting investments and using them effectively.
Mrs. Rogov, Head of Department of International Relations and Attracting of investments, said that in 2013 pilot projects for European Regional Development would be launched in all regions of Moldova (excluding Transnistria). In this context it will be possible to direct investments and develop the capacity to make the best use of resources in the localities in question.
After conducting public consultations on the drafting of public policy proposal: balanced urban development in Moldova, no proposals or essential objections were received. In this context, the analyzed document will be submitted for review and approval to the State Chancellery, which will then submit it for approval to the Interministerial Committee for Strategic Planning.