Approaches in NOAA’s - energy.gov · AHU Air Handler Unit ... Case Study: Innovative Energy...
15
Case Study: Innovative Energy Efficiency Approaches in NOAA’s Environmental Security Computing Center in Fairmont, West Virginia Prepared for the U.S. Department of Energy’s Federal Energy Management Program By Lawrence Berkeley National Laboratory Rod Mahdavi, P.E. LEED AP May 2014
-
Upload
duongkhanh -
Category
Documents
-
view
219 -
download
4
Transcript of Approaches in NOAA’s - energy.gov · AHU Air Handler Unit ... Case Study: Innovative Energy...

Case Study: Innovative
Energy Efficiency
Approaches in NOAA’s
Environmental Security
Computing Center in
Fairmont, West Virginia
Prepared for the U.S. Department of Energy’s
Federal Energy Management Program
By Lawrence Berkeley National Laboratory
Rod Mahdavi, P.E. LEED AP
May 2014

i
Contacts
Rod Mahdavi, P.E., LEED AP
Lawrence Berkeley National Laboratory
1 Cyclotron Road
Berkeley, CA 94270
(510) 495-2259
E-mail: [email protected]
For more information on the Federal Energy Management Program, please contact:
Will Lintner, P.E., CEM
Federal Energy Management Program
U.S. Department of Energy
1000 Independence Ave SW
Washington, DC 20585
(202) 586-3120
E-mail: [email protected]

ii
Acknowledgements
The author would like to acknowledge the assistance of Darren Smith for facilitating the visit
and making this case study possible.

iii
Abbreviations and Acronyms:
0F Degrees Fahrenheit
AHU Air Handler Unit
BAS Building automation system
CFD Computational Fluid Mechanics
EEM Energy Efficiency Measure
GHG Greenhouse gas
Gpm Gallons per minute
HPC High performance computing
IT Information Technology
kV Kilovolt or a thousand volts
kW Kilowatt or a thousand watts
MWh Megawatt hour or a million watt hours
PUE Power utilization effectiveness, ratio of total energy use to the
energy use by IT systems
RDHx
TES
UPS
VFD
Rear Door Heat Exchanger
Thermal Energy Storage
Uninterruptable power supply
Variable Frequency Drive

iv
Contents
Executive Summary .................................................................................................................................... 5
Facility Systems .......................................................................................................................................... 7
Cooling System ..........................................................................................................................7 Electrical System .......................................................................................................................7
Implemented Energy Efficiency Measures During Original Construction ............................................ 8
Dry Coolers ................................................................................................................................8
Rear Door Heat Exchanger ........................................................................................................9
Hot Aisle Containment ..............................................................................................................9 EEMs Implemented During Baseline Period ............................................................................................ 9
Opportunities ............................................................................................................................................. 11
Recommendations .................................................................................................................................... 12
Improve Air Management ........................................................................................................12 Improve the Cooling Efficiency...............................................................................................12
Other Efficiency Measures ......................................................................................................12
List of Tables
Table 1. Impact of EEMs on PUE and Energy Use ................................................................................... 6
List of Figures
Figure 1. Impact of EEMs on PUE and Annual Energy Use .................................................................... 6
Figure 2. HVAC Schematic ......................................................................................................................... 7
Figure 3. Dry Coolers/Chillers.................................................................................................................... 8
Figure 4. RDHx and Piping ......................................................................................................................... 8
Figure 5. Hot Aisle Containment Photo and Thermal Map ..................................................................... 9
Figure 6. TES and Chilled Water System Data in BAS screen ............................................................. 10
Figure 7. Water Flow Stabilized After 2 Hours at 300gpm .................................................................... 10
Figure 8. PUE Improvement Because of Reduced Water Flow to TES ................................................ 11

5
Executive Summary
Lawrence Berkeley National Laboratory (LBNL)’s staff evaluated the energy efficiency of the
National Oceanic and Atmospheric Administration’s (NOAA) new data center in Fairmont, West
Virginia. LBNL conducted this evaluation as part of the Federal Energy Management Program’s
technical assistance program during the summer of 2012. The NOAA Environmental Security
Computing Center (NESCC) is a 6 megawatt (MW) capacity, high density data center facility
that commenced operations in October 2011. During the design phase of the project, LBNL
recommended innovative ideas for improving facility energy efficiency. As a result, the
following measures were implemented:
Dry coolers were installed to partially or entirely cool the data center without chiller
operation when outdoor temperatures are below the chilled water return temperature.
Hot aisle containment was installed as an energy saving measure for more efficient air
management.
Rear door heat exchangers (RDHx) were also used on most of the racks for more efficient
heat transfer.
This study estimates the impact of energy efficiency measures (EEMs) at the NOAA data center,
including both new opportunities, as well as those that are already applied. During this study, the
potential energy savings due to dry coolers was verified, although during the baseline
(assessment period including environmental and power monitoring by assessor) period ambient
temperature was high and dry coolers were not in operation. Additionally, the impacts of rear
door heat exchangers and hot aisle containment were estimated. Results from the study are
illustrated in Table 1.
Four scenarios (no EEMs, baseline, dry coolers, and higher chilled water temperatures) were
considered, with data center power utilization effectiveness (PUE) and annual energy use
compared between each of these scenarios. The PUE is the ratio of total data center power (or
energy) use to the power (or energy) use of the information technology (IT) equipment within
the data center. At the NOAA Data Center, facility PUE can be reduced from a baseline amount
of 1.62 to 1.33, and the annual energy use can be reduced from 11,600 megawatt hours (MWh)
to 9,600 MWh, under the most favorable scenario. Annual savings are estimated at 2,100 MWh
that would result in an avoidance of 2,000 metric tons of greenhouse gas (GHG) emissions and a
concurrent reduction in electricity costs of $125,000. Estimated power consumption by different
users under four different states, original design, current installation (baseline), functional dry
coolers, and after implementation of the EEMs recommended in this report, are listed in Figure 1
and Table 1.

6
Figure 1. Impact of EEMs on PUE and Annual Energy Use
Estimated Annual Energy MWh
Use Point W/O EEMs Baseline dry coolers higher temps
Current IT Load 7,000 7,000 7,000 7,000
UPS Loss 370 370 370 370
PDU/trans loss 260 260 260 260
Standby Gen 130 130 130 45
Lighting 160 160 160 45
Cooling 3,300 2,750 2,100 1,300
Fans 670 520 520 260
TOTAL 11,890 11,190 10,540 9,280
PUE 1.70 1.60 1.51 1.33
Table 1. Impact of EEMs on PUE and Energy Use
1.00
1.10
1.20
1.30
1.40
1.50
1.60
1.70
1.80
W/OEEMs
Baseline drycoolers
highertemps
PUE
0
2,000
4,000
6,000
8,000
10,000
12,000
W/O
EEM
s
Bas
elin
e
dry
co
ole
rs
hig
her
te
mp
s
Annual energy use MWh
#REF!
Fans
Cooling
Lighting
Standby Gen
PDU/trans loss

7
Facility Systems
Cooling System Cooling air for the data center is provided exclusively by three air handler units (AHU), rated at
47,000 cubic foot/minute each. Cooling air from the AHUs is supplied under the raised floor
from one side of the data center. Return airflow is through the ceiling registers and ceiling
plenum, back to the AHUs as illustrated in Figure 2. The AHU fans have variable frequency
drives (VFD) that are currently controlled by manually adjustable set-points. Chilled water
valves are controlled by the supply air temperature set-point. Chilled water is provided by the
central chilled water plant. The chilled water plant is comprised of three 500 ton air-cooled
chillers, eight 150 ton dry coolers each with eight fans, primary and secondary pumps, and a
10,000 gallon thermal storage. A building automation system (BAS) monitors and controls the
plant. As Figure 2 shows, the facility has conventional air cooled racks as well as racks with rear
door heat exchangers. This presents an opportunity, since the air from contained hot aisle is
mixed with the relatively cool air from other areas. This dilutes the return air temperature,
making it cooler than it needs to be, and reduces the chilled water return temperature.
CHILLED
WATER
SUPPLY/
RETURN
PIPES
AIR COOLED
CHILLER
Rear Door HX
Dry Cooler
CENTRAL AIR
HANDLERs
Under raised floor supply air plenum
hot aisle
containment
COIL
Ceiling return air plenum
TES
Figure 2. HVAC Schematic
Electrical System The building is served by two main 12.47 Kilovolt (KV) utility feeders. Two 2,000 Kilowatt
(kW) diesel standby generators are provided to power selected critical loads, including the IT
load and the mechanical equipment loads serving the IT. A flywheel rotary uninterruptable
power supply unit (UPS) is provided to supply short term un-interrupted power to the high
performance computational (HPC) equipment. This system is more efficient than a conventional
UPS system. A conventional double conversion UPS system provides uninterrupted power to
other loads. Each UPS system is sized for 970 kW.

8
Implemented Energy Efficiency Measures During Original Construction
NOAA’s data center has already adopted several energy savings measures, including dry coolers,
rear door heat exchangers, hot aisle containment, and a rotary UPS system. Without the
availability of these EEMs, facility PUE would have been approximately 1.7. Additionally, the
PUE would have been even higher if computer room air handlers were used instead of central air
handlers. The baseline included hot aisles, rotary UPS, and rear door heat exchangers but no dry
cooler operation. The calculated PUE during baseline was 1.60.
Dry Coolers Dry coolers take advantage of cold seasons and nights to provide chilled water without
compressor use. Estimated hours of dry coolers at the current chilled water temperature is 4,500,
or about half of the total. The PUE is estimated to be reduced to 1.58 with dry coolers fully
operational. Figure 3 shows the dry coolers, chillers, and Thermal Energy Storage (TES).
Figure 3. Dry Coolers/Chillers
Figure 4. RDHx and Piping

9
Rear Door Heat Exchanger As is shown in Figure 4, the Rear Door Heat exchanger (RDHx) option was developed to extract
heat at the rack level. A water-cooled door closes behind the rack and provides energy savings
by removing heat at the rear door closest to the heat source. This made it very efficient, as air
movement can be provided solely from the IT equipment fans. RDHx greatly reduces the
requirement for additional cooling in the server room by cooling the exhaust from the racks.
There is an opportunity to increase cooling water temperature, thus reducing cooling energy even
more.
Hot Aisle Containment All of the air cooled racks were located in an aisle with the exhaust side contained. Sealed
containment separates hot air from cold air and eliminates potential mixing. The result can be a
higher temperature difference between the AHU’s supply and return temperature. The air flow
can be reduced and fan energy can be saved. Also a higher supply air temperature can be
adopted, resulting in a higher chilled water supply temperature. A higher chilled water supply
temperature will result in better chiller efficiency and more hours of free cooling using the dry
coolers. Figure 5 exhibits the hot aisle as well as a thermal image of the west side of the data
center where hot aisle with temperatures above 90oF (red color) is identified.
Figure 5. Hot Aisle Containment Photo and Thermal Map
EEMs Implemented During Baseline Period
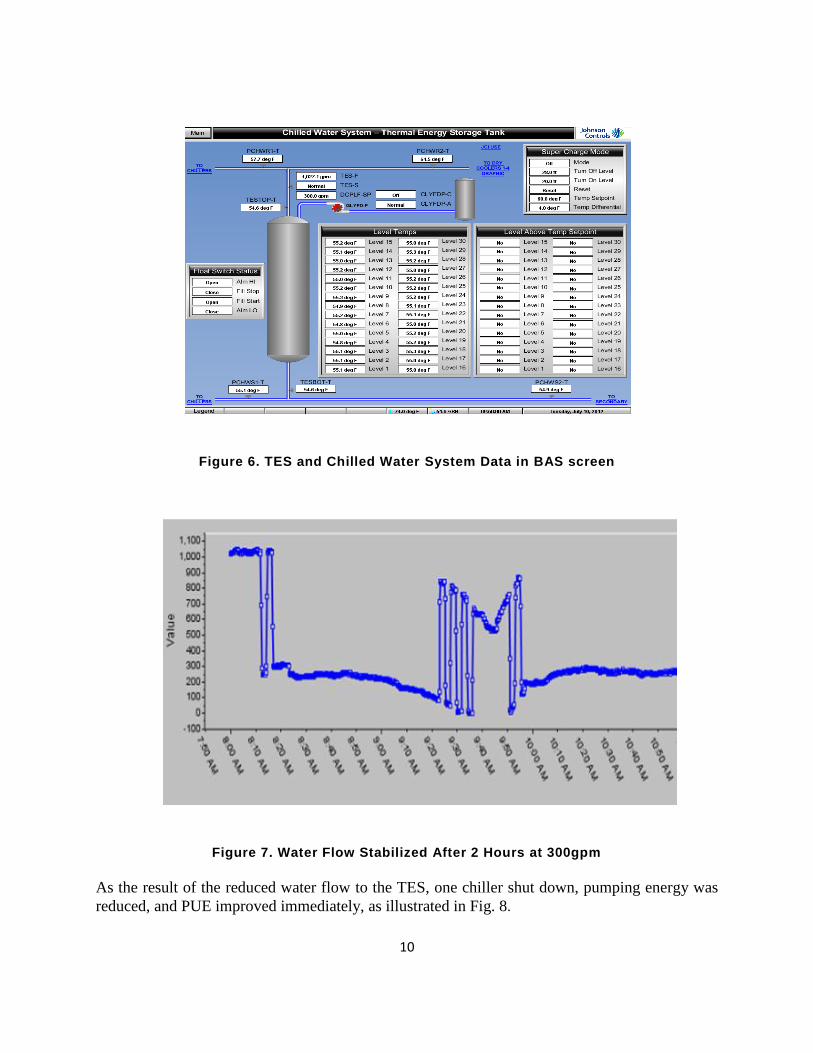
Thermal energy storage (TES) is employed to provide a few more minutes of chilled water to
AHUs when the chillers are down due to power failure. TES control was based on maintaining
1000gpm of chilled water supply flow to the TES at all times, supposedly to keep the tank cool.
This cold water mixed with return water from the building reduced return water temperature
going back to the chillers, thus reducing system efficiency while greatly increasing pumping
power. During the baseline period, the energy use assessment team implemented a plan for
reducing chilled water flow through the TES down to 300gpm, as illustrated in the Building
Automation System (BAS) screens (Figures 6,7).
10
Figure 6. TES and Chilled Water System Data in BAS screen
Figure 7. Water Flow Stabilized After 2 Hours at 300gpm
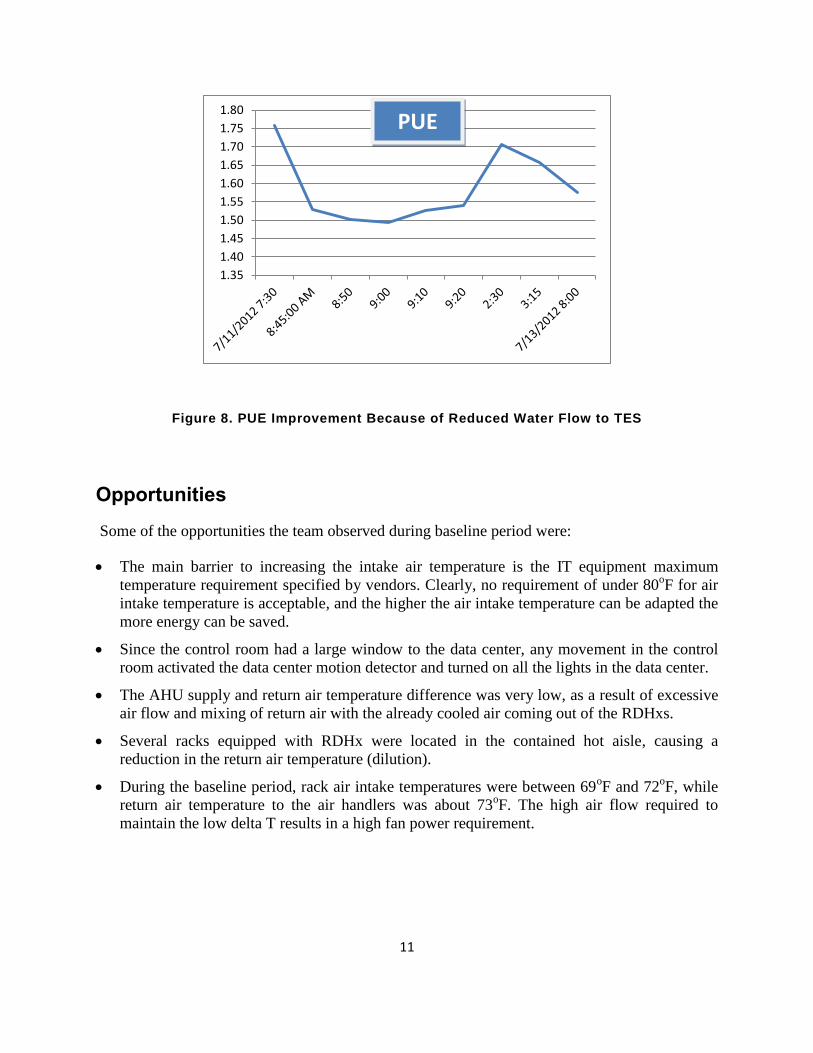
As the result of the reduced water flow to the TES, one chiller shut down, pumping energy was
reduced, and PUE improved immediately, as illustrated in Fig. 8.
11
Figure 8. PUE Improvement Because of Reduced Water Flow to TES
Opportunities
Some of the opportunities the team observed during baseline period were:
The main barrier to increasing the intake air temperature is the IT equipment maximum
temperature requirement specified by vendors. Clearly, no requirement of under 80oF for air
intake temperature is acceptable, and the higher the air intake temperature can be adapted the
more energy can be saved.
Since the control room had a large window to the data center, any movement in the control
room activated the data center motion detector and turned on all the lights in the data center.
The AHU supply and return air temperature difference was very low, as a result of excessive
air flow and mixing of return air with the already cooled air coming out of the RDHxs.
Several racks equipped with RDHx were located in the contained hot aisle, causing a
reduction in the return air temperature (dilution).
During the baseline period, rack air intake temperatures were between 69oF and 72
oF, while
return air temperature to the air handlers was about 73oF. The high air flow required to
maintain the low delta T results in a high fan power requirement.
1.35
1.40
1.45
1.50
1.55
1.60
1.65
1.70
1.75
1.80PUE

12
Recommendations
Improve Air Management
Install differential pressure sensors above and below the floor to control the airflow of the
AHUs. The airflow set-point can be can then be reset by the rack top air intake temperature.
This should result in reducing airflow and power used by fans.
Limit the cooling air flow to the racks without RDHx. This can be done by replacing
perforated tiles and ceiling registers with solid ones.
Improve the Cooling Efficiency
Install rack sensors for measuring the temperatures at the server level, to allow for the
implementation of EEMs without concerns for interrupting data center operations. A case in
point was the temporary installation of the temperature sensors during the baseline period, in
which changes were made to the cooling system sequence without any risk to the IT
operation.
Allow higher IT air intake temperature (upper side of ASHRAE recommended range). With
this, the air handler supply air temperature set point can be increased (from about 60oF to
75oF). With the air handler at a higher supply air temperature, the chilled water supply
temperature set point can be higher (about 65oF instead of 55
oF). The chiller efficiency will
improve (approximately 1.5% for each degree Fahrenheit of set point temperature). Also, the
number of “free cooling”/compressor-less hours will increase. This needs to be done
gradually (approximately 2oF at each step), and the impact will need to be monitored until the
highest possible temperature is reached without compromising the reliability of the cooling
system. The impact of such an increase (more than 10o F) can substantially improve the PUE,
primarily by increasing the annual compressor-less cooling hours to 5,900 hours and by
increasing the chiller efficiency.
Raise the chilled water temperature to eliminate the likelihood of condensation allowing an
expansion of the n relative humidity range to 20-80%. Raising the chilled water temperature
will enable NOAA to remove the heat pumps. In this case, heat pumps that were present for a
tighter control of the humidity can be removed.
Shut down the outside airflow to the data center by sealing the dampers or replacing the
existing dampers with higher quality dampers to eliminate the source of the humidity that
caused condensation. This is another option to allow for the removal of the heat pumps.
Change the TES control from water flow to TES temperature monitoring for bypass water
flow control. It will reduce bypass water to the TES which saves pumping power and
increases the efficiency of the chiller.
Other Efficiency Measures
Improve the control of the lights by separating the circuits and allowing the occupancy
sensors to activate only the occupied area and not the whole data center. Additionally, adjust

13
the occupancy sensors to resolve the issue of the data center’s occupancy sensors being
activated by movement from the control room occupants.
Improve the block heater controls for the generators by resetting them to lower temperatures,
thus reducing the power used by the heaters.
Discuss the thermal requirements of the servers with the vendors and negotiate relaxing the
requirements. Also consider the procurement of new IT systems, including liquid cooled
systems. This measure was not considered in the savings calculations in this report, but could
increase reliability as well as decrease energy costs.

14
Printed with a renewable-source ink on paper containing at
least 50% wastepaper, including 10% post consumer waste.
DOE/EE--1076 ▪ May 2014