APPLYING SERVQUAL TO THE BANKING INDUSTRY · EAST-WEST Journal of ECONOMICS AND BUSINESS 57 Journal...
15
EAST-WEST Journal of ECONOMICS AND BUSINESS 57 Journal of Economics and Business Vol. XIX – 2016, No 2 APPLYING SERVQUAL TO THE BANKING INDUSTRY Andreas P. Kakouris University of the Aegean, Panagiotis K. Finos Hellenic Open University ABSTRACT This empirical study examines the service quality perceptions of customers of the leading bank in the Serbian market. The survey was conducted by using the widely used SERVQUAL measurement tool. Moreover, comparison between SERVQUAL findings and customer satisfaction surveys was conducted along with an attempt to prove correlation between customers’ perceptions regarding service quality. Findings revealed gaps between expectations and perceptions among customers of the case-in-study bank which implies that there are service quality shortfalls that need to be taken care off. The absence of scientific work related to service quality measurement using SERVQUAL method in the Serbian banking market, makes this work regarded as pioneering. Although SERVQUAL instrument exhibited several disadvantages in comparison to customer satisfaction surveys, the recommendation is not to abandon SERVQUAL measurements but to remove limitations and adapt it to better correspond to each case. Keywords: Service quality, SERVQUAL, Customer satisfaction, Serbia, Financial institutions. JEL Classification: M1
Transcript of APPLYING SERVQUAL TO THE BANKING INDUSTRY · EAST-WEST Journal of ECONOMICS AND BUSINESS 57 Journal...

EAST-WEST Journal of ECONOMICS AND BUSINESS
57
Journal of Economics and Business
Vol. XIX – 2016, No 2
APPLYING SERVQUAL TO THE BANKING INDUSTRY
Andreas P. Kakouris
University of the Aegean,
Panagiotis K. Finos
Hellenic Open University
ABSTRACT
This empirical study examines the service quality perceptions of customers of the
leading bank in the Serbian market.
The survey was conducted by using the widely used SERVQUAL measurement
tool. Moreover, comparison between SERVQUAL findings and customer
satisfaction surveys was conducted along with an attempt to prove correlation
between customers’ perceptions regarding service quality.
Findings revealed gaps between expectations and perceptions among customers of
the case-in-study bank which implies that there are service quality shortfalls that
need to be taken care off.
The absence of scientific work related to service quality measurement using
SERVQUAL method in the Serbian banking market, makes this work regarded as
pioneering. Although SERVQUAL instrument exhibited several disadvantages in
comparison to customer satisfaction surveys, the recommendation is not to
abandon SERVQUAL measurements but to remove limitations and adapt it to
better correspond to each case.
Keywords: Service quality, SERVQUAL, Customer satisfaction, Serbia, Financial
institutions.
JEL Classification: M1

EAST-WEST Journal of ECONOMICS AND BUSINESS
58
Introduction
As a consequence of the severe changes in the Serbian banking market that
occurred during the period of year 2001 to 2005, the majority of domestic banks in
Serbia closed and consequently substituted with foreign banks. This situation
brought a lot of benefits for the international banks which started operating in
Serbia. However, almost ten years after these changes, within the period of strong
economic crisis, the banking sector of Serbia is becoming increasingly complicated
as only few banks realized that the competitive advantage can be gained through
service quality and customer satisfaction improvements.
The purpose of this study is to examine the service quality perceptions of
customers of the largest bank in the Serbian market, by using the most widely used
tool for measuring service quality called SERVQUAL (Parasuraman et al. 1988).
The focal point is the investigation of the most important service quality shortfalls
via examining the gaps between customers’ expectations and perceptions regarding
service quality of the case-in-study bank. Furthermore, the results obtained were
cross examined with findings from customer satisfaction surveys with the objective
to determine the extent these two methods are indicating the same or similar
shortfalls or contradicting each other.
Literature Review
In the markets worldwide a constant struggle is being fought to meet or even to
exceed customers’ expectations, a complex task but for majority of firms (Berry et
al. 1985). World-class market performance in delivering high quality and cost
competitive service is essential for survival in today’s business environment (Cook
and Verma 2002). However, due to several basic characteristics of services, it is
much harder to measure service quality than quality of goods and tangible
products. In spite of the extensive growth of the service sector there were not
enough studies which had put an emphasis on service quality (Parasuraman et al.
1985). The main reason is the fact that service quality construct was difficult to
define and measure (Parasuraman et al. 1985). Before the establishment of a
service quality model three very important characteristics of services, which
differentiate them from goods were considered – intangibility, heterogeneity and
inseparability (Parasuraman et al. 1985).
Intangibility, in services, means that “they are performances rather than objects,
and precise manufacturing specifications concerning uniform quality can rarely be
set and unlike goods cannot be counted, measured, inventoried, tested and verified
in advance of sale” which makes them more difficult to be evaluated or their
quality to be measured (Parasuraman et al. 1985, p. 42).
Heterogeneity means that services’ performance “often varies from producer to
producer, from customer to customer and from day to day” (Parasuraman et al.
1985, p. 42).

EAST-WEST Journal of ECONOMICS AND BUSINESS
59
“While physical goods are being produced in a factory services are produced in a
process in which consumers interact with the production resources of the service
firm” (Gronroos 1998, p. 322). Therefore, consumption of a service is much more
“process consumption rather than outcome consumption” (Gronroos 1998, p. 322).
This is actually the third characteristic of services which could be defined as
inseparability.
It is possible that a part of the service may be prepared before the customers enter
the consumption process but the critical part of the service process, for the service
quality perception, occurs in interaction with customers (Gronroos 2001).
Moreover, another, fourth, characteristic of services – perishability, defined as
impossibility of services is inventoried (Zeithaml et al. 1985; Gronroos 2001).
The three dimensions of service quality are (Lehtinen and Lehtinen 1982):
[1] physical quality, which correlates to tangible features of services (e.g.
office spaces, various services related materials, equipment, etc.),
[2] interactive quality, which refers to process that occurs when customer and
service provider are communicating and contacting, i.e. interacting, and
[3] corporate quality, which, in fact, is the image of the service provider as
perceived by its customers and prospects.
Service quality dimensions by asking two questions; what and how it is delivered
(Gronroos 1982). The answer to the former, it is described as technical quality and
the answer to the latter is named as interactive quality. The manner in which
service is delivered, i.e. interactive quality, is more important since it influences to
a greater extent in creating service quality perceptions (Gronroos 2001).
Customers will evaluate service quality and the outcome will be in range of either
satisfaction or dissatisfaction (Swartz and Brown 1989). Furthermore, consumer
perceptions regarding service quality are result of comparing expectations before
service receiving and actual experiences from the service i.e. if a service provider
manages to meet consumer’s expectations satisfaction will occur but if this
discrepancy is negative dissatisfaction will occur, and if a service provider exceeds
customer’s expectations, the result would be a satisfied customer (Berry et al.
1985).
Methodology
The main goal is to determine the level of service quality as perceived by
customers of the case-in-study bank by using the SERVQUAL tool. This is the first
time this model is used in the case-in-study bank. In this section, the main features
of the way this survey was conducted will be presented.
A structured questionnaire, a standard 22 item SERVQUAL questionnaire with
five RATER dimensions, was used for this research effort. SERVQUAL
instrument prevails as one of the most widely used approaches to measure service
quality (Cook and Verma 2002) but still several authors question its universality

EAST-WEST Journal of ECONOMICS AND BUSINESS
60
(Buttle 1996; Nyeck et al. 2002). The RATER scale could be changed or enriched
so to be able to capture all levels of service quality in particular service industry
(Parasuraman et al. 1991).
In order to avoid interviewing the “wrong customers” (Newman 2001, p.134), the
questionnaires were given to active customers i.e. to customers that have ordered
one or more transactions in the previous three months period. Moreover, the survey
was anonymous and the customers were not asked to provide any personal data
(e.g. name, income, investments).
The size of the sample depends upon the number of variables in study and it should
be ten times the total number of items (Nunnaly 1978). In this case, since there
were 22 items, 220 subjects, i.e. filled questionnaires were needed. Since it was
expected that some of the interviews will be discarded, each branch (area) was
asked for 40 completed interviews, which means that maximum of 280 completed
interviews was expected (7 branches x 40 interviews). Once the survey was
completed, there were 251 interviews that could be used for further analysis.
The questionnaire consisted of two sections: the first section contained 22
SERVQUAL items divided into expectations and perceptions parts and a 7-point
Likert scale, with 1 meaning “totally disagree” and 7 meaning “totally agree” and
the second section dealt with customers’ standard demographical data and their
banking behavior. The questions related to customers’ banking behavior examined
the contact channel most often used, customer complaints and complaint handling
process, customers’ willingness to recommend the bank and whether a customer is
a “single” or “multi-bank” user.
The SERVQUAL questionnaires were administered to seven major branches that
were all “A” type branches meaning that they were among the largest branches in
their area and similar in terms of number of customers and size (number of joint
teller places, client advisors, small business operations, etc.). Furthermore, the
questionnaires were handed to the customers by their client advisors, who, while
providing a short explanation regarding the survey, gave the questionnaires to the
customers and asked them to fill them. Here, it must be underlined that the client
advisors were instructed to leave the customer to fill the questionnaire alone.
Additionally, the client advisors were instructed to stress out, in communication
with customers involved in the survey, the importance of customers’ objective
opinion. Also, the client advisors put an emphasis on the fact that the data will be
used for statistical purposes only and that the customers’ responds would directly
be forwarded to the central unit in charge of conducting the survey without
“interference” of the branch staff.
The case-in-study bank has started an extensive customer satisfaction program
recently and one of the aims of this particular study is to determine whether there
are some correlations in findings between these two types of surveys meaning if
they will be able to pinpoint the same or similar service quality shortfalls,

EAST-WEST Journal of ECONOMICS AND BUSINESS
61
respecting the fact that these two systems (questionnaires, methodologies, number
of interviewees, etc.) are significantly different.
Findings
Out of 287 interviews 36 interviews were discarded: 28 for the reasons of
objectivity (average score, for both expectations as well as perceptions, was 7) and
8 for the reasons of not being completed. Therefore, this research will be based on
results obtained from 251 interviews. The number of interviews included, does not
significantly surpasses the number of 220 interviews which could be regarded as
optimum considering the number of items.
Demographic data: the findings related to sample characteristics of customers
involved in the survey are presented in the Table І.
Table I – Sample Characteristics
Factor Category Percentage
(survey)
Percentage
(bank level)
Gender Male 48.2 52.1
Female 51.8 42.9
Age Group 17-24 2.0 9.1
25-34 23.1 25.5
35-44 35.9 21.0
45-54 22.7 18.7
54-65 14.7 16.9
65-74 1.6 8.8
Education Elementary 2.8 6.2
High School 41.4 59.9
University 50.2 28.0
Other 5.6 5.9
Banking behavior: The findings related to banking behavior are presented in the
Table II. It is important to emphasize that all questions asked to customers of this
survey are identical to those asked in the customer satisfaction survey, except for
“Recommendation” question which was, in this case, “Yes” or “No” question,
while in the customer satisfaction survey customers were asked to what extent they
would recommend the bank to a friend, relative, etc. Accordingly the answer could

EAST-WEST Journal of ECONOMICS AND BUSINESS
62
not be a simple yes or no but a point on, in this case, 10-point Likert scale. The
customers that answer 8 or more are considered to be “Promoters” and those who
answer 5 or less are considered to be “Detractors”. Customers who give grades 6
and 7 do not fall into any of those categories and that is the reason why percentage
in “Recommendation” column with regards to bank data, does not sum up to
100%. Regardless to these differences, it could be easily concluded that the case-
in-study bank has a large majority of customers willing to promote it, i.e. to spread
positive word of mouth which is proven not only by customer satisfaction surveys
but SERVQUAL survey as well.
Table II – Banking behavior
Factor Category Percentage
(survey)
Percentage
(bank level)
Branch Staff 86.0 75.5
Internet 6.8 6.0
ATM 6.0 17.0
Contact Center 0.4 1.3
Other 0.4 0.2
Multi-banking Yes 27.1 18.3
No 72.9 81.7
Recommendation Yes 96.4 90.1
No 3.6 5.4
Complaints No 85.6 96.0
Yes
14.4 4
Satisfied with overall complaint handling
process
69.4 40.8
Not satisfied with overall complaint handling
process
30.56 59.2
One of the most important issues related to low(er) usage of other channels among
bank customers in Serbian market, could be related to National Bank of Serbia
imposed regulations as well other legal regulations which restrict types of
EAST-WEST Journal of ECONOMICS AND BUSINESS
63
businesses that could be conducted between bank and its customers over e.g.
internet or phone. This means that customers, while using services over internet or
phone banking, could in majority of cases control their balances, make some
payments (on domestic accounts only) or perform exchange operations. Applying
for some products or services (overdrafts, loans, cards, etc.) or some more specific
banking operations still demand customer to be present in the branch. That answers
the question of lower usage of other channels in comparison to branches.
Interestingly, there is an 11% difference between two surveys with relation to
ATM usage.
Multi-banking: this survey shows that large majority of customers interviewed are
only using services of the case-in-study bank which has also been confirmed by
customer satisfaction surveys. Judging by the customer satisfaction index, these
multi-banking customers tend to have lower satisfaction index than single-banking
ones.
Recommendation: this survey highlights that the majority of customers are willing
to recommend the bank to a friend, relative or a colleague was also introduced, an
intention which has also been confirmed by customer satisfaction surveys.
Complaints: the majority of customers declared that they did not complain (not
even verbally) in the previous period. The difference in percentages between two
surveys, although not very significant, still exists.
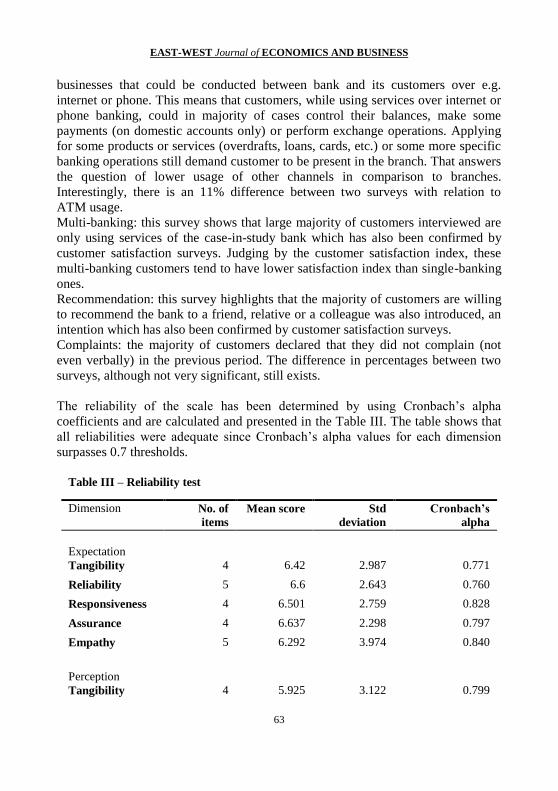
The reliability of the scale has been determined by using Cronbach’s alpha
coefficients and are calculated and presented in the Table III. The table shows that
all reliabilities were adequate since Cronbach’s alpha values for each dimension
surpasses 0.7 thresholds.
Table III – Reliability test
Dimension No. of
items
Mean score Std
deviation
Cronbach’s
alpha
Expectation
Tangibility 4 6.42 2.987 0.771
Reliability 5 6.6 2.643 0.760
Responsiveness 4 6.501 2.759 0.828
Assurance 4 6.637 2.298 0.797
Empathy 5 6.292 3.974 0.840
Perception
Tangibility 4 5.925 3.122 0.799

EAST-WEST Journal of ECONOMICS AND BUSINESS
64
Reliability 5 6.002 3.720 0.841
Responsiveness 4 5.974 3.424 0.845
Assurance 4 6.197 3.000 0.837
Empathy 5 5.827 4.287 0.828
The overall SERVQUAL score is obtained when average expectations score is
detracted from average perceptions score. Average Perceptions score, in this case,
is 5.979 whereas the average Expectations score is 6.486. Therefore, the overall
SERVQUAL gap has a negative score of -0.507. These findings imply that, overall
customers’ perceptions of case-in-study bank fall short of their expectations.
Table IV – Overall service quality
Perception
(mean) Expectation (mean) SERVQUAL gap
5.979 6.486 -0.507
When we divide the perceptions and expectations into five original RATER
dimensions, we could see that all dimensions have a negative SERVQUAL score.
By looking at the Table V, we can see that there is no gap that exceeds 1 whole
point. The highest negative SERVQUAL gap can be noted for Reliability
dimension (-0.598) while the lowest gap is present in the Assurance dimension (-
0.440). It seems that, in general, customers of the case-in-study bank receive lower
level of service quality than they expect to receive from an excellent bank.
Therefore, a conclusion could be drawn that case-in-study bank, in majority of
cases, is not able to adequately meet and accordingly exceed customers’
expectations, which, in turn, implies certain degree of customers’ dissatisfaction.
Table V – SERVQUAL scores of quality dimensions
Dimension Perception Expectation SERVQUAL gap
Tangibility 5.925 6.42 -0.496
Reliability 6.002 6.6 -0.598
Responsiveness 5.974 6.501 -0.527
Assurance 6.197 6.637 -0.440
Empathy 5.827 6.292 -0.464

EAST-WEST Journal of ECONOMICS AND BUSINESS
65
In order to determine what are the exact facets (i.e. items) that require bank’s
attention, dimensions have to be divided into single items (Table VI). The highest
gap can be found within Tangibility dimension, namely “Modern looking
equipment” and is followed by Empathy item “Convenient operating hours” (the
lowest perception score). The lowest gap is found in Tangibles but in this case with
“Materials associated with services are visually appealing” item (mostly thanks to
the lowest expectation score of that particular item).
Interestingly, in the “top five” items with highest SERVQUAL gaps, we can find
items from four dimensions. This is a clear indication that there is no dimension
that is more critical than the other, but that there are various service quality aspects,
belonging to different service quality dimensions, that need to be improved.
Table VI – SERVQUAL items and gaps
Dimension Item Perception Expectation Gap
Tangibility Modern looking equipment 5.669 6.534 -0.865
Appealing physical facilities 5.873 6.546 -0.673
Neat appearance of staff 6.179 6.562 -0.382
Materials associated with services are visually appealing
5.980 6.040 -0.060
Reliability Staff keeping promise 6.036 6.709 -0.673
Sincere interest in solving customers’
problems
6.036 6.669 -0.633
Staff performing service right the first
time 5.880 6.363 -0.482
Provide services at the time they promise
to do so 5.972 6.705 -0.733
Insists on error free records 6.088 6.554 -0.466
Responsiveness Staff telling customers exactly when
services will be performed 6.004 6.590 -0.586
Staff providing prompt service 5.920 6.478 -0.558
Staff willingness to help 6.155 6.625 -0.470

EAST-WEST Journal of ECONOMICS AND BUSINESS
66
Staff never too busy to respond to customers’ needs
5.817 6.311 -0.494
Assurance Behaviors of staff instills confidence in
customers 6.303 6.641 -0.339
Customers feel safe in their transactions 6.239 6.641 -0.402
Courtesy of staff 6.215 6.534 -0.319
Staff having knowledge and being
competent to answer questions 6.032 6.733 -0.701
Empathy Individual attention given by the bank 5.968 6.303 -0.335
Convenient operating hours 5.414 6.191 -0.777
Special attention given by the staff 6.020 6.203 -0.183
Staff giving customer best interest at
heart
5.813 6.454 -0.641
Understanding of specific needs 5.920 6.307 -0.386
Discussion of Findings
The aim of this section is to analyze the items with the highest service quality gaps,
in terms of establishing what exactly caused them as well as to provide directions
for narrowing them down, i.e. to provide directions for improvements. Information
obtained from customer satisfaction surveys as well as customers’ complaints will
be combined together with SERVQUAL results (in cases where it is possible
and/or necessary) in order to gain more complete picture about service quality
shortfalls or actions that need to be taken.
“Modern looking equipment” (Tangibility dimension, gap -0.865) – this item has
the second lowest perceptions score and it is this low score combined together with
moderately high expectations score that made the highest gap. This is also one of
the most surprising findings. Being the strongest bank in Serbian market as well as
the bank with highest investments in branch network (which of course includes
investments in equipment and branch layout) one could not expect such low
perception score for this particular item as well as for “Appealing physical
facilities” item. Nevertheless, it seems that customers do not perceive bank’s
equipment as being modern while they consider that it is important for the bank to
have modern looking equipment. It is hard to exactly determine the reasons for
such a high expectation score on one side and low perception score on another. By

EAST-WEST Journal of ECONOMICS AND BUSINESS
67
looking at things from customers’ perspective, modern looking equipment might
be important as a tool that enables functionalities of services in terms of fast and
reliable (error free) delivery. When we add the image of a market leader which,
among other things, implies innovations and reliability, (with equipment being one
of the tools which enables these image aspects), we can than better understand this
high gap score. Unfortunately, this item has no match in customer satisfaction
surveys and there were no complaints regarding appearance of the equipment. It is
not easy to provide answers to these questions, mostly because we are bound on
SERVQUAL survey only, which, is, in this case, telling us “what”, but is not
telling us “what precisely”. We first need to determine, what the places (i.e.
network areas) where these service short falls are the most obvious. Second we
need to see what the equipment that is not perceived as being modern actually is:
IT equipment in branches, ATMs, or something else that customers come in
contact with. Bearing in mind that investments in equipment could be very
expensive, suggestion at this point would be to determine what needs to be
“modernized” and where this “modernization” needs to take place. The “what
precisely” question could be answered with slightly modified SERVQUAL survey
or with introduction of this item in the standard customer satisfaction survey but in
the way that it can be able provide answer to aforementioned questions. Answering
these questions along with costs vs. benefit analysis could be a starting point in
deciding whether to act or not. Also, inclusion of the weights in the questionnaire
might have helped by indicating the importance this item has for customers.
“Convenient working hours” (Empathy dimension, gap -0.777) – this is the item
with lowest perceptions score (5.414). Judging by the results, we can conclude that
customers are dissatisfied with operating hours of branches. Unlike with the
previous item, there are clear indications coming from customer satisfaction
surveys and to some extent complaint handling data that customers of the case-in-
study bank are, in general, dissatisfied with working hours. Customer satisfaction
surveys data show that this is the second most often mentioned cause of
dissatisfaction, right after waiting time in branches. Obviously, there is a clear
connection between SERVQUAL data and CS data in this case. What are the
managerial implications with regards to this particular item? The case-in-study
bank has the second largest branch network in Serbia with more than 200 branches.
Naturally, this massive network demands large number of personnel. There are
many circumstances that influence the decision about working hours of the branch
– among which number of personnel and profitability of the branch seem to be the
most important. If we simplify the situation, we could draw a logical conclusion
that the best solution would be to prolong working hours by adding new personnel.
But, would that decision be a right one? We might increase customer satisfaction to
some extent but we might also be in danger of reducing branch’s profitability in

EAST-WEST Journal of ECONOMICS AND BUSINESS
68
terms that costs of hiring and paying new personnel might exceed the profit of the
branch. So, we could have slightly more satisfied customers, but we could also
have less profitable branches. The Customer satisfaction survey is also revealing
another important piece of information – the weight of this particular item on
overall customer satisfaction is not very high (i.e. it is low), which means that
improvement in this direction could, to a certain extent, mitigate this dissatisfaction
cause, but on the other hand it would not bring significant improvements in
customer satisfaction. The management of the bank realized that this is an
important issue for the customers. Therefore, apart from performing analysis of the
more “critical” branches and trying to conform their working hours to customers’
expectations, another approach was executed - the case-in-study bank tried to
educate the customers to use alternative channels for every day banking operations.
Being the only bank in Serbia who alongside developed branch and ATM network
and internet banking offered phone banking as well as mobile banking services, the
case-in-study bank wanted to show their customers that there are alternatives to
branch banking. However, judging by the results of this survey we could see that
customers could still be regarded as being conservative in terms of banking and
that they prefer the “face to face” contact. The thing which remains very important
is the fact that there is strong correlation in findings between CS and SERVQUAL
surveys with regards to this particular item.
“(Bank) Provide(s) services at the time they promise to do so” (Reliability
dimension, gap -0.733). High expectations are the reason for creating this high gap.
It seems that what this item stands for is very important for the customers of the
case-in-study bank. The fact that Reliability dimension, in total, has the highest
expectations score, gives an indication of importance of all items related to
reliability. This item certainly implies that there are certain issues in
communication with the customers because they base their expectations in
accordance with promises given by the service provider, bank in this case. One of
the most common reasons in failing to deliver the service at the time when it was
said that it would be delivered is over-promising. There is no adequate “match” to
this item in the customer satisfaction surveys but there is a certain (high)
percentage of complaints which are caused by similar communication issues.
SERVQUAL gives us very clear indications that there are certain issues in
communication with customers and problems in delivering the services when they
were supposed to be delivered.
We can see that three out of five Reliability items are more critical than the
remaining two (namely “Staff keeping promise”, “Sincere interest in solving
customers’ problems” and lastly “Provide services at the time they promise to do
so”). They could, as mentioned earlier, be named as over-promising issue. The
most obvious suggestion for the case-in-study bank would be to make a trade-off

EAST-WEST Journal of ECONOMICS AND BUSINESS
69
between promising on one side and service quality (i.e. performance) on another.
Likewise, some additional researches need to be conducted in order to see what
exactly was promised and not adequately delivered (is it a product or a service, is
the “over-promising issue” a result of e.g. a marketing campaign or inability to
handle large number of requests, etc.). Then, the findings should be analyzed and
concrete improvement actions for resolving either communication or other internal
problems should be taken.
“Staff having knowledge and being competent to answer questions” (Assurance
dimension, gap -0.701). High expectations are again cause for such a high gap
(6.733 – the highest score in comparison to all other items). This is also a very
surprising finding bearing in mind that knowledge and competence item is highly
evaluated by customers as shown by customer satisfaction surveys. Therefore this
particular item should be analyzed with care because of confronting findings.
Nevertheless, we can clearly see that staff being competent and knowledgeable is a
very important trait of a service provider as perceived by customers. Let us not
forget that SERVQUAL (as well as customer satisfaction survey) deals with
customers’ perceptions meaning that a service provider can indeed have competent
staff but the problem emerges when the staff is not perceived as being competent
by the customers.
Responsiveness dimension (gap -0.527) – although this particular dimension does
not contain any of the “top 5” critical items, it is by itself critical since it is the
dimension with the second highest gap. Having in mind the sample characteristics
of the customers involved in the survey who declared that branch is their preferred
contact channel, we could describe the entire dimension as “branch staff
performance” dimension. The first item “Staff telling customers exactly when
services will be performed” could be related to the explanation provided for the
Reliability dimension, more precisely over-promising issues. The item “Staff
willingness to help” is in a way perception about kindness and ability to listen to
customers while gap for “Staff never too busy to respond to customers’ needs”
item might not be necessarily caused by staff. As said before customers of the
case-in-study bank are dissatisfied the most with waiting time in branches. In cases
where there are a lot of people waiting, branch staff needs to make a trade off
between quality of service and serving speed. That might be the one of the reasons
that caused this gap to occur. With regards to this item, it seems that, by looking at
SERVQUAL results only, we can only speculate, rather than draw a precise
conclusion. However, on overall, these are very important findings since they
provide us with information that service provided by (mostly) branch staff needs to
be improved.

EAST-WEST Journal of ECONOMICS AND BUSINESS
70
Conclusions
The aim of this research effort is to measure customers’ service quality perceptions
of the leading bank in the Serbian market by using the most popular and widely
used service quality measurement tool – the SERVQUAL, in order to determine
the major service quality shortfalls of the case-in-study bank. Research revealed
several important shortfalls and considering that in all five service quality
dimension negative gap between perceptions and expectations exists, the
conclusion that can be drawn is that there is a certain level of dissatisfaction among
customers of the case in study bank making improvements necessary.
Clearly, there is a lot of potential in SERVQUAL tool and it can be modified to
correspond better to the service settings or market conditions. Therefore, this study
recommends the following regarding the use of SERVQUAL tool:
1) To introduce questions related to costs within SERVQUAL questionnaire
as a separate item.
2) To determine the number of interviews necessary to establish the
statistically valid expectations score and weights, so that expectations
scale (as well as weights assigning table) could be eliminated from
majority of questionnaires, thus shortening the time necessary for
completion of the questionnaires as well as data analysis.
3) To introduce questions related to the length and understandability of the
questionnaire.
4) To examine the possibility of performing benchmarking SERVQUAL
surveys with aim to determine service quality expectations as well as
perceptions of the competitors in the market.
References
Berry, L.L., Zeithaml, V.A. and Parasuraman, A., 1985, Quality Counts in
Services, Too, Business Horizons 28 (3): 44-52.
Buttle, F., 1996, SERVQUAL: Review, Critique, Research Agenda, European
Journal of Marketing 30 (1): 8-32.
Cook, L.S. and Verma, H., 2002, Exploring the Linkages between Quality
System, Service Quality, and Performance Excellence: Service Providers’
Perspectives, Quality Management Journal 9 (3): 44-56.
Gronroos, C., 1982, Strategic Management and Marketing in the Service
Sector, Helsingfors, Finland: Swedish School of Economics and Business
Administration.
Gronroos, C., 1998, Marketing Services: the Case of a Missing Product, The
Journal of Business & Industrial Marketing 13 (4/5): 322-338.
Gronroos, C., 2001, The Perceived Service Quality Concept – a Mistake?,
Managing Service Quality 11 (3): 150-152.

EAST-WEST Journal of ECONOMICS AND BUSINESS
71
Lehtinen, J.R. and Lehtinen, U., 1982, Service Quality: a Study of Quality
Dimensions, Helsinki, Finland: Service Management Institute.
Newman, K., 2001, Interrogating SERVQUAL: a Critical Assessment of
Service Quality Measurement in a High Street Retail Bank, International Journal
of Bank Marketing 19 (3): 126-139.
Nunnally, J.M., 1978, Psychometric Theory, 2nd
ed., New York: McGraw-Hill.
Nyeck, S., Morales, M., Ladhari, R. and Pons, F., 2002, 10 Years of Service
Quality Measurement: Reviewing the Use of the SERVQUAL Instrument,
Cuadernos de Difusion 7 (13): 101-107.
Parasuraman, A., Zeithaml, V.A. and Berry, L.L., 1985, A Conceptual Model
of Service Quality and Its Implications for Future Research, The Journal of
Marketing 49 (4): 41-50.
Parasuraman, A., Zeithaml, V.A. and Berry, L.L., 1988, SERVQUAL: A
Multiple-Item Scale for Measuring Customer Perceptions of Service Quality,
Journal of Retailing 64 (1): 12-40.
Parasuraman, A., Zeithaml, V.A. and Berry, L.L., 1991, Refinement and
Reassessment of the SERVQUAL Scale, Journal of Retailing 67 (4): 420-450.
Swartz, T.A. and Brown, S.W., 1989, Consumer and Provider Expectations and
Experiences in Evaluating Professional Service Quality, Journal of the Academy of
Marketing Science 17 (2): 189-195.
Zeithaml, V.A., Parasuraman, A. and Berry, L.L., 1985, Problems and
Strategies in Services Marketing, Journal of Marketing 49 (2): 33-46.