Applying Quality Deployment Ohfuji Tamagawa University.
42
Applying Quality Deployment Ohfuji Tamagawa University
-
Upload
margaretmargaret-reed -
Category
Documents
-
view
226 -
download
4
Transcript of Applying Quality Deployment Ohfuji Tamagawa University.

Applying Quality Deployment
OhfujiTamagawa University

Examples of Quality Deployment
• Conceptual diagram of general quality function deployment
• Conceptual diagram of quality deployment for the parts manufacturer
• Conceptual diagram of quality deployment for the material manufacturer
• Conceptual diagram of quality deployment for the production goods manufacturer
• Conceptual diagram of quality deployment for the service sector
• Conceptual diagram of quality deployment for new product development
• Conceptual diagram of quality function deployment in a narrow sense
• Conceptual diagram of quality deployment for process assurance starting from the design stage
• Conceptual diagram of quality deployment for ISO certification
• Conceptual diagram of quality deployment to cope with the PL Law
• Conceptual diagram of technology deployment
• Conceptual diagram of reliability deployment
• Conceptual diagram of policy deployment
• Conceptual diagram for the retailer

Conceptual Diagram of General Quality Function Deployment
① Identify user demands
② Convert source data into required items
③ Convert required items into quality required by users
④ Prepare a required quality deployment table
⑤ Prepare a quality elements deployment table
⑥ Prepare a quality table
⑦ Determine the planned quality
⑧ Convert the required quality importance into the quality elements importance
⑨ Determine the quality of design

Figure 1 Conceptual Diagram of General Quality Function Deployment
Required items
Quality table
⑤Quality elements deployment table
Req
uire
d qu
alit
y de
ploy
men
t ta
ble
④
⑥
Identify user demands ①
②Source data
Required quality ③
⑦
Impo
rtan
ce
⑨
Extract Quality
planning Importance
Qua
lity
of
de
sign
⑧

Conceptual Diagram of Quality Function Deployment for the Parts Manufacturer
① Select applicable parts
② Deploy applicable parts function
③ Deploy applicable parts quality characteristics
④ Prepare a two-dimensional table of parts quality characteristics and parts functions
⑤ Deploy quality characteristics of parts constituting applicable parts
⑥ Prepare a QC process chart for the production process of parts constituting applicable parts
⑦ Prepare a QC process chart for the assembly process of applicable parts.
⑧ Check the relationships between parts quality characteristics and product quality characteristics

Figure 2 Conceptual Diagram of Quality Deployment for the
Parts Manufacturer
Quality table
Par
ts q
ualit
y ch
arac
teri
stic
s de
ploy
men
t ta
ble
③Quality table
②Parts function
deployment table
⑤Deployment table of quality
characteristics for parts constituting the applicable parts
Product quality characteristics
deployment table
Req
uire
d qu
ality
depl
oym
ent
tabl
e
Select applicable parts
④⑧
QC process chart for the production process for
applicable parts
QC process chart for the
assembly process for
applicable parts
Applicable parts
①
⑥ ⑦

Conceptual Diagram of Quality Function Deployment for the Material
Manufacturer① Select applicable material
② Prepare a required quality deployment table
③ Prepare a quality characteristics deployment table
④ Prepare a two-dimensional table of required quality and quality characteristics
⑤ Prepare a material components deployment table
⑥ Prepare a two-dimensional table of quality characteristics and material components
⑦ Prepare a material production process factors deployment table.
⑧ Prepare a two-dimensional table of material components and process factors.

Req
uire
d qu
ality
de
ploy
men
t tab
le
②Quality table④
③Quality
characteristics deployment table
Mat
eria
l co
mpo
nent
s de
ploy
men
t tab
le
⑤Quality table⑥
⑦Material production
process factors deployment table
Quality table⑧
①Select applicable material
Applicable material
Figure 3 Conceptual Diagram of Quality Deployment for the Material Manufacturer

Conceptual Diagram of QFD for the Production Goods Manufacturer
① Select applicable production goods
② Prepare a quality characteristics deployment table for a product made of production goods
③ Prepare a production goods quality characteristics deployment table
④ Prepare a two-dimensional table of product quality characteristics and production goods quality characteristics
⑤ Deploy units and parts for applicable production goods
⑥ Prepare a quality characteristics deployment table for the unit and parts
⑦ Prepare a two-dimensional table of production goods quality characteristics and the unit and parts quality characteristics
⑧ Extract important units and parts in order to prepare a QC process chart

①
Quality characteristics
deployment table for production goods
Identify important units and parts
Product made of applicable production
goods
Pro
duct
re
quir
ed q
ualit
y de
ploy
men
t ta
ble
Quality table
②Product quality characteristics
deployment table
Uni
ts a
nd p
arts
de
ploy
men
t tab
le fo
r p
rodu
ctio
n go
ods
⑥
Quality table ④
Select applicable production goods
Applicable production goods
③
Quality table ⑦
Deploy units and parts for applicable production goods
⑤⑧
QC process chart
Figure 4 Conceptual Diagram of QFD for the Production Goods Manufacturer

Conceptual Diagram of QFD for the Service Sector
① Identify the service provided
② Consider the service quality
③ Investigate the demands on the service to be provided
④ Deploy the required quality of service
⑤ Deploy service quality elements
⑥ Prepare a two-dimensional table for the required quality of service and service quality elements
⑦ Deploy a work function for providing service
⑧ Prepare a two-dimensional table for service quality elements and work function
⑨ Identify important work in order to prepare a work manual

Quality table
⑤Deployment table for
service quality elements
Dep
loym
ent t
able
for
th
e re
quir
ed
qual
ity o
f se
rvic
e ④
Quality table
Wor
k fu
ncti
on
depl
oym
ent
⑦
③
Convert
① Identify the service provided② Consider the service quality
⑥
⑧Work manual
⑨
Market demands and expectations
Figure 5 Conceptual Diagram of QFD for the Service Sector

Conceptual Diagram of QFD for New Product Development
① Investigate market demands and expectations
② Convert market demands and expectations into demand (expectations) items/strategies and extract them
③ Prepare a demand (expectation) item deployment table
④ Investigate the degree of market expectation for demand (expectation) items
⑤ Implement a comparative analysis to determine the planned quality
⑥ Generate ideas with respect to demand (expectation) items to prepare a strategy deployment table
⑦ Prepare a two-dimensional table of the demand (expectation) item deployment table and the strategy deployment table
⑧ Extract quality elements for demands and strong expectations

Quality table
Quality elements deployment table
Importance
Quality of design
Deg
ree
of
expe
ctat
ion
⑦
⑥
Strategies (ideas) deployment table
Convert
Convert and extract
②
①① ②②
⑧
Quality planning
④ ⑤
Req
uire
d it
ems
depl
oym
ent
tabl
e
③
⑥
Market demands and expectations
Figure 6 Conceptual Diagram of QFD for New Product Development

Conceptual Diagram of QFD in a Narrow Sense
① Select applicable work② Extract the work function③ Prepare a work function deployment table④ Extract assurance items⑤ Prepare an assurance items deployment table⑥ Prepare a work function deployment table and an assurance
items deployment table⑦ Prepare a quality assurance activity list⑧ Prepare a quality assurance system chart

Deployment table for work function and assurance items
⑤
Assurance items deployment table
Wor
k fu
ncti
on
depl
oym
ent
tabl
e
③
⑥
Quality assurance activity list
Quality assurance system chart
⑦
⑧
Select applicable work ①
②
Applicable work
Extract
④
Extract work functions
Extract assurance items
Figure 7 Conceptual Diagram of QFD in a Narrow Sense

Conceptual Diagram of QFD for Process Assurance Starting from the Design Stage
① Prepare a quality characteristics deployment table
② Prepare a production process analysis table
③ Extract process factors
④ Prepare a two-dimensional table of process factors and quality characteristics
⑤ Check the quality of design
⑥ Extract the important process
⑦ Prepare a QC process chart

Quality table
①Quality characteristics
deployment table
Req
uire
d qu
alit
y de
ploy
men
t ta
ble
Quality table
Proc
ess
fact
ors
depl
oym
ent
tabl
e
③
④
⑥Extract process factors
②
⑤ Quality of design
Extract the important process
⑦QC process chart
Figure 8 Conceptual Diagram of QFD for Process Assurance Starting from the Design Stage
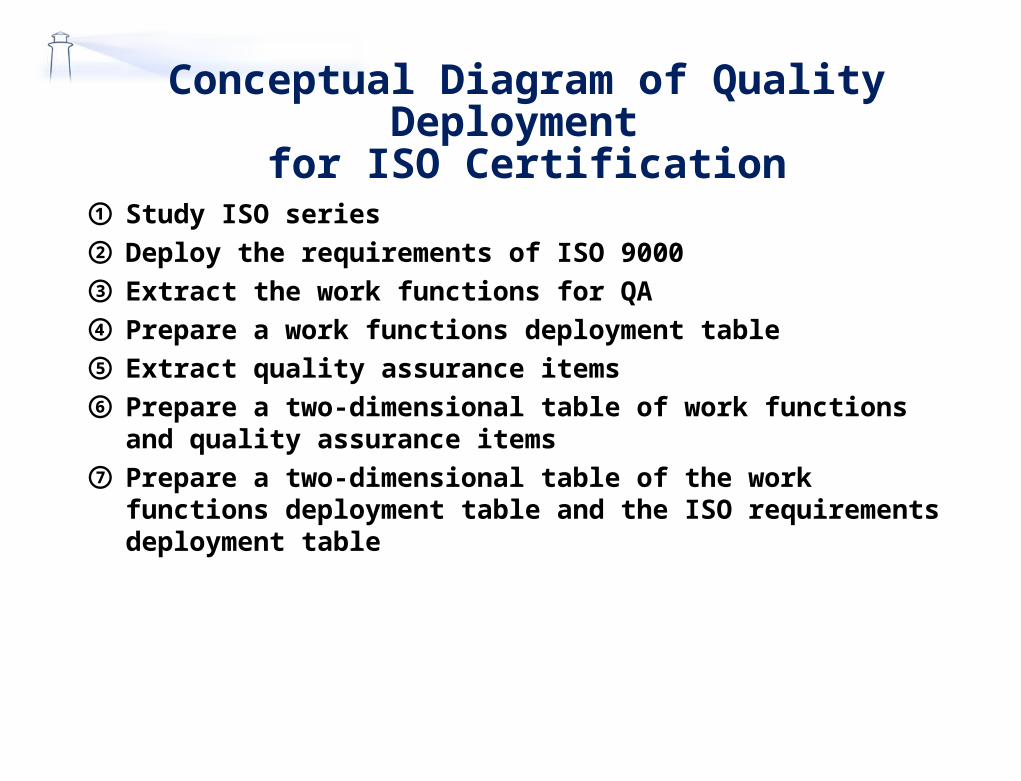
Conceptual Diagram of Quality Deployment for ISO Certification
① Study ISO series
② Deploy the requirements of ISO 9000
③ Extract the work functions for QA
④ Prepare a work functions deployment table
⑤ Extract quality assurance items
⑥ Prepare a two-dimensional table of work functions and quality assurance items
⑦ Prepare a two-dimensional table of the work functions deployment table and the ISO requirements deployment table

Figure 9 Conceptual Diagram of QFD for ISO Certification
Quality table
④
Work functions deployment table
Ass
uran
ce it
ems
depl
oym
ent
tabl
e
Quality tableIS
O r
equi
rem
ents
de
ploy
men
t tab
le
②
Extract work functions ③
Extract
⑤
Determine which ISO series certification will be acquired①ISO 9000 series
⑥
⑦

Conceptual Diagram of Quality Deployment to Cope with the PL Law
① Organize past defects
② Deploy situation to predict defects
③ Speculate on causes for defects
④ Prepare a relation diagram for causes to extract primary causes
⑤ Prepare a two-dimensional table of defects (phenomenon) and primary causes
⑥ Prepare a two-dimensional table of primary causes and secondary causes
⑦ Plan countermeasures in terms of hardware, software, and warning labels.
⑧ Prepare a two-dimensional table of causes and countermeasures
⑨ Prepare action plans for the established countermeasures
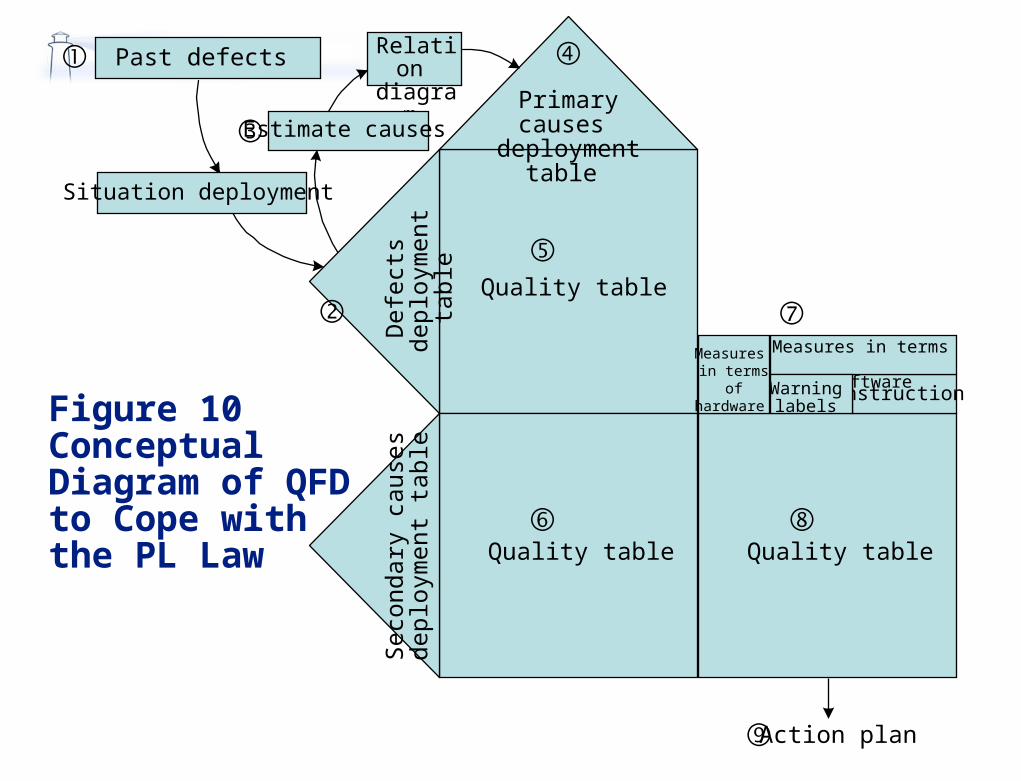
Figure 10 Conceptual Diagram of QFD to Cope with the PL Law
①
⑦Quality table
④Primary causes
deployment table
Quality table
Seco
ndar
y ca
uses
de
ploy
men
t tab
le
⑤
⑥Quality table
Instruction
Measures in terms of software
Measures in terms of hardware Warning
labels
⑧
Relation diagram
Estimate causes ③
⑨ Action plan
Past defects
Situation deployment
Def
ects
de
ploy
men
t tab
le
②

Conceptual Diagram of Technology Deployment
① Select applicable company
② Deploy applicable technology
③ Deploy action
④ Prepare a technology deployment table
⑤ Check the deployment table prepared using another deployment table

Figure 11 Conceptual Diagram of Technology Deployment
Extract technology
②
⑤Required quality deployment table
Technology and required quality
deployment table
Tec
hnol
ogy
depl
oym
ent t
able
④
⑤Quality characteristics
deployment table
Select applicable company ①Applicable company
③
App
licab
le
tech
nolo
gy
depl
oym
ent t
able
Act
ion
depl
oym
ent t
able
Technology and quality characteristics
deployment table

Conceptual Diagram of Reliability Deployment
① Prepare an FT table
② Prepare an FT table and a required quality deployment table
③ Prepare an FT table and a parts deployment table
④ Extract the important parts
⑤ Prepare an FMEA table

Figure 12 Conceptual Diagram of Reliability Deployment
Extract important parts
Prepare an FMEA table
④
⑤
Prepare an FT table ①Past defects
FT table
FT and required quality deployment
table R
equi
red
qual
ity
depl
oym
ent t
able
Prepare an FT table
Part
s de
ploy
men
t tab
le
②
③FT and parts
deployment table

Conceptual Diagram of Policy Deployment
① Check higher level policy
② Deploy targets
③ Deploy strategies
④ Prepare a matrix of targets and strategies
⑤ Check consistency with higher level policy

Figure 13 Conceptual Diagram of Policy Deployment
Matrix of targets and strategies
Extract strategies
Check higher level policy ①Higher level policy
⑤
②Targets
deployment table St
rate
gies
de
ploy
men
t tab
le
③
Extract targets
④ Check consistency with higher level policy

Conceptual Diagram for the Retailer
① Conduct market demands deployment
② Conduct substitute characteristics deployment
③ Translate market demands into the perceptions of suppliers
④ Implement comparative analysis to determine the target quality
⑤ Implement work functions deployment
⑥ Establish important work in order to realize the target quality
⑦ Implement management demands deployment (i.e., Results)
⑧ Deploy control items for the manager (i.e., Causes)

Conceptual Diagram for the Retailer
⑨ Establish control items to achieve management objectives
⑩ Implement comparative analysis to determine control targets
⑪ Identify relationships between the internal quality of conformance and market demands
⑫ Establish important work functions to realize control targets
⑬ Deploy the abilities and consciousness required of managers
⑭ Identify relationships between the work functions and abilities/consciousness required of managers
⑮ Deploy training methods to enhance abilities/consciousness
⑯ Establish training methods effective for enhancing abilities/consciousness

④
③R
equi
red
qual
ity
①
②Quality
characteristics
⑪
⑩
⑨
Man
agem
ent
dem
ands
⑦
⑧Control characteristics
⑥
Wor
k fu
ncti
ons
⑤⑫ ⑭
⑬Abilities and consciousness
⑯
Tra
inin
g m
etho
ds
⑮
QFD for Enhancing the CS and Abilities of Retailer Managers
Figure 14 Conceptual Diagram for the Retailer

Figure 15 Conceptual Diagram of Quality Deployment Based on
Specifications for the Parts Manufacturer
Determine the quality of design
Specifications and comparative analysis
Extract ①②
③④
⑤
⑥
⑦
Specifications deployment
Req
uire
d qu
alit
y

Figure 16 Conceptual Diagram of Quality Deployment Based
on Functions for the Parts Manufacturer
Determine the quality of design
Extract
①
②③
④
⑤
Fun
ctio
ns d
eplo
ymen
t
Quality characteristics

Figure 17 Conceptual Diagram of Quality Deployment for the Parts Manufacturer in Consideration of the Cooperative
System with the Customer
Determine the quality of design
①
②
③
④
⑤⑥
QA table, Parts
drawings
Assurance net
⑦
⑧
Quality characteristics
Cus
tom
er
dem
ands
U
nits
and
par
ts

Assurance Net (before improvement)
Parts attached the wrong way round
Wrong parts installation
Insufficient screw tightening
Damage
Defective color tone
Paint removal
Mask damage
Parts installation missed
Material acceptance
Injection molding
Mask setting
Paint drying
Appearance inspection
Lens installation
×× installation
Pre-delivery inspection
Maintain present
assurance level
Quality Process Defects
△★ ★
★
☆
★ ★☆ ★ ★
★ ★
★ ★
★
★★
○
△
×
×
×
△
×
★
☆
: Sufficient FP : Sufficient FP
: Sufficient: Sufficient
: Insufficient : Insufficient
: Not expected : Not expected
: Continuous
: Discontinuous
Defect shipment prevention Defect occurrence prevention Type of occurrence Category
Evaluation
①
②
③
④
①
①
①

No preventive action is taken other than pre-delivery inspection against highly probable defects such as missed parts installation and wrong parts installation.
Problems and Countermeasures in Quality Assurance
Though damage can occur in many processes, it is checked in only two processes.
As many as eight types of defects have to be checked in the pre-delivery inspection, which makes it impossible to do in a given line tact time.
100% inspection is carried out to detect defects that can be detected by regular inspection for continuous occurrence.
Strengthen FP.
Add processes to check quality
Properly allocate inspection items to adequate processes. Standardize inspection methods.
Review inspection methods.
Countermeasure for improvement Problems Item
①
②
③
④
Source: Raise the degree of quality assurance using ‘Assurance Net’ by Yasuhiko Seki

Assurance Net (after improvement)
○★ ★
★
100% inspection
☆
★ ★☆
FF
★ ★
★ ★
★ ★
★
★★
Sampling inspection
○
○
○
○
○
○
○
★
☆
: Sufficient FP : Sufficient FP
: Sufficient: Sufficient
: Insufficient : Insufficient
: Not expected : Not expected
: Continuous
: Discontinuous
Defect shipment prevention Defect occurrence prevention Type of occurrence Category
Evaluation
Parts attached the wrong way round
Wrong parts installation
Insufficient screw tightening
Damage
Defective color tone
Paint removal
Mask damage
Parts installation missed
Quality Process Defects
Material acceptance
Injection molding
Mask setting
Paint drying
Appearance inspection
Lens installation
×× installation
Pre-delivery inspection
Maintain present
assurance level
100% inspection
100% inspection
Sampling inspectio
n
Sampling inspection

How to Prepare a Conceptual Diagram
Step 1: Clarify the objective for implementing quality deployment
Step 2: Select the deployment tables (or lists) that are needed to achieve the objectives
Step 3: Consider the combination of the selected deployment tables (or lists) for achieving the objectives.
Step 4: Consider the two types of deployment table needed for constructing the two-dimensional table.
Step 5: Summarize the results of a series of considerations in a schematic representation using triangles and squares.
There are several types of conceptual diagrams depending on the objective. A conceptual diagram, however, can generally be constructed as follows:

Uni
ts a
nd p
arts
de
ploy
men
t ta
ble
Fun
ctio
ns
depl
oym
ent
tabl
e
Mechanism deployment table
Figure 4.1 Conceptual Diagram for Working out a Specific Product from Functions

Wor
k fu
ncti
ons
depl
oym
ent
tabl
e
Req
uire
d qu
alit
y de
ploy
men
t ta
ble
Quality characteristics
deployment table
Figure 4.2 Conceptual Diagram I for Identifying Work for Realizing Required Quality
Quality characteristics weight
Req
uire
d qu
alit
y w
eigh
tW
ork
func
tion
s w
eigh
t

Figure 4.3 Conceptual Diagram II for Identifying Work for Realizing Required Quality
Tec
hnol
ogy
depl
oym
ent
tabl
e
Quality characteristics weight
Req
uire
d qu
alit
y w
eigh
tT
echn
olog
y w
eigh
t
Work functions weight
Work functions deployment
table
Req
uire
d qu
alit
y de
ploy
men
t ta
ble
Quality characteristics
deployment table

Figure 4.4 Conceptual Diagram for the Parts Manufacturer in Consideration of the Cooperation System with the Customer
Uni
ts a
nd p
arts
de
ploy
men
t ta
ble
Cus
tom
er
dem
ands
de
ploy
men
t tab
le
Quality of design definition table
Cus
tom
er d
eman
ds
wei
ght
QA table, Parts
drawings
Assurance net
Quality characteristics
deployment table