Applying lean Six Sigma to reduce linen loss in an acute ...
17
MultiCraft International Journal of Engineering, Science and Technology Vol. 3, No. 7, 2011, pp. 39-55 INTERNATIONAL JOURNAL OF ENGINEERING, SCIENCE AND TECHNOLOGY www.ijest-ng.com © 2011 MultiCraft Limited. All rights reserved Applying lean Six Sigma to reduce linen loss in an acute care hospital Sandy L. Furterer 1 1* Holy Cross Hospital, Ft. Lauderdale, FL, USA; Southern Polytechnic State University, Marietta, GA, USA Corresponding Author emal: [email protected] Tel 954-229-7927 Abstract This paper describes a case study in an acute care hospital that formed a cross-functional team to apply the Lean Six Sigma problem solving methodology and tools to improve the linen processes. The goal of the project was to identify and implement process improvements that would reduce linen loss. The project team applied the Six Sigma DMAIC (Define-Measure- Analyze-Improve-Control) problem solving approach. The team was able to improve the key linen operational metric, soil to clean linen ratio by 16% and saved $77,480 for the first year, by making operational improvements and implementing automated linen and scrub dispensers. Keywords: Lean Six Sigma, Six Sigma, Quality Management, Change Management, Problem Solving, Hospital Linen Services. DOI: http://dx.doi.org/10.4314/ijest.v3i7.4S 1. Introduction: Lean Six Sigma is an approach focused on improving quality, reducing variation and eliminating waste in an organization. It is the combining of two improvement programs, Six Sigma and Lean Enterprise. Six Sigma is a quality management philosophy and methodology that focuses on reducing variation, measuring defects (per million output/ opportunities) and improving the quality of products, processes and services. The concept of Six Sigma was developed in the early 1980’s at Motorola Corporation (Harry and Schroeder, 2000). Six Sigma became popularized in the late 1990’s by General Electric Corporation and their former CEO Jack Welch. Lean Enterprise is a methodology that focuses on reducing cycle time and waste in processes. Lean Enterprise originated from the Toyota Motor Corporation as the Toyota Production System and increased in popularity after the 1973 energy crisis. The term “Lean Thinking” was coined by James P. Womack and Daniel T. Jones in their book, Lean Thinking (Womack and Jones, 1996). The term “Lean Enterprise” is used to broaden the scope of a Lean program from manufacturing to embrace the enterprise or entire organization. (Alukal, 2003) In the 1920s, at Western Electric, the concepts of control charts and statistical process control (SPC) were developed by Walter Shewhart. Dr. W. Edwards Deming installed SPC in Japanese manufacturing as he assisted Japan in their rebuilding efforts after World War II. Japan’s successes in the 1970s have re-popularized SPC in United States businesses. Total Quality Management (TQM) was a natural outgrowth of SPC adding a process improvement methodology. In the 1980’s Business Process Reengineering (BPR) and Total Quality Management (TQM) became popular. BPR encouraged completely throwing out the old process and starting over, many times within the context of implementing major information systems changes. Total Quality Management focused on a less structured approach with the principles of quality and process improvement. These methodologies evolved to Six Sigma. (Evans and Lindsay, 2011) On the Productivity side, the Ford Production System was used to assemble cars, which was the basis for the Toyota Production System (TPS). Just-in-time (JIT) production philosophies joined with TPS which evolved into Lean. Now Lean and Six Sigma are merging to capitalize on the best of both improvement philosophies and methodologies. (George, 2005) Six Sigma uses the DMAIC (Define, Measure, Analyze, Improve and Control) problem solving approach, and a wide array of quality problem solving tools. (Pyzdek, 2003). Use of these tools varies based on the type of process studied and the problems that
Transcript of Applying lean Six Sigma to reduce linen loss in an acute ...
MultiCraft
International Journal of Engineering, Science and Technology
Vol. 3, No. 7, 2011, pp. 39-55
INTERNATIONAL JOURNAL OF
ENGINEERING, SCIENCE AND TECHNOLOGY
www.ijest-ng.com
© 2011 MultiCraft Limited. All rights reserved
Applying lean Six Sigma to reduce linen loss in an acute care hospital
Sandy L. Furterer1
1*Holy Cross Hospital, Ft. Lauderdale, FL, USA; Southern Polytechnic State University, Marietta, GA, USA
Corresponding Author emal: [email protected] Tel 954-229-7927
Abstract This paper describes a case study in an acute care hospital that formed a cross-functional team to apply the Lean Six Sigma problem solving methodology and tools to improve the linen processes. The goal of the project was to identify and implement process improvements that would reduce linen loss. The project team applied the Six Sigma DMAIC (Define-Measure-Analyze-Improve-Control) problem solving approach. The team was able to improve the key linen operational metric, soil to clean linen ratio by 16% and saved $77,480 for the first year, by making operational improvements and implementing automated linen and scrub dispensers. Keywords: Lean Six Sigma, Six Sigma, Quality Management, Change Management, Problem Solving, Hospital Linen Services. DOI: http://dx.doi.org/10.4314/ijest.v3i7.4S
1. Introduction:
Lean Six Sigma is an approach focused on improving quality, reducing variation and eliminating waste in an organization. It is the combining of two improvement programs, Six Sigma and Lean Enterprise. Six Sigma is a quality management philosophy and methodology that focuses on reducing variation, measuring defects (per million output/ opportunities) and improving the quality of products, processes and services. The concept of Six Sigma was developed in the early 1980’s at Motorola Corporation (Harry and Schroeder, 2000). Six Sigma became popularized in the late 1990’s by General Electric Corporation and their former CEO Jack Welch. Lean Enterprise is a methodology that focuses on reducing cycle time and waste in processes. Lean Enterprise originated from the Toyota Motor Corporation as the Toyota Production System and increased in popularity after the 1973 energy crisis. The term “Lean Thinking” was coined by James P. Womack and Daniel T. Jones in their book, Lean Thinking (Womack and Jones, 1996). The term “Lean Enterprise” is used to broaden the scope of a Lean program from manufacturing to embrace the enterprise or entire organization. (Alukal, 2003) In the 1920s, at Western Electric, the concepts of control charts and statistical process control (SPC) were developed by Walter Shewhart. Dr. W. Edwards Deming installed SPC in Japanese manufacturing as he assisted Japan in their rebuilding efforts after World War II. Japan’s successes in the 1970s have re-popularized SPC in United States businesses. Total Quality Management (TQM) was a natural outgrowth of SPC adding a process improvement methodology. In the 1980’s Business Process Reengineering (BPR) and Total Quality Management (TQM) became popular. BPR encouraged completely throwing out the old process and starting over, many times within the context of implementing major information systems changes. Total Quality Management focused on a less structured approach with the principles of quality and process improvement. These methodologies evolved to Six Sigma. (Evans and Lindsay, 2011) On the Productivity side, the Ford Production System was used to assemble cars, which was the basis for the Toyota Production System (TPS). Just-in-time (JIT) production philosophies joined with TPS which evolved into Lean. Now Lean and Six Sigma are merging to capitalize on the best of both improvement philosophies and methodologies. (George, 2005) Six Sigma uses the DMAIC (Define, Measure, Analyze, Improve and Control) problem solving approach, and a wide array of quality problem solving tools. (Pyzdek, 2003). Use of these tools varies based on the type of process studied and the problems that
Furterer, S. / International Journal of Engineering, Science and Technology, Vol. 3, No. 7, 2011, pp. 39-55 40
are encountered. There are many powerful tools in the Lean tool set that help to eliminate waste, organize, and simplify the work processes. (Certified Six Sigma Black Belt Primer, Quality Council of Indiana, 2001) The Six Sigma DMAIC (Define, Measure, Analyze, Improve, Control) problem solving methodology is used to improve processes. The phases of the DMAIC are well-defined and standardized, but the steps performed in each phase can vary based on the reference used. The Define phase is where the scope of the project charter is developed. The goal of the Measure phase is to understand and baseline the current process. In the Analyze phase, the project team analyzes the data collected in the Measure phase to identify the root causes of the problems identified. In the Improve phase, the improvement recommendations are developed and implemented. The goal of the Control phase is to ensure that the improvements had a positive impact and that they will be sustained and controlled. The detailed steps and most frequently used tools applied within each phase of the DMAIC problem solving approach is shown in Table 1 (Gitlow, 2005) (Pyzdek, 2003), (Brassard, Michael, and Diane Ritter, 2001), (Certified Six Sigma Black Belt Primer, Quality Council of Indiana, 2001)
Table 1: Lean Six Sigma DMAIC Common Tools
Lean Six Sigma DMAIC Common Tools
DEFINE MEASURE ANALYZE IMPROVE CONTROL Project Charter Stakeholder analysis
SIPOC Process map Communication plan
Project Plan Items for Resolution
Ground Rules
Critical to Satisfaction (CTS) or Critical to Quality (CTQ)
Data collection plan
Quality Function Deployment (QFD)
Pareto Chart VOP Matrix Gauge R&R Cost of Poor Quality
Cause & Effect Diagram Why-Why Diagram
Histograms and Graphical Analysis
Correlation Analysis
Basic statistics Sampling Process Analysis
Failure Mode and Effects Analysis
Gap Analysis Hypothesis Tests
Summary of Problems
8 Wastes 5S Kaizen
Recommendations Improvement Plan Action Plan Cost/benefit Analysis
Cost of Poor Quality
Future State Process Map
Design of Experiments
Dashboards Scorecards Weighted Cause
and Effect Diagram
Hypothesis Testing
Design of Experiments Basic Statistics Graphical Analysis
Sampling Mistake Proofing
Standard Work FMEA Control Plan Process Capability
DPPM / DPMO Statistical Process
Control (SPC) Standard work Kaizen Dashboards Scorecards
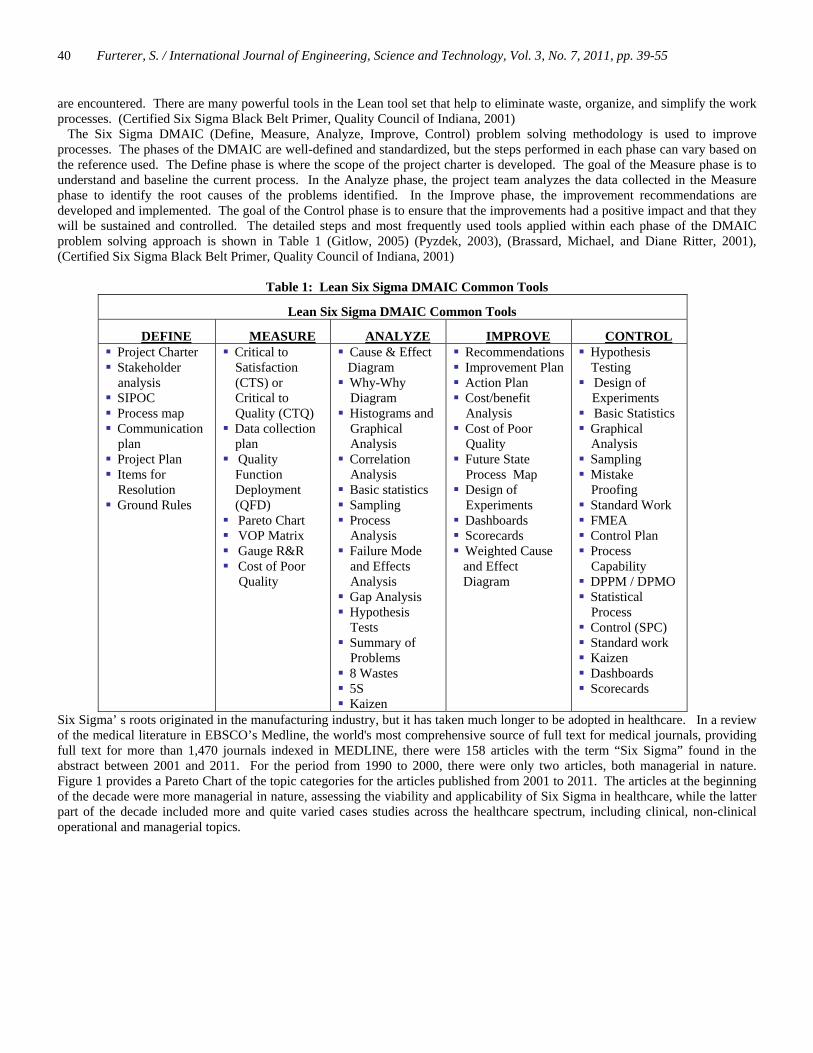
Six Sigma’ s roots originated in the manufacturing industry, but it has taken much longer to be adopted in healthcare. In a review of the medical literature in EBSCO’s Medline, the world's most comprehensive source of full text for medical journals, providing full text for more than 1,470 journals indexed in MEDLINE, there were 158 articles with the term “Six Sigma” found in the abstract between 2001 and 2011. For the period from 1990 to 2000, there were only two articles, both managerial in nature. Figure 1 provides a Pareto Chart of the topic categories for the articles published from 2001 to 2011. The articles at the beginning of the decade were more managerial in nature, assessing the viability and applicability of Six Sigma in healthcare, while the latter part of the decade included more and quite varied cases studies across the healthcare spectrum, including clinical, non-clinical operational and managerial topics.
Furterer, S. / International Journal of Engineering, Science and Technology, Vol. 3, No. 7, 2011, pp. 39-55 41
Frequency 5 5 4 2 2 2 1 150 21 17 12 11 10 8 7Percent 3 3 3 1 1 1 1 132 13 11 8 7 6 5 4Cum % 89 92 95 96 97 99 99 10032 45 56 63 70 77 82 86
TopicR&
D
Home C
are
Trau
ma
L&D/
NICU
IT/IS/
KMCli
nics
Reve
nue C
ycle/
Risk
Emerg
ency
Cardio
Phar
macy
Lab
Surge
ry
Imag
ing
Operatio
nal
Inpati
ent
Manag
erial
160
140
120100
80
6040
200
100
80
60
40
20
0
Freq
uenc
y
Perc
ent
Pareto Chart of Six Sigma Topics: 2001 to 2011
Figure 1: Pareto Chart of Six Sigma Topics 2001 to 2011 in EBSCO MEDLINE
There were no articles specifically addressing applying Lean Six Sigma to linen loss. There is still a great need to fill the gap of case studies and research articles applying Lean Six Sigma to healthcare. There is tremendous potential to apply this data-oriented approach to healthcare to streamline operations, enhance patient satisfaction and safety, and ensure positive healthcare outcomes. This case study provides an application of a Lean Six Sigma improvement project in the support services area of an Acute Care Hospital. The goal of the project was to reduce linen loss across the hospital. At first glance, it may appear this problem would not have a great impact on hospital services, however, linen is used by almost every department in the hospital that touches patients of the hospital. The linen loss could be quite high. When the project began, the team did not have an understanding of which departments use or lose the most linen or the root causes of the linen loss. The hospital did not know if the highest amount of linen was leaving with patients when they are discharged, or when they get transferred to a Skilled Nursing Facility; if ambulances are taking the linen when they leave the Emergency Department; if scrubs are “walking” out of the hospital; or if there is a problem with employee theft. This project applied Lean Six Sigma because it was 1) an important problem to the hospital, and 2) it is an unstructured problem, that could leverage the data analytical tools of Six Sigma. 2. Lean Six Sigma Methodology: This paper will be organized into the phases of the DMAIC (Define-Measure-Analyze-Improve-Control) problem solving methodology. The purpose of each phase is described here: (Pyzdek, 2003) 1) Define: The purpose of the Define phase is to delineate the business problem and scope the project and process to be improved. 2) Measure: The purpose of the Measure phase is to understand and document the current state of the processes to be improved, collect the detailed Voice of the Customer information, baseline the current state, and validate the measurement system. 3) Analyze: The purpose of the Analyze phase is to analyze the data collected related to the Voice of the Customer and the Voice of the Process to identify the root causes of the process problems, and to develop the capability of the process. 4) Improve: The purpose of the Improve phase is to identify improvement recommendations, design the future state, implement pilot projects, train and document the new processes. 5) Control: The purpose of the Control phase is to measure the results of the pilot projects, and manage the change on a broader scale; report scorecard data and the control plan, identify replication opportunities and develop future plans for improvement. 2.1 Define Phase: The Hospital’s Supply Chain committee identified the problem of linen loss. This committee reviews supplies expense and identifies where there is potential opportunity for reducing these expenses. The hospital is part of a consortium of hospitals in the south Florida area who jointly own a linen processing facility in Opalocka, Florida. The clean linen in the hospital is received at the receiving dock on a daily basis from what is ordered the day before. The linen is distributed by hospital stores/materials management on a scheduled basis to the departments. The soiled linen is gathered by Environmental Services and shipped each morning after the clean linen is delivered. The soiled linen is taken to the linen facility and cleaned. The following steps were executed in the Define Phase: (Brassard, et al, 2001)
1. Develop project charter 2. Perform stakeholder analysis
Furterer, S. / International Journal of Engineering, Science and Technology, Vol. 3, No. 7, 2011, pp. 39-55 42
3. Perform initial Voice of Customer (VOC) and Identify Critical to Satisfaction (CTS) 4. Select team and launch the project 5. Create project plan
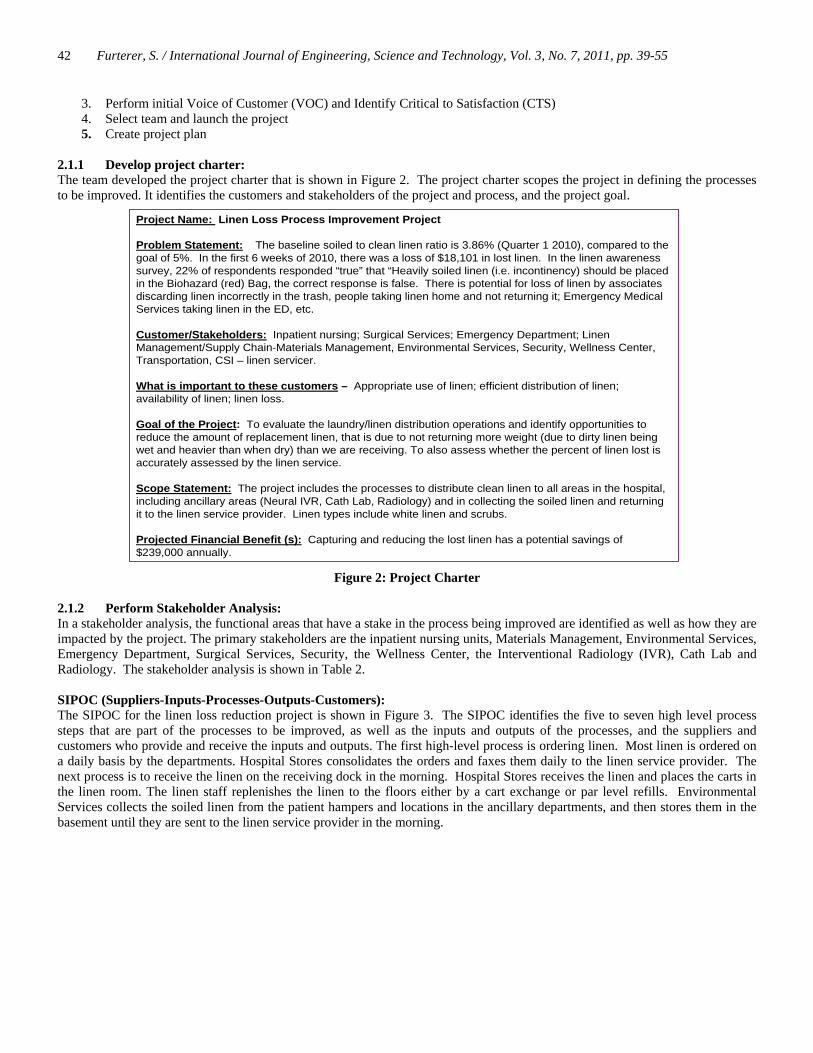
2.1.1 Develop project charter: The team developed the project charter that is shown in Figure 2. The project charter scopes the project in defining the processes to be improved. It identifies the customers and stakeholders of the project and process, and the project goal.
Figure 2: Project Charter
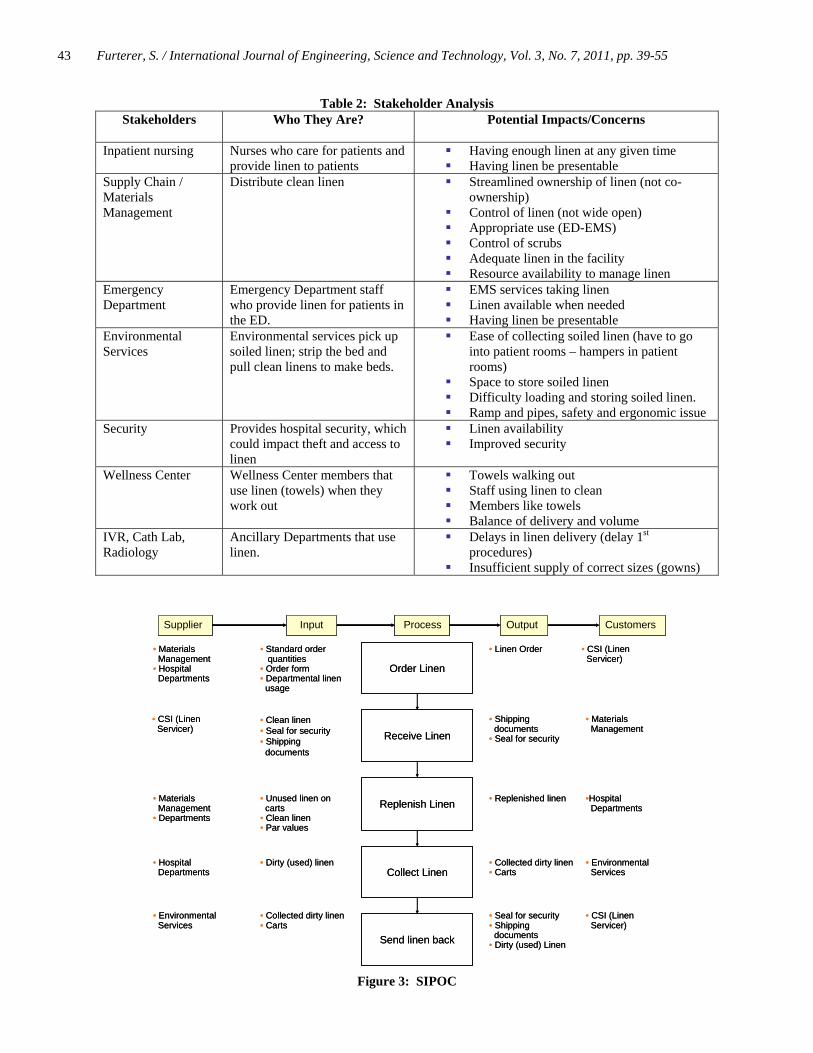
2.1.2 Perform Stakeholder Analysis: In a stakeholder analysis, the functional areas that have a stake in the process being improved are identified as well as how they are impacted by the project. The primary stakeholders are the inpatient nursing units, Materials Management, Environmental Services, Emergency Department, Surgical Services, Security, the Wellness Center, the Interventional Radiology (IVR), Cath Lab and Radiology. The stakeholder analysis is shown in Table 2. SIPOC (Suppliers-Inputs-Processes-Outputs-Customers): The SIPOC for the linen loss reduction project is shown in Figure 3. The SIPOC identifies the five to seven high level process steps that are part of the processes to be improved, as well as the inputs and outputs of the processes, and the suppliers and customers who provide and receive the inputs and outputs. The first high-level process is ordering linen. Most linen is ordered on a daily basis by the departments. Hospital Stores consolidates the orders and faxes them daily to the linen service provider. The next process is to receive the linen on the receiving dock in the morning. Hospital Stores receives the linen and places the carts in the linen room. The linen staff replenishes the linen to the floors either by a cart exchange or par level refills. Environmental Services collects the soiled linen from the patient hampers and locations in the ancillary departments, and then stores them in the basement until they are sent to the linen service provider in the morning.
Project Name: Linen Loss Process Improvement Project
Problem Statement: The baseline soiled to clean linen ratio is 3.86% (Quarter 1 2010), compared to the goal of 5%. In the first 6 weeks of 2010, there was a loss of $18,101 in lost linen. In the linen awareness survey, 22% of respondents responded “true” that “Heavily soiled linen (i.e. incontinency) should be placed in the Biohazard (red) Bag, the correct response is false. There is potential for loss of linen by associates discarding linen incorrectly in the trash, people taking linen home and not returning it; Emergency Medical Services taking linen in the ED, etc.
Customer/Stakeholders: Inpatient nursing; Surgical Services; Emergency Department; Linen Management/Supply Chain-Materials Management, Environmental Services, Security, Wellness Center, Transportation, CSI – linen servicer.
What is important to these customers – Appropriate use of linen; efficient distribution of linen; availability of linen; linen loss.
Goal of the Project: To evaluate the laundry/linen distribution operations and identify opportunities to reduce the amount of replacement linen, that is due to not returning more weight (due to dirty linen being wet and heavier than when dry) than we are receiving. To also assess whether the percent of linen lost is accurately assessed by the linen service.
Scope Statement: The project includes the processes to distribute clean linen to all areas in the hospital, including ancillary areas (Neural IVR, Cath Lab, Radiology) and in collecting the soiled linen and returning it to the linen service provider. Linen types include white linen and scrubs.
Projected Financial Benefit (s): Capturing and reducing the lost linen has a potential savings of$239,000 annually.
Furterer, S. / International Journal of Engineering, Science and Technology, Vol. 3, No. 7, 2011, pp. 39-55 43
Table 2: Stakeholder Analysis Stakeholders Who They Are? Potential Impacts/Concerns
Inpatient nursing Nurses who care for patients and provide linen to patients
Having enough linen at any given time Having linen be presentable
Supply Chain / Materials Management
Distribute clean linen Streamlined ownership of linen (not co-ownership)
Control of linen (not wide open) Appropriate use (ED-EMS) Control of scrubs Adequate linen in the facility Resource availability to manage linen
Emergency Department
Emergency Department staff who provide linen for patients in the ED.
EMS services taking linen Linen available when needed Having linen be presentable
Environmental Services
Environmental services pick up soiled linen; strip the bed and pull clean linens to make beds.
Ease of collecting soiled linen (have to go into patient rooms – hampers in patient rooms)
Space to store soiled linen Difficulty loading and storing soiled linen. Ramp and pipes, safety and ergonomic issue
Security Provides hospital security, which could impact theft and access to linen
Linen availability Improved security
Wellness Center Wellness Center members that use linen (towels) when they work out
Towels walking out Staff using linen to clean Members like towels Balance of delivery and volume
IVR, Cath Lab, Radiology
Ancillary Departments that use linen.
Delays in linen delivery (delay 1st procedures)
Insufficient supply of correct sizes (gowns)
Figure 3: SIPOC
Supplier Input Process Output Customers
Collect Linen
• Materials Management
• Hospital Departments
Replenish Linen
Receive Linen
Order Linen
Send linen back
• Standard order quantities
• Order form• Departmental linen
usage
• CSI (Linen Servicer)
• Linen Order
• CSI (Linen Servicer)
• Clean linen• Seal for security• Shipping
documents
• Materials Management
• Shipping documents
• Seal for security
• Materials Management
• Departments
• Unused linen on carts
• Clean linen• Par values
•Hospital Departments
• Replenished linen
• Hospital Departments
• Dirty (used) linen • Environmental Services
• Collected dirty linen• Carts
• CSI (Linen Servicer)
• Seal for security• Shipping
documents• Dirty (used) Linen
• Environmental Services
• Collected dirty linen• Carts
Furterer, S. / International Journal of Engineering, Science and Technology, Vol. 3, No. 7, 2011, pp. 39-55 44
2.1.3 Perform Initial Voice of Customer (VOC) and Identify Critical to Satisfaction (CTS) The Critical to Satisfaction Criteria (CTS) are the characteristics of the process that are important to the customers that
will be measured and improved during the project. The Critical to Satisfaction criteria for this project are:
Efficient distribution of linen: That linen is distributed in an efficient and timely manner. The team did not measure this CTS since it is out of the scope of the project.
Appropriate use of linen: That linen is used appropriately and is not lost or stolen. Availability of linen: That linen is available when needed and in the appropriate quantities for use. Security of linen: That linen is secure and is not lost or stolen. Loss of Linen: The amount of linen that is lost, not used and not returned to the linen processor.
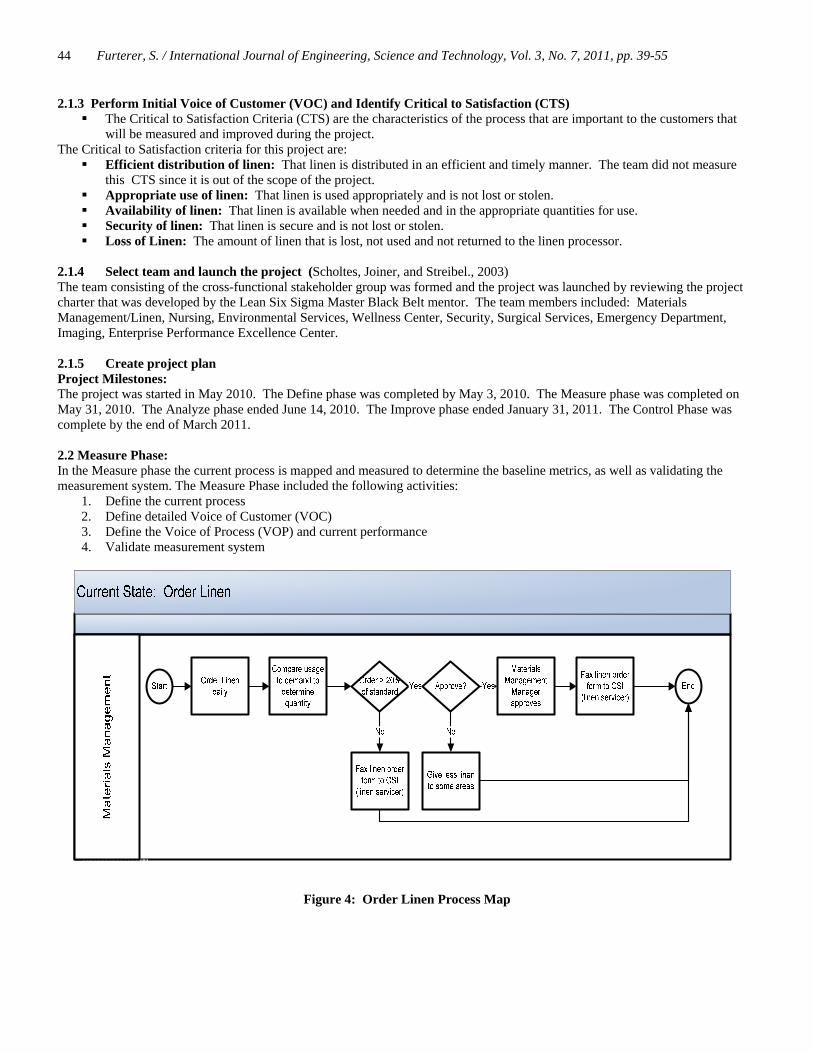
2.1.4 Select team and launch the project (Scholtes, Joiner, and Streibel., 2003) The team consisting of the cross-functional stakeholder group was formed and the project was launched by reviewing the project charter that was developed by the Lean Six Sigma Master Black Belt mentor. The team members included: Materials Management/Linen, Nursing, Environmental Services, Wellness Center, Security, Surgical Services, Emergency Department, Imaging, Enterprise Performance Excellence Center. 2.1.5 Create project plan Project Milestones: The project was started in May 2010. The Define phase was completed by May 3, 2010. The Measure phase was completed on May 31, 2010. The Analyze phase ended June 14, 2010. The Improve phase ended January 31, 2011. The Control Phase was complete by the end of March 2011. 2.2 Measure Phase: In the Measure phase the current process is mapped and measured to determine the baseline metrics, as well as validating the measurement system. The Measure Phase included the following activities:
1. Define the current process 2. Define detailed Voice of Customer (VOC) 3. Define the Voice of Process (VOP) and current performance 4. Validate measurement system
Figure 4: Order Linen Process Map
Furterer, S. / International Journal of Engineering, Science and Technology, Vol. 3, No. 7, 2011, pp. 39-55 45
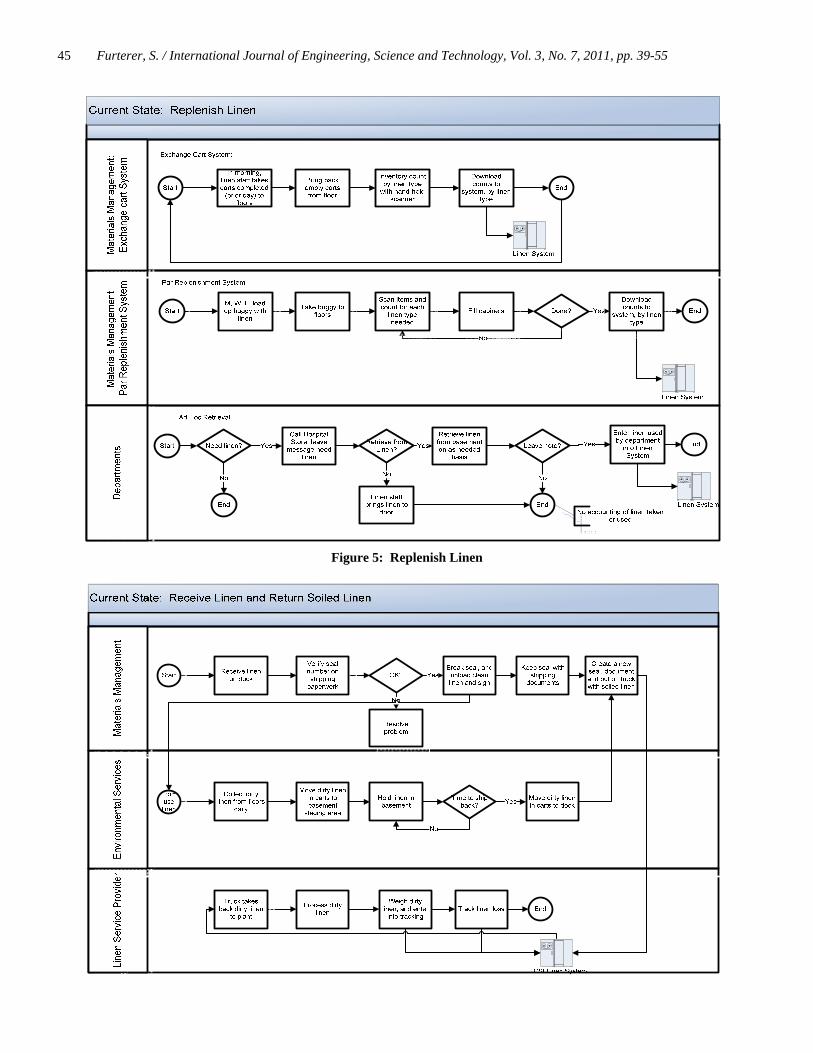
Figure 5: Replenish Linen
Furterer, S. / International Journal of Engineering, Science and Technology, Vol. 3, No. 7, 2011, pp. 39-55 46
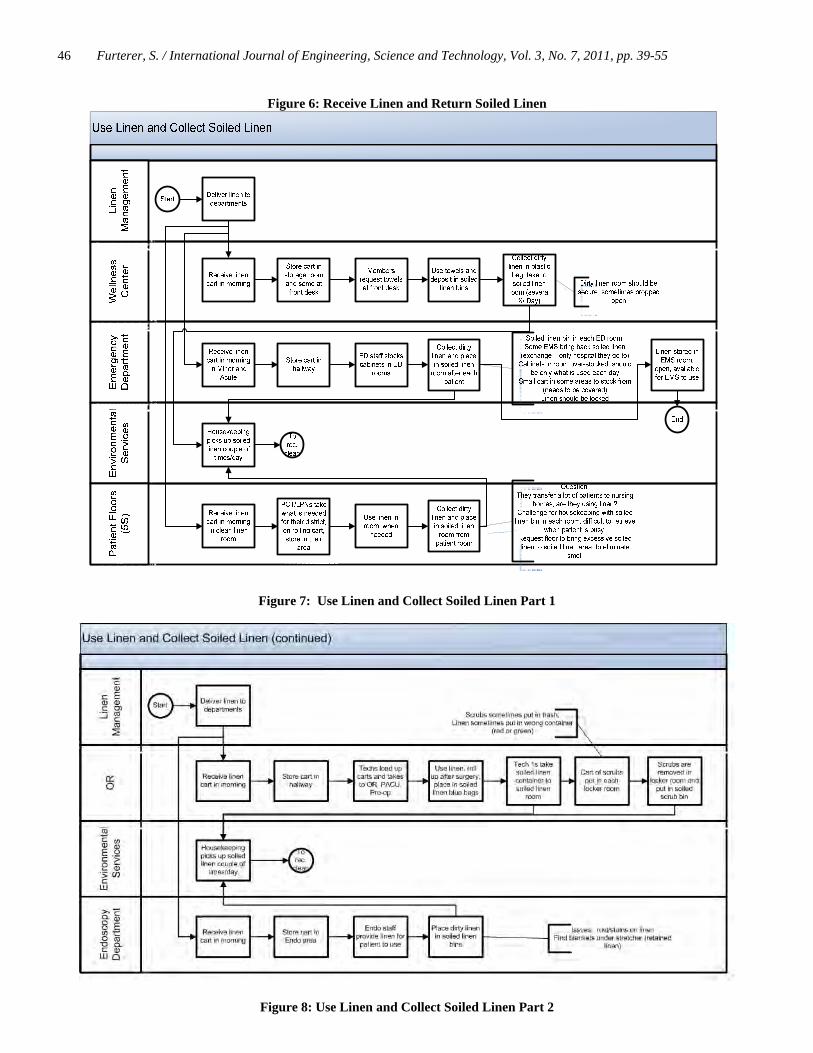
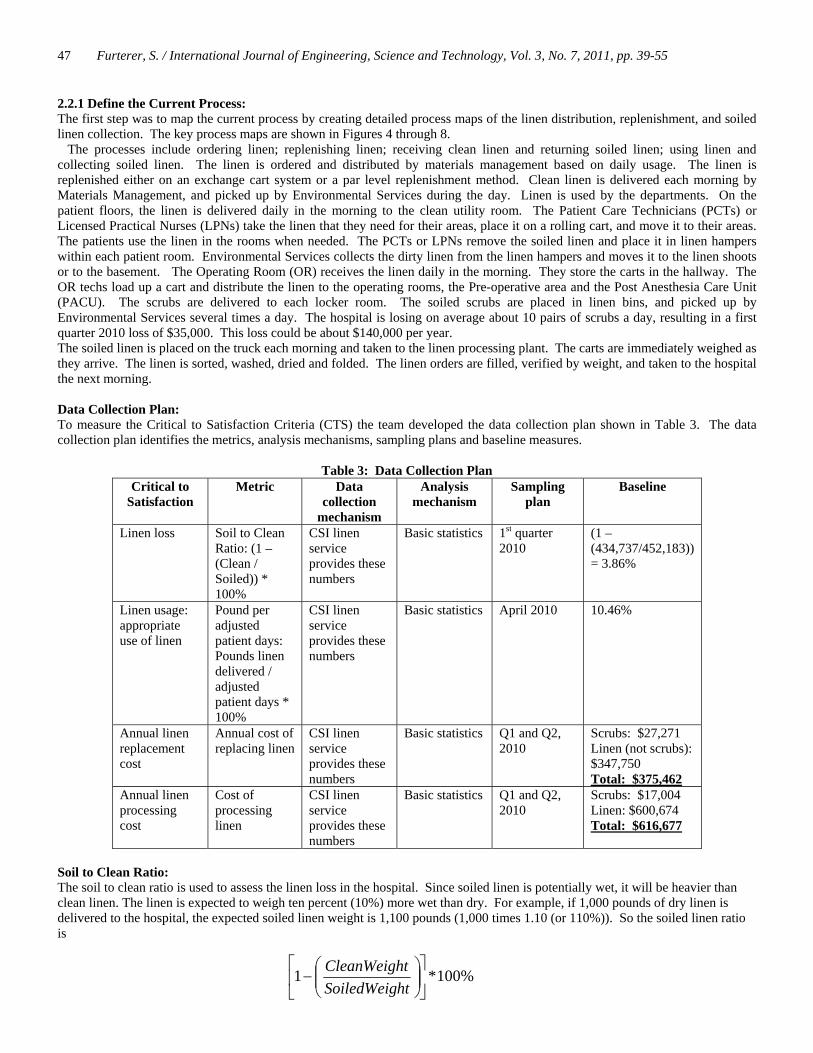
Figure 6: Receive Linen and Return Soiled Linen
Figure 7: Use Linen and Collect Soiled Linen Part 1
Figure 8: Use Linen and Collect Soiled Linen Part 2
Furterer, S. / International Journal of Engineering, Science and Technology, Vol. 3, No. 7, 2011, pp. 39-55 47
2.2.1 Define the Current Process: The first step was to map the current process by creating detailed process maps of the linen distribution, replenishment, and soiled linen collection. The key process maps are shown in Figures 4 through 8. The processes include ordering linen; replenishing linen; receiving clean linen and returning soiled linen; using linen and collecting soiled linen. The linen is ordered and distributed by materials management based on daily usage. The linen is replenished either on an exchange cart system or a par level replenishment method. Clean linen is delivered each morning by Materials Management, and picked up by Environmental Services during the day. Linen is used by the departments. On the patient floors, the linen is delivered daily in the morning to the clean utility room. The Patient Care Technicians (PCTs) or Licensed Practical Nurses (LPNs) take the linen that they need for their areas, place it on a rolling cart, and move it to their areas. The patients use the linen in the rooms when needed. The PCTs or LPNs remove the soiled linen and place it in linen hampers within each patient room. Environmental Services collects the dirty linen from the linen hampers and moves it to the linen shoots or to the basement. The Operating Room (OR) receives the linen daily in the morning. They store the carts in the hallway. The OR techs load up a cart and distribute the linen to the operating rooms, the Pre-operative area and the Post Anesthesia Care Unit (PACU). The scrubs are delivered to each locker room. The soiled scrubs are placed in linen bins, and picked up by Environmental Services several times a day. The hospital is losing on average about 10 pairs of scrubs a day, resulting in a first quarter 2010 loss of $35,000. This loss could be about $140,000 per year. The soiled linen is placed on the truck each morning and taken to the linen processing plant. The carts are immediately weighed as they arrive. The linen is sorted, washed, dried and folded. The linen orders are filled, verified by weight, and taken to the hospital the next morning. Data Collection Plan: To measure the Critical to Satisfaction Criteria (CTS) the team developed the data collection plan shown in Table 3. The data collection plan identifies the metrics, analysis mechanisms, sampling plans and baseline measures.
Table 3: Data Collection Plan
Critical to Satisfaction
Metric Data collection
mechanism
Analysis mechanism
Sampling plan
Baseline
Linen loss Soil to Clean Ratio: (1 – (Clean / Soiled)) * 100%
CSI linen service provides these numbers
Basic statistics 1st quarter 2010
(1 – (434,737/452,183)) = 3.86%
Linen usage: appropriate use of linen
Pound per adjusted patient days: Pounds linen delivered / adjusted patient days * 100%
CSI linen service provides these numbers
Basic statistics April 2010 10.46%
Annual linen replacement cost
Annual cost of replacing linen
CSI linen service provides these numbers
Basic statistics Q1 and Q2, 2010
Scrubs: $27,271 Linen (not scrubs): $347,750 Total: $375,462
Annual linen processing cost
Cost of processing linen
CSI linen service provides these numbers
Basic statistics Q1 and Q2, 2010
Scrubs: $17,004 Linen: $600,674 Total: $616,677
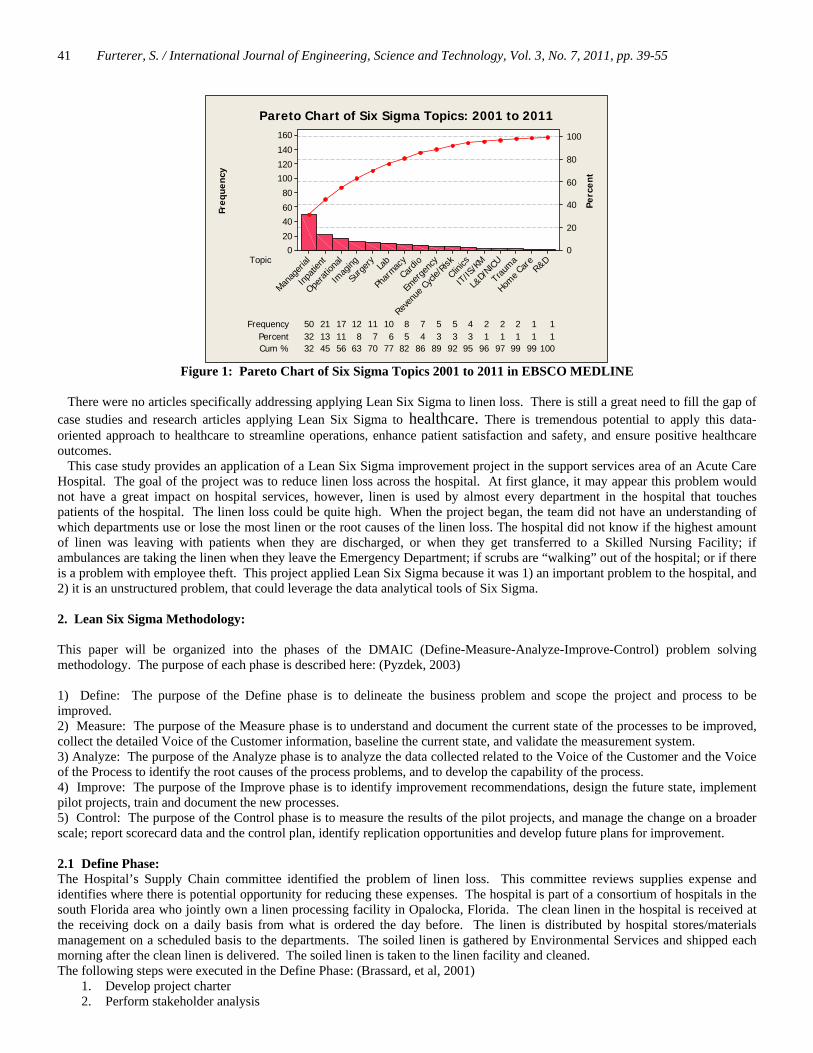
Soil to Clean Ratio: The soil to clean ratio is used to assess the linen loss in the hospital. Since soiled linen is potentially wet, it will be heavier than clean linen. The linen is expected to weigh ten percent (10%) more wet than dry. For example, if 1,000 pounds of dry linen is delivered to the hospital, the expected soiled linen weight is 1,100 pounds (1,000 times 1.10 (or 110%)). So the soiled linen ratio is
%100*1 ⎥⎦
⎤⎢⎣
⎡⎟⎟⎠
⎞⎜⎜⎝
⎛−
htSoiledWeigtCleanWeigh
Furterer, S. / International Journal of Engineering, Science and Technology, Vol. 3, No. 7, 2011, pp. 39-55 48
For example:
%100*100,1000,11 ⎥
⎦
⎤⎢⎣
⎡⎟⎠
⎞⎜⎝
⎛− = 9.1%
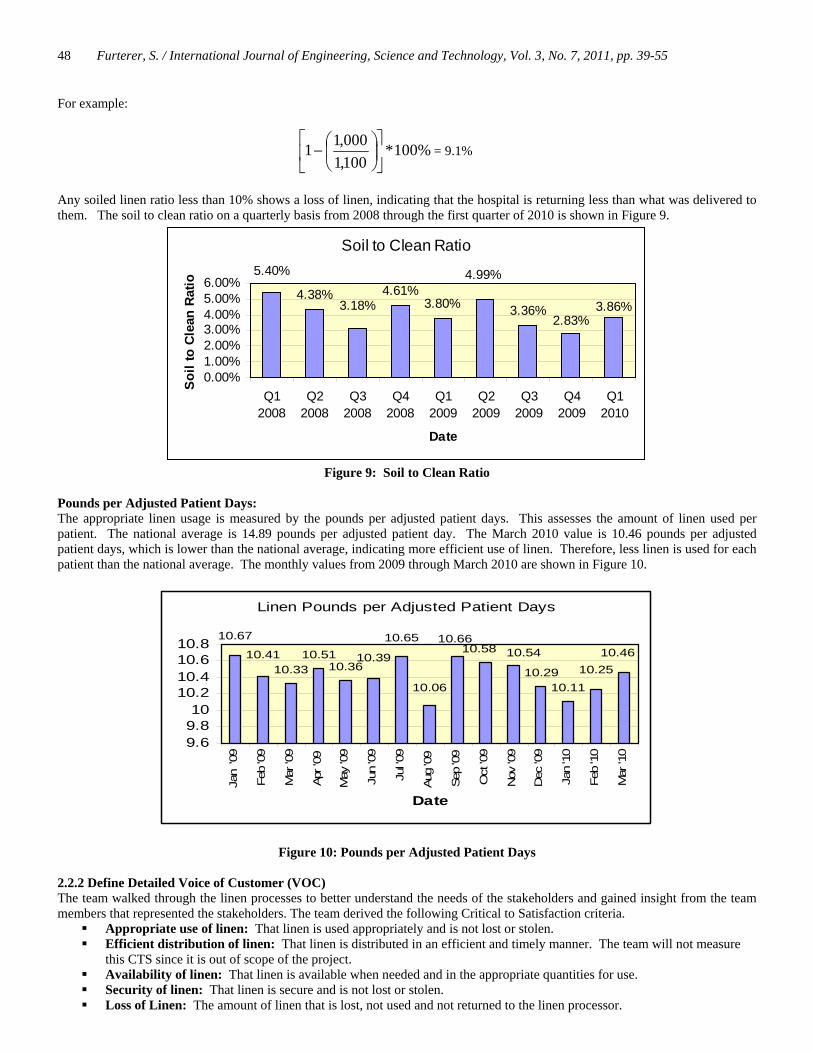
Any soiled linen ratio less than 10% shows a loss of linen, indicating that the hospital is returning less than what was delivered to them. The soil to clean ratio on a quarterly basis from 2008 through the first quarter of 2010 is shown in Figure 9.
Soil to Clean Ratio
4.38% 4.61%3.80% 3.36% 3.86%
2.83%
4.99%
3.18%
5.40%
0.00%1.00%2.00%3.00%4.00%5.00%6.00%
Q12008
Q22008
Q32008
Q42008
Q12009
Q22009
Q32009
Q42009
Q12010
Date
Soil
to C
lean
Rat
io
Figure 9: Soil to Clean Ratio
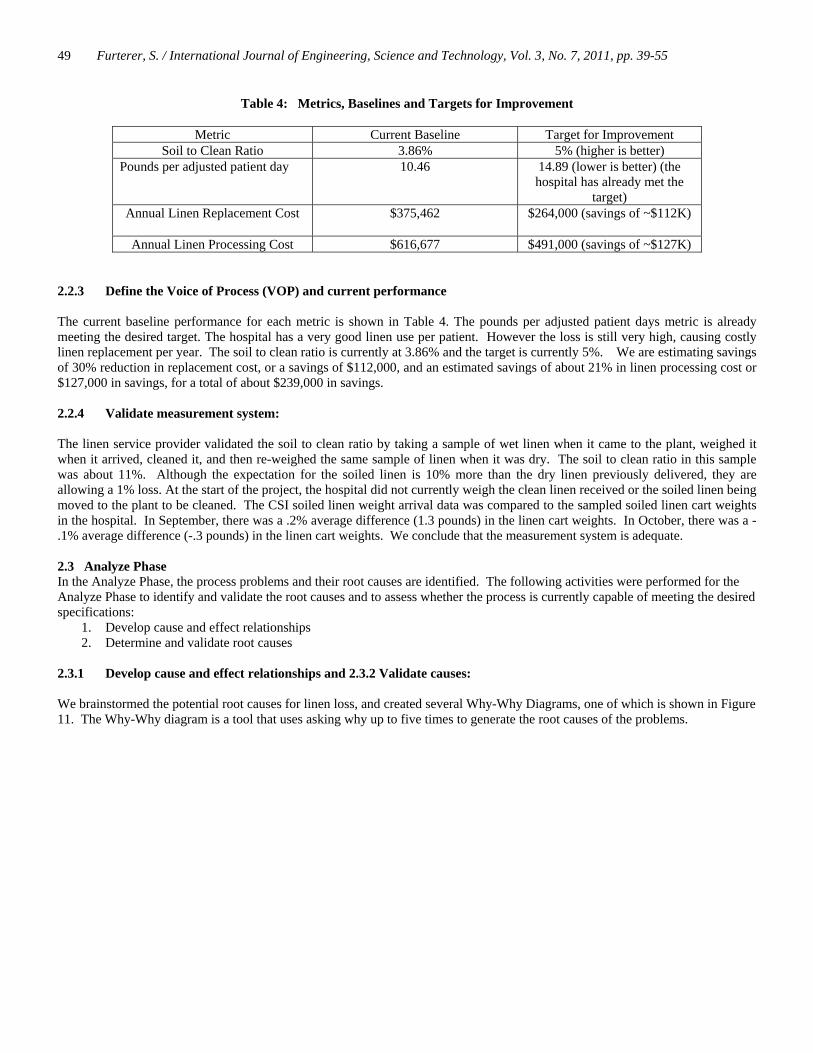
Pounds per Adjusted Patient Days: The appropriate linen usage is measured by the pounds per adjusted patient days. This assesses the amount of linen used per patient. The national average is 14.89 pounds per adjusted patient day. The March 2010 value is 10.46 pounds per adjusted patient days, which is lower than the national average, indicating more efficient use of linen. Therefore, less linen is used for each patient than the national average. The monthly values from 2009 through March 2010 are shown in Figure 10.
Linen Pounds per Adjusted Patient Days
10.3310.51
10.36 10.2910.11
10.4610.25
10.06
10.5410.5810.6610.65
10.3910.41
10.67
9.69.810
10.210.410.610.8
Jan
'09
Feb
'09
Mar
'09
Apr '
09
May
'09
Jun
'09
Jul '0
9
Aug
'09
Sep
'09
Oct
'09
Nov
'09
Dec
'09
Jan
'10
Feb
'10
Mar
'10
Date
Figure 10: Pounds per Adjusted Patient Days
2.2.2 Define Detailed Voice of Customer (VOC) The team walked through the linen processes to better understand the needs of the stakeholders and gained insight from the team members that represented the stakeholders. The team derived the following Critical to Satisfaction criteria.
Appropriate use of linen: That linen is used appropriately and is not lost or stolen. Efficient distribution of linen: That linen is distributed in an efficient and timely manner. The team will not measure
this CTS since it is out of scope of the project. Availability of linen: That linen is available when needed and in the appropriate quantities for use. Security of linen: That linen is secure and is not lost or stolen. Loss of Linen: The amount of linen that is lost, not used and not returned to the linen processor.
Furterer, S. / International Journal of Engineering, Science and Technology, Vol. 3, No. 7, 2011, pp. 39-55 49
Table 4: Metrics, Baselines and Targets for Improvement
Metric Current Baseline Target for Improvement Soil to Clean Ratio 3.86% 5% (higher is better)
Pounds per adjusted patient day 10.46 14.89 (lower is better) (the hospital has already met the
target) Annual Linen Replacement Cost $375,462
$264,000 (savings of ~$112K)
Annual Linen Processing Cost $616,677 $491,000 (savings of ~$127K)
2.2.3 Define the Voice of Process (VOP) and current performance The current baseline performance for each metric is shown in Table 4. The pounds per adjusted patient days metric is already meeting the desired target. The hospital has a very good linen use per patient. However the loss is still very high, causing costly linen replacement per year. The soil to clean ratio is currently at 3.86% and the target is currently 5%. We are estimating savings of 30% reduction in replacement cost, or a savings of $112,000, and an estimated savings of about 21% in linen processing cost or $127,000 in savings, for a total of about $239,000 in savings. 2.2.4 Validate measurement system: The linen service provider validated the soil to clean ratio by taking a sample of wet linen when it came to the plant, weighed it when it arrived, cleaned it, and then re-weighed the same sample of linen when it was dry. The soil to clean ratio in this sample was about 11%. Although the expectation for the soiled linen is 10% more than the dry linen previously delivered, they are allowing a 1% loss. At the start of the project, the hospital did not currently weigh the clean linen received or the soiled linen being moved to the plant to be cleaned. The CSI soiled linen weight arrival data was compared to the sampled soiled linen cart weights in the hospital. In September, there was a .2% average difference (1.3 pounds) in the linen cart weights. In October, there was a -.1% average difference (-.3 pounds) in the linen cart weights. We conclude that the measurement system is adequate. 2.3 Analyze Phase In the Analyze Phase, the process problems and their root causes are identified. The following activities were performed for the Analyze Phase to identify and validate the root causes and to assess whether the process is currently capable of meeting the desired specifications:
1. Develop cause and effect relationships 2. Determine and validate root causes
2.3.1 Develop cause and effect relationships and 2.3.2 Validate causes:
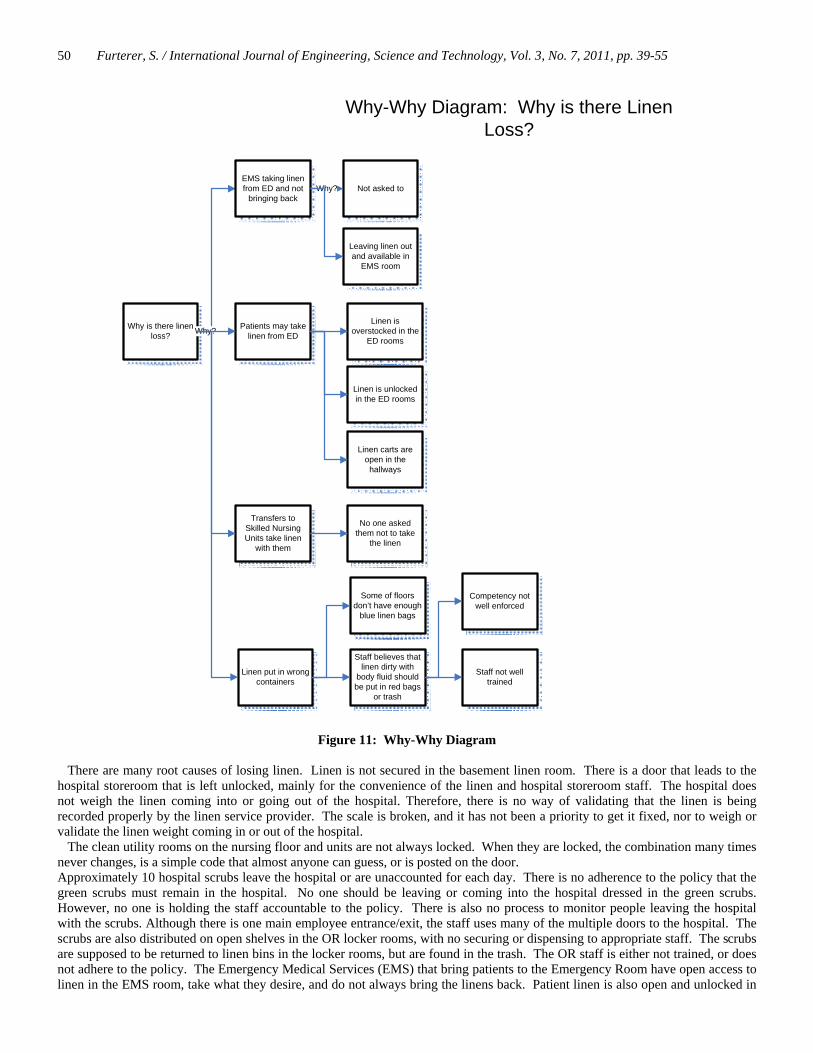
We brainstormed the potential root causes for linen loss, and created several Why-Why Diagrams, one of which is shown in Figure 11. The Why-Why diagram is a tool that uses asking why up to five times to generate the root causes of the problems.
Furterer, S. / International Journal of Engineering, Science and Technology, Vol. 3, No. 7, 2011, pp. 39-55 50
Why is there linen loss?
Linen is unlocked in the ED rooms
Linen carts are open in the
hallways
Not asked to
Why?
Leaving linen out and available in
EMS room
Patients may take linen from ED
EMS taking linen from ED and not
bringing backWhy?
Transfers to Skilled Nursing Units take linen
with them
Why-Why Diagram: Why is there Linen Loss?
Linen is overstocked in the
ED rooms
No one asked them not to take
the linen
Linen put in wrong containers
Staff believes that linen dirty with
body fluid should be put in red bags
or trash
Staff not well trained
Competency not well enforced
Some of floors don’t have enough
blue linen bags
Figure 11: Why-Why Diagram
There are many root causes of losing linen. Linen is not secured in the basement linen room. There is a door that leads to the hospital storeroom that is left unlocked, mainly for the convenience of the linen and hospital storeroom staff. The hospital does not weigh the linen coming into or going out of the hospital. Therefore, there is no way of validating that the linen is being recorded properly by the linen service provider. The scale is broken, and it has not been a priority to get it fixed, nor to weigh or validate the linen weight coming in or out of the hospital. The clean utility rooms on the nursing floor and units are not always locked. When they are locked, the combination many times never changes, is a simple code that almost anyone can guess, or is posted on the door. Approximately 10 hospital scrubs leave the hospital or are unaccounted for each day. There is no adherence to the policy that the green scrubs must remain in the hospital. No one should be leaving or coming into the hospital dressed in the green scrubs. However, no one is holding the staff accountable to the policy. There is also no process to monitor people leaving the hospital with the scrubs. Although there is one main employee entrance/exit, the staff uses many of the multiple doors to the hospital. The scrubs are also distributed on open shelves in the OR locker rooms, with no securing or dispensing to appropriate staff. The scrubs are supposed to be returned to linen bins in the locker rooms, but are found in the trash. The OR staff is either not trained, or does not adhere to the policy. The Emergency Medical Services (EMS) that bring patients to the Emergency Room have open access to linen in the EMS room, take what they desire, and do not always bring the linens back. Patient linen is also open and unlocked in
Furterer, S. / International Journal of Engineering, Science and Technology, Vol. 3, No. 7, 2011, pp. 39-55 51
the ED rooms. The linen is often overstocked for the convenience of the ED staff, leaving large amounts of linen unsecured in the ED rooms. Linen is also on unlocked carts in the ED hallways. When patients are transferred to Skilled Nursing Facilities (SNFs), linen often is transferred with them. It has not been the policy to ask the ambulance drivers to bring their own linen. Linen also is put in the wrong containers, sometimes in biohazard red bags, and also in the trash. The staff may believe that when linen is soiled with body fluids, that it should be either discarded or put in the biohazard red bags. The linen in all cases should still be put in the blue linen bags, as it will be cleaned and disinfected appropriately by the linen service provider. The staff is either not well trained and/or are not being assessed against the appropriate linen competencies. Reject linen also is found in the trash, as there is no process for how to handle reject linen. Linen is also left open in patient rooms, and looks available to be taken home by the patients. The soiled linen hamper is in each patient room, and is not secured. Blankets are placed on patients when they are discharging, but there is no process to ensure that patient escorts return the linens. Sometimes towels and blankets are used to clean up spills, either because the appropriate cleaning items are not available, or the staff does not know that they should not be using linen to clean up spills and leaks. An additional root cause of linen loss may be either the lack of recording taken of returned linen, or not accurately counting the returned or taken linen amounts. Summary of Root Causes: Linen Not Secure:
Clean Utility rooms not locked Clean Utility rooms’ combinations never changed Clean Utility rooms combination easy to guess or written on door Linen carts in hallways unlocked Linen left in unlocked cabinets in rooms Linen left in hampers in rooms Scrubs on open carts, locker room accessible to all Linen room door unlocked
Measurement: Not consistently recording distributed linen Not accounting for where linen is used, stored, inventoried Not accounting for linen “removed” from the facility Not weighing or auditing clean linen received or dirty linen
shipped to linen service provider Linen/Scrubs “walking out” of the hospital:
People leaving with scrubs (not street clothes), no awareness or accountability to the policy Transport companies taking linen with transfers to Skilled Nursing Facilities (not following contracted policy) Patients taking linen (lack of awareness) EMS taking linens from hospital, not controlled
Linen Return: Linen placed in wrong containers (trash, or bio-hazard waste), due to lack of training, or no containers available. No process for reject linen.
Retained Linen: Linen retained in rooms, must be placed in soiled linen, considered dirty, will not weigh as much as soiled linen,
may contribute to linen loss. Linen retained on gurney’s by transportation. Beds that are not occupied have linen on them.
Summary: There is significant loss of linen and the processes are not capable of securing the linen. The main root causes of linen loss were identified in this phase. 2.4 Improve Phase In the Improve Phase, the team identified and piloted linen improvements. The following steps were executed in the Improve Phase:
1. Identify improvement opportunities and plans 2. Perform cost/benefit analysis 3. Design future state 4. Establish performance targets and project scorecard
Furterer, S. / International Journal of Engineering, Science and Technology, Vol. 3, No. 7, 2011, pp. 39-55 52
5. Pilot improvements 6. Train and execute
2.4.1 Identify improvement opportunities and plans Once the team identified the root causes of potential linen loss, they implemented several improvement ideas, aligned to the root causes, as follows: Linen Not Secure: To enhance the security of linen throughout the hospital, they needed to better secure the linen. The linen carts needed to be locked or stored in locked rooms. A longer term goal is to implement access card control for rooms with badge access for all clean utility rooms. A process was implemented for when Transportation moves patients and takes linen from the rooms. The linen was collected daily from patient transport devices so it is not left throughout the hospital. Measurement: An acceptance sampling plan was implemented to select and weigh soiled linen carts prior to the soiled linen leaving to be cleaned by the linen service provider. The scale on the dock was replaced. A better measurement system to enhance the accountability and control of the linen was implemented. The returned linen was to be consistently counted when the linen carts are exchanged with the floors. Environmental Services collected linen on the floors to determine how much linen was being retained on the floors, and how much was “walking” out of the hospital (being taken or stolen). Linen/Scrubs “walking out” of the hospital: To prevent scrubs from being taken out of the hospital and not returned, the OR secured the scrubs by implementing a scrubEx ® scrub dispensing machine. As an interim step the OR Director secured the Operating Rooms (OR) locker rooms to only OR staff. They also enforced the existing policy for who can wear green scrubs. They generated a comprehensive list of scrub uniform colors for each department. The team leader reviewed the linen policies with directors and staff to gain their support of the policies. Materials Handling purchased disposable scrubs so that when staff who does not normally wear scrubs has to change their clothes, they can use the disposable scrubs. The Director of Case Management also contacted the transport companies that transfer patients to Skilled Nursing Facilities (SNFs) to ensure that they do not take linen when transferring the patients. The linen committee also met with the main ambulance companies to stress that the EMS truck drivers should not be removing linen from the hospital. The Emergency Room changed the procedure to only have what will be used that day in cabinets, and to re-stock the cabinets daily. They began securing the linen carts. The Emergency Department (ED) also began making up linen bundles that the charge person gives to them, so that the Emergency Medical Service (EMS) can not help themselves to linen. The ED contacted the chiefs to notify them of the change. Security performed a door assessment process, as part of a lock down procedure to ensure that access is not available to people that do not need to be in certain areas, including having access to linen. Patient transporters and volunteers were trained to know to return blankets used during discharge. A significant change was to implement alEx® linen dispensers in the Emergency Department since about 25% of linen loss occurs through the Emergency Department, mostly by EMS trucks taking and not returning linen. They implemented a single use alEx ® dispenser for the EMS trucks. They also implemented secure alEx ® bulk dispensers to load the linen delivered daily into the secure dispensers. The ED staff would then load the ED rooms from the secure alEx ® bulk linen dispensers. Linen Return: The linen committee again reinforced linen awareness and training of appropriate used linen placement in the correct containers. Linen should not be placed in trash or hazardous waste containers. Materials Management incorporated a consistent reject linen procedure, by notifying staff of the reject linen bag that is placed on each linen cart. They reminded the staff that they need to ensure that the soiled linen is placed in the linen shoots between 7 and 11 pm. They also trained the staff to not use linen for cleaning up leaks and spills, and ensured that they had appropriate cleaning towels to clean up spills. Retained Linen: Materials Management improved the awareness of the linen policies and procedures, including having staff only put linen in rooms for what they are using for that day to avoid having to clean linen that was left in a patient’s room, but not actually used. They also reinforced at staff meetings to clean out cabinets once a month and return unused linen. The team worked with Transportation to ensure that they removed unused linen from the stretchers used for patient transport on a daily basis. Materials Management also incorporated a process for picking up unused linen on closed floors. 2.4.2 Perform cost/benefit analysis The Master Black Belt performed a cost and benefit analysis to cost justify the linen and scrub dispensers. The Net Present Value was calculated to be $625,539 for a five year project life. The estimated internal rate of return is 148%. The estimated annual

Furterer, S. / International Journal of Engineering, Science and Technology, Vol. 3, No. 7, 2011, pp. 39-55 53
savings includes a 25% reduction of linen replacement cost, resulting in a savings of $111,878, and a 20% reduction in linen processing cost, resulting in $126,936, for a total annual savings of $238,815. The annual cost of the linen dispensers includes a monthly lease cost to lease the dispensers. There is an initial cost of installing data and electrical drops for almost $10,000. The positive net present value and the very high internal rate of return provided the cost justification that was needed to convince the leadership team that this is a very strong investment. The alEx® linen and scrubEx® scrub dispensers were implemented in the first quarter of 2011. 2.4.3 Design future state Most of the changes either enforced existing policies or changed procedures and the changes were made as appropriate. We revised the process maps to represent the new processes. 2.4.4 Establish performance targets and project scorecard The established performance targets and project scorecard is shown in Table 5. 2.4.5 Pilot improvements The team piloted the improvement ideas identified and captured what worked and what needed to be further revised. 2.4.6 Train and execute After the pilot phase was complete, the team trained the personnel in the revised procedures and executed them throughout the hospital.
Table 5: Performance Targets Scorecard Metric Baseline Targeted Goal Status
Soil to Clean Ratio 3.86% 5% (higher is better) 4.48% Pounds per Adjusted Patient Day
10.46 14.89 (lower is better) Met Goal prior to Project
Annual Linen Replacement Cost
$375,462 $264,000 Projected savings of $77,480
Annual Linen Processing Cost
$616,677 $491,000 No data yet available
2.5 Control Phase The purpose of the Control Phase is to implement control mechanisms and procedures to ensure that the process maintains the levels of improvements attained during the pilot activities. The following activities were executed in the Control Phase:
1. Measure results and manage change 2. Report scorecard data and create process control plan 3. Identify replication opportunities 4. Develop future plan
2.5.1 Measure Results & Manage Change: The team implemented many of the improvements identified starting in June 2010. The Master Black Belt performed a two proportion test comparing the baseline to the first quarter of 2011. The team compared the baseline soil to clean ratio of 3.86% to the improved ratio of 4.48%. Instead of using the soil to clean metric, the team used the soiled to clean pounds and created the baseline ratio of 96.14% (100% - 3.86%), and compared it to the improved ratio of 95.52% (100 – 4.48%). The goal for this ratio is 95% (100% - 5% goal). Test and CI for Two Proportions Sample X N Sample p 1 434737 452183 0.961418 2 438383 458967 0.955151 Difference = p (1) - p (2) Estimate for difference: 0.00626682 95% CI for difference: (0.00544605, 0.00708758) Test for difference = 0 (vs not = 0): Z = 14.96 P-Value = 0.000 Fisher's exact test: P-Value = 0.000
Furterer, S. / International Journal of Engineering, Science and Technology, Vol. 3, No. 7, 2011, pp. 39-55 54
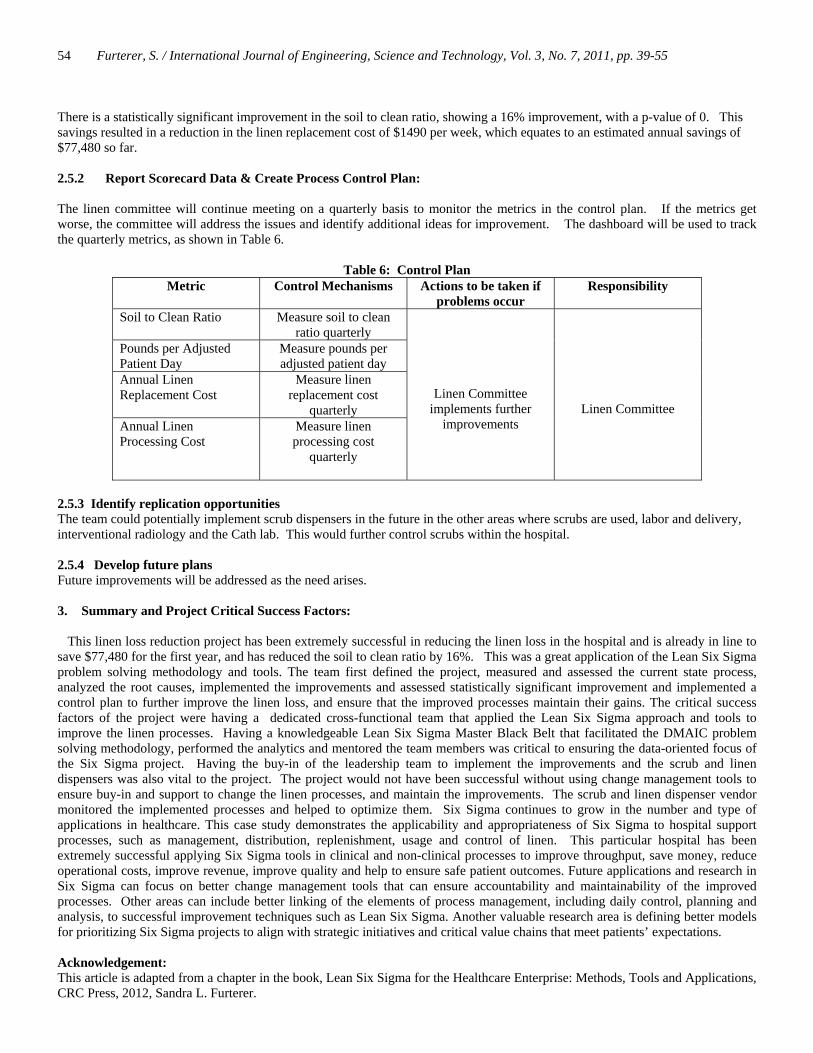
There is a statistically significant improvement in the soil to clean ratio, showing a 16% improvement, with a p-value of 0. This savings resulted in a reduction in the linen replacement cost of $1490 per week, which equates to an estimated annual savings of $77,480 so far. 2.5.2 Report Scorecard Data & Create Process Control Plan: The linen committee will continue meeting on a quarterly basis to monitor the metrics in the control plan. If the metrics get worse, the committee will address the issues and identify additional ideas for improvement. The dashboard will be used to track the quarterly metrics, as shown in Table 6.
Table 6: Control Plan Metric Control Mechanisms Actions to be taken if
problems occur Responsibility
Soil to Clean Ratio Measure soil to clean ratio quarterly
Linen Committee implements further
improvements
Linen Committee
Pounds per Adjusted Patient Day
Measure pounds per adjusted patient day
Annual Linen Replacement Cost
Measure linen replacement cost
quarterly Annual Linen Processing Cost
Measure linen processing cost
quarterly
2.5.3 Identify replication opportunities The team could potentially implement scrub dispensers in the future in the other areas where scrubs are used, labor and delivery, interventional radiology and the Cath lab. This would further control scrubs within the hospital. 2.5.4 Develop future plans Future improvements will be addressed as the need arises. 3. Summary and Project Critical Success Factors:
This linen loss reduction project has been extremely successful in reducing the linen loss in the hospital and is already in line to save $77,480 for the first year, and has reduced the soil to clean ratio by 16%. This was a great application of the Lean Six Sigma problem solving methodology and tools. The team first defined the project, measured and assessed the current state process, analyzed the root causes, implemented the improvements and assessed statistically significant improvement and implemented a control plan to further improve the linen loss, and ensure that the improved processes maintain their gains. The critical success factors of the project were having a dedicated cross-functional team that applied the Lean Six Sigma approach and tools to improve the linen processes. Having a knowledgeable Lean Six Sigma Master Black Belt that facilitated the DMAIC problem solving methodology, performed the analytics and mentored the team members was critical to ensuring the data-oriented focus of the Six Sigma project. Having the buy-in of the leadership team to implement the improvements and the scrub and linen dispensers was also vital to the project. The project would not have been successful without using change management tools to ensure buy-in and support to change the linen processes, and maintain the improvements. The scrub and linen dispenser vendor monitored the implemented processes and helped to optimize them. Six Sigma continues to grow in the number and type of applications in healthcare. This case study demonstrates the applicability and appropriateness of Six Sigma to hospital support processes, such as management, distribution, replenishment, usage and control of linen. This particular hospital has been extremely successful applying Six Sigma tools in clinical and non-clinical processes to improve throughput, save money, reduce operational costs, improve revenue, improve quality and help to ensure safe patient outcomes. Future applications and research in Six Sigma can focus on better change management tools that can ensure accountability and maintainability of the improved processes. Other areas can include better linking of the elements of process management, including daily control, planning and analysis, to successful improvement techniques such as Lean Six Sigma. Another valuable research area is defining better models for prioritizing Six Sigma projects to align with strategic initiatives and critical value chains that meet patients’ expectations. Acknowledgement: This article is adapted from a chapter in the book, Lean Six Sigma for the Healthcare Enterprise: Methods, Tools and Applications, CRC Press, 2012, Sandra L. Furterer.
Furterer, S. / International Journal of Engineering, Science and Technology, Vol. 3, No. 7, 2011, pp. 39-55 55
References Alukal, G., Create a Lean, Mean Machine. Quality Progress. ASQ, Milwaukee, WI. 2003. Brassard, Michael, and Diane Ritter. Sailing through Six Sigma: How the Power of People Can Perfect Processes and Drive down
Costs. Marietta, GA: Brassard & Ritter, 2001. Certified Six Sigma Black Belt Primer, Quality Council of Indiana, 2001. Encompass Textiles and Interiors, 2004, Smart Solution for Linen Use, Now You See It... Now You Do not. A Campaign to
Prevent Linen Loss, web site www.encompassgroup.net, McDonough, GA. Evans, J. and Lindsay, M., The Management and Control of Quality. Fifth Edition. South-Western Thomson Learning, 2002. Furterer, S., Lean Six Sigma for the Healthcare Enterprise: Methods, Tools and Applications, CRC Press, 2012. Furterer, S., Lean Six Sigma in Service: Lean Six Sigma in Service: Applications and Case Studies, CRC Press, 2009. Furterer, S., University of Central Florida, Department of Industrial Engineering and Management Systems, ESI 5227 Total
Quality Improvement course lecture notes, 2005. George, M., Lean Six Sigma, McGraw-Hill, 2002. George, Michael, Rowlands, Price, and Maxey. Lean Six Sigma Pocket Toolbook. New York: McGraw-Hill, 2005. Print. Gitlow, Howard S., and David M. Levine. Six Sigma for Green Belts and Champions: Foundations, DMAIC, Tools, Cases, and Certification. Upper Saddle River, NJ: Pearson/Prentice Hall, 2005. Harry, M. and Schroeder, R., Six Sigma The Breakthrough Management Strategy Revolutionizing the World’s Top Corporations.
Doubleday, 2000. Materials Management, Combined Services and Standard Textile Inc., 2010, Holy Cross Hospital Linen Awareness Day, Ft.
Lauderdale, Florida. Pyzdek, Thomas. The Six Sigma Handbook: a Complete Guide for Green Belts, Black Belts, and Managers at All Levels. New
York: McGraw-Hill, 2003. Print. Scholtes, Peter R., Brian L. Joiner, and Barbara J. Streibel. The Team Handbook. Madison, WI: Oriel, 2003. Womack, James P., and Daniel T. Jones. Lean Thinking: Banish Waste and Create Wealth in Your Corporation. New York, NY:
Simon & Shuster, 1996. Biographical Notes Sandy Furterer, Ph.D., MBA, CSSBB, MBB, CQE, is developing and deploying the Enterprise Performance Excellence program for Holy Cross Hospital in south Florida. Dr. Furterer received her Ph.D. in Industrial Engineering from the University of Central Florida in 2004. She received an MBA from Xavier University, and a BS and MS in Industrial and Systems Engineering from the Ohio State University. Dr. Furterer has over 20 years of experience in business process and quality improvements. She is an ASQ Certified Six Sigma Black Belt, Certified Quality Engineer (CQE), and a certified Harrington Institute Inc. Master Black Belt (MBB). Dr. Furterer has published and/or presented over 20 conference papers/proceedings in the areas of Lean Six Sigma, quality, operational excellence and engineering education. She recently published several reference textbooks to teach Lean Six Sigma through real-world case studies, Lean Six Sigma in Service: Applications and Case Studies, CRC Press, 2009, and Six Sigma for the Healthcare Enterprise: Methods, Tools and Applications, CRC Press, 2011. She has also written a reference textbook titled Systems Engineering Focus to Business Architecture: Models, Methods and Applications, CRC Press, 2011.
Received April 2011 Accepted May 2011 Final acceptance in revised form June 2011