
Applying Lean Production in Factory Homebuilding · Applying Lean Production in Factory...
24
Applying Lean Production in Factory Homebuilding Jordan Dentz Manufactured Housing Research Alliance Isabelina Nahmens Louisiana State University Michael Mullens Housing Constructability Lab Abstract This article serves as a r esource to factory home builders seeking to use lean thinking to slash waste from their production operations. Lean refers both to a general way of thinking and to specific practices that emphasize using less of everything (time, money, materials, and so forth) to satisfy the customer by delivering the highest qual- ity product at the lowest cost in the shortest time. While providing an overview of lean production, this article focuses on two fundamental lean tools: Value Stream Mapping (VSM) and Rapid Process Improvement (RPI) events. This research follows a case study approach to document the application and benefits of lean production in the fac- tory homebuilding industry. The target population for these case studies was a group of nine manufactured and modular homebuilding plants that initiated lean produc- tion efforts in 2006. VSM was used to identify waste and to target specific portions of the production process for improvement. RPI events were then conducted in targeted areas. The results were dramatic. Labor efficiencies were increased by 10 percent to more than 100 percent. Defects in finished drywall were reduced by 85 percent. Taken as a whole, lean production activities were shown to increase the efficiency and quality of building operations, boost worker morale, and improve communication between management and workers. Cityscape: A Journal of Policy Development and Research • Volume 11, Number 1 • 2009 Cityscape 81 U.S. Department of Housing and Urban Development • Office of Policy Development and Research
-
Upload
vuongduong -
Category
Documents
-
view
223 -
download
0
Transcript of Applying Lean Production in Factory Homebuilding · Applying Lean Production in Factory...
Applying Lean Production in Factory HomebuildingJordan Dentz Manufactured Housing Research Alliance
Isabelina Nahmens Louisiana State University
Michael Mullens Housing Constructability Lab
Abstract
This article serves as a resource to factory home builders seeking to use lean thinking to slash waste from their production operations. Lean refers both to a general way of thinking and to specific practices that emphasize using less of everything (time, money, materials, and so forth) to satisfy the customer by delivering the highest quality product at the lowest cost in the shortest time. While providing an overview of lean production, this article focuses on two fundamental lean tools: Value Stream Mapping (VSM) and Rapid Process Improvement (RPI) events. This research follows a case study approach to document the application and benefits of lean production in the factory homebuilding industry. The target population for these case studies was a group of nine manufactured and modular homebuilding plants that initiated lean production efforts in 2006. VSM was used to identify waste and to target specific portions of the production process for improvement. RPI events were then conducted in targeted areas. The results were dramatic. Labor efficiencies were increased by 10 percent to more than 100 percent. Defects in finished drywall were reduced by 85 percent. Taken as a whole, lean production activities were shown to increase the efficiency and quality of building operations, boost worker morale, and improve communication between management and workers.
Cityscape: A Journal of Policy Development and Research • Volume 11, Number 1 • 2009 Cityscape 81 U.S. Department of Housing and Urban Development • Office of Policy Development and Research
Dentz, Nahmens, and Mullens
Introduction In 2007, approximately 11 percent of all newly built single-family homes in the United States were factory built (U.S. Census Bureau, 2007). Although factory-based home construction approaches relocate many of the field operations to a more controlled factory environment, the construction techniques share many similarities with those employed in traditional site building. Although automotive, electronics, and many other manufacturing industries have reported dramatic improvements in production efficiency with the introduction of lean techniques, examples of such improvements in factory homebuilding are only beginning to emerge. One of the first of these lean efforts in factory homebuilding was conducted by the Manufactured Housing Research Alliance (MHRA) with sponsorship from the U.S. Department of Housing and Urban Development’s (HUD’s) Partnership for Advancing Technology in Housing program, the New York State Energy Research and Development Authority, and the factory-built housing industry. The goal of this effort was to transform the way homes are manufactured, thus reducing housing cost and improving quality, safety, productivity, and design flexibility. The strategy was to reduce waste through the implementation of lean production tools and techniques. This article showcases the use of these techniques in three of the nine plants studied and demonstrates their value to the factory-built housing industry.
Lean Production Overview Koskela (1993) first applied lean production principles to construction, emphasizing production process flow and the conversion of inputs into finished products. Picchi and Granja (2004) presented five lean principles used in the construction industry: value, value stream, flow, pull, and perfection. Value is value as perceived by the homebuyer; value stream refers to mapping of materials and information; flow refers to creating continuous flow; pull refers to pulling services, components, and materials only when necessary; and perfection refers to high-quality systems designed for immediate detection of problems. Salem and Zimmer (2005) identified five major lean principles applicable in the housing industry: customer focus, culture/people, workplace standardization, waste elimination, and continuous improvement/built-in quality. Waste is any activity that consumes resources but creates no value for the customer.
Lean production, which began with the Toyota Production System (Ohno, 1988), was the result of decades of development by automobile manufacturers, who reduced average labor hours per vehicle by more than one-half with one-third the defects (Caldeira, 1999). Other industries followed the automobile industry’s lead, achieving similar results (Womack and Jones, 1996). Lean production is based on five fundamental principles: (1) identify what the customer values; (2) identify the value stream and challenge all wasted steps; (3) produce the product when the customer wants it and, once started, keep the product flowing continuously through the value stream; (4) introduce pull between all steps where continuous flow is impossible; and (5) manage toward perfection (Womack and Jones, 1996).
The goal of lean production is to satisfy the customer by delivering the highest quality at the lowest cost in the shortest time. This goal is accomplished by continuously eliminating muda, or waste.
82 Refereed Papers
Applying Lean Production in Factory Homebuilding
Ohno (1988) coined the seven wastes targeted by lean production initiatives: (1) defects (activities involving repair or rework), (2) overproduction (activities that produce too much at a particular point in time), (3) transportation (activities involving unnecessary movement of materials), (4) waiting (lack of activity that occurs when an operator is ready for the next operation but must remain idle until someone else takes a previous step), (5) inventory (inventory that is not directly required to fulfill current customer orders), (6) motion (unnecessary steps taken by employees and equipment), and (7) processing (extra operation or activity in the manufacturing process).
Factory homebuilding is an industrialized approach to homebuilding, which relocates many field operations to a more controlled factory environment. Factory homebuilding includes manufactured and modular homes. Manufactured homes are built to the federal Manufactured Home Construction and Safety Standards promulgated by HUD (HUD, 2006), whereas modular homes are built to local building codes similar to site-built homes. Both types of homes are composed of three-dimensional sections that are typically 95-percent finished when they leave the factory (Carlson, 1991). A typical production line is set up either in a side-saddle configuration (widthwise section movement) or in a linear configuration (length-wise section movement) with floors, ceilings, walls, and other components being fed to the main line from offline, subassembly stations. Upon completion in the factory, these sections are transported to the construction site, then lifted by crane or rolled onto a foundation. While the house is being built at the plant, workers do the needed site work and prepare a foundation, if required. The resulting home is often indistinguishable from nearby conventional site-built housing (Mullens, 2004).
Mullens (2004), who studied production process flow in factory homebuilding, found that the ease of process flow is largely defined by the homebuilding factory configuration, particularly when considerable product variation exists. Mullens (2006) identified some unique characteristics of the homebuilding factory that affect process flow: (1) complex product has large components; (2) few small and fixed workstations are located alongside the main production line (that is, plumbing); (3) few large and fixed workstations are located alongside the main production line (that is, wall build); (4) labor and material flow to the product while the product flows continuously on the main production line; (5) some activities can stop product movement on the main production line because they need to happen at certain locations (that is, large components need a crane); (6) multioperator teams perform specialty work (that is, trades), making it difficult to measure work content and cycle time for each unit; and (7) little queuing occurs due to lack of space. He found that queuing availability and the flexibility for work to migrate upstream/downstream can mitigate some of the inefficiencies resulting from high product variation. Information technology can enable better planning and management under conditions of high product variation. Early studies have also suggested that lean improvements can slash the time required to set and finish modular housing on the construction site (Mullens and Kelly, 2004).
Lean Tools: Value Stream Mapping and Rapid Process Improvement Events Lean thinking uses tools, techniques, and practices and combines them as a set into a system to eliminate waste. This article focuses on two fundamental lean tools: Value Stream Mapping (VSM)
Cityscape 83
Dentz, Nahmens, and Mullens
and Rapid Process Improvement (RPI) events. Typically, in a lean implementation, a high-level VSM (for example, door-to-door plant level) is used to document the current situation and to identify wasted activities so they can be challenged and eliminated through RPI events. During the RPI event, a detailed VSM (for example, of a specific production process such as the wall build area) can be developed for a better understanding of the process. The main goal of VSM (both high level and detailed) is to identify waste, whereas the RPI events improve the process through waste elimination.
Lean production methods focus on the value stream, the set of activities used to create a product or service from raw material until it reaches the customer (Womack and Jones, 1996). VSM documents all activities in the current production process, as well as the associated material and information flows. VSM allows the user to easily visualize the current process, recognize sources of waste, and eliminate nonvalue-added activities. Because lean thinking focuses on value as defined by the end customer, VSM should question any activities that do not add value to the customer. Pyzdek (2003) highlighted the role of VSM in the overall context of lean philosophy as (1) defining value from the customer’s view, (2) mapping the current state of the value stream, (3) applying the lean tools to identify waste in the current value stream, (4) mapping the future-state process, (5) developing a transition plan, (6) implementing the plan, and (7) validating the new process. The key outcome of VSM is the identification of opportunities for improvement and activities that consume resources without adding value. VSM can be performed at different levels of the organization—specific production process, door-to-door plant level, enterprise level—and across organizations to suppliers and customers.
The implementation of lean production principles often takes the form of a kaizen, “the planned, organized and systematic process of on-going, incremental and company-wide change of existing practices aimed at improving company performance” (Boer et al., 2000). In contrast to traditional management approaches that split employees into “thinkers” and “doers,” kaizen assumes that all employees can make a contribution to problemsolving and innovation (Bessant, Caffyn, and Gallagher, 2001). The kaizen blitz (also referred to herein as an RPI event) takes the same improvement philosophy and applies it in a brief, but intense, attack on production waste and inefficiency (Laraia, Moody, and Hall, 1999). Both kaizen methods (kaizen and kaizen blitz) follow a structured approach that includes the following steps: (1) document the current process, (2) identify all forms of waste, (3) develop lean options to reduce waste, (4) pilot test the options, and (5) institutionalize the changes and continue to improve. RPI events eliminate waste by empowering employees with the responsibility, time, tools, and methodologies to uncover areas for improvement and to plan and implement change. This type of activity is team based and should involve employees from different levels of the organization. The first step in an RPI event involves the development of two types of process documentation: baseline performance metrics (for example, quality, cycle time, productivity) and a detailed VSM indicating value-added and nonvalue-added activities. Waste is exposed as the current process is observed, documented, and analyzed (for example, nonvalueadded activities are discovered). When waste is identified, potential process improvements are developed using lean principles. Selected lean improvements are pilot tested in the process and fine tuned to optimize impact. As the successful changes are institutionalized, the continuous improvement process is repeated in a never-ending cycle.
84 Refereed Papers
Applying Lean Production in Factory Homebuilding
Methodology Responding to critical homebuilding challenges in the early 21st century, the industrialized housing industry launched a multiyear, industrywide effort to boost production performance. Led by the MHRA, the effort consisted of several phases. The first phase documented the industry’s current production performance. In 2005, a comprehensive survey was distributed to 275 U.S. and Canadian housing factories. The survey included questions concerning product offerings, production levels, productivity, worker satisfaction, and customer satisfaction. More than 50 percent of the factories responded. Results were published (MHRA, 2005) and disseminated to provide an industry baseline, allowing the industry to track improvements industrywide and encouraging each factory to benchmark itself against competitors. The second phase of this effort, called the lean initiative, began in March 2006 and was conducted over an approximately 12-month period. The project plan included five major tasks, which are described in the following paragraphs.
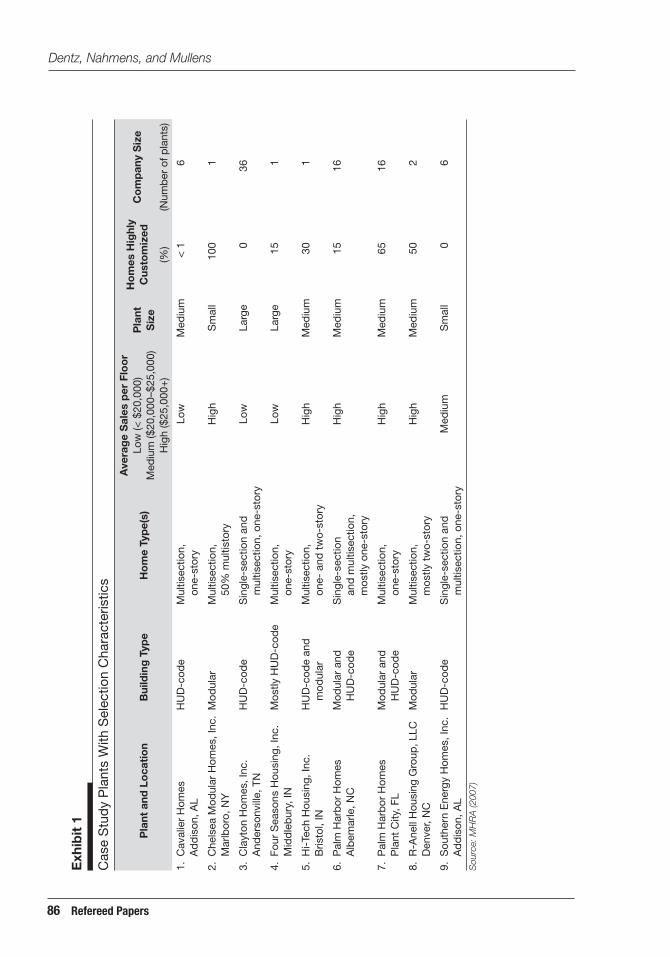
Task 1. Select Plants Drawing from results of the phase one benchmarking study, researchers selected plants with a mix of characteristics that could affect production efficiency and yield a variety of lean approaches. The characteristics included the following (MHRA, 2007):
• Current performance (efficient and inefficient operations).
• Home price point (low-, medium-, and high-priced homes).
• Product mix (for example, single-section and multisection, HUD-code and modular).
• Geographic location to capture market and design variations.
• Company size (based on total production capacity).
Nine plants were selected on a competitive basis. Each plant was required to cover part of the costs of the research and make a significant in-kind contribution, which included the following investments: (1) upper management commitment to lean production methods, (2) a lean advocate to help carry out project tasks, and (3) resources (people, time, materials, and so forth) to carry out tasks. The plants that were selected for participation in the lean initiative are shown in exhibit 1. All produced single-family, detached, residential, wood-frame buildings.
Task 2. Select and Train Lean Advocates Each plant selected one or more key staff members as their lean advocate(s). Because the nine plants were new to lean production, the advocates participated in a 1-week lean training session in April 2006. The training covered basic lean concepts and techniques, including VSM and RPI. The material in this training was tailored to the factory-built housing industry and addressed the challenges of implementing lean in the industry. The training equipped advocates with the knowledge to identify waste, develop new lean approaches, and implement and sustain change.
Cityscape 85
Exh
ibit
1
Cas
e S
tud
y P
lant
s W
ith S
elec
tion
Cha
ract
eris
tics
Pla
nt a
nd L
oca
tio
n Lo
w (<
$20
,000
)M
ediu
m ($
20,0
00–$
25,0
00)
Hig
h ($
25,0
00+
)
Pla
ntS
ize
Ho
mes
Hig
hly
Cus
tom
ized
(%)
Co
mp
any
Siz
e
(Num
ber
of p
lant
s)
Bui
ldin
g T
ype
Ho
me
Typ
e(s)
Ave
rag
e S
ales
per
Flo
or
Dentz, Nahmens, and Mullens
86 Refereed Papers
1. C
aval
ier
Hom
esA
dd
ison
, AL
2. C
hels
ea M
odul
ar H
omes
, Inc
.M
arlb
oro,
NY
3. C
layt
on H
omes
, Inc
.A
nder
sonv
ille,
TN
4. F
our
Sea
sons
Hou
sing
, Inc
.M
idd
leb
ury,
IN
5. H
i-Te
ch H
ousi
ng, I
nc.
Bris
tol,
IN
6. P
alm
Har
bor
Hom
esA
lbem
arle
, NC
7. P
alm
Har
bor
Hom
esP
lant
City
, FL
8. R
-Ane
ll H
ousi
ng G
roup
, LLC
D
enve
r, N
C
9. S
outh
ern
Ene
rgy
Hom
es, I
nc.
Ad
dis
on, A
L
HU
D-c
ode
Mod
ular
HU
D-c
ode
Mos
tly H
UD
-cod
e
HU
D-c
ode
and
mod
ular
Mod
ular
and
HU
D-c
ode
Mod
ular
and
HU
D-c
ode
Mod
ular
HU
D-c
ode
Mul
tisec
tion,
one-
stor
y
Mul
tisec
tion,
50%
mul
tisto
ry
Sin
gle-
sect
ion
and
mul
tisec
tion,
one
-sto
ry
Mul
tisec
tion,
one-
stor
y
Mul
tisec
tion,
one-
and
tw
o-st
ory
Sin
gle-
sect
ion
and
mul
tisec
tion,
mos
tly o
ne-s
tory
Mul
tisec
tion,
one-
stor
y
Mul
tisec
tion,
mos
tly t
wo-
stor
y
Sin
gle-
sect
ion
and
mul
tisec
tion,
one
-sto
ry
Low
Hig
h
Low
Low
Hig
h
Hig
h
Hig
h
Hig
h
Med
ium
Med
ium
Sm
all
Larg
e
Larg
e
Med
ium
Med
ium
Med
ium
Med
ium
Sm
all
< 1
6
100
1
0 36
15
1
30
1
15
16
65
16
50
2
06
Sou
rce:
MH
RA
(200
7)
Applying Lean Production in Factory Homebuilding
Task 3. Conduct Value Stream Mapping and Data Collection After the lean training session, the plants initiated efforts to apply the lean concepts and tools learned.
Task 3.1. Collect Plant-Level Data
Each plant collected information describing current plant performance, including production levels, labor productivity, cycle and lead times, inventory levels, and quality levels.
Task 3.2. Develop a High-Level Value Stream Map
Each plant developed a high-level value stream map of plant operations (for example, door-to-door plant level).
Task 3.3. Identify Areas of High Opportunity
Each plant identified areas with high opportunity for improvement from the high-level value stream map (for example, bottleneck areas).
Task 3.4. Select an Area for Lean Improvement
Each plant selected a specific area or operation for lean implementation.
Task 3.5. Develop a Future-State Value Stream Map
Each plant developed an initial future-state value stream map focusing on lean improvements. Potential improvements included workplace organization and standardization (5Ss—sort, set in order, shine, standardize, and sustain—a workplace organization methodology in which emphasis is placed on maximizing space and minimizing movement/travel); labor optimization (line balancing and production leveling); better tools and equipment (including devices to minimize lifting and carrying of large/heavy materials); procedures (kanban replenishment, a stocking technique using containers, cards, and electronic signals to make production systems respond to real needs and not predictions and forecasts); and information systems (use of bar code/RFID [radio frequency identification]).
Task 4. Conduct Rapid Process Improvement Events RPI events were planned to move the production process closer to the future-state VSM (Task 3.5). Each plant conducted at least three major RPI events over the course of 8 months. Selected RPI events are described in the case study results later in this article.
Task 4.1. Develop RPI Implementation Strategy
The plant performed extensive observations and initial data collection on the selected area by creating detailed process flow maps, developing detailed current-state value stream maps of the area, and collecting quantitative data to support their analysis and document waste. They then developed an implementation plan, structured as an RPI event. Both floor supervisors and operators developed the plan for the lean implementation (for example, RPI event), which included a description of what was to be accomplished, how the event was to be conducted, what resources and materials were to be required, what plant personnel were to be involved, and how the outcome was going to be measured (typically, by comparing relevant before-and-after metrics).
Cityscape 87
Dentz, Nahmens, and Mullens
Task 4.2. Conduct the RPI Event
Each plant implemented its RPI plan and resulting lean improvements.
Task 4.3. Document Results of the RPI Event
RPI leaders documented and evaluated the RPI results, including RPI accomplishments, factors that limited RPI success, barriers that inhibited the development of a lean culture, and further opportunities for improving production.
Task 5. Disseminate Results and Lessons Learned At the conclusion of the study, representatives from the nine plants reconvened to share experiences in an open, industrywide symposium.
Case Study Results MHRA researchers were involved in three RPI events at each of the nine plants—a total of 27 RPI events. This article describes lean efforts and results in three of the nine plants, focusing on one of the more successful RPI events at each plant. These plants and RPI events were selected for inclusion here because they demonstrate a variety of successful approaches, illustrate good examples of fundamental lean principles, yielded measurable results, and were well documented. Some less successful efforts are discussed in context with the first case study.
Plant 1. Chelsea Modular Homes At the time of this study, Chelsea Modular Homes operated an 118,000-square-foot production facility configured as a central progressive assembly line (side-saddle type) fed by adjacent subassembly workstations that build floors, walls, and roofs. Chelsea’s approach to the lean initiative was to appoint an individual to have the dual responsibility of lean advocate and safety manager and to conduct a series of lean workshops with production workers, supervisors, and office employees. Eight employees participated in the first lean workshop: the lean advocate, a production foreman, the receiving supervisor, the quality control manager, a representative from engineering, and three production workers from various departments. Throughout their lean efforts, Chelsea’s lean advocate enjoyed strong support from plant and corporate management.
The following section discusses how the Chelsea plant conducted tasks 3 and 4.
Task 3. Conduct Value Stream Mapping and Data Collection
Task 3.1. Collect Plant-Level Data. The Chelsea lean team gathered plant-level data such as the company’s production rate (three to four modules per day), level of customization (80 percent of homes produced were highly customized and 20 percent of homes produced were totally custom), employee turnover (10 percent average per year), and absenteeism rate (3 percent average per year). In addition, the team gathered data on the production process, including material shortage frequency, time spent on rework due to change orders, time spent on rework due to errors, time spent idle waiting for line moves, number of times forced to work out of assigned line station, and
88 Refereed Papers
Applying Lean Production in Factory Homebuilding
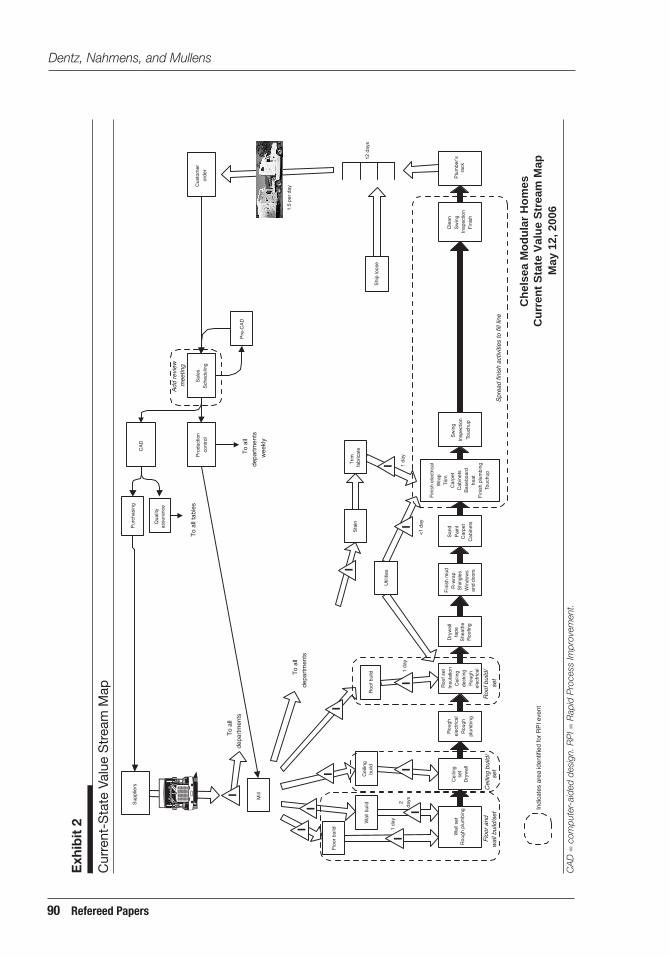
average and maximum time spent on a module. The team collected these data at the component level (for example, rough plumbing, wall build, and so forth), as opposed to the workstation level, by interviewing the process lead operators and focusing on production experience over the most recent 2-week period. These data were then verified by collecting data on modules completed during a 1-month period. In addition, the team collected 3 weeks of data on line pulls (when all modules are simultaneously pulled down the line from their current workstation to the next workstation). Combined, these data helped the team to visualize the production process and identify opportunities for improvement.
Task 3.2. Develop a High-Level Value Stream Map. The team worked for 3 days to develop a current-state value stream map for the entire plant. First, the team walked the floor and observed production activities. Next, the team constructed a rough outline of the value stream map, including material and information flows and major inventory locations. The team then collected performance data to quantify production performance and waste (for example, average and maximum process time per module, material shortages, rework due to change orders and errors, idle time waiting for bottlenecks, and number of times forced to work out of assigned workstation).
Task 3.3. Identify Areas of High Opportunity. The team used the current-state value stream map (exhibit 2) and performance data gathered in Task 3.2 to identify problem areas and opportunities for improving operations. They identified several RPI opportunities: (1) spread out finish activities clustered at the end of the production line to fill in empty slots earlier on the production line; (2) create a scheduling review meeting and have engineering and production jointly review house plans 2 weeks rather than 2 days before production; and (3) improve efficiency, flexibility, and flow in the floor, wall, roof, and ceiling framing areas.
In addition to experiencing the tangible results of the VSM exercise, participants reported that they began to think of the production line as a system rather than as a series of individual operations and the vital importance of takt time as the heartbeat of the line. (Takt is the German word for pace. Takt time equals available worktime per day divided by the daily required demand in parts per day.)
Task 3.4. Select an Area for Lean Improvement. The team determined that spreading out finish activities to fill empty slots on the line was the most critical opportunity for improvement. Spreading out finish activities to their appropriate stations was critical to stabilizing the line flow and a necessary precursor to addressing the individual workstation issues. Stability of production is essential to an efficient process flow and a prerequisite for implementing more advanced lean techniques. This first RPI was conducted in May 2006 and was followed by a second RPI in the wall department in July 2006.
These early RPIs met with limited success. Although they produced positive results immediately after implementation, the gains subsided because of the lack of a strong sustainability plan and unclear assignments of responsibility for institutionalizing the changes, and because the lean initia-tive’s resources were sapped due to other priorities. After employees witnessed the backsliding following the initial RPIs, the lean initiative was in danger of losing the broad-based employee support it had enjoyed and needed a high-visibility success to motivate the lean team and engage all employees in the lean initiative.
Cityscape 89
Exh
ibit
2
Cur
rent
-Sta
te V
alue
Str
eam
Map
I
Cus
tom
eror
der
Cle
anSw
ing
Fini
sh
Plum
ber’s
rack
Swin
gIn
spec
tion
Fini
sh e
lect
rical
Car
pet
Base
boar
dhe
atFi
nish
plu
mbi
ng
Sand
Car
pet
R-w
rap
Shin
gles
Win
dow
s
Dry
wal
l ta
peSh
eath
eR
oofin
g
Insu
latio
nC
eilin
gde
ckin
gR
ough
elec
trica
l
Rou
ghel
ectri
cal
Rou
ghpl
umbi
ng
Cei
ling
set
Dry
wal
l R
ough
plu
mbi
ng
I
I I
I I
Trim
fabr
icat
eSt
ain
Roo
f bui
ld
Cei
ling
build
W
all b
uild
Floo
r bui
ld
MillI
Pre-
CAD
CAD
Pu
rcha
sing
Prod
uctio
nco
ntro
l
Supp
liers
I
To a
llde
partm
ents
I I
Util
ities
I
To a
llde
partm
ents
wee
kly
I
To a
llde
partm
ents
2da
ys
1 da
y
1 da
y
<1 d
ay
1 da
y
12 d
ays
1.5
per d
ay
Add
revi
ewm
eetin
g
Spre
ad fi
nish
act
iviti
es to
fill
line
Roo
f bui
ld/
set
Cei
ling
build
/ se
t Fl
oor a
ndw
all b
uild
/set
Qua
lity
assu
ranc
e
To a
ll ta
bles
Insp
ectio
n To
uchu
p
Wra
p Tr
im
Cab
inet
s
Touc
hup
Pain
t
Cab
inet
s
Fini
sh m
ud
and
door
s
Roo
f set
Wal
l set
Ship
loos
e
Sale
sSc
hedu
ling
Che
lsea
Mod
ular
Hom
esIn
dica
tes
area
iden
tifie
d fo
r RPI
eve
nt
Cur
rent
Sta
te V
alue
Str
eam
Map
May
12,
200
6
Dentz, Nahmens, and Mullens
90 Refereed Papers
CA
D =
com
pute
r-ai
ded
desi
gn. R
PI =
Rap
id P
roce
ss Im
prov
emen
t.
Applying Lean Production in Factory Homebuilding
In a change of focus, management selected the spackling department for the next RPI. Spackling is the finishing of joints, cracks, and fastener penetrations in drywall with spackle (drywall paste). Spackling was not identified in the initial plant VSM exercise; however, management noted that numerous, small cross-departmental issues contributed to major quality problems in this department, resulting in poor quality at inspection, requiring expensive rework, and bottlenecking the rework area. The remainder of this case study focuses on the spackling RPI conducted in September 2006.
Task 4. Conduct Rapid Process Improvement Events
The spackling RPI was conducted during a 4-day period in September 2006. The drywall finishing operations employed a crew of four tapers, two sanders, and two painters distributed among five line stations. The RPI also encompassed three touchup workers, working farther down the line, who reported to a different group leader.
Task 4.1. Develop RPI Implementation Strategy. The objective of this RPI was to increase the quality of work delivered at inspection and reduce delays caused by rework. Chelsea managers were aware that spackling had numerous problems that contributed to poor productivity and low initial quality, such as the following:
• Poor communication across departments and a lack of cross-departmental coordination and cooperation. Issues discovered downstream were not communicated to upstream departments that contributed to them.
• Lack of accountability. Even when issues were communicated, teams did not take responsibility for the quality of their work. Rigid mindsets regarding responsibilities led to a “not my job” attitude.
• Numerous seemingly minor process and product issues that contributed to major problems at the end of the line.
• No systematic process to address and solve these issues.
The lean team developed a plan that included the following elements: a presentation to the team in which the plant manager reviewed the goals and expectations for the RPI; a brief training on basic lean tools; a process walkthrough; identification of issues and root causes; development of recommendations for improvement; and implementation of improvement recommendations and assessment of results. Six employees participated on the RPI team: the lean advocate, the spackling team leader, the foreman over the spackling area, a production worker from the sidewall department, a member of the touchup crew, and the yard supervisor, who was also responsible for final quality checks.
The success of this RPI was to be measured by the effect on wall finish quality as reported by quality inspectors at the inspection station and in the storage yard. The primary data would be in the form of the number of hours spent on rework (to repair walls and ceilings) before and after the implementations of the improvement recommendations.
Task 4.2. Conduct the RPI Event. The first day of the RPI, managers presented the RPI goals and expectations, and briefly trained the RPI team on basic lean tools (for example, the 5Ss, the
Cityscape 91
Dentz, Nahmens, and Mullens
seven wastes, and VSM). On the second and third days, the RPI team conducted a walkthrough of the drywall finishing operations, identified and researched problems identified on the floor, and discussed preliminary solutions. Problems identified included the following:
• Drywall installation in the module not completed on time.
• Poor quality of drywall coming into the spackling department (missing or damaged wallboard, large crude punch-outs for ceiling penetrations, screws not fully set, screws not hitting studs, glue seeping through seams in ceiling).
• Tapers using a hammer rather than a screwdriver to recess raised screw heads, causing damage to the wall.
• Insufficient drying time (the department was designed to have five dedicated workstations for drywall finish/sand/paint, but the number had been reduced due to early shipping commitments).
• Lumps of mud in bottom of corners caused by wiping spackling compound (mud) “up to down.”
• Inconsistent mud mix.
• Line workstation assignments not being adhered to.
• Attitude issues (not my job).
• Lack of unity and team spirit in the department.
• Lack of communication between workers and supervisors.
• Congestion in modules where sanding and painting were done (often simultaneously).
• Inadequate and uneven sanding in corners.
• Untrained and unmotivated workers.
On the fourth day, the RPI team presented recommendations to the plant manager and company president. The spackling RPI team made 22 specific recommendations for changes, including product changes, such as using wider tape to prevent glue seepage through drywall joints; maintaining a supply of 1/4-inch drywall; and, where not already in use, switching to electrical boxes suitable for installation in walls already drywalled. They also suggested process changes, including routing wall tops to ensure a flush surface for the ceiling to be set on and using a hole-saw rather than a hammer to make holes for plumbing vents. Equipment improvements suggested by the team were minor, but important; padding on racks and carts to reduce damage were the most important. Some of the most significant changes were in work rules: making departments responsible for quality and correcting mud defects before painting. The team recommended standardizing the mud mix procedure by marking water levels on the mud mix barrels and making organizational changes to better align responsibility with accountability and permit the area team leader to come down off his stilts so he could more easily move about the production floor to supervise his team. The RPI team implemented the recommended changes over the course of the next few weeks.
92 Refereed Papers
Applying Lean Production in Factory Homebuilding
Chelsea Modular Homes did not use a detailed value stream map for this RPI. Instead, while collecting data on the production process at the plant level, the RPI team discovered that most of the rework time was being spent on fixing damaged drywall on walls and ceilings. The team used root cause analysis to uncover causes of the damage. Root cause analysis is a problemsolving approach that entails investigating and drilling down to the fundamental underlying causes of a problem. In this case, a host of small but significant problems with finishing operations were found to be the usual root cause of drywall rework. Likewise, the RPI team did not develop a future-state value stream map during this RPI.
Task 4.3. Document Results of the RPI Event. Results from the spackling RPI were dramatic. Defects and rework at the inspection station were reduced by 85 percent (based on time required to repair walls and ceilings at the inspection station and in the storage yard). Often, only one of the three touchup workers was required, freeing the other two workers to perform other tasks. The quality inspector was able to focus on other quality issues that had previously been ignored. In addition to the gains in product quality, mindsets were positively affected. Workers gained an understanding of production as a system and more fully realized how cutting corners in one area can adversely affect another area (for example, not fully setting screws or punching oversized vent holes with a hammer made the mudder’s job difficult). Better communication and active involvement by employees in problemsolving resulted in improved morale and a more positive work attitude (as reported by anecdotal comments from employees and management).
Plant 2. R-Anell Housing Group, LLC R-Anell Housing produces modular residential and commercial structures. At the time of this study, the company’s production operations employed about 240 people working in two adjacent facilities, each containing a portion of the production line. R-Anell approached its lean initiative in a comprehensive manner, developing an overarching lean management strategy, a rigorous education campaign for both management and production associates, a comprehensive 5S campaign, and a highly structured process for conducting major RPI events. In addition, a unique characteristic of R-Anell’s lean strategy was the involvement of a lean engineer, who was responsible for all aspects of lean implementation. A director of process development oversaw the lean initiative and reported directly to senior management.
R-Anell’s lean strategy was unique in that the team focused on developing managerial guidelines to sustain the lean initiative, including a set of internal guidelines on organizing and conducting RPIs called “The 12 Steps of Kaizen Event Planning.” These steps provided general guidelines for event planning and a template for developing a detailed timeline for a specific event.
The following section discusses how this plant conducted tasks 3 and 4.
Task 3. Conduct Value Stream Mapping and Data Collection
Task 3.1. Collect Plant-Level Data. The lean team gathered data on the production process at the plant level, which included material shortages, list of steps in the process, space constraints, walking distances, and other performance data.
Cityscape 93
Dentz, Nahmens, and Mullens
Task 3.2. Develop a High-Level Value Stream Map. The lean team began the lean implementation with a high-level value stream map that identified areas that constrained production flow.
Task 3.3. Identify Areas of High Opportunity. Managers used the high-level VSM to identify future RPI events, including (1) implementing the 6Ss (R-Anell added a sixth S for safety) throughout the plant and (2) improving efficiency and flexibility in the dormer area and flow from the dormer area to the main line.
Task 3.4. Select an Area for Lean Improvement. The team conducted the 6Ss RPIs throughout the plant, with a first pass through each area completed by the summer of 2006. Area supervisors, who were trained during the first event held in the plant, ran 6S events. R-Anell began with the 6Ss because their implementation is critical to maintaining an efficient and effective workplace. In July 2006, the team conducted the dormer area RPI. The remainder of this case study focuses on the dormer RPI.
Task 4. Conduct Rapid Process Improvement Events
R-Anell’s first major RPI event was in the dormer area. Dormers are structural elements of a building that protrude from the plane of a sloping roof surface to expand living space under the roof. This area was chosen for several reasons: it was not meeting daily production requirements; it was using excessive overtime; area workers were open to new improvement ideas; and it was an offline operation that could be interrupted with minimal impact to the main production line.
Task 4.1. Develop RPI Implementation Strategy. The objective of the dormer RPI was to improve productivity and provide space for large dormers (also called gable dormers) to be built in the plant. The common smaller dormers were built in the plant, but larger dormers (more than about 8 feet wide) were built on site, lengthening the construction process. The dormer RPI adhered to R-Anell’s 12 Steps of Kaizen Event Planning as outlined in the following text.
Task 4.2. Conduct the RPI Event. The steps for the RPI event were as follows:
1. Map area and gather data. The team developed a detailed current-state value stream map of the dormer area, took photos of the area, and observed and recorded procedures. Floor plans of the dormer area were used to develop spaghetti charts (a movement path diagram) that examined material and employee movements and to develop proposed layouts. The lean team interviewed area employees and listened to their problems and concerns.
2. Train area associates. The lean engineer conducted a lean simulation exercise and classroom training in lean fundamentals.
3. Determine gable dormer construction method and layout. The lean engineer developed a proposed location and process for constructing the large gable dormers.
4. Map the value stream. The team developed a detailed value stream map of the dormer area and a spaghetti diagram for each major dormer component built in the area. The team gathered data on the dormer operation, which included a list of steps in the process, space constraints, and walking distances.
94 Refereed Papers
Applying Lean Production in Factory Homebuilding
5. Develop and implement future-state layout. After brainstorming the needs of the dormer area, the team generated and prioritized a list of concerns. High-priority needs were incorporated into the future-state value stream map, which showed the process after implementation of the improvements, eliminating many of the previous production flow constraints. Some of the improvements included better material storage and a layout that eliminated excessive walking to use and retrieve tools and materials.
6. Report progress to management. The executive management team visited the area to review the changes and to see team members report on the previous state, changes, and measured improvements.
7. Complete a trial production. Workers completed a trial build in the reconfigured area and gathered labor time data and costing information. The team discussed concerns and improvement ideas generated as a result of the trial.
8. Implement refinements. Workers implemented refinements and roped off the freed space for the future gable dormer area.
9. Build first production dormer. After production commenced, workers conducted another team review to discuss concerns and improvement ideas and to prioritize additional refinements.
10. Implement refinements 2. Workers implemented additional refinements based on the second team review.
11. Document process. The lean engineer recorded all procedures and developed written job instructions.
Begin with new layout. 12. Workers commenced regular production.
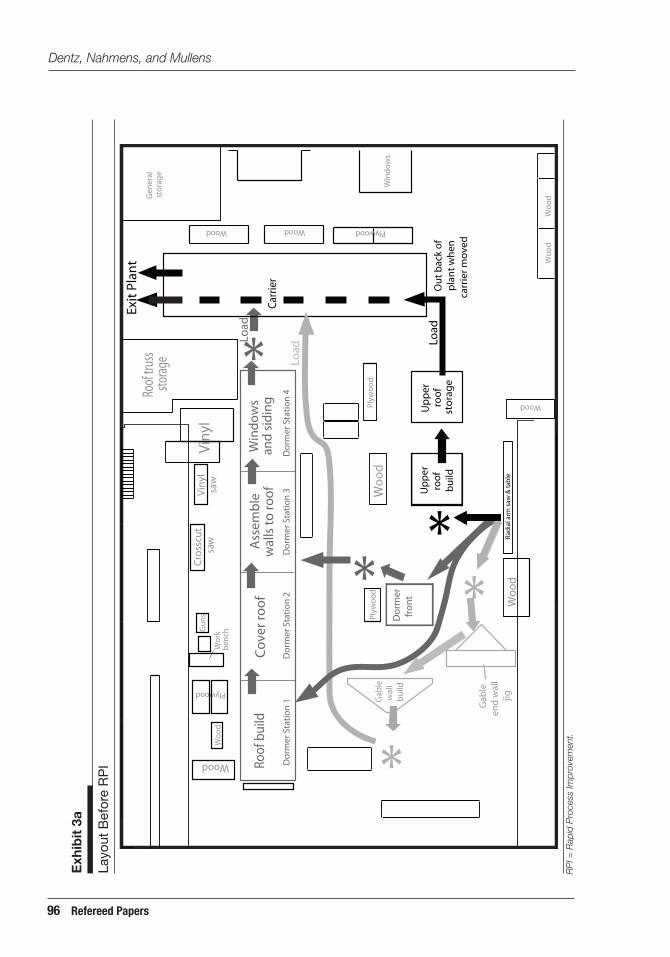
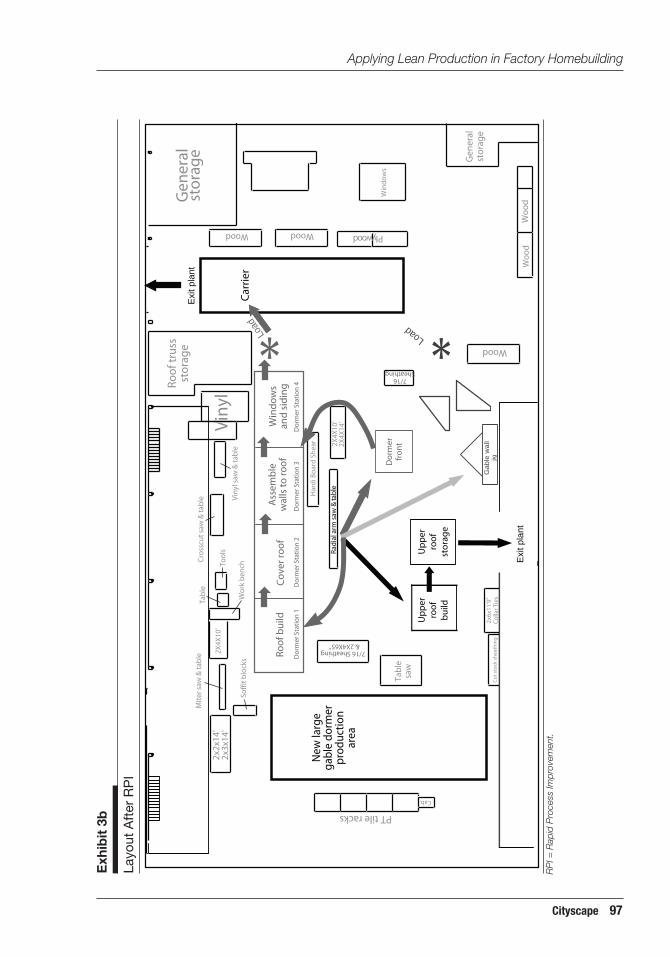
Task 4.3. Document Results of the RPI Event. The lean team assessed the outcome of the RPI by measuring the usage of production floor space, employee travel distance, and number of employees required before and after implementation of the improvement recommendations. The area layouts before and after the kaizen event are shown in exhibits 3a and 3b. As seen in the after diagram, products are completed close to the point of need or an exit from the area. Material storage is reduced due to centralized staging and equipment locations. The saw is centralized to minimize the distance to areas it serves. The dormer build production line has been compressed. A new, large gable dormer production area has been created.
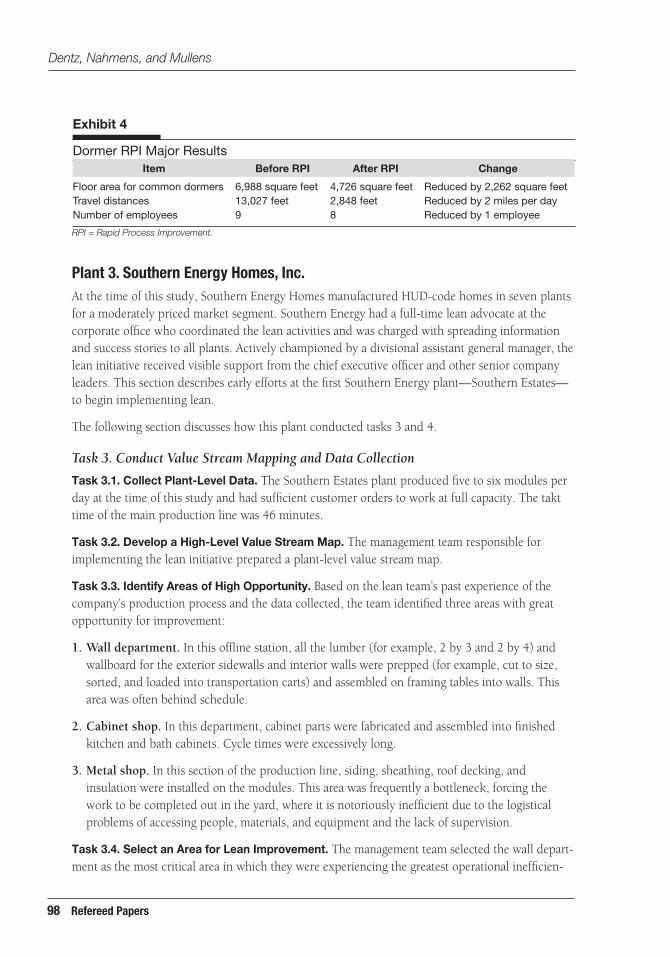
By streamlining the flow of product through the area, reducing duplicative material inventory (for example, oriented strand board was reduced from three bundles to one), and compacting work centers, enough space was freed up to provide room for the large gable dormer area. The value of the manufacturing space freed up was $108,000 based on the plant accounting department’s facility cost calculations ($47.75 per square foot x 2,262 square feet). In addition, reduced travel distances and closer access to materials reduced the amount of time required to accomplish the same amount of work so that the prior need for an additional employee was eliminated. Overtime in the area was also largely eliminated, saving $27,300 annually. A summary of the major results is shown in exhibit 4.
Cityscape 95
Exh
ibit
3a
Layo
ut B
efor
e R
PI
Wo
odG
ener
al
Wo
od
Cro
sscu
t V
inyl
Plyw
oo
d
Wood Wood
Gu
ns
Wo
rkb
ench
Plywood
Wood
Wo
od
Wo
od
Wo
od
Plyw
oo
d
Roof
bui
ld
Co
ver r
oo
f A
ssem
ble
W
ind
ow
san
d s
idin
g sto
rage
Up
per
roo
fb
uild
Up
per
roo
fst
ora
ge
Do
rmer
fro
nt
*
*
*
Gab
lew
all
bu
ild
Gab
leen
d w
all
jig
Ou
t b
ack
of
pla
nt
wh
enca
rrie
r mo
ved
* *
Carr
ier
Exit
Pla
nt
Do
rmer
Sta
tio
n 1
D
orm
er S
tati
on
2
Do
rmer
Sta
tio
n 3
Load
Load
Load
sto
rag
e
Wood
saw
V
inyl
sa
w
Plywood
Win
do
ws
wal
ls t
o ro
of
Roof
trus
s
Rad
ial a
rm s
aw &
tab
le
Do
rmer
Sta
tio
n 4
Dentz, Nahmens, and Mullens
96 Refereed Papers
RP
I = R
apid
Pro
cess
Impr
ovem
ent.
Exh
ibit
3b
Layo
ut A
fter
RP
I
Wo
odG
ener
alst
orag
e Gen
eral
stor
age
Wo
od
Up
per
roo
fU
pp
erro
of
Wood
Vin
yl s
aw &
tab
le
Vin
yl
Wood Wood
Too
ls
Wo
rk b
ench
2X4X
10'
Roo
f tru
ssst
ora
ge
7/16 Sheathing
2X4X
10'
2X4X
14'
Cro
sscu
t saw
& ta
ble
Tab
leM
iter
saw
& ta
ble
Soff
it b
lock
s
Tab
lesa
w
2x2x
14'
2x3x
14'
2x6x
11'9
"
Do
rmer
fro
nt
* N
ew la
rge
gab
le d
orm
erp
rodu
ctio
nar
ea
Do
rmer
Sta
tio
n 1
D
orm
er S
tati
on
2
Do
rmer
Sta
tio
n 3
Exi
t pla
nt
Exi
t pla
nt
*LoadLoad
PT tile racks
Win
do
ws
and
sid
ing
Ass
emb
lew
alls
to
roo
fC
ove
r ro
of
Roo
f bu
ild
Gab
le w
all
bu
ild
sto
rag
e
Plywood
Win
do
ws
7/16 Sheathing
Rad
ial a
rm s
aw &
tab
le
Cu
t sto
ck s
hea
thin
g
Har
di B
oar
d S
hea
r
Cab.
& 2X4X65"
Co
llar T
ies
Do
rmer
Sta
tio
n 4
Car
rier
jig
Applying Lean Production in Factory Homebuilding
Cityscape 97
RP
I = R
apid
Pro
cess
Impr
ovem
ent.
Dentz, Nahmens, and Mullens
Exhibit 4
Dormer RPI Major Results
Floor area for common dormers 6,988 square feet 4,726 square feet Reduced by 2,262 square feet Travel distances 13,027 feet 2,848 feet Reduced by 2 miles per day Number of employees 9 8 Reduced by 1 employee
Item After RPI ChangeBefore RPI
RPI = Rapid Process Improvement.
Plant 3. Southern Energy Homes, Inc. At the time of this study, Southern Energy Homes manufactured HUD-code homes in seven plants for a moderately priced market segment. Southern Energy had a full-time lean advocate at the corporate office who coordinated the lean activities and was charged with spreading information and success stories to all plants. Actively championed by a divisional assistant general manager, the lean initiative received visible support from the chief executive officer and other senior company leaders. This section describes early efforts at the first Southern Energy plant—Southern Estates— to begin implementing lean.
The following section discusses how this plant conducted tasks 3 and 4.
Task 3. Conduct Value Stream Mapping and Data Collection
Task 3.1. Collect Plant-Level Data. The Southern Estates plant produced five to six modules per day at the time of this study and had sufficient customer orders to work at full capacity. The takt time of the main production line was 46 minutes.
Task 3.2. Develop a High-Level Value Stream Map. The management team responsible for implementing the lean initiative prepared a plant-level value stream map.
Task 3.3. Identify Areas of High Opportunity. Based on the lean team’s past experience of the company’s production process and the data collected, the team identified three areas with great opportunity for improvement:
1. Wall department. In this offline station, all the lumber (for example, 2 by 3 and 2 by 4) and wallboard for the exterior sidewalls and interior walls were prepped (for example, cut to size, sorted, and loaded into transportation carts) and assembled on framing tables into walls. This area was often behind schedule.
2. Cabinet shop. In this department, cabinet parts were fabricated and assembled into finished kitchen and bath cabinets. Cycle times were excessively long.
3. Metal shop. In this section of the production line, siding, sheathing, roof decking, and insulation were installed on the modules. This area was frequently a bottleneck, forcing the work to be completed out in the yard, where it is notoriously inefficient due to the logistical problems of accessing people, materials, and equipment and the lack of supervision.
Task 3.4. Select an Area for Lean Improvement. The management team selected the wall department as the most critical area in which they were experiencing the greatest operational inefficien
98 Refereed Papers
Applying Lean Production in Factory Homebuilding
cies. The inefficiencies affected the flow of walls to the main production line and therefore affected the flow of the entire plant. Although the takt time of the main production line was 46 minutes, cycle times in the wall department often reached 65 minutes. The variability of cycle times in the wall department created bottlenecks on the main production line. Because the wall department was connected to the main line by an equipment-constrained station (the wall set station on the main line required the use of a crane), modules on the main line could not leave the wall set station until the activity was complete (for example, all walls set). Upstream modules could not cycle forward, and downstream work was delayed as holes were created in the main production line. These inefficiencies and delays lengthened the time to complete a house.
The remainder of this case study focuses on the wall department RPI.
Task 4. Conduct Rapid Process Improvement Events
Task 4.1. Develop RPI Implementation Strategy. The RPI team included the plant production manager, the division assistant general manager, Southern Energy’s corporate lean advocate, the area supervisor, a maintenance employee, and representative workers from the area. The objective of the RPI was to increase productivity by rearranging the equipment layout and material locations to rationalize the flow of materials through the area.
Because of the extensive construction required to implement the changes it anticipated, the team developed a plan to conduct the RPI in three phases: (1) planning and preparing initial design (May 2006), (2) finalizing the design with large-scale involvement of area workers and making physical changes to the work area (June–July 2006), and (3) evaluating and refining the new area (August 2006).
Task 4.2. Conduct the RPI Event. During the first phase (May 2006), the team conducted detailed observations of the activities, material and information flow, and equipment in the wall department and developed a detailed value stream map. The team observed that workers were forced to walk excessively to get materials, material flow was random, materials did not have fixed staging locations, and finished walls had to be pulled through the shop by hand.
Participants discussed alternatives for improving the area layout and material flow and developed a new department layout and a future-state value stream map showing a target value stream. The team also analyzed the effects of the department on the flow of the main production line. During the second phase of the RPI (June–July 2006), the team carried through on the plan, involving departmental staff, completing necessary reconstruction, and implementing the new arrangement. In the third phase (August 2006), the team reconvened to observe and document the activities in the reconfigured area.
The assessment revealed that wall-framing activities on the tables were a bottleneck and workload across the tables was not balanced. Framers at one table were completing walls for a given house and commencing building walls for the next house before the remaining tables had completed the walls they were working on for the first house. The team met to discuss the new layout and potential revised activity arrangements in light of these issues. Area employees were open and enthusiastic about the new changes and recommended further improvements for the area. A subsequent evaluation in September confirmed that these recommendations had been implemented and had
Cityscape 99
Dentz, Nahmens, and Mullens
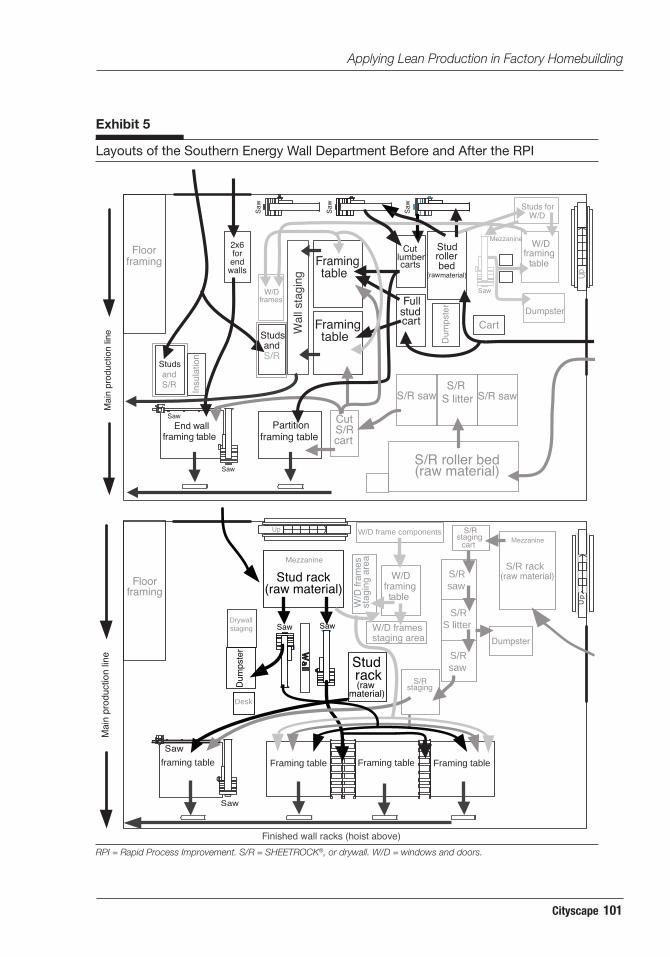
resolved the problems. As a result of the RPI, the wall area was completely reconfigured with the guiding principle that materials should flow from outer storage areas toward the main production line with a minimum of travel distance and detours. Before the RPI, materials were not stored logically near where they would be needed. The post-RPI material paths are shorter and more direct, with practically no intersections of different material flows until they reach the wall-framing tables, where all materials come together for final wall assembly. Exhibit 5 shows the area before and after the RPI.
Task 4.3. Document Results of the RPI Event. Before the RPI, employees did a lot of walking and carrying of materials. The area was reorganized with attention to ergonomics, reducing carrying distances and providing access to the existing hoist, which was extended to serve all wall-framing tables. Before the RPI, employees made mistakes when information about which walls to build was not transmitted properly. Carts of materials were easily misplaced or misidentified. After the RPI, the department implemented a system of labels and racks to organize the flow of information along with the flow of materials in keeping with the ideal of “a place for everything and everything is in its place.”
As a result of the changes, productivity improved. The department was able to meet the needs of the main line and the wall department workforce was reduced from 9 to 6.5 people. Importantly, no one lost his or her job because of lean activities; rather, experienced workers were transferred to other departments where they were needed due to normal attrition. Other benefits included space savings of 12 percent and wallboard damage reduction of approximately 10 percent. Southern Energy invested $25,786 in labor and materials for this RPI. The investment paid for itself in less than 4 months, because annual labor savings amounted to $73,200 and the company realized the savings of not needing to hire and train 2.5 new workers.
Lean Implementation Lessons The lean initiative clearly demonstrated that the same lean production concepts that have been so successful in automotive, electronics, and other industries can be applied successfully in factory homebuilding. From an organizational perspective, the lean initiative showed the critical importance of having a lean advocate(s) on site with the time and management support to drive the process.
From a tools perspective, the lean initiative demonstrated that VSM was most useful for three purposes:
• Training. Plant-level VSM enabled production workers and midlevel production managers to visualize the production line as a flow system with interdependencies.
• Targeting ‘problem’ department. After reflecting on the many activities across the whole plant and collecting some limited information about the waste in each department, the lean team identified departments with high levels of waste or the potential to bottleneck overall production flow.
• Developing a thorough understanding of departmental operations and issues. The starting point of successful lean improvement can be identifying production tasks, estimating their cycle
100 Refereed Papers
Applying Lean Production in Factory Homebuilding
Exhibit 5
Layouts of the Southern Energy Wall Department Before and After the RPI
i
Up
Partition framing tablef
Wal
l sta
ging
fW/D
W/Dfll
bed ( ial)
f
Studs and
framing
( ial)
S/ S/S li
lumberend walls
and
Insu
latio
n
Mai
n pr
oduc
tion
line
i
i
Up
Framing table
l
( ial)
W/D frame components
f
(ial)
W/D fstaging area
staging
f
Mai
n pr
oduc
tion
line
W/D
fst
agin
g ar
ea
( ial)S/R rack
staging
Drywall staging
Mezzan ne
Framing table
Framingtable
End wall raming table
Saw
Saw Full
stud cart
Studs or
raming table
Stud ro er
rawmater
W/D rames
Dumpster
S/R
Cut S/R cart
Saw
Floor
S/R roller bed raw mater
R saw R saw S/R
tter
Cut carts
Saw
Saw
Saw
2x6 for
Studs
S/R
Cart
Dum
pste
r
Mezzan ne
Mezzan ne
Up
Saw
Saw
Stud rack raw mater
W/D ramingtable
Stud rack raw
mater
rames Dumpster
S/R
cart
Saw
Floor raming
framing table Framing table Framing table
Dum
pste
r
ram
es
raw mater
S/R
S/R saw
S/R saw
S/R S litter
Desk
Saw
Finished wall racks (hoist above) RPI = Rapid Process Improvement. S/R = SHEETRoCK®, or drywall. W/D = windows and doors.
Cityscape 101
Dentz, Nahmens, and Mullens
times, identifying inventory levels and other signs of waste, and summarizing this information in a detailed department value stream map. This level of analysis is particularly enlightening for offline production departments (for example, wall department, dormer department) that have disconnected workstations separated by inventory.
Although RPI events were shown to be an effective strategy for implementing improvements, most plants were hesitant to reassign production staff, even temporarily, to lean activities. Short staffing caused by perpetual absenteeism and hiring problems was cited as the primary issue. Plants met the challenge of staffing RPI events by using a variety of strategies, including the following:
• Have the complete RPI team gather for a series of shorter meetings (1 to 3 hours) for a number of days over the course of a week. Then conduct a longer intensive implementation blitz, perhaps on a nonproduction day.
• Use a core group of three to four RPI team members (including the lean advocate) to do preparatory work and develop preliminary solutions. Involve production workers from the area and other affected employees individually or in small groups for brief meetings to get their feedback and buy-in.
• Use nonproduction days to accomplish the bulk of the RPI and pay production workers overtime.
The most encouraging result of the industry lean initiative was that after 1 year all nine plants were aggressively moving forward with their lean programs and were using their own inhouse lean advocates to look critically at their production processes, conduct RPIs, and implement lean improvements. The industry’s challenge will be to maintain the momentum of the lean pioneers, while growing the base of companies involved with lean production.
Conclusion The use of Value Stream Mapping and Rapid Process Improvement is an effective starting point for factory home builders seeking to use lean thinking to slash waste from their production operations. The main goal of a value stream map (both high level and detailed) is to identify waste, whereas RPI events improve the process through waste elimination. VSM can be used independently from RPIs, by creating a high-level value stream map of the process. A high-level value stream map (for example, door-to-door plant level) can help plants document their current situation and identify wasteful activities so that such activities can be challenged and eliminated through other process-improvement activities. VSM can also be used as part of an RPI event, by developing a detailed value stream map of the process or activity that is the focus of the effort. As the three case studies show, RPI events can offer quick and dramatic results in target production departments. Taken as a whole, lean production strategies implemented through an RPI event can increase the efficiency and quality of building operations, boost workers’ morale, and improve communication between management and workers.
102 Refereed Papers
Applying Lean Production in Factory Homebuilding
Acknowledgments
The authors acknowledge the assistance, advice, and guidance of several people without whose help this project would not have been possible. Members of the Lean Initiative Steering Committee: Rick Boyd, Clayton Homes, Inc., Project Chair; Michael Blanford, U.S. Department of Housing and Urban Development; Robert Carver, New York State Energy Research and Development Authority; Randy Cosby, R-Anell Housing Group, LLC; Terry Dullaghan, Senco Products, Inc.; Mark Ezzo, Clayton Homes, Inc.; William Farish, Fleetwood Enterprises, Inc.; and Bert Kessler, Palm Harbor Homes. Plant lean advocates: Austin Baidas, Four Seasons Housing, Inc.; Brent Bardo, Four Seasons Housing, Inc.; Butch Berlin, Hi-Tech Housing, Inc.; Ty Batchelor, Southern Energy Homes, Inc.; Brent Crabtree, Clayton Homes, Inc.; Robbie Davis, Palm Harbor Homes; Lamar Dickerson, Southern Energy Homes, Inc.; Kenneth Hutchings, Chelsea Modular Homes, Inc.; Charles Kilbourne-Jervais, R-Anell Housing Group, LLC; Michael Lombard, Palm Harbor Homes; Kevin Longmire, Clayton Homes, Inc.; Aubrey Moore, Southern Energy Homes, Inc.; Jim Mosier, Four Seasons Housing, Inc.; Joseph Mullins, Hi-Tech Housing, Inc.; Tommy Rogers, Palm Harbor Homes; Clifford Robbins, R-Anell Housing Group, LLC; Richard Shields, Chelsea Modular Homes, Inc.; Steve Stokes, Chelsea Modular Homes, Inc.; Allen Tucker, Palm Harbor Homes; Randy Tyler, Jr., Four Seasons Housing, Inc.; Michael Wade, Cavalier Homes, Inc.; and Johnny Wooten, Cavalier Homes, Inc. Manufactured Housing Research Alliance (MHRA) staff and subcontractors: Emanuel Levy, MHRA Executive Director; Gwynne Koch, MHRA; Catrina Arana, MHRA; and Dewey Warden, Senco Products, Inc.
Authors
Jordan Dentz is senior research coordinator at the Manufactured Housing Research Alliance in New York City.
Isabelina Nahmens is an assistant professor in the Department of Construction Management & Industrial Engineering, Louisiana State University, Baton Rouge, Louisiana.
Michael Mullens is the principal investigator at the Housing Constructability Lab in Orlando, Florida.
References
Bessant, John, Sarah Caffyn, and Maeve Gallagher. 2001. “An Evolutionary Model of Continuous Improvement Behaviour,” Technovation 21: 67–77.
Boer, Harry, Andres Berger, Ross Chapman, and Frank Gertsen, eds. 2000. CI Changes: From Suggestion Box to Organizational Learning—Continuous Improvement in Europe and Australia. Aldershot, Hampshire, United Kingdom: Ashgate.
Caldeira, Edward. 1999. “Lean Construction,” Professional Builder, August 1. Also available at http://www.housingzone.com/probuilder/article/CA466822.html.
Carlson, Don, ed. 1991. Automated Builder: Dictionary/Encyclopedia of Industrialized Housing. Carpinteria, CA: CMN Associates.
Cityscape 103
Dentz, Nahmens, and Mullens
Koskela, Lauri. 1993. “Lean Production in Construction.” In Proceedings of the 10th International Symposium of Automation and Robotics in Construction, Houston, TX, May 24–26: 47–54.
Laraia, Anthony, Patricia Moody, and Robert Hall. 1999. The Kaizen Blitz: Accelerating Breakthroughs in Productivity and Performance. San Francisco: Jossey-Bass.
Manufactured Housing Research Alliance (MHRA). 2007. Pilot Study: Applying Lean to Factory Home Building. Report prepared for the U.S. Department of Housing and Urban Development (HUD). http://www.pathnet.org/sp.asp?id=24122 (accessed October 30).
———. 2005. Getting Lean: Assessing the Benefits of Lean Production in Factory Built Housing. Report prepared for the U.S. Department of Housing and Urban Development (HUD). http://www.huduser.org/publications/manufhsg/leanprod.html (accessed January 28, 2009).
Mullens, Michael. 2006. “Applying Lean to Factory Homebuilding.” Presented to the Lean Workshop sponsored by the Manufactured Housing Research Alliance, April.
Mullens, Michael. 2004. “Production Flow and Shop Floor Control: Structuring the Modular Factory for Custom Homebuilding.” In Proceedings of the NSF Housing Research Agenda Workshop, Vol. 2. February 12–14.
Mullens, Michael, and Mark Kelley. 2004. “Lean Homebuilding Using Modular Technology,” Housing and Society 31 (1): 41–54.
Ohno, Taiichi. 1988. Toyota Production System. New York: Productivity Press.
Picchi, Flavio, and Ariovaldo Granja. 2004. Construction Sites: Using Lean Principles to Seek Broader Implementations. Cambridge, MA: Lean Enterprise Institute.
Pyzdek, Thomas. 2003. The Six Sigma Handbook. New York: McGraw-Hill.
Salem, O., and E. Zimmer, rev. 2005. “Application of Lean Manufacturing Principles to Construction,” Lean Construction Journal 2 (2): 51–54.
U.S. Census Bureau. 2007. “Type of Construction Method of New One-Family Houses Completed.”http://www.census.gov/const/C25Ann/sftotalconstmethod.pdf (accessed December 19, 2008).
U.S. Department of Housing and Urban Development (HUD). 2006. Manufactured Home Construction and Safety Standards. 24 CFR Part 3280. Washington, DC: Government Printing Office.
Womack, James, and Daniel Jones. 1996. Lean Thinking: Banish Waste and Create Wealth in Your Corporation. New York: Simon & Schuster.
104 Refereed Papers


