Applying fuzzy logic to estimate the parameters of … · Applying fuzzy logic to estimate the...
8
1 Braz. J. Biol. http://dx.doi.org/10.1590/1519-6984.20014 Applying fuzzy logic to estimate the parameters of the length-weight relationship S. D. Bitar a , C. P. Campos b and C. E. C. Freitas b * a Department of Mathematics, Universidade Federal do Amazonas – UFAM, Av. General Rodrigo Otávio Jordão Ramos, 3000, Campus Universitário, CEP 69077-000, Manaus, AM, Brazil b Department of Fisheries Sciences, Universidade Federal do Amazonas – UFAM, Av. General Rodrigo Otávio Jordão Ramos, 3000, Campus Universitário, CEP 69077-000, Manaus, AM, Brazil *e-mail: [email protected] Received: September 24, 2014 – Accepted: May 28, 2015 – Distributed: August 31, 2016 (With 3 figures) Abstract We evaluated three mathematical procedures to estimate the parameters of the relationship between weight and length for Cichla monoculus: least squares ordinary regression on log-transformed data, non-linear estimation using raw data and a mix of multivariate analysis and fuzzy logic. Our goal was to find an alternative approach that considers the uncertainties inherent to this biological model. We found that non-linear estimation generated more consistent estimates than least squares regression. Our results also indicate that it is possible to find consistent estimates of the parameters directly from the centers of mass of each cluster. However, the most important result is the intervals obtained with the fuzzy inference system. Keywords: allometric model, Cichla, fuzzy logic, parameter estimation. O uso da lógica fuzzy para estimar os parâmetros da relação entre peso e comprimento Resumo Empregamos três procedimentos matemáticos, regressão com mínimos quadrados ordinários com dados log-transformados, estimação não-linear e uma combinação de análise multivariada e lógica fuzzy para estimar os parâmetros da relação peso × comprimento para Cichla monoculus. Nosso objetivo foi apresentar uma abordagem alternativa que considere as incertezas inerentes ao modelo. Observamos que as estimativas da estimação não-linear foram mais consistentes que as obtidas por regressão linear sobre dados log-transformados. Nossos resultados também mostraram que é possível obter estimativas dos parâmetros diretamente dos centros de máximos formados dos grupos por uma análise de agrupamento k-means. No entanto, os resultados mais importantes foram os intervalos obtidos com o sistema de inferência fuzzy. Palavras-chave: modelo alométrico, Cichla, logica fuzzy, estimação de parâmetros. 1. Introduction The square-cube law has a long history in the biological sciences (Froese, 2006), and the question of how it should be used has been the subject of debate since the beginning of the 20th century. Fulton (1904) was the first to find that assuming a power of three for the length-weight relationship could be incorrect for fish. Later, Keys (1928) and Clark (1928) first proposed the modern equation that estimates the length-weight relationship, W = aL B , where W is the weight, L is the length, and a and b are parameters. They employed least squares ordinary regression to estimate these parameters after log-transformation of the length and weight data. Several authors have reiterated the importance of the length-weight relationship and interpretation of the parameters that define it (Fulton, 1904; Le Cren, 1951; Venugopalan and Prajneshu, 1998; Froese, 2006). Parameter a is called the condition factor and has been used to evaluate the relative health of an individual fish, i.e., the fish’s well-being. However, problems were pointed out by Le Cren (1951), who proposed the relative condition factor to offset changes in form or condition as a result of an increase in length. Nevertheless, this approach does not resolve the critical question of the variability of this index. As pointed out by Le Cren (1951), the differences in the mean conditions of two populations can be explained by at least three factors, including environmental conditions (e.g., the season of the hydrological cycle in large rivers with adjacent floodplains)
-
Upload
duongkhanh -
Category
Documents
-
view
224 -
download
0
Transcript of Applying fuzzy logic to estimate the parameters of … · Applying fuzzy logic to estimate the...

11Braz. J. Biol.
http://dx.doi.org/10.1590/1519-6984.20014
Applying fuzzy logic to estimate the parameters of the length-weight relationship
S. D. Bitara, C. P. Camposb and C. E. C. Freitasb*aDepartment of Mathematics, Universidade Federal do Amazonas – UFAM, Av. General Rodrigo Otávio Jordão Ramos,
3000, Campus Universitário, CEP 69077-000, Manaus, AM, BrazilbDepartment of Fisheries Sciences, Universidade Federal do Amazonas – UFAM, Av. General Rodrigo Otávio Jordão
Ramos, 3000, Campus Universitário, CEP 69077-000, Manaus, AM, Brazil*e-mail: [email protected]
Received: September 24, 2014 – Accepted: May 28, 2015 – Distributed: August 31, 2016(With 3 figures)
AbstractWe evaluated three mathematical procedures to estimate the parameters of the relationship between weight and length for Cichla monoculus: least squares ordinary regression on log-transformed data, non-linear estimation using raw data and a mix of multivariate analysis and fuzzy logic. Our goal was to find an alternative approach that considers the uncertainties inherent to this biological model. We found that non-linear estimation generated more consistent estimates than least squares regression. Our results also indicate that it is possible to find consistent estimates of the parameters directly from the centers of mass of each cluster. However, the most important result is the intervals obtained with the fuzzy inference system.
Keywords: allometric model, Cichla, fuzzy logic, parameter estimation.
O uso da lógica fuzzy para estimar os parâmetros da relação entre peso e comprimento
ResumoEmpregamos três procedimentos matemáticos, regressão com mínimos quadrados ordinários com dados log-transformados, estimação não-linear e uma combinação de análise multivariada e lógica fuzzy para estimar os parâmetros da relação peso × comprimento para Cichla monoculus. Nosso objetivo foi apresentar uma abordagem alternativa que considere as incertezas inerentes ao modelo. Observamos que as estimativas da estimação não-linear foram mais consistentes que as obtidas por regressão linear sobre dados log-transformados. Nossos resultados também mostraram que é possível obter estimativas dos parâmetros diretamente dos centros de máximos formados dos grupos por uma análise de agrupamento k-means. No entanto, os resultados mais importantes foram os intervalos obtidos com o sistema de inferência fuzzy.
Palavras-chave: modelo alométrico, Cichla, logica fuzzy, estimação de parâmetros.
1. Introduction
The square-cube law has a long history in the biological sciences (Froese, 2006), and the question of how it should be used has been the subject of debate since the beginning of the 20th century. Fulton (1904) was the first to find that assuming a power of three for the length-weight relationship could be incorrect for fish. Later, Keys (1928) and Clark (1928) first proposed the modern equation that estimates the length-weight relationship, W = aLB, where W is the weight, L is the length, and a and b are parameters. They employed least squares ordinary regression to estimate these parameters after log-transformation of the length and weight data.
Several authors have reiterated the importance of the length-weight relationship and interpretation of
the parameters that define it (Fulton, 1904; Le Cren, 1951; Venugopalan and Prajneshu, 1998; Froese, 2006). Parameter a is called the condition factor and has been used to evaluate the relative health of an individual fish, i.e., the fish’s well-being.
However, problems were pointed out by Le Cren (1951), who proposed the relative condition factor to offset changes in form or condition as a result of an increase in length. Nevertheless, this approach does not resolve the critical question of the variability of this index. As pointed out by Le Cren (1951), the differences in the mean conditions of two populations can be explained by at least three factors, including environmental conditions (e.g., the season of the hydrological cycle in large rivers with adjacent floodplains)
Braz. J. Biol. 2
Bitar, S.D., Campos, C.P. and Freitas, C.E.C.
2
and the current stage of gonad development. In fact, there is a consensus that the condition factor is strongly influenced by environmental conditions, including the availability of food. In addition, the assumption that the parameter b was a constant has been disproven; the problem is that there are substantial morphological changes that occur during a fish’s ontogeny, which mainly happen during the larval stages (Pepin, 1995). However, the criticism in general has been leveled at the use of the square-cube law (b = 3) in the length-weight relationship (Froese, 2006), which is an oversimplification of the problem. As with parameter a, the critical question to be addressed for parameter b is the variance.
Another key question that few have stressed in the literature is the estimation procedure. Venugopalan and Prajneshu (1998) pointed out the deficiencies of the ordinary least squares procedure when it is used to estimate the parameters of the allometric equation and explained that fitting the allometric equation with an additive error is not equivalent to fitting a linearized model after a log-transformation. However, even though fitting nonlinear models should result in more robust estimates of parameters a and b, this change in the estimation procedure does not account for the inherent variability of these parameters.
Recently, Froese et al. (2014) proposed a Bayesian hierarchical approach for estimating the length-weight relationship and stated that this produces more realistic estimates of the uncertainty inherent in this relation. For stochastic models, the mean parameters are known a posteriori when there is a probability distribution associated with the phenomena being studied.
Another potential approach to address the uncertainties in the length-weight relationship is fuzzy set theory or fuzzy logic (Zadeh, 1965). Using fuzzy logic, intervals or fuzzy sets can be built for the parameters, which have different degrees of membership. A subject can belong to one or more fuzzy sets with different degrees of membership in each set. Fuzzy sets thus incorporate the uncertainties that are inherent in the data. The use of fuzzy sets to represent the parameters defining fish population dynamics could help support fishing management plans because of the flexibility of this type of set and the possibility of using lower limits for these sets as a precautionary approach. In this paper we describe a procedure that combines multivariate analysis and fuzzy logic (Zadeh, 1965) to estimate the parameters of the length-weight relationship. The procedure is suited to this application because it can handle the variability that is inherent in the data measures at an individual level. To evaluate the procedure, we used length and weight data for tucunaré (Cichla monoculus) caught in a large floodplain lake on the left bank of the Amazon River. Linear regression using ordinary least squares on log-transformed data and non-linear regression were used to compare the results.
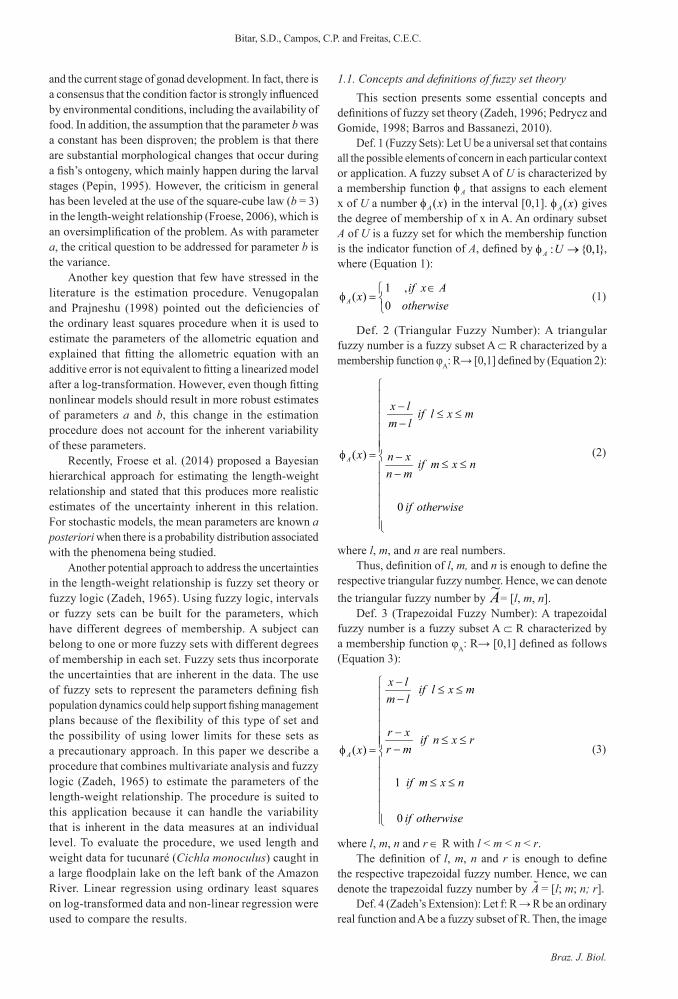
1.1. Concepts and definitions of fuzzy set theoryThis section presents some essential concepts and
definitions of fuzzy set theory (Zadeh, 1996; Pedrycz and Gomide, 1998; Barros and Bassanezi, 2010).
Def. 1 (Fuzzy Sets): Let U be a universal set that contains all the possible elements of concern in each particular context or application. A fuzzy subset A of U is characterized by a membership function Aφ that assigns to each element x of U a number ( )A xφ in the interval [0,1]. ( )A xφ gives the degree of membership of x in A. An ordinary subset A of U is a fuzzy set for which the membership function is the indicator function of A, defined by : {0,1}A Uφ → , where (Equation 1):
1 , ( )
0A
if x Ax
otherwise∈
φ =
(1)
Def. 2 (Triangular Fuzzy Number): A triangular fuzzy number is a fuzzy subset A ⊂ R characterized by a membership function φA: R→ [0,1] defined by (Equation 2):
( )
0
A
x l if l x mm l
x n x if m x nn m
if otherwise
− ≤ ≤ −φ = −
≤ ≤ −
(2)
where l, m, and n are real numbers.Thus, definition of l, m, and n is enough to define the
respective triangular fuzzy number. Hence, we can denote the triangular fuzzy number by A~= [l, m, n].
Def. 3 (Trapezoidal Fuzzy Number): A trapezoidal fuzzy number is a fuzzy subset A ⊂ R characterized by a membership function φA: R→ [0,1] defined as follows (Equation 3):
( )
1
0
A
x l if l x mm l
r x if n x rr mx
if m x n
if otherwise
− ≤ ≤ − − ≤ ≤ −φ =
≤ ≤
(3)
where l, m, n and r ∈ R with l < m < n < r.The definition of l, m, n and r is enough to define
the respective trapezoidal fuzzy number. Hence, we can denote the trapezoidal fuzzy number by A = [l; m; n; r].
Def. 4 (Zadeh’s Extension): Let f: R → R be an ordinary real function and A be a fuzzy subset of R. Then, the image

Braz. J. Biol. 3
Fuzzy logic and the weight-length relationship
3
of the fuzzy set A by the function f is the fuzzy subset B of R whose membership function is defined by (Equation 4):
{ }max ( ) , { ; ( )}( )
0A
Bx if x y f x
x if otherwise
φ = ≠ ϕφ =
(4)
Def. 5 (Support of Fuzzy Set): Let A ⊂ U be a fuzzy set of U defined by the membership function
]1,0[: →UAϕ . The support set of A is the crisp set of U defined by (Equation 5):
( ) { } ; ( ) 0 Axsuppor Ut A xφ= ∈ > (5)
Def. 6 (α-cut): Let A be a fuzzy set A in U defined by its membership function φA and α ∈ [0,1]. The α-level set of a fuzzy set A, which is denoted by , is defined as an ordinary set for which the degree of the membership function exceeds the level α (Equation 6):
[ ] { } ; ( ) AA x U xα = ∈ φ ≥ α (6)
1.2. Fuzzy rule-based systemA fuzzy inference system consists of four essential
parts: an input variables processor (fuzzificator), a system of propositional rules such as ‘if’ and ‘then’, an inference machine and an output processor (defuzzificator). The fuzzificator converts the input variables into fuzzy sets associated with the respective universe of speech. The system of propositional rules contains all the linguistic values suggested by experts, which are the support for the rules that will relate the rule antecedents (if) to their consequents (then). Conceptually, the fuzzy system is intended to collect the experts’ knowledge and convert the fuzzy set into a number using the defuzzificator. In this study, the rule antecedents were standard length and total weight, and each variable was classified into one of six linguistic values. One fuzzy set was attributed to each linguistic value.
2. Material and Methods
2.1. DatasetThe Cichla monoculus whose data we used were caught
in the Lago Grande (Amazonas, Brazil), which is located on the left bank of the lower stretch of the Rio Solimões. This large lake is part of a floodplain characterized by a marked annual hydrologic cycle. The fish were caught from boats in the Panairzinha harbor, where we collected measures of standard length and total weight every month between February 2007 and January 2008. C. monoculus is an important natural resource in many regions of South America because of its natural abundance, sporting nature and high-quality flesh (Jepsen et al., 1999). The genus Cichla is widely distributed in the Amazon, Tocantins and Orinoco river basins as well as in smaller rivers that drain the Guyana Plateau toward the Atlantic Ocean (Kullander and Ferreira, 2006).
2.2. Data analysisThe data set was analyzed using three distinct procedures.
First, we employed linear regression by ordinary least squares estimation on the log-transformed weight and length data. Then we used the Levenberg-Marquardt iteration algorithm to perform a non-linear estimation on the original data. We calculated confidence intervals for all of the estimated parameters. R software (R CORE TEAM, 2013) was used for these analyses. The third approach combined multivariate analysis and fuzzy logic. We started with a cluster analysis of the dataset of weights and lengths of the fish examined to identify similarities in terms of their maturity status, as this species has a specific interval for its reproductive activity, which occurs between December and March (Corrêa, 1998). Our hypothesis was that fish with the same maturity status might exhibit similarities that could be identified with the metrics.
2.3. Determination of the fuzzy sets a and b
2.3.1. Fuzzy set b
Using the square-cube law as a starting point, we assumed that the parameter b oscillates around a value of 3. Values of b smaller than 3 are typical for fishes whose body growth is dominated by their weight. In contrast, values of b higher than 3 are typical for fishes whose length dominates their body growth. Le Cren (1951) proposed that the possible values of b are between 2.5 and 4.0. However, Royce (1972) argued for an interval between 2.0 and 3.5.
The phrase “at around” can be modeled by a triangular fuzzy number (Barros and Bassanezi, 2010), such as b = [b1; b2; b3]. Thus, we assumed that b2 equals 3, as in the square-cube law, and the values of b1 and b3 were estimated as b2 - ε and b2 + ε, respectively, where ε > 0 is associated with the variability of the parameter b suggested by the expert. In this work we assumed b1 = 2.7 and b3 = 3.3 (±10% around b2).
2.3.2. Fuzzy set ãWe used the Zadeh extension to estimate the fuzzy set
a for each cluster Gj as follows:Let (Wj, Lj) be the coordinates of the center of the
cluster that belongs to the group Gj, j ∈ {1,2,3,4,5,6}. Let Hj ⊂ R2 be the set composed of the possible ordered pairs (b, a) of the allometric parameters such that , where Hj is defined by Hj = {(b, a) ∈ R2 | Wj = aLj
b}The set Hj can be interpreted as a curve in R2 that is
located in the first quadrant of the Cartesian coordinate system.
We used Hj to explicitly define a as a function of b
since jbj
Wa
L= .
This equation indicates that the parameter a can be estimated from an estimated value for b.
Let with ( ) jj b
j
Wf b
L= ; then fj is a function with values
pertaining to the R set and a graph shape coincident with Hj. If b is defined as a fuzzy set b, then (4) and fj can be

Braz. J. Biol. 4
Bitar, S.D., Campos, C.P. and Freitas, C.E.C.
4
employed to estimate the set a . Using this procedure, we are able to obtain a fuzzy set a j associated with cluster Gj, which is the distribution of possible values of the parameter a in this cluster.
To construct a fuzzy inference system we used the classification provided by the specialist (Table 1) and trapezoidal fuzzy numbers. The fuzzy sets were then used to determine the linguistic values associated with the linguistic variables standard length and total weight. Each fuzzy set associated with the corresponding linguistic term is a trapezoidal fuzzy number. Based on the experience of the experts, the term sets (TS (L) and TS (W)) of the
linguistic variables (standard length and total weight) were built (Table 1).
Using the K-means method, six clusters G1, G2, G3, G4, G5 and G6 were identified (Figure 1). This number of clusters was chosen using the minimum standard deviation within each group as criterion (Table 2). We performed group fuzzification to determine which data fitted into each group. In this procedure each variable (i.e., weight and length) inside each cluster is fuzzified using trapezoidal fuzzy numbers. Maximum membership was attributed to the interval with the highest frequency of observed data in each cluster (Table 3).
Table 1. Linguistic value “labels” and their respective fuzzy sets for Cichla monoculus (Amazon Basin, Brazil).Standard Length (cm) Total Weight (g)
Label Fuzzy Set TS (L) Label Fuzzy Set TS (W)Very small (Vsm) [13; 19; 24; 25] Very slight (Vsl) [145; 150; 300; 301]Small (Sm) [24; 25; 29; 30] Slight (Sl) [300; 301; 575; 576]Medium (Md) [29; 30; 35; 36] Fairly slight (Fs) [575; 576; 950; 956]Big (B) [35; 36; 40; 41] Heavy (H) [950; 956; 1400; 1401]Very big (Vb) [40; 41; 45; 46] Very heavy (Vh) [1400; 1401; 1950; 1951]Very very big (Vvb) [45; 46; 51; 55] Very very heavy (Vvh) [1950; 1951; 3120; 3125]
Table 2. Coordinates of the center of mass for each cluster identified using the k-means method on Cichla monoculus length-weight data.
Variable Cluster 1 Cluster 2 Cluster 3 Cluster 4 Cluster 5 Cluster 6Weight (g) 641.98 384.06 1018.61 259.58 802.32 508.06Standard length (cm) 30.97 26.02 36.03 22.79 33.26 28.65
Figure 1. Clusters of measures identified by the k-means method for Cichla monoculus length-weight data.
Table 3. Fuzzy sets for the variables total weight (φTW) and standard length (φSL) for Cichla monoculus.
Cluster j Standard Length (ϕ jSL) Total Weight (ϕ j
TW)1 [27; 29; 32; 34] [500; 555; 715; 800]2 [22; 25; 27.5; 30] [290; 325; 442; 520]3 [32; 34.4; 37.2; 50] [800; 912; 1137.5; 3500]4 [15; 22; 24.4; 26] [120; 199.5; 332; 400]5 [28; 31.6; 35.2; 38] [600; 715.4; 874.4; 1000]6 [26; 27.8; 30.2; 33] [380; 455; 591; 640]

Braz. J. Biol. 5
Fuzzy logic and the weight-length relationship
5
The process by which the IF-THEN rules used in the inference system were extracted consisted of determining a relationship between the variables standard length and total weight and the fuzzy set a j for the group Gj. Because of its simplicity, the Mamdani method was used to build the fuzzy inference system (Pedrycz and Gomide, 1998). The OR expression was modeled by the maximum operator and the AND expression and its consequent (then) by the minimum operator. First, the fish in each cluster were classified according to linguistic values. Then the number of elements in the cluster Gj was denoted #Gj. For each k, 1 # jk G≤ ≤ , there were ( )j jL k G∈ , the kth element of cluster Gj. The procedure to classify each fish was:
(i) If Ljk =( ,k kj jp c ) denotes the kth element of group j,
then to identify the linguistic term activated, the degree of membership of the linguistic terms in each fuzzy set is calculated. The fuzzy set with the highest membership then serves to indicate which linguistic term is activated.
However, this table generated ambiguous outputs, which are rules with the same rule antecedents and different consequents. It was therefore decided to follow Wang (1997), who suggested using indices as decision criteria for tiebreaks. Let (W, L) be a pair of values of weight and length for a hypothetical fish associated with a cluster Gj. Then the index of adherence is given by (Equation 7):
( , ) min( ( ), ( ))j
j jG TW SLI W L W L= φ φ (7)
And the relationship between fuzzy sets ( )iT Wφ and
( )iT SLφ activated in the ith IF-THEN rule on parameters
(W, L) can be estimated as (Equation 8):
( ) ( )( , ) min( ( ), ( ))i ii TS W TS LI W L W L= φ φ (8)
It follows from Equation 7 that the greater this index, the greater the degree of membership of the individual in group Gj. Here, j
TWφ and jSLφ are the membership functions
for the total weight and standard length, respectively, in group Gj.
Later the weight wi of each rule set for each group Gj was defined as
( , ) max { ( , ) . ( , )}
jj
i G iw l Gw I w l I w l
∈= .
This procedure was used to obtain a final pool of rules based on the value of as criterion. If there were two or more rules to define the cluster to which the fish belonged, the prevalent rule was that with highest value of . The final rules are shown in Table 4, where 0 indicates a non-selected rule and 1 a selected rule.
Finally, we employed the inference machine to estimate the fuzzy set for the possible values of a exploring a sub-sample with 5% (n = 60) of the original data extracted at random. The defuzzification procedure to estimate was the center of gravity, which exhibits steady topological properties of continuity (i.e., small changes in the fuzzy set will have a small effect on the estimate ) (Wang, 1997).
Table 4. Selected and non-selected set rules after use of the index of adherence.
Cluster Total Weight Standard Length wj Sel.Vsl Sl Fs H Vh Vvh Vsm Sm Md B Vb Vvb
1X X 0.8223 0
X X 0.9855 1X X 0.8385 0
2X X 0.9538 1X X 0.5488 0
3
X X 0.8333 1X X 0.9601 1
X X 0.8766 1X X 0.9481 0
X X 0.7821 1X X 0.5102 1
X X 0.0766 1X X 0.6102 1
4X X 0.8488 1
X X 0.9265 1X X 0.3381 1
5X X 0.8826 0X X 0.5432 0
6X X 0.8895 1
X X 0.7957 0X X 0.9319 1
Vsl – Very slight; Sl – Slight; Fs – Fairly slight; H – Heavy; Vh – Very heavy; Vvh – Very very heavy; Vsm – Very small; Sm – Small; Md – Medium; B – Big; Vb – Very big; Vvb – Very very big.

Braz. J. Biol. 6
Bitar, S.D., Campos, C.P. and Freitas, C.E.C.
6
3. Results
The condition factor estimated using log-transformed weight and length data in a linear model was substantially different from the estimates obtained with untransformed data using a non-linear model (Table 5). This difference was of approximately one order of magnitude. In contrast, the estimates of the allometric coefficients for these two models were quite similar and consistently smaller than 3, indicating allometric growth (Table 5).
When simulated using the sub-sample of 60 individuals, the parameter a showed highest variability for fish with a total weight of less than 400 g and was almost monotonic for fish with a total weight of between 625 and 900 g (Figure 2). After defuzzification, the parameter oscillated around a limit value of 0.032, which is quite similar to
the values obtained by non-linear estimation (Table 5). Similarly, a was more stable for fish longer than 34 cm (Figure 3). This finding, together with the dynamics of this parameter modeled as a function of total weight, confirms that the condition factor tends to vary less in larger fish.
4. Discussion
Our results indicate that the procedure for estimating the parameters of the length-weight relationship based on identification of the centers of maximum of the clusters in a scatter-plot generated with length and weight data series is a good initial approach and yields estimates that differ only slightly from those obtained by non-linear models (Table 5).
Table 5. Parameters estimated using linear and non-linear models.
Model Parameter Estimate Confidence Interval
Linear ab
0.21612.9082
0.2059 ----- 0.22682.8747 ----- 2.9416
Non-linear ab
0.03492.8592
0.0306 ----- 0.03922.8232 ----- 2.8952
Figure 2. Parameter a as a function of total weight, showing the variance around the median.
Figure 3. Parameter a as a function of standard length, showing the variance around the median.

Braz. J. Biol. 7
Fuzzy logic and the weight-length relationship
7
The use of least squares ordinary regression on log-transformed data to estimate the parameters of the length-weight relationship has been criticized recently (Venugopalan and Prajneshu, 1998; Robertis and Williams, 2008; Packard, 2009; Xiao et al., 2011). An important difference between linear and non-linear models relates to the assumptions about the scale on which random errors are distributed (Seber and Wild, 2003; Chartejee and Hadi, 2006). Because log y = f(log x) + ε, a log-transformation of the dataset lets us assume that the error is additive on a logarithmic scale. In contrast, in a non-linear model such as y = f(x) + ε, the error is additive on an arithmetic scale. As pointed out by Xiao et al. (2011), for a single dataset, both of these assumptions cannot be correct. Contrary to Venugopalan and Prajneshu (1998), Xiao et al. (2011) argue that the choice of method depends on the error distribution and that future analyses of the power law should be preceded by explicit analyses of the underlying error structure. Indeed, alternative approaches would be very useful for datasets with indeterminate error structures.
Nevertheless, the main advantage of fuzzy logic is the interval that is generated by the support of the fuzzy set obtained using the inference system. By comparing the estimates obtained from the support of fuzzy set a calculated by the inference system, we can see that the estimates that were previously made by other authors are included in the intervals with higher frequency (Figures 2 and 3). For example, Gomiero and Braga (2003) used the least squares ordinary model to estimate the weight-length relationship for two Cichla species caught in an artificial reservoir. They found values of 0.0063 and 0.007 for C. monoculus males and females and 0.0059 and 0.0053 for C. cf. ocellaris males and females, respectively. Holley et al. (2008) estimated that the parameter a is equal to 0.0101 for Cichla temensis caught in the middle of the Rio Negro (Amazonas, Brazil). They used the least squares method on log-transformed data. However, Gomiero et al. (2008) also used least squares ordinary regression and found that the smallest values for the parameter a were those for Cichla kelberi introduced into an artificial lake in Southeast Brazil. In fact, the estimates in the study by Gomiero et al. (2008) have an important source of bias because the species studied was introduced into the environment and there is no information about its subsequent adaptations.
There are no studies on the variability of the parameter a as a function of fish size for the Cichla species. However, a high variability of mean weight-at-age with environmental conditions was observed for cod (Gadus morhua) and was especially apparent in fish that were less than seven years old (Anon, 1994), reflecting the higher variability observed in parameter a for the smallest fish recorded in our data. Jorgensen (1992) related long-term changes in the growth of immature Artic cod (Gadus morhua) to an index of food availability and temperature fluctuations. Because this parameter can be used as an indicator of the fish’s welfare and because peacock bass is a top predator, it is possible that it is more difficult for peacock bass to find prey of an appropriate size when it is younger and smaller.
We believe that, in addition to the fact that it yields similar results to those of earlier studies, the most important advantages of our approach are those features that are inherent to fuzzy logic: (i) the estimates obtained directly by identifying clusters of length-weight pairs, (ii) the inclusion of the consulted expert’s opinion, which was incorporated as a semantic sentence in the estimation procedure and (iii) the generation of intervals for the parameters of interest. These features are interrelated as one is a consequence of the other. Furthermore, we hypothesize that these features could be used for the efficient analysis of data with non-linear allometry (Knell, 2009); indeed, this phenomenon has already been described for the relationships between the size of a particular body part or organ and the size of the whole organism. Packard (2012) called the phenomenon “non-loglinear allometry” and pointed out that the confounding effects of transformations by logarithms are common to all applications of allometric methods. This phenomenon can arise when the allometric exponent b is a continuously changing function of body size or when it changes abruptly (Packard, 2012). In both cases, the fuzzy logic approach could identify these changes and fit values for the parameters a and b that are more accurate in each stage (cluster).
Acknowledgements
This research was supported by CNPq grant no. 557105 and PIATAM Project/FINEP grant no. 0.1.06.1223.00.
References
ANON, M.S., 1994. Report of the North-Western Working Group. Denmark: ICES. ICES CM Documents, no. 18.
BARROS, L.C. and BASSANEZI, R.C.,2010. Tópicos em lógica fuzzy e biomatemática. 2nd ed. Campinas: UNICAMP/IMECC. 344 p.
CHARTEJEE, S. and HADI, A.S., 2006. Regression analysis by examples. 4th ed. New Jersey: Wiley Interscience. 383 p.
CLARK, F.N., 1928. The weight-length relationship of the California sardine (Sardinacaeurulea) at San Pedro. Fish Bulletin, vol. 12, pp. 1-59.
CORREA, R.O., 1998. Estudo da idade e crescimento de Cichla monoculus, Spix, 1831 (Perciformes: Cichlidae) na Amazônia Central, pela análise de estruturas duras. Manaus: Instituto Nacional de Pesquisas da Amazônia, Universidade Federal do Amazonas, 70 p. Masters Dissertation.
FROESE, R., 2006. Cube law, condition factor and weight-length relationships: history, meta-analysis and recommendations. Journal of Applied Ichthyology, vol. 22, no. 4, pp. 241-253. http://dx.doi.org/10.1111/j.1439-0426.2006.00805.x.
FROESE, R., THORSON, J.T. and REYES JUNIOR, R.B., 2014. A Bayesian approach for estimating length-weight relationships in fishes. Journal of Applied Ichthyology, vol. 30, no. 1, pp. 78-85. http://dx.doi.org/10.1111/jai.12299.
Braz. J. Biol. 8
Bitar, S.D., Campos, C.P. and Freitas, C.E.C.
8
FULTON, T.W., 1904. The rate of growth of fishes. Twenty-second Annual Report, Part III. Edinburgh: Fisheries Board of Scotland, pp. 141-241.
GOMIERO, L.M. and BRAGA, F.M.S., 2003. Relação peso x comprimento e fator de condição para Cichla cf. ocellaris e Cichla monoculus (Perciformes, Cichlidae) no Reservatório de Volta Grande, Rio Grande – MG/SP. Acta Scientiarum: Biological Sciences, vol. 25, pp. 79-86.
GOMIERO, L.M., VILLARES JUNIOR, G.A. and NAOUS, F., 2008. Relação peso x comprimento e fator de condição de Cichla kelberi (Perciformes, Cichlidae) introduzidos em um lago artificial no Sudeste Brasileiro. Acta Scientiarum: Biological Sciences, vol. 30, pp. 173-178.
HOLLEY, M.H., MACEINA, M.J., THOMÉ-SOUZA, M. and FORSBERG, B.R., 2008. Analysis of the trophy sport fishery for the speckled peacock bass in the Rio Negro River, Brazil. Fisheries Management and Ecology, vol. 15, no. 2, pp. 93-98. http://dx.doi.org/10.1111/j.1365-2400.2007.00587.x.
JEPSEN, D.B., WINEMILLER, K.O., TAPHORN, D.C. and OLARTE, D.R., 1999. Age structure and growth of peacock cichlids from rivers and reservoirs of Venezuela. Journal of Fish Biology, vol. 55, no. 2, pp. 433-450. http://dx.doi.org/10.1111/j.1095-8649.1999.tb00689.x.
JORGENSEN, T., 1992. Long-term changes in growth of North-East Arctic cod (Gadus morhua) and some environmental influences. ICES Journal of Marine Science, vol. 49, no. 3, pp. 263-277. http://dx.doi.org/10.1093/icesjms/49.3.263.
KEYS, A.B., 1928. The weight-length relationship in fishes. Proceedings of the National Academy of Sciences of the United States of America, vol. 14, no. 12, pp. 922-925. http://dx.doi.org/10.1073/pnas.14.12.922. PMid:16587425.
KNELL, R.J., 2009. On the analysis of non-linear allometries. Ecological Entomology, vol. 34, no. 1, pp. 1-11. http://dx.doi.org/10.1111/j.1365-2311.2008.01022.x.
KULLANDER, S.O. and FERREIRA, E.J.G., 2006. A review of the South American cichlid genus Cichla, with descriptions of nine new species (Teleostei: Cichlidae). Ichthyological Exploration of Freshwaters, vol. 17, pp. 289-398.
LE CREN, E.D., 1951. The length-weight relationship amd seasonal cycle in gonad wight and condition in the perch (Percafluviatilis). Journal of Animal Ecology, vol. 20, no. 2, pp. 201-219. http://dx.doi.org/10.2307/1540.
PACKARD, G.C., 2009. On the use of logarithmic transformations in allometric analyses. Journal of Theoretical Biology, vol. 257, no. 3, pp. 515-518, discussion 519-521. http://dx.doi.org/10.1016/j.jtbi.2008.10.016. PMid:19014956.
PACKARD, G.C., 2012. Is non-loglinear allometry a statistical artifact? Biological Journal of the Linnean Society, vol. 107, no. 4, pp. 764-773. http://dx.doi.org/10.1111/j.1095-8312.2012.01995.x.
PEDRYCZ, W. and GOMIDE, F., 1998. An introduction to fuzzy sets: analysis and design. Massachusets: The MIT Press.
PEPIN, P., 1995. An analysis of the length-weight relationshipof larval fish: limitations of the general allometric model. U.S. National Marine Fisheries Service. Fish Bulletin, vol. 93, pp. 419-426.
R CORE TEAM, 2013. R: a language and environment for statistical computing. R version 2.15.3. Vienna: R Foundation for Statistical Computing.
ROBERTIS, A. and WILLIAMS, K., 2008. Weight-Length relationships in fisheries studies: the standard allometric model should be applied with caution. Transactions of the American Fisheries Society, vol. 137, no. 3, pp. 707-719. http://dx.doi.org/10.1577/T07-124.1.
ROYCE, W.F., 1972. Introduction to fishery science. New York: Academic Press. 351 p.
SEBER, G.A.F. and WILD, C.J., 2003. Non linear regression. New Jersey: Wiley Interscience. 775 p. http://dx.doi.org/10.1002/9780471722199.
VENUGOPALAN, R., and PRAJNESHU, 1998. On nonlinear procedure for obtaining length-weight relationship. The Indian Journal of Animal Sciences, vol. 68, pp. 70-72.
WANG, L.X., 1997. A course in fuzzy systems and control. New Jersey: Prentice Hall.
XIAO, X., WHITE, E.P., HOOTEN, M.B. and DURHAM, S.L., 2011. On the use of log-transformation vs. non-linear regression for analyzing biological power laws. Ecology, vol. 92, no. 10, pp. 1887-1894. http://dx.doi.org/10.1890/11-0538.1. PMid:22073779.
ZADEH, L.A., 1965. Fuzzy sets. Information and Control, vol. 8, no. 3, pp. 338-353. http://dx.doi.org/10.1016/S0019-9958(65)90241-X.
ZADEH, L.A., 1996. Fuzzy logic = computing with words. IEEE Transactions on Fuzzy Systems, vol. 4, no. 2, pp. 103-111. http://dx.doi.org/10.1109/91.493904.