
Applying computational tools to predict gaze...
21
Applying computational tools to predict gaze direction in interactive visual environments ROBERT J. PETERS Department of Computer Science University of Southern California and LAURENT ITTI Departments of Computer Science, Neuroscience and Psychology University of Southern California Future interactive virtual environments will be “attention-aware,” capable of predicting, react- ing to, and ultimately influencing the visual attention of their human operators. Before such environments can be realized, it is necessary to operationalize our understanding of the relevant aspects of visual perception, in the form of fully-automated computational heuristics that can effi- ciently identify locations that would attract human gaze in complex dynamic environments. One promising approach to designing such heuristics draws on ideas from computational neuroscience. We compared several neurobiologically-inspired heuristics with eye movement recordings from five observers playing video games, and found that heuristics which detect outliers from the global dis- tribution of visual features were better predictors of human gaze than were purely local heuristics. Heuristics sensitive to dynamic events performed best overall. Further, heuristic prediction power differed more between games than between different human observers. While other factors clearly also influence eye position, our findings suggest that simple neurally-inspired algorithmic methods can account for a significant portion of human gaze behavior in a naturalistic, interactive setting. These algorithms may be useful in the implementation of interactive virtual environments, both to predict the cognitive state of human operators, as well as to effectively endow virtual agents in the system with human-like visual behavior. Categories and Subject Descriptors: H.1.2 [Models and Principles]: User/Machine Systems— Software Psychology; I.2.10 [Artificial Intelligence]: Vision and Scene Understanding—Percep- tual Reasoning; I.3.3 [Computer Graphics]: Picture/Image Generation—Viewing Algorithms General Terms: Algorithms, Experimentation, Human factors Additional Key Words and Phrases: active vision, computational modeling, eye movements, im- mersive environments, video games, visual attention 1. INTRODUCTION How do we decide where to look? The advent of convenient eye-tracking systems has opened the door to a greater understanding of the relationship between eye Permission to make digital/hard copy of all or part of this material without fee for personal or classroom use provided that the copies are not made or distributed for profit or commercial advantage, the ACM copyright/server notice, the title of the publication, and its date appear, and notice is given that copying is by permission of the ACM, Inc. To copy otherwise, to republish, to post on servers, or to redistribute to lists requires prior specific permission and/or a fee. c 2007 ACM 0000-0000/2007/0000-0001 $5.00 ACM Transactions on Applied Perception, Vol. in press, No. preprint, May 2007, Pages 1–21.
Transcript of Applying computational tools to predict gaze...
Applying computational tools to predict gaze
direction in interactive visual environments
ROBERT J. PETERS
Department of Computer Science
University of Southern California
and
LAURENT ITTI
Departments of Computer Science, Neuroscience and Psychology
University of Southern California
Future interactive virtual environments will be “attention-aware,” capable of predicting, react-ing to, and ultimately influencing the visual attention of their human operators. Before suchenvironments can be realized, it is necessary to operationalize our understanding of the relevantaspects of visual perception, in the form of fully-automated computational heuristics that can effi-
ciently identify locations that would attract human gaze in complex dynamic environments. Onepromising approach to designing such heuristics draws on ideas from computational neuroscience.We compared several neurobiologically-inspired heuristics with eye movement recordings from five
observers playing video games, and found that heuristics which detect outliers from the global dis-tribution of visual features were better predictors of human gaze than were purely local heuristics.Heuristics sensitive to dynamic events performed best overall. Further, heuristic prediction powerdiffered more between games than between different human observers. While other factors clearly
also influence eye position, our findings suggest that simple neurally-inspired algorithmic methodscan account for a significant portion of human gaze behavior in a naturalistic, interactive setting.These algorithms may be useful in the implementation of interactive virtual environments, both
to predict the cognitive state of human operators, as well as to effectively endow virtual agents inthe system with human-like visual behavior.
Categories and Subject Descriptors: H.1.2 [Models and Principles]: User/Machine Systems—Software Psychology; I.2.10 [Artificial Intelligence]: Vision and Scene Understanding—Percep-
tual Reasoning; I.3.3 [Computer Graphics]: Picture/Image Generation—Viewing Algorithms
General Terms: Algorithms, Experimentation, Human factors
Additional Key Words and Phrases: active vision, computational modeling, eye movements, im-mersive environments, video games, visual attention
1. INTRODUCTION
How do we decide where to look? The advent of convenient eye-tracking systemshas opened the door to a greater understanding of the relationship between eye
Permission to make digital/hard copy of all or part of this material without fee for personalor classroom use provided that the copies are not made or distributed for profit or commercial
advantage, the ACM copyright/server notice, the title of the publication, and its date appear, andnotice is given that copying is by permission of the ACM, Inc. To copy otherwise, to republish,to post on servers, or to redistribute to lists requires prior specific permission and/or a fee.c© 2007 ACM 0000-0000/2007/0000-0001 $5.00
ACM Transactions on Applied Perception, Vol. in press, No. preprint, May 2007, Pages 1–21.
2 · R.J. Peters and L. Itti
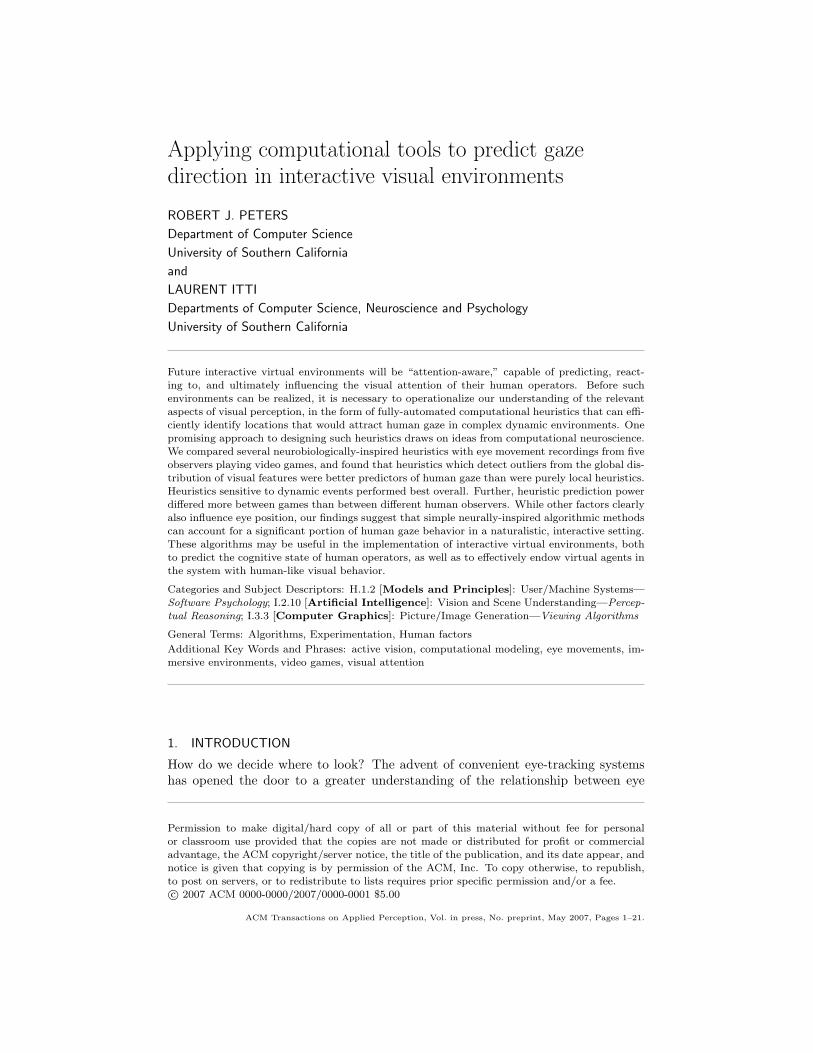
Fig. 1. Four game frames with the eye position of one human (small cyan square, arrows) gazing
back and forth between Mario and an adversary in a video game console system. Computationalimage-processing heuristics drawn from biological vision could help such systems predict and adaptto the behavior of their human operators.
movements and visual perception. At the same time, ever-increasing computerpower has allowed our understanding of visual perception to be applied in progres-sively more powerful computational models of visual processing. Several nascentapplication domains will rely heavily on such models in the future, including: in-teractive computer graphics environments (“virtual reality” or video games, as inFigure 1), both in entertainment as well as more sober applications such as flightand driving simulators; visual prosthetic devices that will enhance the abilities forpeople with normal and impaired vision alike; machine vision systems that willautomate mundane tasks, or provide a layer of redundancy for people performingsafety-critical visual tasks.
One foundation for such advances will be a thorough understanding of the rela-tionship between visual cognition and eye movements. Recent behavioral studieshave shown that this relationship can be quite precise during the execution of avisually-guided behavioral task: the vast majority of fixations are directed to task-relevant locations, and fixations are coupled in a tight temporal relationship withother task-related behaviors such as reaching and grasping [Hayhoe 2004]. Further-more, eye movements often provide a clear window into the mind of an observer; itis often possible to infer what a subject had in mind as he or she made a particulareye movement. For example, in a “block copying” task, where subjects had to repli-cate a physical assemblage made of elementary building blocks [Ballard et al. 1995],the observers’ algorithm for completing the task was revealed by their pattern ofeye movements: first select a target block in the model by fixating it, then find amatching block in the resource pool, then revisit the model to verify the block’sposition, then fixate the workspace to place the new block in the corresponding po-sition. Other studies have used naturalistic interactive or immersive environmentsto give high-level accounts of gaze behavior in terms of objects, agents, “gist,”and short-term memory [Yarbus 1967; Henderson and Hollingworth 1999; Rensink2000; Land and Hayhoe 2001; Sodhi et al. 2002; Hayhoe et al. 2003; Bailensonand Yee 2005], to describe, for example, how task-relevant information guides eyemovements while subjects make a sandwich [Land and Hayhoe 2001; Hayhoe et al.2003] or how distractions such as setting the radio or answering a phone affect eyemovements while driving [Sodhi et al. 2002].
While such perceptual studies have provided important constraints regardinggoal-oriented high-level vision, additional work is needed to translate these descrip-tive results into fully-automated computational models that can be used in theapplication domains mentioned above. That is, although the block copying task
ACM Transactions on Applied Perception, Vol. in press, No. preprint, May 2007.
Computational mechanisms of gaze direction · 3
13()0�8=4)
78-19097�8=4) UYEPMXEXMZI UYERXMXEXMZI
6ES�IX�EP������2ENIQRMO��+IMWPIV������2EZEPTEOOEQ��-XXM�����
8VIMWQER��+IPEHI������;SPJI��,SVS[MX^�����
WXEXMG��EVXMJMGMEP
�KEFSV�TEXGLIW�WIEVGL�EVVE]W
4VMZMXIVE��7XEVO������6IMREKIP��>EHSV������
4EVOLYVWX��0E[��2MIFYV������8SVVEPFE������4IXIVW�IX�EP������
2EZEPTEOOEQ��-XXM������4SQTPYR�����
=EVFYW������4EVOIV������
1ERRER��6YHHSGO��;SSHMRK������6E]RIV������:SKI�����
WXEXMG��REXYVEP
�TLSXSKVETLW
'EVQM��-XXM������-XXM��&EPHM�����
8SWM��1IGEGGM��4EWUYEP������1E]��(IER��&EVREVH������4IPM��+SPHWXIMR��;SSHW�����
H]REQMG��REXYVEP
�QSZMIW��GEVXSSRW
XLMW�WXYH]0ERH��1IRRMI��6YWXIH������0ERH��,E]LSI������,E]LSI�IX�EP������,E]LSI�IX�EP�����
MRXIVEGXMZI��REXYVEP
�ZMHIS�KEQIW��JP]MRK�SVHVMZMRK�WMQYPEXSVW�
ZMVXYEP�VIEPMX]��EGXYEP�VIEPMX]
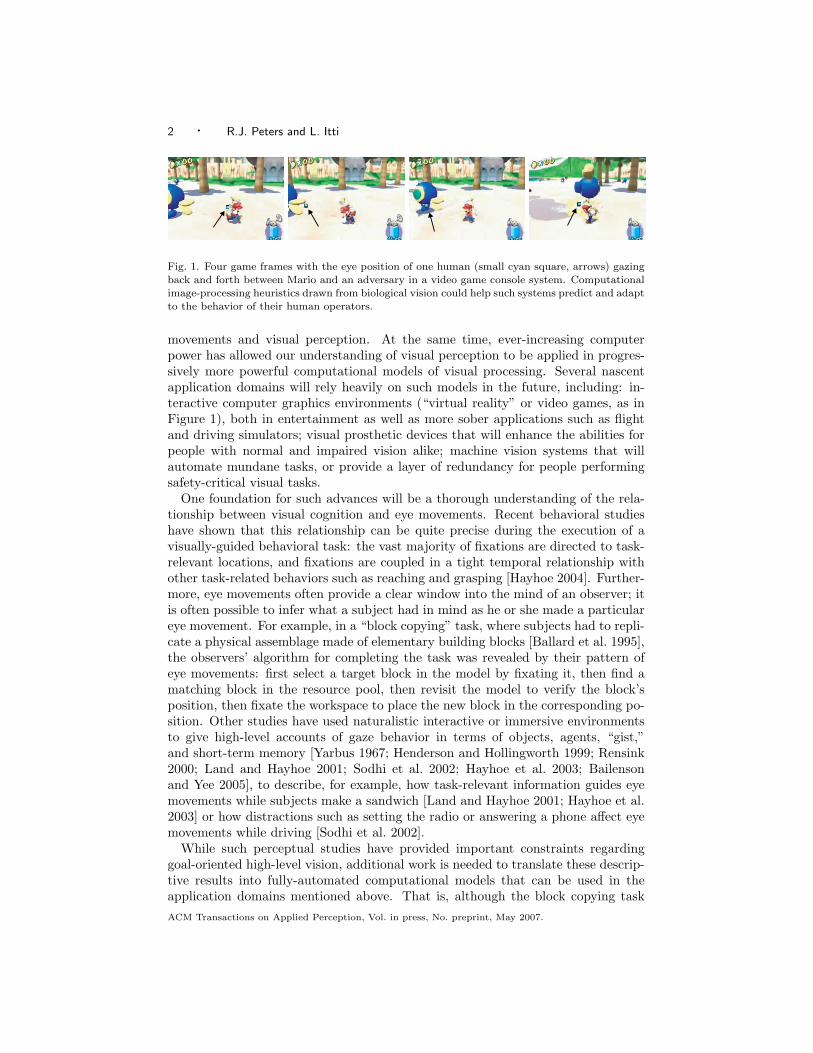
Fig. 2. An overview of experimental approaches to gaze behavior. Studies can be roughly catego-
rized according to the type of stimuli (rows), and according to the type of model used to accountfor observed gaze behavior (columns). The current study represents an entry into the lower-right
corner of the table, using quantitative models to predict gaze behavior with naturalistic dynamicstimuli and an interactive task.
reveals observers’ algorithm for completing the task, it does so only in the high-levellanguage of “workspace” and “blocks” and “matching.” In order for a machine vi-sion system to replicate human observers’ ability to understand, locate, and exploitsuch visual concepts, we need a “compiler” to translate such high-level languageinto the assembly language of vision—that is, low-level computations on a time-varying array of raw pixels. Unfortunately, a general computational solution to thistask is tantamount to the “hard problem” of computer vision.
For that reason, computational models of eye movements to date have reliedon simpler stimuli and tasks to demonstrate low-level regularities in eye move-ment behavior. For example, it has been shown that humans preferentially gazetowards regions with: multiple superimposed orientations (corners or crosses) [Zet-zsche et al. 1998; Privitera and Stark 2000]; above-average spatial contrast (varianceof pixel intensities) [Reinagel and Zador 1999], entropy [Privitera and Stark 2000],and texture contrast [Parkhurst and Niebur 2004]; and above-average “saliency”[Parkhurst et al. 2002; Peters et al. 2005] as computed by a biologically-inspiredmodel of bottom-up attention [Itti et al. 1998]. Yet these results are typicallyobtained with static scenes (still images) and address only low-level, bottom-upimage properties. Adding a temporal dimension and the realism of natural inter-active tasks brings a number of complications in trying to realistically predict gazetargets with a computational model.
Figure 2 shows one way of categorizing existing research on gaze behavior alongtwo dimensions. First, the type of stimuli used can vary from artificial “laboratory”stimuli to naturalistic three-dimensional environments; second, the type of “model”used to explain the behavior can be either qualitative (offering an explanation of
ACM Transactions on Applied Perception, Vol. in press, No. preprint, May 2007.
4 · R.J. Peters and L. Itti
the behavior in high-level terms) or quantitative (explaining the behavior in termsof low-level computations performed on the raw visual input). No relative merit isascribed to the different categories; rather, research in all of the categories will beneeded to reach an eventual complete understanding of visual perception and gazebehavior. To a first approximation, research in areas toward the bottom and towardthe right of the table relies more on modern computer power—either for renderingcomplex virtual environments or for implementing complex computational models—and thus has become practical only relatively recently.
Within the framework of Figure 2, the present study is an attempt to enter newterritory for the first time: namely, to use purely computational models to predictgaze behavior in an interactive task with naturalistic, dynamic stimuli. Specifically,we chose to use several contemporary video games with simulated three-dimensionalenvironments to provide the visual input and the interactive task (Figure 3), and wecompared the recorded gaze behavior with the predictions of nine different bottom-up computational models (“heuristics”) based on low-level image features (such ascolor, intensity, and motion) and saliency. It might intuitively be expected thatvolitional top-down influences should overwhelm reflexive bottom-up influences ingaze guidance, particularly in interactive environments with natural tasks, but in-stead our results demonstrate that in fact all but one of the computational bottom-up heuristics were significantly predictive of eye position. Heuristics sensitive todynamic events were especially strong gaze predictors. Nevertheless, in this taskthere are clearly other influences on eye position that may be as strong or strongerthan bottom-up effects. Our long-range methodology is to approach the predictionof eye position itself from the bottom up: first determine what can be explainedby the simplest bottom-up models, then iteratively refine the models to accountfor residual behavior unexplained by the previous iteration. Along the way, thecomputational models will be guided by findings from other research categories inFigure 2.
2. METHODS
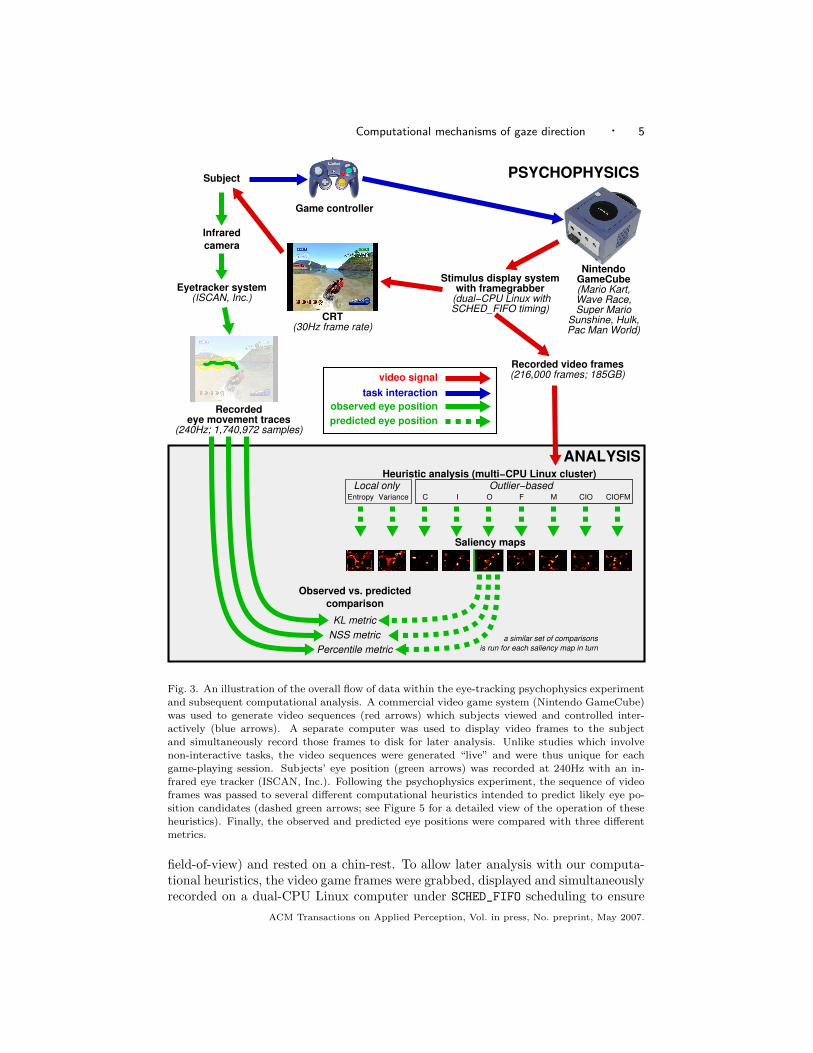
Figure 3 gives an overview of the data flow within our experiment, from the record-ing of eye movements and video frames while observers played video games, throughsubsequent analysis of the video frames by an array of computational heuristics, tofinal comparison of the predictions of the heuristics with the observed eye move-ments. Note that we use the term heuristic to refer to the various computationalmodels that predict eye movements, and use the term metric to refer to differentways of quantifying the agreement between observed eye movements and heuristicpredictions.
2.1 Eye-movement recordings
Five subjects (three male, two female) participated with informed consent, under aprotocol approved by the Institutional Review Board of the University of SouthernCalifornia. Subjects played four or five five-minute segments of off-the-shelf Nin-tendo GameCube games, including Mario Kart, Wave Race, Super Mario Sunshine,Hulk, and Pac Man World. Stimuli were presented on a 22” computer monitor (La-Cie Corp; 640×480 pixels, 75 Hz refresh, mean screen luminance 30 cd/m2, room4 cd/m2); subjects were seated at a viewing distance of 80 cm (28◦× 21◦ usable
ACM Transactions on Applied Perception, Vol. in press, No. preprint, May 2007.
Computational mechanisms of gaze direction · 5
NintendoGameCube(Mario Kart,Wave Race,Super Mario
Sunshine, Hulk,Pac Man World)
Infrared
camera
Subject
Stimulus display systemwith framegrabber
(dual−CPU Linux withSCHED_FIFO timing)
CRT(30Hz frame rate)
Eyetracker system(ISCAN, Inc.)
Recorded video frames(216,000 frames; 185GB)
Recordedeye movement traces
(240Hz; 1,740,972 samples)
Game controller
Local only Outlier−based
KL metric
NSS metric
Percentile metric
Heuristic analysis (multi−CPU Linux cluster)
Observed vs. predicted
comparison
Entropy Variance C I O F M CIO CIOFM
Saliency maps
a similar set of comparisons
is run for each saliency map in turn
video signal
observed eye position
task interaction
predicted eye position
PSYCHOPHYSICS
ANALYSIS
Fig. 3. An illustration of the overall flow of data within the eye-tracking psychophysics experiment
and subsequent computational analysis. A commercial video game system (Nintendo GameCube)was used to generate video sequences (red arrows) which subjects viewed and controlled inter-
actively (blue arrows). A separate computer was used to display video frames to the subjectand simultaneously record those frames to disk for later analysis. Unlike studies which involvenon-interactive tasks, the video sequences were generated “live” and were thus unique for eachgame-playing session. Subjects’ eye position (green arrows) was recorded at 240Hz with an in-
frared eye tracker (ISCAN, Inc.). Following the psychophysics experiment, the sequence of videoframes was passed to several different computational heuristics intended to predict likely eye po-sition candidates (dashed green arrows; see Figure 5 for a detailed view of the operation of theseheuristics). Finally, the observed and predicted eye positions were compared with three different
metrics.
field-of-view) and rested on a chin-rest. To allow later analysis with our computa-tional heuristics, the video game frames were grabbed, displayed and simultaneouslyrecorded on a dual-CPU Linux computer under SCHED_FIFO scheduling to ensure
ACM Transactions on Applied Perception, Vol. in press, No. preprint, May 2007.
6 · R.J. Peters and L. Itti
microsecond-accurate timing [Finney 2001]. Each subject’s right eye position wasrecorded at 240Hz with a hardware-based eye-tracking system (ISCAN, Inc.). Eachgame segment was preceded by a calibration sequence, in which subjects fixated aseries of points on an invisible 3×3 grid, to set up a correspondence between the eyecamera and stimulus display coordinate systems [Stampe 1993]. After calibration,subjects fixated a central cross and pressed a key to start the game play. In post-processing, 8,449 saccades of amplitude 2◦ or more were extracted from 1,740,972recorded eye position samples over 24 five-minute game-play sessions. The cor-responding 216,000 recorded video frames (about 185 GB of raw pixel data) wereprocessed on a cluster with 48 CPUs through the computational heuristics describednext.
2.2 Computational heuristics
We tested nine heuristic models for predicting gaze targets. These fall into twobroad groups, one in which only local features within small image patches areconsidered, and another in which global context is used to determine whether alocal area is unusual and thus worthy of interest. This second group of heuristics(Figures 4 and 5) can be further subdivided into those that assess static features(which treat each frame individually, with no temporal context), and others thatassess dynamic features. Finally, several heuristics can be combined together toform a new model that is different from the sum of its parts; in particular we testedtwo combined heuristics that correspond to “saliency.” Figure 6a shows heuristicresponses for several sample video frames.
2.2.1 Local heuristics. We evaluated two purely local heuristics that computelocal variance and local entropy in 16×16 image patches, which have been previouslyshown to correlate with eye movements over still images [Reinagel and Zador 1999;Privitera and Stark 2000]. Variance for an image patch k is given by
V (k) =1
N − 1
∑
(x,y)∈Pk
(I(x, y) − Ik)2
(1)
where (x, y) loop over the N = 16 × 16 set of pixel coordinates Pk that definepatch k, I(x, y) is the image intensity at (x, y), and Ik is the mean intensity overpatch k. Entropy is similarly given by
E(k) = −∑
i∈G(k)
Fi(k) log Fi(k) (2)
where Fi(k) is the frequency of occurrence of gray level i within the 16×16 patch kof interest, and G(k) is the set of all gray levels present in the patch.
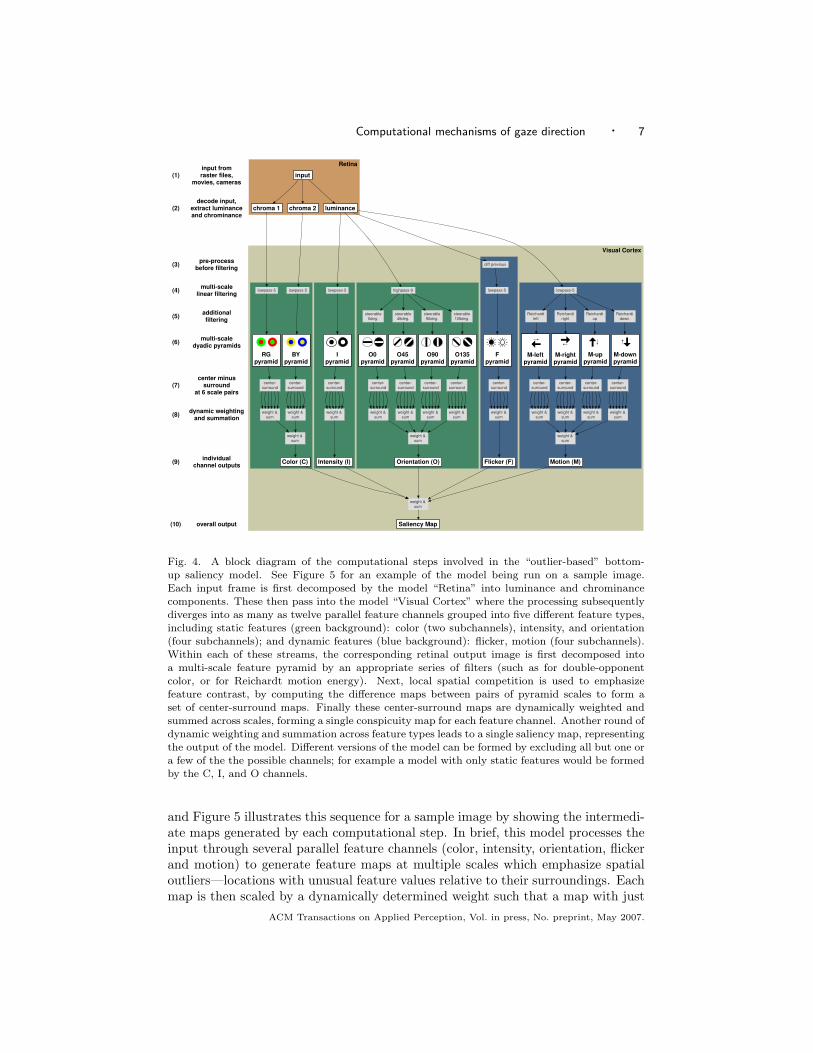
2.2.2 Outlier-based heuristics. We also evaluate heuristics which respond to im-age outliers in visual feature dimensions known to play a role in human attention[Wolfe and Horowitz 2004]. Our software implementation of these heuristics hasbeen previously described [Itti et al. 1998; Itti and Koch 2001; Itti et al. 2003] andis freely available from our website (http://ilab.usc.edu/toolkit/). Figure 4 givesa detailed block diagram showing the sequence of the major computational steps,
ACM Transactions on Applied Perception, Vol. in press, No. preprint, May 2007.
Computational mechanisms of gaze direction · 7
Retina
Visual Cortex
Ipyramid
M-leftpyramid
M-rightpyramid
M-uppyramid
M-downpyramid
BYpyramid
RGpyramid
O0pyramid
O45pyramid
O90pyramid
O135pyramid
Fpyramid
(1)
(2)
input fromraster files,
movies, cameras
decode input,extract luminanceand chrominance
(3)pre-process
before filtering
(4)multi-scale
linear filtering
(5)additionalfiltering
(6)multi-scale
dyadic pyramids
(7)center minus
surroundat 6 scale pairs
(8)dynamic weighting
and summation
(9)individual
channel outputs
(10) overall output
input
chroma 1 chroma 2 luminance
lowpass-5 lowpass-5 lowpass-5 highpass-9
diff previous
lowpass-5
center-surround
weight &sum
weight &sum
center-surround
weight &sum
Color (C)
weight &sum
center-surround
weight &sum
Intensity (I)
steerable0deg.
steerable45deg.
steerable90deg.
steerable135deg.
center-surround
weight &sum
weight &sum
center-surround
weight &sum
center-surround
weight &sum
center-surround
weight &sum
Orientation (O)
lowpass-5
center-surround
weight &sum
Flicker (F)
Reichardtleft
Reichardtright
Reichardtup
Reichardtdown
center-surround
weight &sum
weight &sum
center-surround
weight &sum
center-surround
weight &sum
center-surround
weight &sum
Motion (M)
Saliency Map
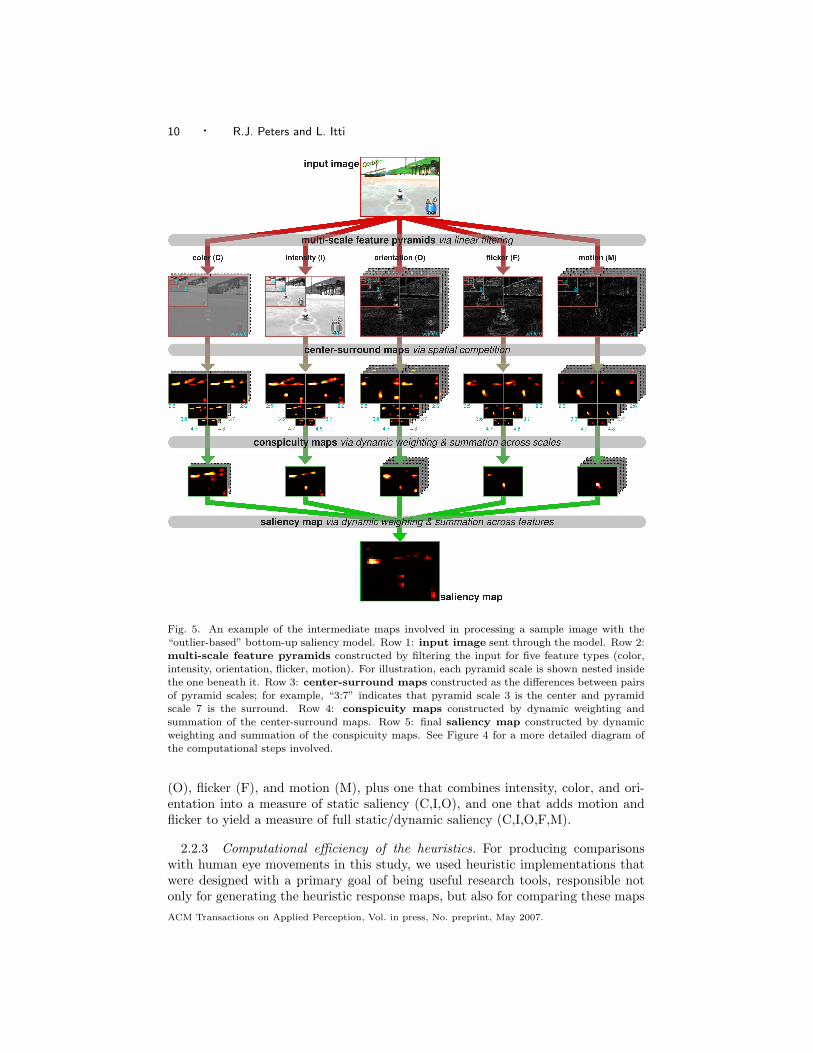
Fig. 4. A block diagram of the computational steps involved in the “outlier-based” bottom-
up saliency model. See Figure 5 for an example of the model being run on a sample image.Each input frame is first decomposed by the model “Retina” into luminance and chrominancecomponents. These then pass into the model “Visual Cortex” where the processing subsequently
diverges into as many as twelve parallel feature channels grouped into five different feature types,including static features (green background): color (two subchannels), intensity, and orientation(four subchannels); and dynamic features (blue background): flicker, motion (four subchannels).
Within each of these streams, the corresponding retinal output image is first decomposed intoa multi-scale feature pyramid by an appropriate series of filters (such as for double-opponentcolor, or for Reichardt motion energy). Next, local spatial competition is used to emphasizefeature contrast, by computing the difference maps between pairs of pyramid scales to form a
set of center-surround maps. Finally these center-surround maps are dynamically weighted andsummed across scales, forming a single conspicuity map for each feature channel. Another round ofdynamic weighting and summation across feature types leads to a single saliency map, representingthe output of the model. Different versions of the model can be formed by excluding all but one or
a few of the the possible channels; for example a model with only static features would be formedby the C, I, and O channels.
and Figure 5 illustrates this sequence for a sample image by showing the intermedi-ate maps generated by each computational step. In brief, this model processes theinput through several parallel feature channels (color, intensity, orientation, flickerand motion) to generate feature maps at multiple scales which emphasize spatialoutliers—locations with unusual feature values relative to their surroundings. Eachmap is then scaled by a dynamically determined weight such that a map with just
ACM Transactions on Applied Perception, Vol. in press, No. preprint, May 2007.
8 · R.J. Peters and L. Itti
one or a few strong peaks receives a higher weight than a map with many peaks;in essence, maps with a more focused prediction of which locations are salient earnmore votes in producing the final saliency map. The dynamically weighted maps arethen summed together. In practice, there are several stages of dynamic weightingand summation, first within features and then across features, leading ultimatelyto a single saliency map.
We refer to Figure 4 for a more detailed breakdown of this process into 10 steps:
(1) RGB input from some source (camera, movie files, series of raster files) feedsinto the model “Retina.”
(2) The retina splits the RGB image into one luminance stream and two luminance-normalized opponent-color chrominance streams. These retinal outputs thendiverge into 12 feature channels within the model “Visual Cortex,” with the twochrominance components feeding two color-opponent channels (“C”; red/greenand blue/yellow), and the luminance component feeding the intensity, orienta-tion (“O”; 0◦, 45◦, 90◦, 135◦), flicker (“F”) and motion (“M”; left, right, updown) channels.
(3) Optionally, each channel may pre-process its retinal output before filtering; thisis currently used only by the flicker channel, to compute the absolute differencebetween the luminance images of the current and previous frames.
(4) Each image stream is decomposed into a multi-scale dyadic feature pyramid byrecursive application of a linear filter followed by subsampling across nine scales,from level 0 at the original scale of the image, to level 8 at a 256-fold reductionin width and height. The C, I, F and M channels efficiently compute low-passpyramids L from their respective inputs, using a separable filter composed of5-point low-pass kernels in the x direction (kx = [1, 4, 6, 4, 1]/16) and in the ydirection (ky = k
Tx ). The bottom pyramid level L0 is just the original image,
and for i > 1 the i-th pyramid level is given by Li = ((Li−1 ∗ kx) ∗ ky) ↓x,y,where ∗ represents convolution and ↓x,y represents 2-fold subsampling in the xand y directions.
The O channel computes a high-pass (“Laplacian”) pyramid H [Burt and Adel-son 1983], essentially by computing the difference between parallel full-band F
and low-passed L pyramids. The computation is initialized at level 0 with F 0
given by the original luminance image. Then, at each level the low-pass imageis computed by convolving the full-band image with a separable filter composedof 9-point low-pass kernels in the x and y directions: Li = (F i ∗ kx) ∗ ky, with
kx = [1, 8, 28, 56, 70, 56, 28, 8, 1]/256 and ky = kTx . Finally, the high-pass image
is the difference of the full-band and low-passed images: Hi = F i − Li. Theprocess iterates to higher pyramid levels by subsampling the current low-passedimage to give the next level’s full-band image: F i+1 = Li ↓x,y.
(5) A post-processing step is used by the O and M channels to extract the featuresof interest from the pyramid. In the orientation channels, an efficient steerablefilter implementation is used to produce 0◦, 45◦, 90◦ and 135◦ orientation-tunedresponses from the high-pass pyramid [Greenspan et al. 1994]. This involvesmodulating each level of the pyramid with a quadrature pair of oriented sinewave gratings offset by 90◦ in phase, convolving each modulated image with
ACM Transactions on Applied Perception, Vol. in press, No. preprint, May 2007.
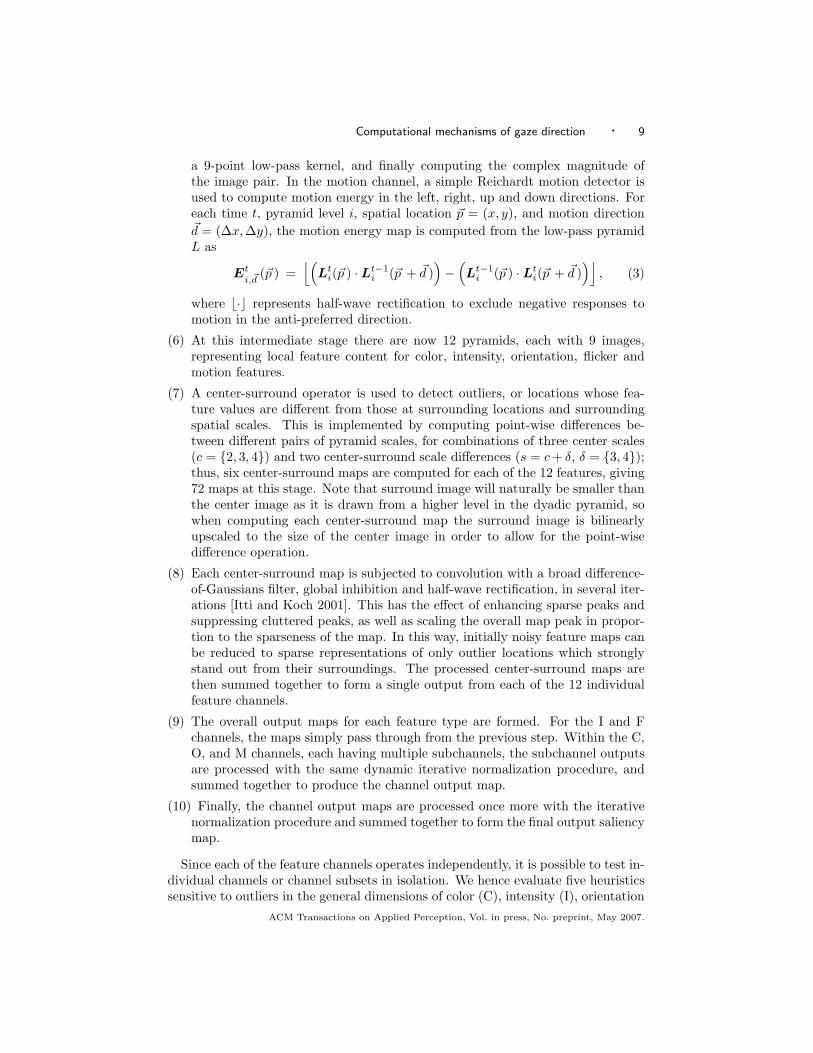
Computational mechanisms of gaze direction · 9
a 9-point low-pass kernel, and finally computing the complex magnitude ofthe image pair. In the motion channel, a simple Reichardt motion detector isused to compute motion energy in the left, right, up and down directions. Foreach time t, pyramid level i, spatial location ~p = (x, y), and motion direction~d = (∆x,∆y), the motion energy map is computed from the low-pass pyramidL as
Et
i,~d(~p ) =
⌊(
Lti(~p ) · Lt−1
i (~p + ~d ))
−(
Lt−1i (~p ) · Lt
i(~p + ~d ))⌋
, (3)
where ⌊·⌋ represents half-wave rectification to exclude negative responses tomotion in the anti-preferred direction.
(6) At this intermediate stage there are now 12 pyramids, each with 9 images,representing local feature content for color, intensity, orientation, flicker andmotion features.
(7) A center-surround operator is used to detect outliers, or locations whose fea-ture values are different from those at surrounding locations and surroundingspatial scales. This is implemented by computing point-wise differences be-tween different pairs of pyramid scales, for combinations of three center scales(c = {2, 3, 4}) and two center-surround scale differences (s = c + δ, δ = {3, 4});thus, six center-surround maps are computed for each of the 12 features, giving72 maps at this stage. Note that surround image will naturally be smaller thanthe center image as it is drawn from a higher level in the dyadic pyramid, sowhen computing each center-surround map the surround image is bilinearlyupscaled to the size of the center image in order to allow for the point-wisedifference operation.
(8) Each center-surround map is subjected to convolution with a broad difference-of-Gaussians filter, global inhibition and half-wave rectification, in several iter-ations [Itti and Koch 2001]. This has the effect of enhancing sparse peaks andsuppressing cluttered peaks, as well as scaling the overall map peak in propor-tion to the sparseness of the map. In this way, initially noisy feature maps canbe reduced to sparse representations of only outlier locations which stronglystand out from their surroundings. The processed center-surround maps arethen summed together to form a single output from each of the 12 individualfeature channels.
(9) The overall output maps for each feature type are formed. For the I and Fchannels, the maps simply pass through from the previous step. Within the C,O, and M channels, each having multiple subchannels, the subchannel outputsare processed with the same dynamic iterative normalization procedure, andsummed together to produce the channel output map.
(10) Finally, the channel output maps are processed once more with the iterativenormalization procedure and summed together to form the final output saliencymap.
Since each of the feature channels operates independently, it is possible to test in-dividual channels or channel subsets in isolation. We hence evaluate five heuristicssensitive to outliers in the general dimensions of color (C), intensity (I), orientation
ACM Transactions on Applied Perception, Vol. in press, No. preprint, May 2007.
10 · R.J. Peters and L. Itti
Fig. 5. An example of the intermediate maps involved in processing a sample image with the“outlier-based” bottom-up saliency model. Row 1: input image sent through the model. Row 2:
multi-scale feature pyramids constructed by filtering the input for five feature types (color,intensity, orientation, flicker, motion). For illustration, each pyramid scale is shown nested insidethe one beneath it. Row 3: center-surround maps constructed as the differences between pairs
of pyramid scales; for example, “3:7” indicates that pyramid scale 3 is the center and pyramidscale 7 is the surround. Row 4: conspicuity maps constructed by dynamic weighting andsummation of the center-surround maps. Row 5: final saliency map constructed by dynamicweighting and summation of the conspicuity maps. See Figure 4 for a more detailed diagram of
the computational steps involved.
(O), flicker (F), and motion (M), plus one that combines intensity, color, and ori-entation into a measure of static saliency (C,I,O), and one that adds motion andflicker to yield a measure of full static/dynamic saliency (C,I,O,F,M).
2.2.3 Computational efficiency of the heuristics. For producing comparisonswith human eye movements in this study, we used heuristic implementations thatwere designed with a primary goal of being useful research tools, responsible notonly for generating the heuristic response maps, but also for comparing these maps
ACM Transactions on Applied Perception, Vol. in press, No. preprint, May 2007.
Computational mechanisms of gaze direction · 11
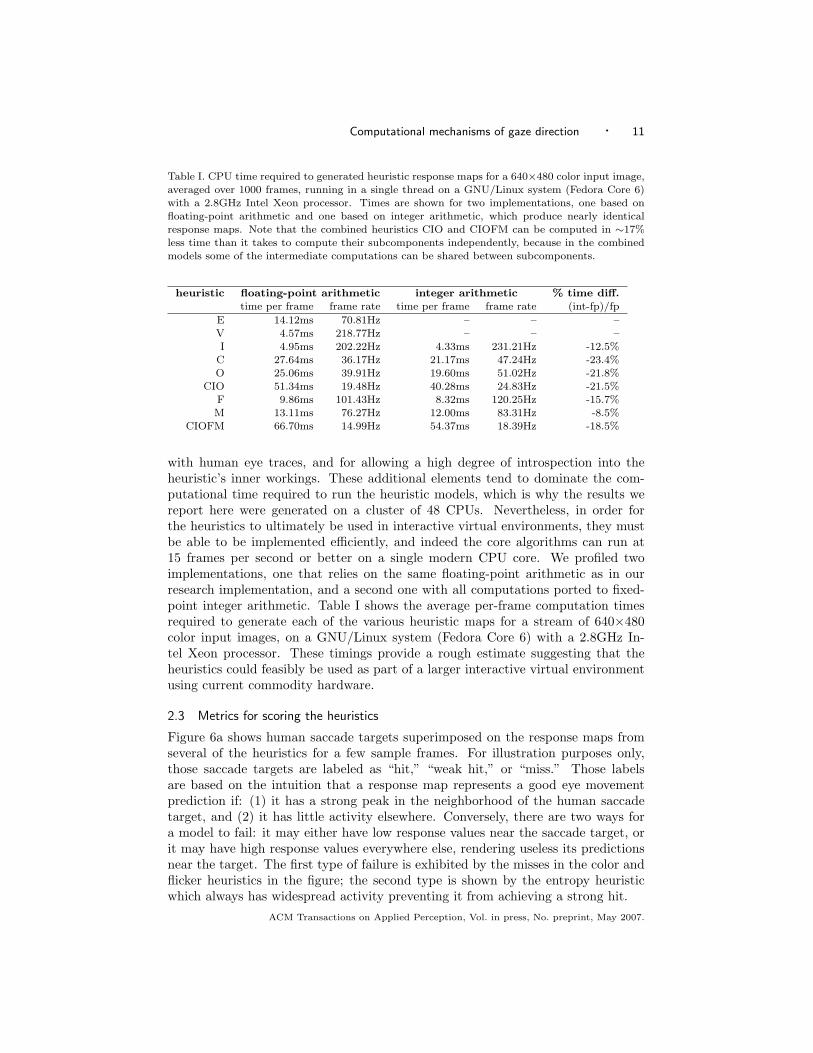
Table I. CPU time required to generated heuristic response maps for a 640×480 color input image,averaged over 1000 frames, running in a single thread on a GNU/Linux system (Fedora Core 6)
with a 2.8GHz Intel Xeon processor. Times are shown for two implementations, one based onfloating-point arithmetic and one based on integer arithmetic, which produce nearly identicalresponse maps. Note that the combined heuristics CIO and CIOFM can be computed in ∼17%
less time than it takes to compute their subcomponents independently, because in the combinedmodels some of the intermediate computations can be shared between subcomponents.
heuristic floating-point arithmetic integer arithmetic % time diff.time per frame frame rate time per frame frame rate (int-fp)/fp
E 14.12ms 70.81Hz – – –
V 4.57ms 218.77Hz – – –I 4.95ms 202.22Hz 4.33ms 231.21Hz -12.5%
C 27.64ms 36.17Hz 21.17ms 47.24Hz -23.4%O 25.06ms 39.91Hz 19.60ms 51.02Hz -21.8%
CIO 51.34ms 19.48Hz 40.28ms 24.83Hz -21.5%F 9.86ms 101.43Hz 8.32ms 120.25Hz -15.7%M 13.11ms 76.27Hz 12.00ms 83.31Hz -8.5%
CIOFM 66.70ms 14.99Hz 54.37ms 18.39Hz -18.5%
with human eye traces, and for allowing a high degree of introspection into theheuristic’s inner workings. These additional elements tend to dominate the com-putational time required to run the heuristic models, which is why the results wereport here were generated on a cluster of 48 CPUs. Nevertheless, in order forthe heuristics to ultimately be used in interactive virtual environments, they mustbe able to be implemented efficiently, and indeed the core algorithms can run at15 frames per second or better on a single modern CPU core. We profiled twoimplementations, one that relies on the same floating-point arithmetic as in ourresearch implementation, and a second one with all computations ported to fixed-point integer arithmetic. Table I shows the average per-frame computation timesrequired to generate each of the various heuristic maps for a stream of 640×480color input images, on a GNU/Linux system (Fedora Core 6) with a 2.8GHz In-tel Xeon processor. These timings provide a rough estimate suggesting that theheuristics could feasibly be used as part of a larger interactive virtual environmentusing current commodity hardware.
2.3 Metrics for scoring the heuristics
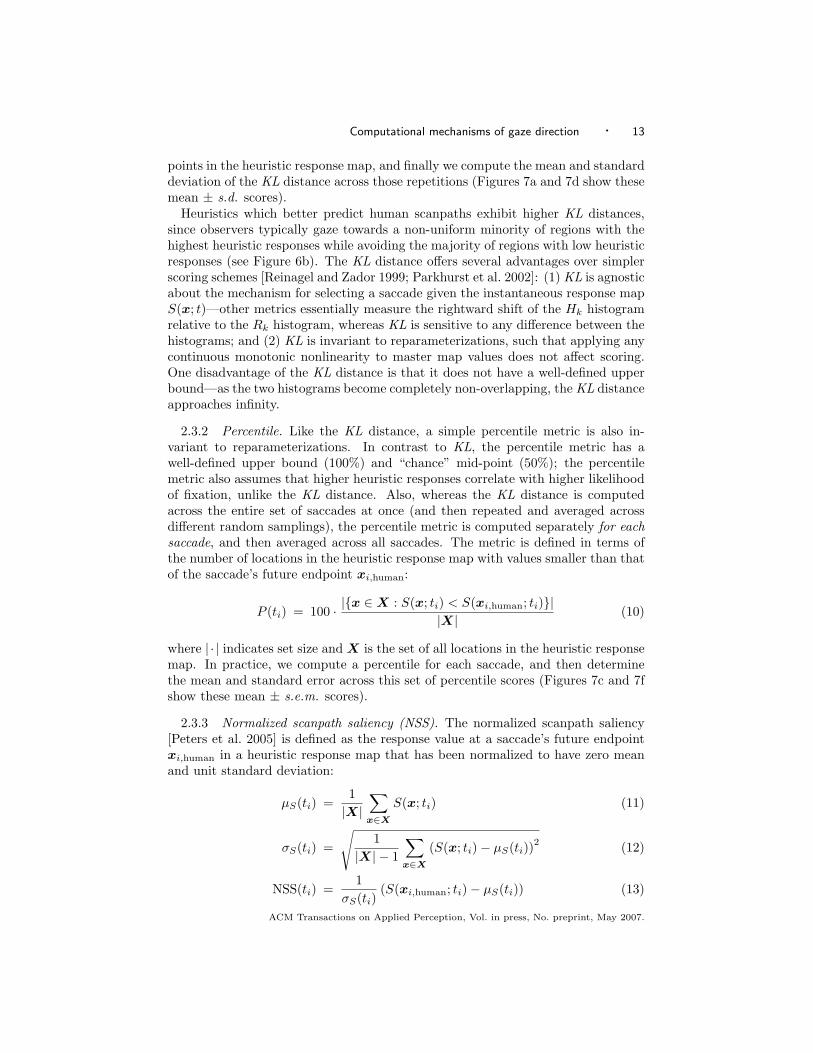
Figure 6a shows human saccade targets superimposed on the response maps fromseveral of the heuristics for a few sample frames. For illustration purposes only,those saccade targets are labeled as “hit,” “weak hit,” or “miss.” Those labelsare based on the intuition that a response map represents a good eye movementprediction if: (1) it has a strong peak in the neighborhood of the human saccadetarget, and (2) it has little activity elsewhere. Conversely, there are two ways fora model to fail: it may either have low response values near the saccade target, orit may have high response values everywhere else, rendering useless its predictionsnear the target. The first type of failure is exhibited by the misses in the color andflicker heuristics in the figure; the second type is shown by the entropy heuristicwhich always has widespread activity preventing it from achieving a strong hit.
ACM Transactions on Applied Perception, Vol. in press, No. preprint, May 2007.
12 · R.J. Peters and L. Itti
The remainder of this section describes several approaches to quantifying theseintuitions about what characterizes a good eye movement predictor. Each heuristicgenerates a topographic dynamic master response map S(x; t), which is a time-varying two-dimensional array that assigns a response value to each spatial locationx = (x, y) at each video frame time t; we will formalize our intuitions by saying thata good heuristic should generate response maps in which the values at locationsfixated by observers are in some way statistically discriminable from the valuesat non-fixated or random locations. To quantify this relationship, we used threedifferent metrics, of the form M(S(x; t)), which generate a scalar value indicatinghow well a particular heuristic matched a series of eye positions. The motivationfor analyzing the heuristics with more than one metric is to ensure that the mainqualitative conclusions are independent of the choice of metric. For example, somemetrics may be invariant to reparameterizations—for instance, M(S) = M(
√S) =
M(eS)—while others are not, so comparing the heuristic scores with these differentmetrics can help reveal whether any particular nonlinearity is likely to play animportant role in the generation of eye movements from the master response maps.Some metrics have well-defined upper or lower bounds. All of the metrics areshift-invariant (M(S) = M(S + c)) and scale-invariant (M(S) = M(cS)).
2.3.1 Kullback-Leibler (KL) distance. At the onset of each human saccade (ti =1 . . . N , N = number of saccades in the experimental session), we sample the heuris-tic’s master map activity around the saccade’s future endpoint xi,human and arounda uniformly random endpoint xi,random:
h(ti) =S(xi,human; ti) − minx S(x; ti)
maxx S(x; ti) − minx S(x; ti)(4)
r(ti) =S(xi,random; ti) − minx S(x; ti)
maxx S(x; ti) − minx S(x; ti)(5)
Note that by construction, h(ti) ∈ [0, 1] and r(ti) ∈ [0, 1] for all ti. We then formhistograms of these values, with 10 bins Bk covering the range [0, 1], across allsaccades:
Bk =
{
[
k−110 , k
10
)
if 1 ≤ k ≤ 9[
k−110 , k
10
]
if k = 10(6)
Hk =1
N|{ti : h(ti) ∈ Bk}| (7)
Rk =1
N|{ti : r(ti) ∈ Bk}| (8)
where | · | indicates set size. Finally we quantify the difference between thesehistograms with the (symmetric) Kullback-Leibler (KL) distance (also known asrelative entropy):
KL =1
2
10∑
k=1
(
Hk logHk
Rk
+ Rk logRk
Hk
)
(9)
In practice, we repeat this computation 1200 times, each time comparing the fixatedlocation xi,human with an xi,random location at one of the (640/16)×(480/16) = 1200
ACM Transactions on Applied Perception, Vol. in press, No. preprint, May 2007.
Computational mechanisms of gaze direction · 13
points in the heuristic response map, and finally we compute the mean and standarddeviation of the KL distance across those repetitions (Figures 7a and 7d show thesemean ± s.d. scores).
Heuristics which better predict human scanpaths exhibit higher KL distances,since observers typically gaze towards a non-uniform minority of regions with thehighest heuristic responses while avoiding the majority of regions with low heuristicresponses (see Figure 6b). The KL distance offers several advantages over simplerscoring schemes [Reinagel and Zador 1999; Parkhurst et al. 2002]: (1) KL is agnosticabout the mechanism for selecting a saccade given the instantaneous response mapS(x; t)—other metrics essentially measure the rightward shift of the Hk histogramrelative to the Rk histogram, whereas KL is sensitive to any difference between thehistograms; and (2) KL is invariant to reparameterizations, such that applying anycontinuous monotonic nonlinearity to master map values does not affect scoring.One disadvantage of the KL distance is that it does not have a well-defined upperbound—as the two histograms become completely non-overlapping, the KL distanceapproaches infinity.
2.3.2 Percentile. Like the KL distance, a simple percentile metric is also in-variant to reparameterizations. In contrast to KL, the percentile metric has awell-defined upper bound (100%) and “chance” mid-point (50%); the percentilemetric also assumes that higher heuristic responses correlate with higher likelihoodof fixation, unlike the KL distance. Also, whereas the KL distance is computedacross the entire set of saccades at once (and then repeated and averaged acrossdifferent random samplings), the percentile metric is computed separately for eachsaccade, and then averaged across all saccades. The metric is defined in terms ofthe number of locations in the heuristic response map with values smaller than thatof the saccade’s future endpoint xi,human:
P (ti) = 100 · |{x ∈ X : S(x; ti) < S(xi,human; ti)}||X| (10)
where | · | indicates set size and X is the set of all locations in the heuristic responsemap. In practice, we compute a percentile for each saccade, and then determinethe mean and standard error across this set of percentile scores (Figures 7c and 7fshow these mean ± s.e.m. scores).
2.3.3 Normalized scanpath saliency (NSS). The normalized scanpath saliency[Peters et al. 2005] is defined as the response value at a saccade’s future endpointxi,human in a heuristic response map that has been normalized to have zero meanand unit standard deviation:
µS(ti) =1
|X|∑
x∈X
S(x; ti) (11)
σS(ti) =
√
1
|X| − 1
∑
x∈X
(S(x; ti) − µS(ti))2
(12)
NSS(ti) =1
σS(ti)(S(xi,human; ti) − µS(ti)) (13)
ACM Transactions on Applied Perception, Vol. in press, No. preprint, May 2007.
14 · R.J. Peters and L. Itti
0.1
0.3
0.5
0.7
0.9
KL = 0.029 ± 0.003
fra
ctio
n o
f sa
cca
de
s
all
ga
me
sN
= 8
47
1 s
acca
de
s(b)
0.1
0.3
0.5
0.7
0.9
KL = 0.031 ± 0.004
fra
ctio
n o
f sa
cca
de
s
rac
ing
ga
me
sN
= 3
99
5 s
acca
de
s
0 0.5 1
0.1
0.3
0.5
0.7
0.9
KL = 0.104 ± 0.006
entropy(E)
fra
ctio
n o
f sa
cca
de
s
ex
plo
rin
g g
am
es
N =
44
76
sa
cca
de
s
KL = 0.094 ± 0.005
random
human
KL = 0.077 ± 0.006
0 0.5 1
KL = 0.115 ± 0.007
color(C)
KL = 0.119 ± 0.005
KL = 0.032 ± 0.004
0 0.5 1
KL = 0.239 ± 0.010
flicker(F)
KL = 0.133 ± 0.006
KL = 0.053 ± 0.005
0 0.5 1
KL = 0.232 ± 0.010
full saliency(C,I,O,F,M)
input(a) entropy
weak hit
color
miss
flicker
hit
full saliency
hit
miss hit miss weak hit
weak hit miss hit hit
Fig. 6. Scoring different heuristics for their ability to predict human gaze targets during video-
game playing. (a) Each sample video frame (column 1) was chosen at a time when the subject isinitiating a saccade from the base of the arrow to the tip of the arrow surrounded by the circle.
We sample the master maps generated by each heuristic (columns 2–5) in the neighborhood ofthe saccade target and at a number of uniformly random locations. For illustration only (not forquantitative analysis), each target is labeled here as “hit” (strong peak at target with few otherpeaks in the map), “weak hit” (weak peak within target circle with many other map peaks) or
“miss” (no peak at target location). Individual heuristics often have misses (such as color andflicker here), while a combined heuristic such as full saliency is more likely to have at least aweak hit. (b) Across our entire data set, these histograms show how frequently locations with
particular heuristic values are the targets of human saccades (narrow, dark bars), and of randomsaccades (light, wide bars). The Kullback-Leibler (KL) distance (light horizontal bars atop eachsubpanel) quantifies the dissimilarity between these distributions; higher KL values indicate thatthe heuristic is better able to distinguish human fixation locations from other locations. Top row:
heuristic scores across all game types; middle row: scores for racing games only; bottom row:scores for exploration games only. See Figure 7 for a more comprehensive summary of the results.
ACM Transactions on Applied Perception, Vol. in press, No. preprint, May 2007.
Computational mechanisms of gaze direction · 15
0
0.1
0.2
0.3
entro
py (E
)
varia
nce
(V)
orient
ation
(O)
inte
nsity
(I)
color (
C)
stat
ic salienc
y (C
,I,O)
flick
er (F
)
mot
ion
(M)
full sa
lienc
y (C
,I,O,F
,M)
(d)
racing games
exploring games
KL
dis
tan
ce
**
****
**
**
**
**
**
**
0
0.1
0.2
0.3
all games
KL
dis
tan
ce
(a)
* * * *
*
*
* *
*
−0.5
0
0.5
1
entro
py (E
)
varia
nce
(V)
orient
ation
(O)
inte
nsity
(I)
color (
C)
stat
ic salienc
y (C
,I,O)
flick
er (F
)
mot
ion
(M)
full sa
lienc
y (C
,I,O,F
,M)
(e)
NS
S
****
****
n.s.**
** ****
−0.5
0
0.5
1
NS
S
(b)
* n.s. * *
* *
* * *
40
50
60
70
entro
py (E
)
varia
nce
(V)
orient
ation
(O)
inte
nsity
(I)
color (
C)
stat
ic salienc
y (C
,I,O)
flick
er (F
)
mot
ion
(M)
full sa
lienc
y (C
,I,O,F
,M)
(f)
Perc
en
tile **
**
**
**
****
****
**
40
50
60
70
Perc
en
tile
(c)
* n.s.
* *
* *
* * *
Fig. 7. Nine heuristics for eye position prediction were scored by three metrics — (a,d) KL
distance (section 2.3.1), (b,e) normalized scanpath saliency (NSS), and (c,f) percentile — toquantify how well the heuristics discriminate human gaze targets from random locations. For eachmetric, a higher score means a better fit between predicted and observed eye position. (a,b,c)
Across all game sessions, the dynamic features motion (M) and flicker (F) scored better than staticfeatures color (C), intensity (I) and orientation (O), and local heuristics entropy (E) and variance(V). Bars marked with (∗) represent heuristics that scored significantly above the chance level inthat metric (1-tailed t-test, p < 0.0001 or better), while “n.s.” indicates a non-significant result.
(d,e,f) When the sessions were split by game paradigm, all heuristics (except variance with theKL metric) were better predictors of human gaze in exploration games than an racing games. Barsmarked with (∗∗) represent heuristics that showed a significant difference in metric score betweenthe two game types (2-tailed paired t-test, p < 0.0001 or better; note that the paired t-test reveals
significant differences even in cases where the two scores are very similar between the game types,even with overlapping error bars); “n.s.” indicates a non-significant result.
Like the percentile metric, NSS is computed once for each saccade, and subsequentlythe mean and standard error are computed across the set of NSS scores (Figures 7band 7e show these mean ± s.e.m. scores). By virtue of the zero-mean normalization,NSS has a well-defined “chance” mid-point (0). Unlike KL and percentile, NSS isnot invariant to reparameterizations.
3. RESULTS
Figure 7a–c shows results obtained overall. Each of the three analysis metrics (KLdistance, percentile, NSS) revealed similar qualitative patterns of results. All nineheuristics tested performed significantly above the chance level according to all threemetrics (t-tests, p < 0.0001 or better, for KL > 0, NSS > 0, or percentile > 50),with the exception of variance (V) scored by the NSS and percentile metrics.
Under our conditions of interactive game-play and with our video game stimuli,we found that motion alone (M) was the best predictor of human gaze, with flickeralone (F) and the full saliency heuristic (C,I,O,F,M) scoring nearly as well. Inter-
ACM Transactions on Applied Perception, Vol. in press, No. preprint, May 2007.

16 · R.J. Peters and L. Itti
mediate scores were obtained with color alone (C) and static saliency (C,I,O). Thepoorest scores came from static features orientation alone (O) and intensity alone(I), and from local heuristics computing variance (V) and entropy (E). Notably,color alone (C) scored much better than the other static features. Studies withstatic scenes have found that the relative gaze-attraction strength of the color fea-ture varies with image type [Parkhurst et al. 2002]; in our case the strength of thecolor feature is likely explained at least in part by the art design of the video gameswhich includes strong color contrast between main characters and the background.
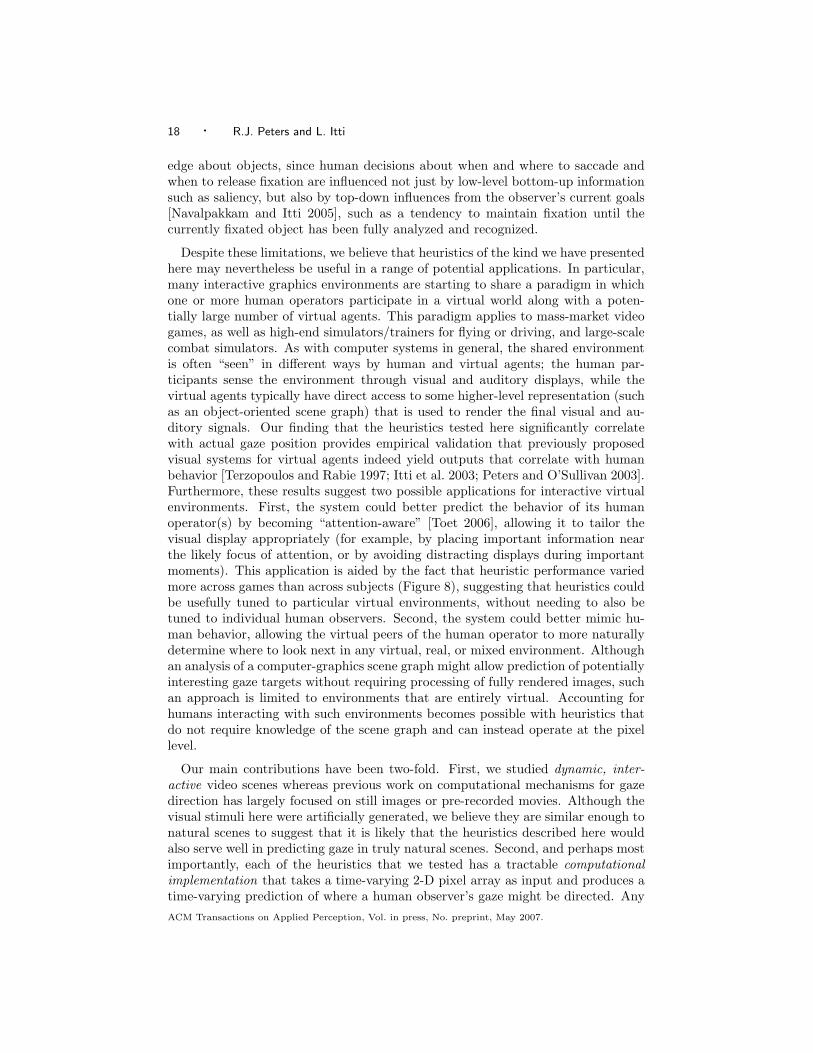
We found two interesting dissociations within the scores obtained by the differentheuristics. A split by game type (Figures 7d–f) suggested an interesting dissociationbetween racing games (Mario Kart and Wave Race), and exploration games (SuperMario Sunshine, Hulk, Pac Man World). Racing games involve primarily obstacle-avoidance while the player navigates a predetermined course under time pressure.In contrast, exploration games, with their more open-ended storylines, impose fewerrestrictions on the player’s navigation, but instead implicitly require the player tosearch the environment for objects or other characters with which to engage. All ofthe heuristics scored better at predicting observers’ gaze during exploration gamesthan during racing games (paired t-tests, p < 0.0001 or better), with the twoexceptions of variance (V) by the KL distance and color (C) by NSS. In additionto this overall effect, we also found that the top-scoring heuristics were different forracing and exploring games. For the exploration games, the best heuristics werethe dynamic outlier-based features motion (M) and flicker (F), followed closely byfull saliency (C,I,O,F,M). In contrast, for the racing games, the best heuristic wasinstead the static feature color (C). In a second split, we found that there was lessvariability in heuristic performance across subjects than across games (Figure 8),especially so for the overall best heuristics motion (M) and flicker (F).
4. DISCUSSION
In this study we have quantitatively evaluated nine simple computational heuristicmodels for their ability to predict where people look while playing video games.We found that all heuristics score significantly above chance, hence representingeasily computable shortcuts to the targets selected by human gaze. This findingwas robust, with the same qualitative pattern revealed by three different metricsfor scoring the heuristics. Our study provides direct experimental evidence thatbottom-up image analysis can predict a non-negligible fraction of human gaze tar-gets, even in situations where top-down influences are expected to dominate, driv-ing eye movements based on task demands rather than on visual inputs. Still, byone measure, purely bottom-up factors make a relatively smaller contribution toeye movements in the interactive video game stimuli (NSS score for static saliencyC,I,O: 0.34) than in static natural scenes (NSS score for “baseline salience model,”equivalent to static saliency: 0.69 [Peters et al. 2005]). Part of that gap is bridgedwith the inclusion of the dynamic bottom-up features motion (M) and flicker (F) inthe full saliency heuristic (NSS score: 0.64). In this study, the full saliency heuristicwas actually slightly outperformed by the motion channel alone (NSS score: 0.68),which makes sense given the highly dynamic nature of the video game stimuli thatwe used. Still, we would suggest that the full saliency model, with both static and
ACM Transactions on Applied Perception, Vol. in press, No. preprint, May 2007.
Computational mechanisms of gaze direction · 17
dynamic features, is a better choice for a general-purpose bottom-up heuristic, sinceit can account well for eye movements in both static and dynamic scenes, whereasthe motion channel alone would obviously fail completely for static scenes. In thehuman visual system it may be that the different channels are weighted dynamicallyaccording to their relevance to the current visual input, so that in a video gametask, for example, the predictions of the motion channel could be emphasized andthose of the static channels deemphasized.
The main failure mode of the heuristics that we tested is that they often failto highlight objects or regions that, to any human observer, would be obviouslytask-relevant; this is reflected in preliminary unpublished results indicating thatthe heuristics are better at predicting the gaze of observers passively viewing pre-recorded video game clips than of those interactively playing the games. For exam-ple, in racing games, the goal of successful navigation requires game players to focuson the horizon and the focus of expansion of the oncoming track, yet that point isoften not the most salient according to the bottom-up heuristics. This may partlyexplain why the bottom-up heuristics perform more poorly on the racing gamesthan on the exploring games (Figures 7d–f): the racing games may simply involvea stronger set of task-dependent biases on eye position. Similarly, in order to per-form well at the game-playing task, observers must often effectively ignore certainregions that are actually quite salient by bottom-up measures, such as a constantlyticking digital clock in one corner of the screen. Such observations, while simpleto describe, have yet to be translated into computational terms that could be im-plemented in a gaze-prediction heuristic. Thus, one direction for future study isto operationalize the top-down, task-related influences that are outside the scopeof bottom-up heuristics. Such influences are likely to be found in studies from theinteractive-stimulus/qualitative-model category of Figure 2, which suggest behav-ioral phenomena that might be candidates for future implementation and testingin the quantitative-model category.
One limitation of the heuristics that we tested is that they stop short of making aspecific saccade predictions—that is, they don’t predict when a saccade will occur,nor to which single location a saccade will occur. Rather, they make a continuousprediction of how likely each location would be to be a saccade target, if a saccadewere to be triggered at that moment; then, at those instants where human ob-servers in fact generated saccades, we test the predictions of the heuristic. In termsof the bottom-up visual attention system proposed in [Koch and Ullman 1985; Ittiet al. 1998] in which a saliency map (SM) interacts with dynamic winner-take-all(WTA) and inhibition-of-return (IOR) mechanisms to select a series of locations,the current study has focused exclusively on the saliency map stage, ignoring WTAand IOR mechanisms. This is largely a practical decision: we want to fine-tune anSM model that does well at predicting eye movements on average, before testingWTA and IOR implementations for predicting specific eye movements; otherwise, ifa combined SM/WTA/IOR was found to produce poor results it would be difficultto know whether the SM or WTA/IOR mechanisms were to blame. An importanttopic for future study is to a develop a WTA/IOR model capable of producing ac-curate eye movement predictions with high temporal and spatial precision. Such amodel will likely rely on significantly more complex visual features including knowl-
ACM Transactions on Applied Perception, Vol. in press, No. preprint, May 2007.
18 · R.J. Peters and L. Itti
edge about objects, since human decisions about when and where to saccade andwhen to release fixation are influenced not just by low-level bottom-up informationsuch as saliency, but also by top-down influences from the observer’s current goals[Navalpakkam and Itti 2005], such as a tendency to maintain fixation until thecurrently fixated object has been fully analyzed and recognized.
Despite these limitations, we believe that heuristics of the kind we have presentedhere may nevertheless be useful in a range of potential applications. In particular,many interactive graphics environments are starting to share a paradigm in whichone or more human operators participate in a virtual world along with a poten-tially large number of virtual agents. This paradigm applies to mass-market videogames, as well as high-end simulators/trainers for flying or driving, and large-scalecombat simulators. As with computer systems in general, the shared environmentis often “seen” in different ways by human and virtual agents; the human par-ticipants sense the environment through visual and auditory displays, while thevirtual agents typically have direct access to some higher-level representation (suchas an object-oriented scene graph) that is used to render the final visual and au-ditory signals. Our finding that the heuristics tested here significantly correlatewith actual gaze position provides empirical validation that previously proposedvisual systems for virtual agents indeed yield outputs that correlate with humanbehavior [Terzopoulos and Rabie 1997; Itti et al. 2003; Peters and O’Sullivan 2003].Furthermore, these results suggest two possible applications for interactive virtualenvironments. First, the system could better predict the behavior of its humanoperator(s) by becoming “attention-aware” [Toet 2006], allowing it to tailor thevisual display appropriately (for example, by placing important information nearthe likely focus of attention, or by avoiding distracting displays during importantmoments). This application is aided by the fact that heuristic performance variedmore across games than across subjects (Figure 8), suggesting that heuristics couldbe usefully tuned to particular virtual environments, without needing to also betuned to individual human observers. Second, the system could better mimic hu-man behavior, allowing the virtual peers of the human operator to more naturallydetermine where to look next in any virtual, real, or mixed environment. Althoughan analysis of a computer-graphics scene graph might allow prediction of potentiallyinteresting gaze targets without requiring processing of fully rendered images, suchan approach is limited to environments that are entirely virtual. Accounting forhumans interacting with such environments becomes possible with heuristics thatdo not require knowledge of the scene graph and can instead operate at the pixellevel.
Our main contributions have been two-fold. First, we studied dynamic, inter-active video scenes whereas previous work on computational mechanisms for gazedirection has largely focused on still images or pre-recorded movies. Although thevisual stimuli here were artificially generated, we believe they are similar enough tonatural scenes to suggest that it is likely that the heuristics described here wouldalso serve well in predicting gaze in truly natural scenes. Second, and perhaps mostimportantly, each of the heuristics that we tested has a tractable computationalimplementation that takes a time-varying 2-D pixel array as input and produces atime-varying prediction of where a human observer’s gaze might be directed. Any
ACM Transactions on Applied Perception, Vol. in press, No. preprint, May 2007.
Computational mechanisms of gaze direction · 19
0
0.05
0.1
0.15
entro
py (E
)
varia
nce
(V)
orient
ation
(O)
inte
nsity
(I)
color (
C)
stat
ic salienc
y (C
,I,O)
flick
er (F
)
mot
ion
(M)
full sa
lienc
y (C
,I,O,F
,M)
(a)s
tdd
ev
(KL
)stddev across subjects
stddev across games
0
0.1
0.2
0.3
0.4
0.5
entro
py (E
)
varia
nce
(V)
orient
ation
(O)
inte
nsity
(I)
color (
C)
stat
ic salienc
y (C
,I,O)
flick
er (F
)
mot
ion
(M)
full sa
lienc
y (C
,I,O,F
,M)
(b)
std
de
v(N
SS
)
0
5
10
15
entro
py (E
)
varia
nce
(V)
orient
ation
(O)
inte
nsity
(I)
color (
C)
stat
ic salienc
y (C
,I,O)
flick
er (F
)
mot
ion
(M)
full sa
lienc
y (C
,I,O,F
,M)
(c)
std
de
v(P
erc
en
tile
)
Fig. 8. Sessions were grouped either by subject or by game, then the standard deviation of theheuristic scores was computed within each group, for each of the three metrics: (a) KL distance,
(b) normalized scanpath saliency (NSS), and (c) percentile. For almost all of the heuristics, therewas higher variability due to game than due to the subject.
apparent high-level behavior exhibited by the heuristic is simply attributable tolow-level processing of the input; that is, the heuristics do not require the visualinput to be accompanied by explicit high-level labels for “objects” or “targets.”Whereas behavioral studies have made great strides in understanding observers’gaze behaviors in just such object-based or agent-based terms [Land and Hayhoe2001; Hayhoe et al. 2002; Hayhoe et al. 2003; Bailenson and Yee 2005], such find-ings become available to artificial visual systems only when there is an algorithmto extract the high-level information directly from the visual input. Accurate ob-ject recognition and semantic interpretation continues to be a “hard problem” inartificial vision, particularly for unconstrained visual input; while our approachhas the drawback of lacking high-level scene understanding, it has the virtue of astraightforward computational implementation that can be applied to any visualinput.
Acknowledgments. Support for this work was provided by the National Geospatial-Intelligence Agency (NGA) and the Directorate of Central Intelligence (DCI). Theauthors affirm that the views expressed herein are solely their own, and do notrepresent the views of the United States government or any agency thereof.
REFERENCES
Bailenson, J. and Yee, N. 2005. Digital chameleons: Automatic assimilation of nonverbal ges-tures in immersive virtual environments. Psychological Science 16, 814–819.
Ballard, D., Hayhoe, M., and Pelz, J. 1995. Memory representations in natural tasks. Journal
of Cognitive Neuroscience 7, 1 (Winter), 66–80.
Burt, P. and Adelson, E. 1983. The laplacian pyramid as a compact image code. IEEETransactions on Communications 31, 4, 532–540.
Carmi, R. and Itti, L. 2004. Bottom-up and top-down influences on attentional allocation innatural dyamic scenes. In Proc. Vision Science Society Annual Meeting (VSS04). 20.
Finney, S. A. 2001. Real-time data collection in linux: A case study. Behavior Research Methods,Instruments, and Computers 33, 167–173.
Greenspan, H., Belongie, S., Goodman, R., Perona, P., Rakshit, S., and Anderson, C.
1994. Overcomplete steerable pyramid filters and rotation invariance. In Proceedings ComputerVision and Pattern Recognition. IEEE Computer Society, 222–228.
ACM Transactions on Applied Perception, Vol. in press, No. preprint, May 2007.

20 · R.J. Peters and L. Itti
Hayhoe, M. 2004. Advances in relating eye movements and cognition. Infancy 6, 2, 267–274.
Hayhoe, M., Ballard, D., Triesch, J., and Shinoda, H. 2002. Vision in natural and virtualenvironments. In Proceedings of the symposium on Eye Tracking Research & Applications
(ETRA). 7–13.
Hayhoe, M., Shrivastava, A., Mruczek, R., and Pelz, J. 2003. Visual memory and motorplanning in a natural task. Journal of Vision 3, 1, 49–63.
Henderson, J. M. and Hollingworth, A. 1999. High-level scene perception. Annual Review of
Psychology 50, 243–271.
Itti, L. and Baldi, P. 2005. A principled approach to detecting surprising events in video. InProc. IEEE Conference on Computer Vision and Pattern Recognition (CVPR). San Siego, CA,631–637.
Itti, L., Dhavale, N., and Pighin, F. 2003. Realistic avatar eye and head animation using aneurobiological model of visual attention. In Proceedings of SPIE 48th annual internationalsymposium on optical science and technology. 64–78.
Itti, L. and Koch, C. 2001. Feature combination strategies for saliency-based visual attention
systems. Journal of Electronic Imaging 10, 1 (January), 161–169.
Itti, L., Koch, C., and Niebur, E. 1998. A model of saliency-based visual attention for rapidscene analysis. IEEE Transactions on Pattern Analysis and Machine Intelligence 20, 11(November), 1254–1259.
Koch, C. and Ullman, S. 1985. Shifts in selective visual-attention—towards the underlyingneural circuitry. Human Neurobiology 4, 4, 219–227.
Land, M. and Hayhoe, M. 2001. In what ways do eye movements contribute to everyday
activities? Vision Research 41, 25-26, 3559–3565.
Land, M., Mennie, N., and Rusted, J. 1999. The roles of vision and eye movements in thecontrol of activities of daily living. Perception 28, 11, 1311–1328.
Mannan, S., Ruddock, K., and Wooding, D. 1997. Fixation patterns made during brief exam-
ination of two-dimensional images. Perception 26, 8, 1059–1072.
May, J., Dean, M., and Barnard, P. 2003. Using film cutting techniques in interface design.Human-Computer Interaction 18, 4, 325–372.
Najemnik, J. and Geisler, W. 2005. Optimal eye movement strategies in visual search. Na-
ture 434, 7031 (March), 387–391.
Navalpakkam, V. and Itti, L. 2005. Modeling the influence of task on attention. VisionResearch 45, 2 (January), 205–231.
Navalpakkam, V. and Itti, L. 2006. Optimal cue selection strategy. In Advances in Neural
Information Processing Systems, Vol. 19 (NIPS*2005). MIT Press, Cambridge, MA, 1–8.
Parker, R. 1978. Picture processing during recognition. Journal of Experimental Psychology—Human Perception and Performance 4, 2, 284–293.
Parkhurst, D., Law, K., and Niebur, E. 2002. Modeling the role of salience in the allocation
of overt visual attention. Vision Research 42, 1, 107–123.
Parkhurst, D. and Niebur, E. 2004. Texture contrast attracts overt visual attention in naturalscenes. European Journal of Neuroscience 19, 3 (February), 783–789.
Peli, V., Goldstein, T., and Woods, R. 2005. Scanpaths of motion sequences: where peoplelook when watching movies. In Proceedings of the Fourth Starkfest Conference on Vision andMovement in Man and Machines. School of Optometry, UC Berkeley, Berkeley, CA, 18–21.
Peters, C. and O’Sullivan, C. 2003. Bottom-up visual attention for virtual human animation.
In Computer Animation and Social Agents 2003. 111–117.
Peters, R., Iyer, A., Itti, L., and Koch, C. 2005. Components of bottom-up gaze allocationin natural images. Vision Research 45, 18, 2397–2416.
Pomplun, M. 2005. Saccadic selectivity in complex visual search displays. Vision Research 46, 12
(June), 1886–1900.
Privitera, C. and Stark, L. 1998. Evaluating image processing algorithms that predict regionsof interest. Pattern Recognition Letters 19, 11, 1037–1043.
ACM Transactions on Applied Perception, Vol. in press, No. preprint, May 2007.

Computational mechanisms of gaze direction · 21
Privitera, C. and Stark, L. 2000. Algorithms for defining visual regions-of-interest: Comparisonwith eye fixations. IEEE Transactions on Pattern Analysis and Machine Intelligence 22, 9,970–982.
Rao, R., Zelinsky, G., Hayhoe, M., and Ballard, D. 2002. Eye movements in iconic visualsearch. Vision Research 42, 11 (May), 1447–1463.
Rayner, K. 1998. Eye movements in reading and information processing: 20 years of research.Psychological Bulletin 124, 3 (November), 372–422.
Reinagel, P. and Zador, A. 1999. Natural scene statistics at the centre of gaze. Network-Computation in Neural Systems 10, 4 (November), 341–350.
Rensink, R. A. 2000. The dynamic representation of scenes. Visual Cognition 7, 17–42.
Sodhi, M., Reimer, B., Cohen, J., Vastenburg, E., Kaars, R., and Kirschenbaum, S. 2002.On-road driver eye movement tracking using head-mounted devices. In Proceedings of thesymposium on Eye Tracking Research & Applications (ETRA). 61–68.
Stampe, D. M. 1993. Heuristic filtering and reliable calibration methods for video based pupiltracking systems. Behavior Research Methods, Instruments, and Computers 25, 2, 137–142.
Terzopoulos, D. and Rabie, T. F. 1997. Animat vision: Active vision in artificial animals.Videre: Journal of Computer Vision Research 1, 1, 2–19.
Toet, A. 2006. Gaze directed displays as an enabling technology for attention aware systems.Computers in Human Behavior 22, 4 (July), 615–647.
Torralba, A. 2003. Modeling global scene factors in attention. Journal of the Optical Societyof America A-Optics Image Science and Vision 20, 7 (July), 1407–1418.
Tosi, V., Mecacci, L., and Pasquali, E. 1997. Scanning eye movements made when viewingfilm: Preliminary observations. International Journal of Neuroscience 92, 1-2, 47–52.
Treisman, A. and Gelade, G. 1980. A feature-integration theory of attention. Cognitive Psy-chology 12, 97–136.
Voge, S. 1999. Looking at paintings: Patterns of eye movements in artistically naive and sophis-ticated subjects. Leonardo 32, 4, 325–325.
Wolfe, J. and Horowitz, T. 2004. What attributes guide the deployment of visual attentionand how do they do it? Nature Reviews Neuroscience 5, 6 (June), 495–501.
Yarbus, A. 1967. Eye movements during perception of complex objects. In Eye Movements andVision, L. Riggs, Ed. Plenum Press, New York, NY.
Zetzsche, C., Schill, K., Deubel, H., Krieger, G., Umkehrer, E., and Beinlich, S. 1998.Investigation of a sensorimotor system for saccadic scene analysis: an integrated approach. InFrom animals to animats, Proceedings of the fifth international conference on the simulation
of adaptive behavior. Vol. 5. 120–126.
Received Month Year; revised Month Year; accepted Month Year
ACM Transactions on Applied Perception, Vol. in press, No. preprint, May 2007.