Applying and Measuring Ferrite Beads, Part III ... Papers/Ferrite...Applying and Measuring Ferrite...
13
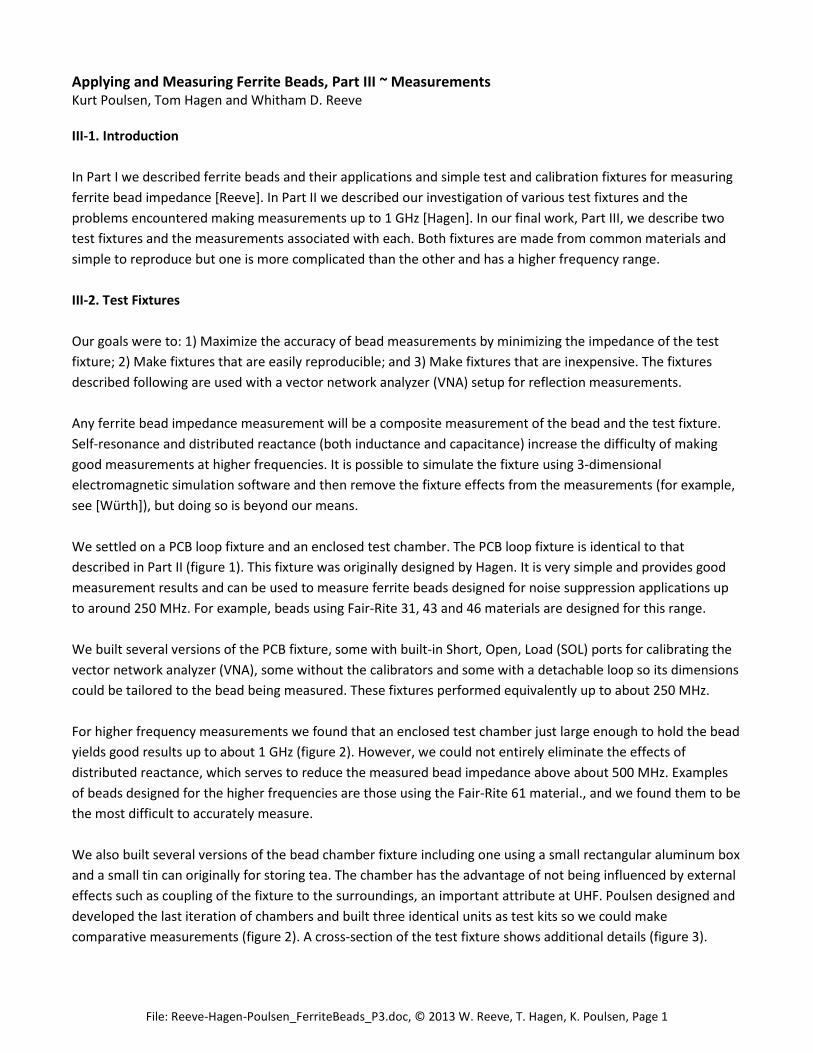
File: Reeve-Hagen-Poulsen_FerriteBeads_P3.doc, © 2013 W. Reeve, T. Hagen, K. Poulsen, Page 1 Applying and Measuring Ferrite Beads, Part III ~ Measurements Kurt Poulsen, Tom Hagen and Whitham D. Reeve III-1. Introduction In Part I we described ferrite beads and their applications and simple test and calibration fixtures for measuring ferrite bead impedance [Reeve]. In Part II we described our investigation of various test fixtures and the problems encountered making measurements up to 1 GHz [Hagen]. In our final work, Part III, we describe two test fixtures and the measurements associated with each. Both fixtures are made from common materials and simple to reproduce but one is more complicated than the other and has a higher frequency range. III-2. Test Fixtures Our goals were to: 1) Maximize the accuracy of bead measurements by minimizing the impedance of the test fixture; 2) Make fixtures that are easily reproducible; and 3) Make fixtures that are inexpensive. The fixtures described following are used with a vector network analyzer (VNA) setup for reflection measurements. Any ferrite bead impedance measurement will be a composite measurement of the bead and the test fixture. Self-resonance and distributed reactance (both inductance and capacitance) increase the difficulty of making good measurements at higher frequencies. It is possible to simulate the fixture using 3-dimensional electromagnetic simulation software and then remove the fixture effects from the measurements (for example, see [Würth]), but doing so is beyond our means. We settled on a PCB loop fixture and an enclosed test chamber. The PCB loop fixture is identical to that described in Part II (figure 1). This fixture was originally designed by Hagen. It is very simple and provides good measurement results and can be used to measure ferrite beads designed for noise suppression applications up to around 250 MHz. For example, beads using Fair-Rite 31, 43 and 46 materials are designed for this range. We built several versions of the PCB fixture, some with built-in Short, Open, Load (SOL) ports for calibrating the vector network analyzer (VNA), some without the calibrators and some with a detachable loop so its dimensions could be tailored to the bead being measured. These fixtures performed equivalently up to about 250 MHz. For higher frequency measurements we found that an enclosed test chamber just large enough to hold the bead yields good results up to about 1 GHz (figure 2). However, we could not entirely eliminate the effects of distributed reactance, which serves to reduce the measured bead impedance above about 500 MHz. Examples of beads designed for the higher frequencies are those using the Fair-Rite 61 material., and we found them to be the most difficult to accurately measure. We also built several versions of the bead chamber fixture including one using a small rectangular aluminum box and a small tin can originally for storing tea. The chamber has the advantage of not being influenced by external effects such as coupling of the fixture to the surroundings, an important attribute at UHF. Poulsen designed and developed the last iteration of chambers and built three identical units as test kits so we could make comparative measurements (figure 2). A cross-section of the test fixture shows additional details (figure 3).
Transcript of Applying and Measuring Ferrite Beads, Part III ... Papers/Ferrite...Applying and Measuring Ferrite...
File: Reeve-Hagen-Poulsen_FerriteBeads_P3.doc, © 2013 W. Reeve, T. Hagen, K. Poulsen, Page 1
Applying and Measuring Ferrite Beads, Part III ~ MeasurementsKurt Poulsen, Tom Hagen and Whitham D. Reeve
III-1. Introduction
In Part I we described ferrite beads and their applications and simple test and calibration fixtures for measuring
ferrite bead impedance [Reeve]. In Part II we described our investigation of various test fixtures and the
problems encountered making measurements up to 1 GHz [Hagen]. In our final work, Part III, we describe two
test fixtures and the measurements associated with each. Both fixtures are made from common materials and
simple to reproduce but one is more complicated than the other and has a higher frequency range.
III-2. Test Fixtures
Our goals were to: 1) Maximize the accuracy of bead measurements by minimizing the impedance of the test
fixture; 2) Make fixtures that are easily reproducible; and 3) Make fixtures that are inexpensive. The fixtures
described following are used with a vector network analyzer (VNA) setup for reflection measurements.
Any ferrite bead impedance measurement will be a composite measurement of the bead and the test fixture.
Self-resonance and distributed reactance (both inductance and capacitance) increase the difficulty of making
good measurements at higher frequencies. It is possible to simulate the fixture using 3-dimensional
electromagnetic simulation software and then remove the fixture effects from the measurements (for example,
see [Würth]), but doing so is beyond our means.
We settled on a PCB loop fixture and an enclosed test chamber. The PCB loop fixture is identical to that
described in Part II (figure 1). This fixture was originally designed by Hagen. It is very simple and provides good
measurement results and can be used to measure ferrite beads designed for noise suppression applications up
to around 250 MHz. For example, beads using Fair-Rite 31, 43 and 46 materials are designed for this range.
We built several versions of the PCB fixture, some with built-in Short, Open, Load (SOL) ports for calibrating the
vector network analyzer (VNA), some without the calibrators and some with a detachable loop so its dimensions
could be tailored to the bead being measured. These fixtures performed equivalently up to about 250 MHz.
For higher frequency measurements we found that an enclosed test chamber just large enough to hold the bead
yields good results up to about 1 GHz (figure 2). However, we could not entirely eliminate the effects of
distributed reactance, which serves to reduce the measured bead impedance above about 500 MHz. Examples
of beads designed for the higher frequencies are those using the Fair-Rite 61 material., and we found them to be
the most difficult to accurately measure.
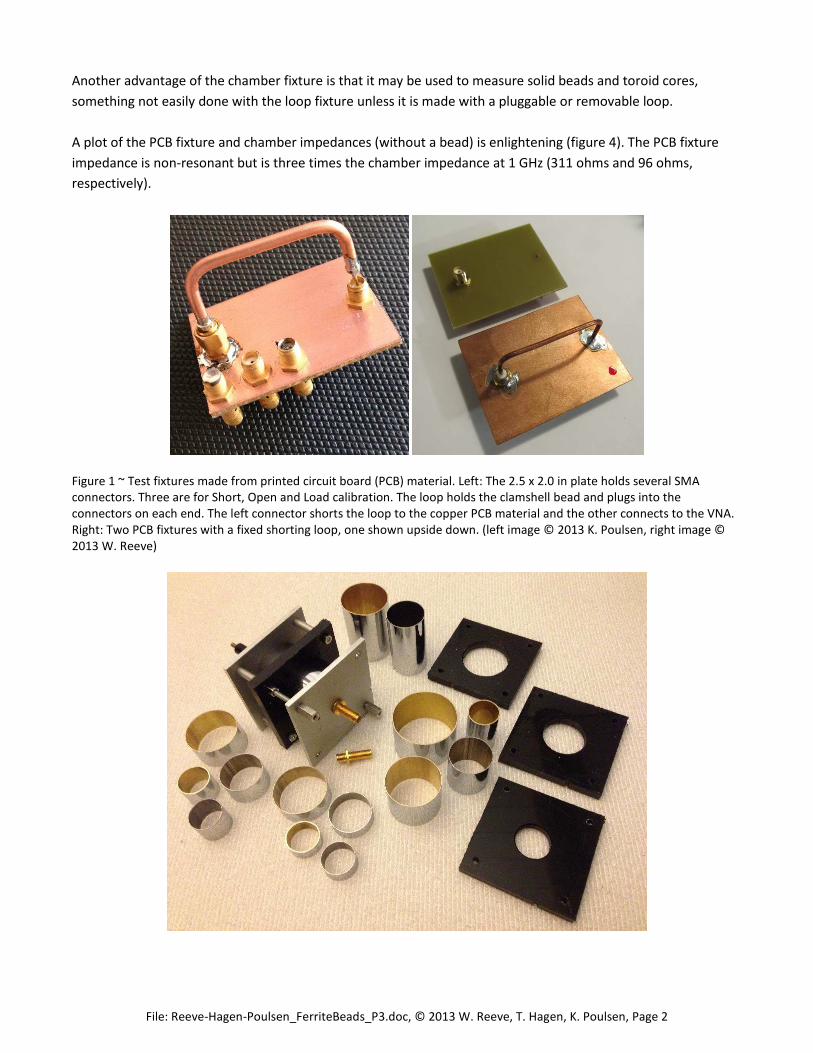
We also built several versions of the bead chamber fixture including one using a small rectangular aluminum box
and a small tin can originally for storing tea. The chamber has the advantage of not being influenced by external
effects such as coupling of the fixture to the surroundings, an important attribute at UHF. Poulsen designed and
developed the last iteration of chambers and built three identical units as test kits so we could make
comparative measurements (figure 2). A cross-section of the test fixture shows additional details (figure 3).
File: Reeve-Hagen-Poulsen_FerriteBeads_P3.doc, © 2013 W. Reeve, T. Hagen, K. Poulsen, Page 2
Another advantage of the chamber fixture is that it may be used to measure solid beads and toroid cores,
something not easily done with the loop fixture unless it is made with a pluggable or removable loop.
A plot of the PCB fixture and chamber impedances (without a bead) is enlightening (figure 4). The PCB fixture
impedance is non-resonant but is three times the chamber impedance at 1 GHz (311 ohms and 96 ohms,
respectively).
Figure 1 ~ Test fixtures made from printed circuit board (PCB) material. Left: The 2.5 x 2.0 in plate holds several SMAconnectors. Three are for Short, Open and Load calibration. The loop holds the clamshell bead and plugs into theconnectors on each end. The left connector shorts the loop to the copper PCB material and the other connects to the VNA.Right: Two PCB fixtures with a fixed shorting loop, one shown upside down. (left image © 2013 K. Poulsen, right image ©2013 W. Reeve)

File: Reeve-Hagen-Poulsen_FerriteBeads_P3.doc, © 2013 W. Reeve, T. Hagen, K. Poulsen, Page 3
Figure 2 ~ Test chamber kit designed and built by Poulsen. This fixture, shown assembled in upper-left corner, useschambers made from brass and steel plumbing pipe, removable aluminum end-caps and an adjustable length centerconductor to accommodate different tube or chamber lengths (center conductor is not visible in this image). The brass tubematerial is non-magnetic and the steel tube material is magnetic but we found very little difference in the chambermeasurements. An SMA-female connector is provided on one end-cap for reflection measurements with a VNA, and anidentical connector shown in front of the fixture is used for calibration. The black plastic guides on the right hold the variousdiameter chambers in position so they are concentric with the adjustable center conductor inside the chamber. Prior tomeasurements, a chamber tube is chosen to match the bead to be measured. The tube and plastic guide are installed andthe center conductor length is adjusted. The end-cap with connector is then installed and the fixture connected to a VNAfor s11 reflection measurements. (Image © 2013 K. Poulsen)
SMA-FConnector
3 mm thick 2 mm thick
Tube (Chamber) Length
Bead Length
ID
AdjustmentScrew
Ferrite Bead
Tube (Chamber)
Adjustment ScrewBinding Nut
Figure 3 ~ Test fixture cross-section drawing (not to scale). The adjustment screw is 3 mm diameter and has an SMAconnector pin soldered on one end. A knob is installed on the other end. Using a jig, the screw is adjusted to penetrate 1.8mm into the end-cap SMA connector. The chamber tube is chosen to be as small as possible for the ferrite bead beingmeasured. The plastic tube guide is not shown. (Image © 2013 W. Reeve)

File: Reeve-Hagen-Poulsen_FerriteBeads_P3.doc, © 2013 W. Reeve, T. Hagen, K. Poulsen, Page 4
Figure 4 ~ Smith and x-y impedance charts of empty bead fixtures. The blue and burgundy traces correspond to the x-yimpedance chart. The frequency range along the horizontal scale is 100 kHz to 1 GHz and corresponds to the 50ohm/division vertical scale impedance magnitude. The black and magenta traces correspond to the Smith Chart overlay andare shown as an alternate visualization of the impedance variation. The magenta trace on the Smith Chart and blue trace onthe x-y chart and corresponding marker data are for the PCB fixture. The black trace on the Smith Chart and burgundy traceon the x-y chart are for a 32x27N chamber (32 mm outside diameter x 26 mm long, non-magnetic chamber material). TheSmith Chart markers show normalized complex reflection coefficient. The Smith Chart traces are in the inductive reactanceregion of the chart along the outer circle (or boundary), indicating close to pure inductive reactance and close to zeroresistance. The “burbles” in the traces near 1 GHz are due to synthesizer interference in the VNWA-3E analyzer.
III-3. Measurement Results
For all measurements described here we used clamshell beads manufactured by Fair-Rite Products Corp.
(http://www.fair-rite.com/newfair/index.htm) with 31, 43, 46 and 61 materials. We compare our measurements
to their published data. Presumably, Fair-Rite data are averages based on many measurements. We know Fair-
Rite uses an impedance measurement fixture and their published data includes fixture effects (the shortest
possible lead length to accommodate the size of the part). We also know there can be at least ±20% variation in
the measured impedances of individual parts and measurement of an individual part can exceed datasheet
values by 40%.
We measured the beads listed (table 1) but present the results here only for bead part numbers 0431164181,
0443164181, 0446164181 and 0443164151 (material type is underlined). The dimensions of these parts are
given in the table.
Poulsen and Reeve found very good agreement for the 31, 43 and 46 materials but the agreement for the 61
material beads, which are designed for UHF applications, was not as good across the full set of beads measured.
Poulsen’s and Reeve’s measurements were made with the SDR-Kits VNWA-3E vector network analyzer. Hagen’s
measurements were made with a Hewlett-Packard 4396A VNA with 43961A Impedance Test Kit. We believe
Hagen’s measurement problems were due to difficulties calibrating the fixtures and taking into account the
delay offsets; however, time did not permit troubleshooting.
Table 1 ~ Fair-Rite bead dataChamber material N = Non-magnetic (brass) and M = Magnetic (steel)
Evaluation Kit P/N 0199000030 [s/n 2032577 (#1), 2023908 (#2)]31 Mat’l Clamshell p/n
(1 - 300 MHz)Bead L x W
(mm)Bead ID
(mm)Chamber OD x L-Mat’l
(mm)
0431164181 39.4 x 31.0 12.70 40x45N0431164281 39.4 x 20.0 6.30 26x45M0431167281 39.4 x 23.7 9.85 32x44N0431164951 36.2 x 17.3 4.90 26x40M0431173951 25.0 x 12.8 4.90 19x30M
Evaluation Kit P/N 0199000031 [s/n 2042901 (#5), 2042899 (#6)]43 Mat’l Clamshell p/n
(25 - 300 MHz)Bead L x W
(mm)Bead ID
(mm)Chamber OD x L-Mat’l
(mm)
0443625006 22.8 x 24.7 7.60 32x27N0443665806 21.4 x 26.3 9.20 32x27N0443806406 21.2 x 34.3 15.00 40x27N0443800506 20.6 x 29.7 12.80 40x27N0443164251 32.2 x 17.9 6.30 32x44N

File: Reeve-Hagen-Poulsen_FerriteBeads_P3.doc, © 2013 W. Reeve, T. Hagen, K. Poulsen, Page 5
0443167251 32.3 x 22.1 9.85 32x44N0443164151 32.5 x 29.0 12.70 N/A
Evaluation Kit P/N 0199000032 [s/n 1994933 (#3), 1994935 (#4)]46 Mat’l Clamshell p/n
(25-300 MHz)Bead L x W
(mm)Bead ID
(mm)Chamber OD x L-Mat’l
(mm)
0446164181 39.4 x 31.0 12.70 40x45N0446164281 39.4 x 20.0 6.30 26x45M0446167281 39.4 x 23.7 9.85 32x44N0446164951 38.2 x 17.3 4.90 26x40M
Evaluation Kit P/N 0199000033 [s/n 2042894 (#7), 2042898 (#8)]61 Mat’l Clamshell p/n
(200 - 1000 MHz)Bead L x W
(mm)Bead ID
(mm)Chamber OD x L-Mat’l
(mm)
0461164181 39.4 x 31.0 12.70 40x45N0461164281 39.4 x 20.0 6.30 26x45M0461167281 39.4 x 23.7 9.85 32x44N0461178181 23.2 x 11.8 4.10 19x30M0461164951 38.2 x 17.3 4.90 26x40M
Because of the problems Hagen experienced using the HP VNA, we present only the VNWA-3E measurements.
The VNWA-3E produces familiar x-y plots showing frequency along the horizontal axis and impedance (|Z|, R,
and X) along the vertical axis. Markers were set to indicate impedance values at specific frequencies
corresponding to the spot frequencies in the Fair-Rite datasheets. The bead part number is shown in the upper-
left text field of each chart. This text field also shows the tube dimensions for measurements made with the
chamber fixture. We also provide bar charts showing the error between our measurements and Fair-Rite data.
The Smith Chart is another method of presenting impedance data (example in figure 5) but only the x-y charts
are given here.
File: Reeve-Hagen-Poulsen_FerriteBeads_P3.doc, © 2013 W. Reeve, T. Hagen, K. Poulsen, Page 6
Figure 5 ~ Example Smith Chart showing a 46 material bead as measured in a 26 x 45 mm chamber. The bead impedance isalmost purely inductive at 1 MHz (marker 1) and lower but becomes more resistive as the frequency increases toapproximately 250 MHz (marker 6), at which point the reactance is zero (resonance). As the frequency increases further,the reactance becomes predominately capacitive.
31, 43 and 46 materials:
We measured 31, 43 and 46 materials with both the PCB loop fixture and chamber fixture. Depending on the
bead material, the Fair-Rite datasheets show tabulated impedances at spot frequencies of 1, 5, 10, 25, 100 and
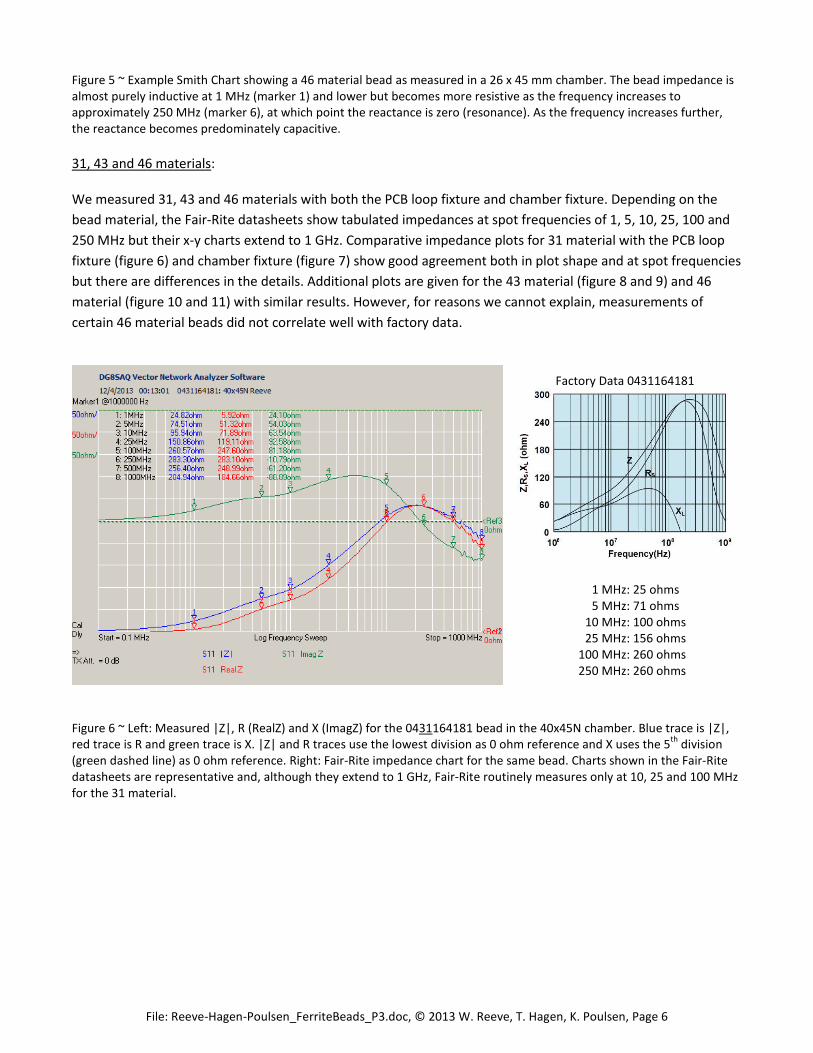
250 MHz but their x-y charts extend to 1 GHz. Comparative impedance plots for 31 material with the PCB loop
fixture (figure 6) and chamber fixture (figure 7) show good agreement both in plot shape and at spot frequencies
but there are differences in the details. Additional plots are given for the 43 material (figure 8 and 9) and 46
material (figure 10 and 11) with similar results. However, for reasons we cannot explain, measurements of
certain 46 material beads did not correlate well with factory data.
Factory Data 0431164181
1 MHz: 25 ohms5 MHz: 71 ohms
10 MHz: 100 ohms25 MHz: 156 ohms
100 MHz: 260 ohms250 MHz: 260 ohms
Figure 6 ~ Left: Measured |Z|, R (RealZ) and X (ImagZ) for the 0431164181 bead in the 40x45N chamber. Blue trace is |Z|,red trace is R and green trace is X. |Z| and R traces use the lowest division as 0 ohm reference and X uses the 5
thdivision
(green dashed line) as 0 ohm reference. Right: Fair-Rite impedance chart for the same bead. Charts shown in the Fair-Ritedatasheets are representative and, although they extend to 1 GHz, Fair-Rite routinely measures only at 10, 25 and 100 MHzfor the 31 material.

File: Reeve-Hagen-Poulsen_FerriteBeads_P3.doc, © 2013 W. Reeve, T. Hagen, K. Poulsen, Page 7
Factory Data 0431164181
1 MHz: 25 ohms5 MHz: 71 ohms
10 MHz: 100 ohms25 MHz: 156 ohms
100 MHz: 260 ohms250 MHz: 260 ohms
Figure 7 ~ Left: Measured |Z|, R (RealZ) and X (ImagZ) for the 0431164181 bead in the PCB fixture. Trace colors and scalesare the same as for the chamber fixture except that the reactance trace (green) is shown with a division zero reference.Right: Fair-Rite impedance chart and spot frequency data for the same bead.
Factory Data 0443164251
10 MHz: 90 ohms25 MHz: 156 ohms
100 MHz: 250 ohms250 MHz: 305 ohms
Figure 8 ~ Left: Measured |Z|, R (RealZ) and X (ImagZ) for the 0443164251 bead in the 32x44N chamber. Right: Fair-Riteimpedance chart and spot frequency data for the same bead.

File: Reeve-Hagen-Poulsen_FerriteBeads_P3.doc, © 2013 W. Reeve, T. Hagen, K. Poulsen, Page 8
Factory Data 0443164251
10 MHz: 90 ohms25 MHz: 156 ohms
100 MHz: 250 ohms250 MHz: 305 ohms
Figure 9 ~ Left: Measured |Z|, R (RealZ) and X (ImagZ) for the 0443164251 bead in the PCB fixture. Right: Fair-Riteimpedance chart and spot frequency data for the same bead.
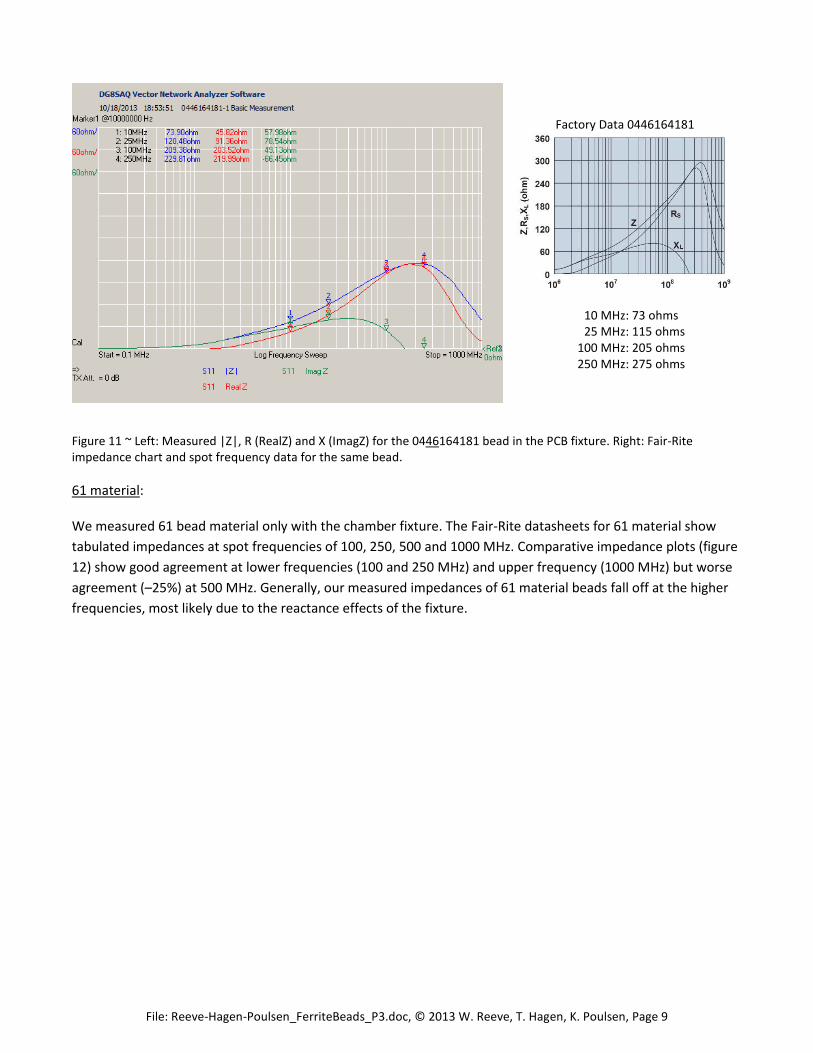
Factory Data 0446164181
10 MHz: 73 ohms25 MHz: 115 ohms
100 MHz: 205 ohms250 MHz: 275 ohms
Figure 10 ~ Left: Measured |Z|, R (RealZ) and X (ImagZ) for the 0446164181 bead in the 40x45N chamber. Right: Fair-Riteimpedance chart and spot frequency data for the same bead.
File: Reeve-Hagen-Poulsen_FerriteBeads_P3.doc, © 2013 W. Reeve, T. Hagen, K. Poulsen, Page 9
Factory Data 0446164181
10 MHz: 73 ohms25 MHz: 115 ohms
100 MHz: 205 ohms250 MHz: 275 ohms
Figure 11 ~ Left: Measured |Z|, R (RealZ) and X (ImagZ) for the 0446164181 bead in the PCB fixture. Right: Fair-Riteimpedance chart and spot frequency data for the same bead.
61 material:
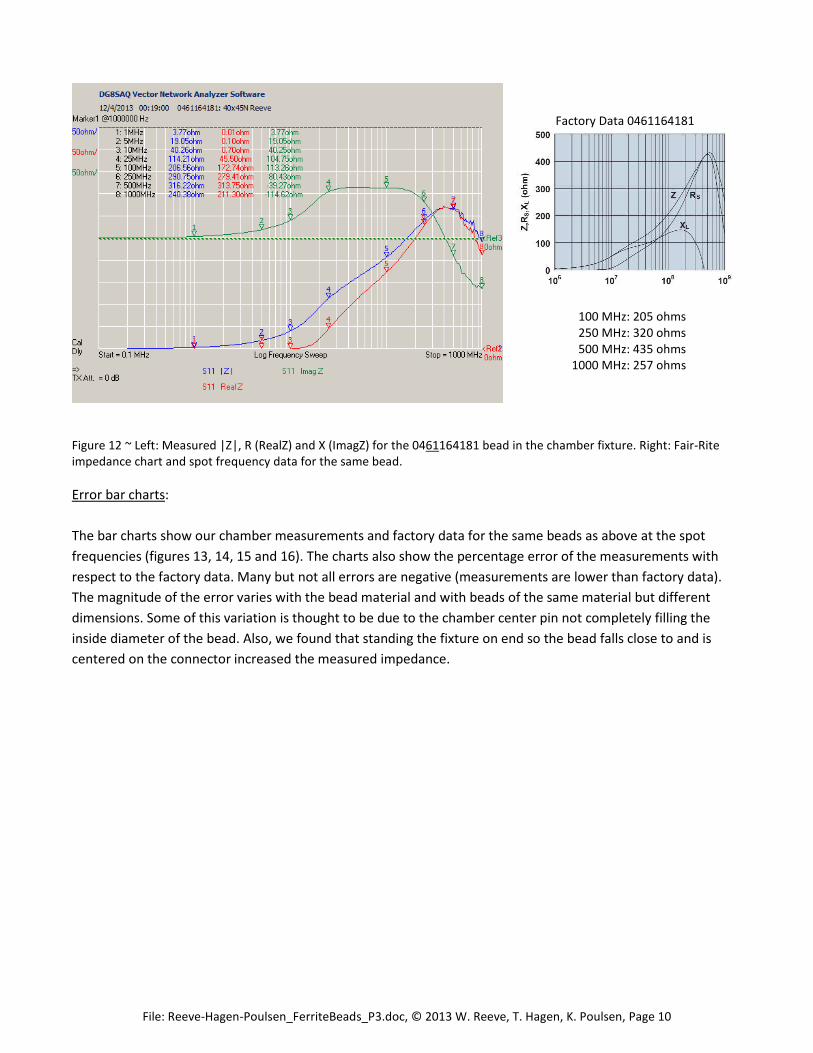
We measured 61 bead material only with the chamber fixture. The Fair-Rite datasheets for 61 material show
tabulated impedances at spot frequencies of 100, 250, 500 and 1000 MHz. Comparative impedance plots (figure
12) show good agreement at lower frequencies (100 and 250 MHz) and upper frequency (1000 MHz) but worse
agreement (–25%) at 500 MHz. Generally, our measured impedances of 61 material beads fall off at the higher
frequencies, most likely due to the reactance effects of the fixture.
File: Reeve-Hagen-Poulsen_FerriteBeads_P3.doc, © 2013 W. Reeve, T. Hagen, K. Poulsen, Page 10
Factory Data 0461164181
100 MHz: 205 ohms250 MHz: 320 ohms500 MHz: 435 ohms
1000 MHz: 257 ohms
Figure 12 ~ Left: Measured |Z|, R (RealZ) and X (ImagZ) for the 0461164181 bead in the chamber fixture. Right: Fair-Riteimpedance chart and spot frequency data for the same bead.
Error bar charts:
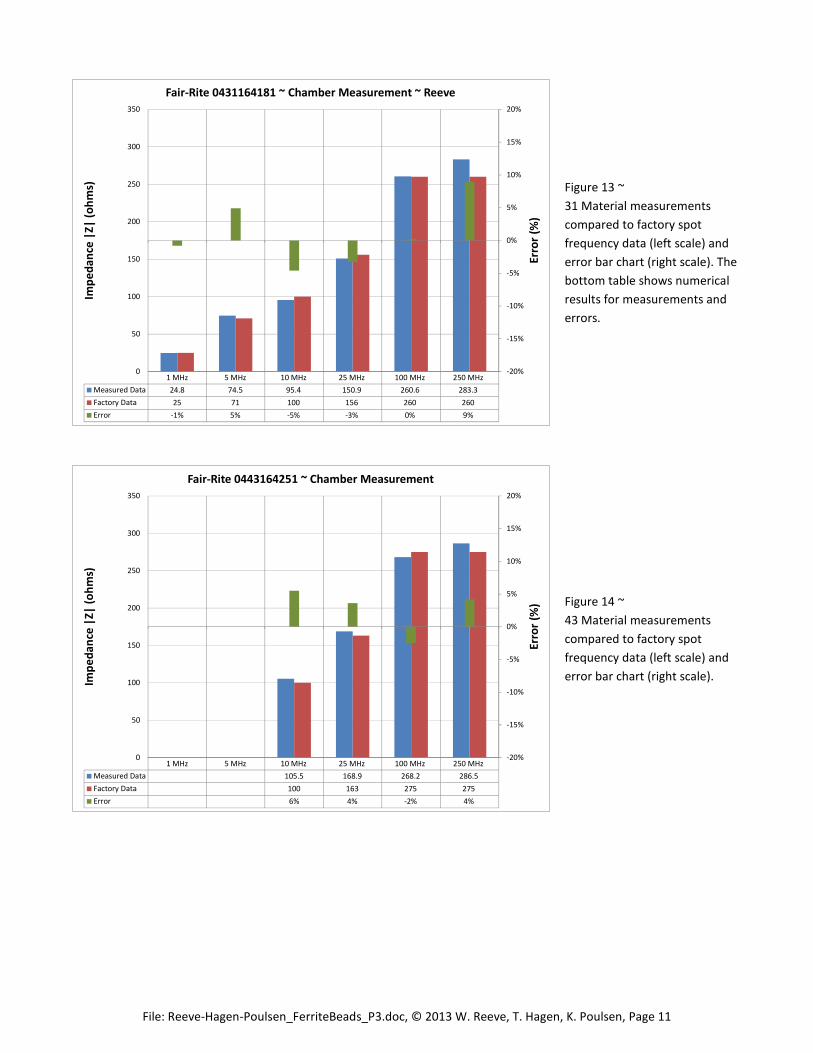
The bar charts show our chamber measurements and factory data for the same beads as above at the spot
frequencies (figures 13, 14, 15 and 16). The charts also show the percentage error of the measurements with
respect to the factory data. Many but not all errors are negative (measurements are lower than factory data).
The magnitude of the error varies with the bead material and with beads of the same material but different
dimensions. Some of this variation is thought to be due to the chamber center pin not completely filling the
inside diameter of the bead. Also, we found that standing the fixture on end so the bead falls close to and is
centered on the connector increased the measured impedance.
File: Reeve-Hagen-Poulsen_FerriteBeads_P3.doc, © 2013 W. Reeve, T. Hagen, K. Poulsen, Page 11
1 MHz 5 MHz 10 MHz 25 MHz 100 MHz 250 MHz
Measured Data 24.8 74.5 95.4 150.9 260.6 283.3
Factory Data 25 71 100 156 260 260
Error -1% 5% -5% -3% 0% 9%
-20%
-15%
-10%
-5%
0%
5%
10%
15%
20%
0
50
100
150
200
250
300
350
Erro
r(%
)
Imp
ed
ance
|Z|
(oh
ms)
Fair-Rite 0431164181 ~ Chamber Measurement ~ Reeve
Figure 13 ~
31 Material measurements
compared to factory spot
frequency data (left scale) and
error bar chart (right scale). The
bottom table shows numerical
results for measurements and
errors.
1 MHz 5 MHz 10 MHz 25 MHz 100 MHz 250 MHz
Measured Data 105.5 168.9 268.2 286.5
Factory Data 100 163 275 275
Error 6% 4% -2% 4%
-20%
-15%
-10%
-5%
0%
5%
10%
15%
20%
0
50
100
150
200
250
300
350
Erro
r(%
)
Imp
ed
ance
|Z|
(oh
ms)
Fair-Rite 0443164251 ~ Chamber Measurement
Figure 14 ~
43 Material measurements
compared to factory spot
frequency data (left scale) and
error bar chart (right scale).

File: Reeve-Hagen-Poulsen_FerriteBeads_P3.doc, © 2013 W. Reeve, T. Hagen, K. Poulsen, Page 12
1 MHz 5 MHz 10 MHz 25 MHz 100 MHz 250 MHz
Measured Data 74.1 116.5 188.0 209.9
Factory Data 73 115 205 275
Error 2% 1% -8% -24%
-20%
-15%
-10%
-5%
0%
5%
10%
15%
20%
0
50
100
150
200
250
300
Erro
r(%
)
Imp
ed
ance
|Z|
(oh
ms)
Fair-Rite 0446164181 ~ Chamber Measurements
Figure 15 ~
46 Material measurements
compared to factory spot
frequency data (left scale) and
error bar chart (right scale).
1 MHz 5 MHz 10 MHz 25 MHz 100 MHz 250 MHz 500 MHz 1000 MHz
Measured Data 206.6 290.8 316.2 240.4
Factory Data 205 320 435 257
Error 1% -9% -27% -6%
-20%
-15%
-10%
-5%
0%
5%
10%
15%
20%
0
50
100
150
200
250
300
350
400
450
500
Erro
r(%
)
Imp
ed
ance
|Z|
(oh
ms)
Fair-Rite 0461164181 Chamber Measurement
Figure 16 ~
61 Material measurements
compared to factory spot
frequency data (left scale) and
error bar chart (right scale).
III-5. Future Work
The software used with the VNWA-3E (and other modern software controlled vector network analyzers) allow
mathematical manipulation and customized traces to be produced from measured data. This manipulation can
be used to compensate for test fixture impedances at the higher frequencies. For example, by taking into
account the deviation of the test chamber’s ideal inductance from its measured impedance and including

File: Reeve-Hagen-Poulsen_FerriteBeads_P3.doc, © 2013 W. Reeve, T. Hagen, K. Poulsen, Page 13
geometrical and dimensional characteristics of the chambers, we believe we can improve measurement quality
above 500 MHz. At the same time, we believe we can accurately measure complex permeability of the ferrites.
This work will be reported in the future as time permits.
III-6. Conclusions
We described measurements of Fair-Rite beads made from type 31, 43, 46 and 61 materials up to 1 GHz using
two fixture types, a PCB loop fixture and a chamber fixture. The chamber fixture provides better results above
about 500 MHz when used with a carefully calibrated VNWA-3E. However, the results of measurements using an
HP vector network analyzer were not as good, possibly due to calibration difficulties.
III-7. References
[Hagen] Hagen, T., Poulsen, K, and Reeve, W., Applying and Measuring Ferrite Beads, Part II ~ Test Fixtures,
Radio Astronomy, September-October, 2013
[Reeve] Reeve, W. and Hagen, T., Part I ~ Ferrite Bead Properties and Test Fixture, Applying and Measuring
Ferrite Beads, Radio Astronomy, July-August, 2013
[Würth] Brander, T., Gerfer, A., Rall, B., and Zenkner, H., Trilogy of Magnetics – Design Guide for EMI Filter
Design, SMPS and RF Circuits, 4th ed., Würth Elektronik, 2010, ISBN: 978-3-89929-157-5