Applied Neuroscience, Inc · 2019-10-31 · electrical rhythms in the EEG arise from many sources...
25
Applied Neuroscience, Inc 8200 Bryan Dairy Road Suite #300, Largo, Florida 33777 USA Phone: 727-244-0240 Fax: 727-392-1436 Email: [email protected] Quantitative EEG Analyses PATIENT INFORMATION RECORDING Name: Doe, John Date: 10/29/2019 Exam#: Doe, John_EC Ref. By: Dr. Who Age: 59.05 Test Site: Big City, NY Gender: Male Analysis Length: 02:00 Handedness: Right Ave. SH Reliability: 0.98 Eyes: Closed Ave. TRT Reliability: 0.95 MEDICATION: Paxil, Seroquel HISTORY: Depression - Bipolar - Several concussions in his youth including a fall out of a tree, being struck with a hatchet, and hitting a head on a support pole - bilateral tinnitus SUMMARY: The qEEG analyses were deviant from normal and showed dysregulation in bilateral frontal lobes - especially in the left frontal lobe, bilateral temporal lobes - especially in the right temporal lobe, and the left parietal lobe. LORETA showed dysregulation in the left precentral gyrus and right frontal eye field. The frontal lobes are involved in executive functioning, abstract thinking, expressive language, sequential planning, mood control, and social skills. The temporal lobes are involved in auditory information processing, short-term memory, receptive language on the left, and face recognition on the right. The parietal lobes are involved in visual-spatial information processing, short-term memory, executive attention, receptive language on the left, and empathy control and awareness of emotional expression in others on the right (e.g., prosody). The precentral gyrus is involved in skilled motor movements, frontal eye fields and voluntary movement. The frontal eye fields are involved in voluntary eye control and focusing of visual attention. To the extent there is deviation from normal electrical patterns in these structures, then sub-optimal functioning is expected. Robert W Thatcher, PhD, QEEG-D, BCIA, ECNS
Transcript of Applied Neuroscience, Inc · 2019-10-31 · electrical rhythms in the EEG arise from many sources...

Applied Neuroscience, Inc 8200 Bryan Dairy Road Suite #300, Largo, Florida 33777 USA
Phone: 727-244-0240 Fax: 727-392-1436 Email: [email protected]
Quantitative EEG Analyses PATIENT INFORMATION RECORDING
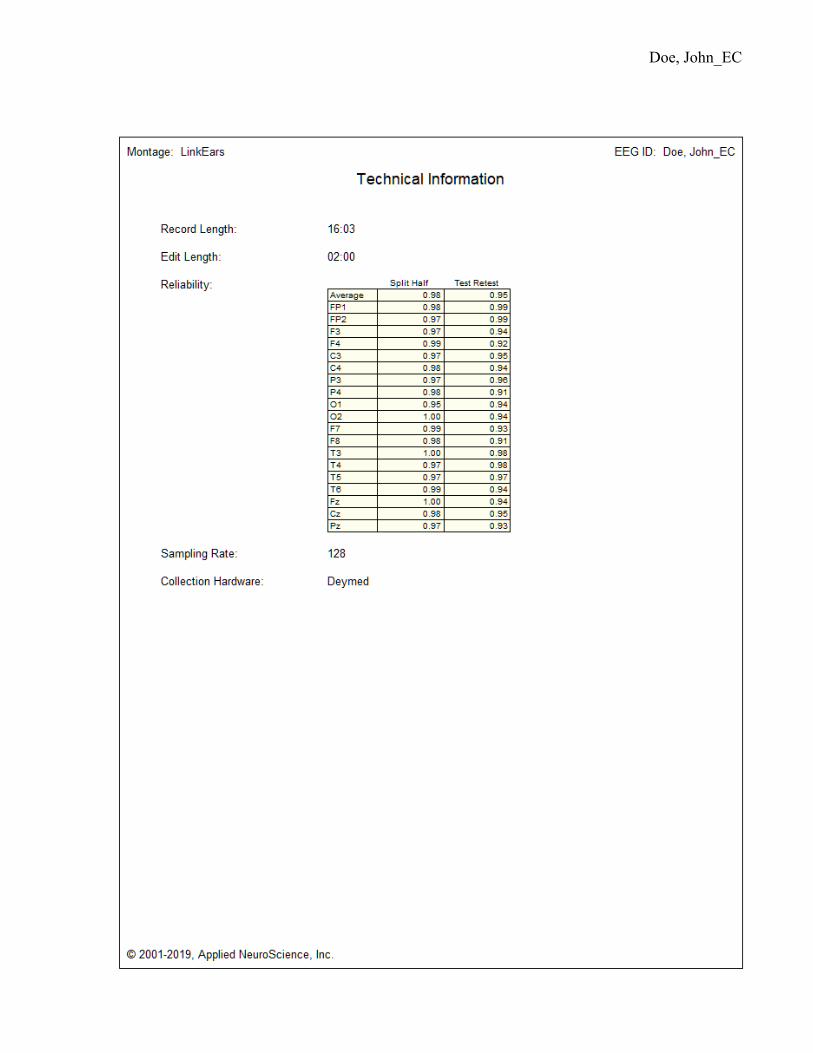
Name: Doe, John Date: 10/29/2019 Exam#: Doe, John_EC Ref. By: Dr. Who Age: 59.05 Test Site: Big City, NY Gender: Male Analysis Length: 02:00 Handedness: Right Ave. SH Reliability: 0.98 Eyes: Closed Ave. TRT Reliability: 0.95
MEDICATION: Paxil, Seroquel
HISTORY: Depression - Bipolar - Several concussions in his youth including a fall out of a tree, being struck with a hatchet, and hitting a head on a support pole - bilateral tinnitus
SUMMARY: The qEEG analyses were deviant from normal and showed dysregulation in bilateral frontal lobes - especially in the left frontal lobe, bilateral temporal lobes - especially in the right temporal lobe, and the left parietal lobe. LORETA showed dysregulation in the left precentral gyrus and right frontal eye field. The frontal lobes are involved in executive functioning, abstract thinking, expressive language, sequential planning, mood control, and social skills. The temporal lobes are involved in auditory information processing, short-term memory, receptive language on the left, and face recognition on the right. The parietal lobes are involved in visual-spatial information processing, short-term memory, executive attention, receptive language on the left, and empathy control and awareness of emotional expression in others on the right (e.g., prosody). The precentral gyrus is involved in skilled motor movements, frontal eye fields and voluntary movement. The frontal eye fields are involved in voluntary eye control and focusing of visual attention. To the extent there is deviation from normal electrical patterns in these structures, then sub-optimal functioning is expected.
Robert W Thatcher, PhD, QEEG-D, BCIA, ECNS
Doe, John_EC
2
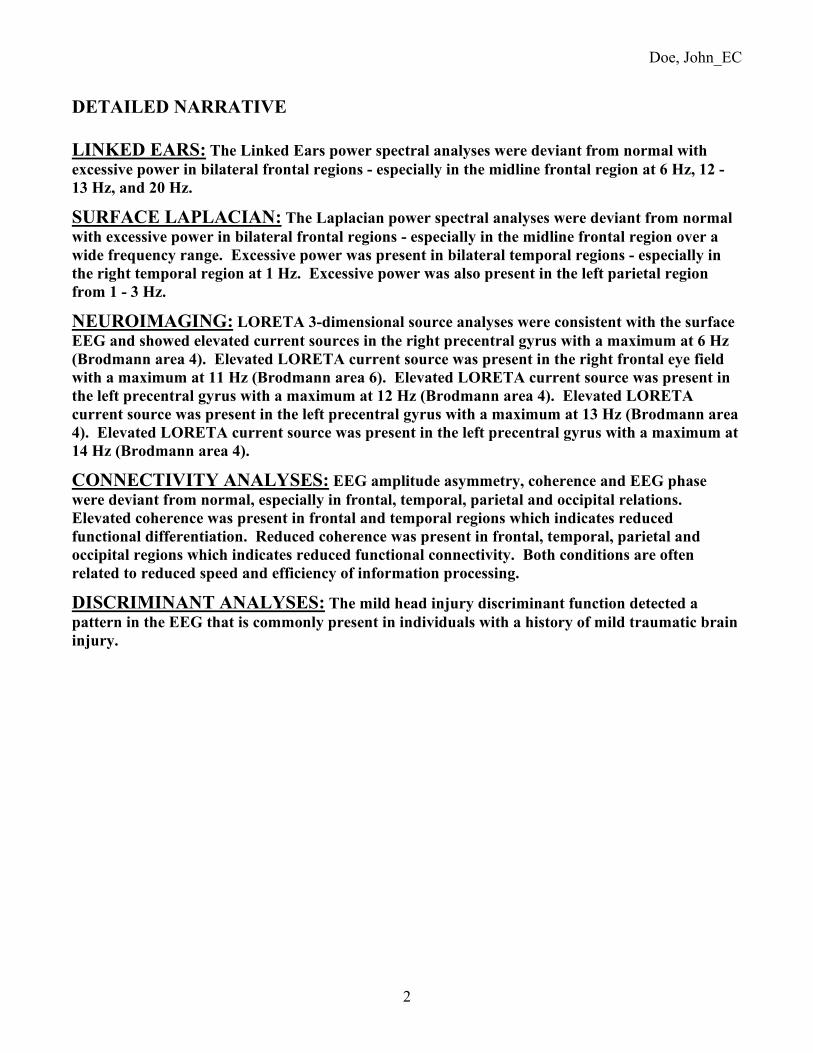
DETAILED NARRATIVE LINKED EARS: The Linked Ears power spectral analyses were deviant from normal with excessive power in bilateral frontal regions - especially in the midline frontal region at 6 Hz, 12 - 13 Hz, and 20 Hz.
SURFACE LAPLACIAN: The Laplacian power spectral analyses were deviant from normal with excessive power in bilateral frontal regions - especially in the midline frontal region over a wide frequency range. Excessive power was present in bilateral temporal regions - especially in the right temporal region at 1 Hz. Excessive power was also present in the left parietal region from 1 - 3 Hz.
NEUROIMAGING: LORETA 3-dimensional source analyses were consistent with the surface EEG and showed elevated current sources in the right precentral gyrus with a maximum at 6 Hz (Brodmann area 4). Elevated LORETA current source was present in the right frontal eye field with a maximum at 11 Hz (Brodmann area 6). Elevated LORETA current source was present in the left precentral gyrus with a maximum at 12 Hz (Brodmann area 4). Elevated LORETA current source was present in the left precentral gyrus with a maximum at 13 Hz (Brodmann area 4). Elevated LORETA current source was present in the left precentral gyrus with a maximum at 14 Hz (Brodmann area 4).
CONNECTIVITY ANALYSES: EEG amplitude asymmetry, coherence and EEG phase were deviant from normal, especially in frontal, temporal, parietal and occipital relations. Elevated coherence was present in frontal and temporal regions which indicates reduced functional differentiation. Reduced coherence was present in frontal, temporal, parietal and occipital regions which indicates reduced functional connectivity. Both conditions are often related to reduced speed and efficiency of information processing.
DISCRIMINANT ANALYSES: The mild head injury discriminant function detected a pattern in the EEG that is commonly present in individuals with a history of mild traumatic brain injury.

Doe, John_EC
3

Doe, John_EC
4

Doe, John_EC
5
Electrical NeuroImaging Linking a patient's symptoms and complaints to functional systems in the brain is important in evaluating the health and efficiency of cognitive and perceptual functions. The electrical rhythms in the EEG arise from many sources but approximately 50% of the power arises directly beneath each recording electrode. Electrical NeuroImaging uses a mathematical method called an "Inverse Solution" to accurately estimate the sources of the scalp EEG (Pascual-Marqui et al, 1994; Pascual-Marqui, 1999). Below is a Brodmann map of anatomical brain regions that lie near to each 10/20 scalp electrode with associated functions as evidenced by fMRI, EEG/MEG and PET NeuroImaging methods.

Doe, John_EC
6

Doe, John_EC
7

Doe, John_EC
8

Doe, John_EC
9

Doe, John_EC
10

Doe, John_EC
11

Doe, John_EC
12

Doe, John_EC
13

Doe, John_EC
14

Doe, John_EC
15

Doe, John_EC
16

Doe, John_EC
17

Doe, John_EC
18

Doe, John_EC
19
Doe, John_EC
20
Doe, John_EC
21
An Addendum to NeuroGuide QEEG Report Important Disclaimer: QEEG tests are ancillary tests that are not intended to provide a diagnosis by themselves, but are used to evaluate the nature and severity of deregulation in the brain such as in mild traumatic brain injury (MTBI). The QEEG tests provide a quantitative assessment of areas of brain dysfunction and information on impaired conduction and connectivity between different regional neural networks in the brain. The assessment of impaired connectivity is based on abnormal measurements of Coherence and Phase. The TBI Discriminant and Concussion Index do not provide a diagnosis for MTBI but only information on the presence of a pattern in the EEG that is often found in patients with a history of mild traumatic brain injury. The TBI Discriminant and Concussion Index also provide information about connectivity and excitability of brain regions. The TBI Discriminant and Concussion Index are to be used only on patients with a clinical history and symptoms of a Traumatic Brain Injury and Post Concussion syndrome. The diagnosis of MTBI is a clinical one and is not based on any one test. A diagnosis is performed by the clinician, who integrates the medical history, clinical symptoms, neurocognitive tests with the abovementioned brain function tests as well as other information to render a diagnosis. The information on impaired brain connectivity is derived primarily from abnormal measurements of Coherence and Phase. Assessments of regional abnormality rely also on abnormal amplitude (power) distribution across the spectrum of EEG frequencies as compared to the normative database. Artifact Rejection: NeuroGuide uses the standard deletion of artifact method to only select artifact free EEG data for analyses. The entire EEG record must be viewed by clicking end and page down and page up and home and by arrow keys and by moving the wiper at the bottom of the screen. A careful visual examination of the EEG record is necessary to detect epilepsy and gross pathology as well as to identify artifacts. The goal is to avoid selecting any artifact and instead to only select artifact free segments of EEG. There are three methods of obtaining Artifact Free Selections: 1- Manual Selections are obtained by pressing the left mouse button and dragging to select, press right mouse button and drag to erase; 2- Artifact Free Template Matching; and 3- Z Score Artifact Free Selections. All three methods can be used and manual selection takes priority over all methods of artifact free selection. That is, left and right mouse button dragging will override all other methods. View the Length of EEG Selections in seconds and View the dynamic Reliability Measures of the EEG Selections. For Manual Selections of Artifact Free EEG Depress the left mouse button and drag it over the sections of EEG that do not contain eye movement or muscle or drowsiness or head movement or any other type of artifact. Select at least 60 seconds of artifact free EEG data as shown in the Edit Time counter (upper left of screen). If a mistake is made, then right mouse click and drag over the EEG traces to erase a selection. View the Test Re-Test reliability which must be at least 0.90. Scan the EEG record and select real and valid EEG and avoid selecting artifact. Splice discontinuities are removed by filtering and exercises to prove no distortion due to splicing are available in the Handbook of QEEG and EEG Biofeedback. Pattern recognition routines are used to identify likely eye movement (EOG), drowsiness and muscle (EMG) artifact in the record and thereby mark these suspected segments and disallow them to be included in subsequent analyses. The pattern recognition routines are based on physics and physiology of artifact. For example, all electrical sources decrement with distance and in the case of eye movement detection is by the presence of an electrical field gradient in the delta frequency band from Fp1/2 > F3/4 > C3/4 and/or 120 degrees or higher of inverse phase between F7 and F8. EMG electrical gradients at > 10 Hz from T3/4 > C3/4 and/or Fp1/2 > F3/4 > C3/4 and/or O1/2 > P3/4. Drowsiness occurs when the locus coeruleus reduces inhibition on the hypothalamic sleep centers resulting in 2 - 4 Hz action potential bursting that projects to the ventral posterior thalamic relay nuclei. Drowsiness pattern detection involves elevated slow waves in the EEG maximal in Cz and Fz as well as alpha slowing. NeuroGuide does not use any regression methods to allegedly remove artifact such as ICA/PCA or Blind Source or unpublished methods like SARA that distort Phase and Coherence and other aspects of the Power Spectrum. Details and tutorials demonstrating how the ICA and regression methods distort Phase and Coherence are available at: https://www.appliedneuroscience.com/PDFs/Tutorial_Adulteration_Phase_Relations_when_using_ICA.pdf.

Doe, John_EC
22
Split Half and Test Re-Test Reliability: Split-Half (SH) reliability is the ratio of variance between the even and odd seconds of the time series of selected digital EEG (variance = sum of the square of the deviation of each time point from the mean of the time points). Examine the average reliability and the reliability of each channel as you increase the length of the sample and manually select different segments. Selection of artifact free EEG should have a reliability > 0.95 and a sample length of edited EEG > 60 seconds. Test Re-Test (TRT) reliability is the ratio of variance between the first half vs. the second half of the selected EEG segments (variance = sum of the square of the deviation of each time point from the mean of the time points). Test Re-Test reliability > 0.90 and a sample length of edited EEG > 60 seconds is commonly published in the scientific literature. Test Re-Test reliability is an excellent statistic to compare Brain state changes such as drowsiness as well as the consistency of a measure independent of changes in brain state. Description of the NeuroGuide Normative Database: The NeuroGuide normative database in versions 1.0 to 2.4.6 included a total of 678 carefully screened individual subjects ranging in age from 2 months to 82 years. NG 2.6.8 involved the addition of 49 adult subjects ranging in age from 18.3 years to 72.6 years resulting in a normative database of 727 subjects. The inclusion/exclusion criteria, demographics, neuropsychological tests, Gaussian distribution tests and cross- validation tests are described in several peer reviewed publications (Thatcher et al, 1983; 1987; 2003). Two year means were computed using a sliding average with 6 month overlap of subjects. This produced a stable and higher age resolution normative database with a total of 21 different age groups. The 21 age groups and age ranges and number of subjects per age group is shown in the bar graph in Appendix F figure 2 in the NeuroGuide Manual (click Help > NeuroGuide Help). The individuals used to create the normative database met specific clinical standards of no history of neurological disorders, no history of behavioral disorders, performed at grade level in school, etc. Most of the subjects in the normative database were given extensive neuropsychological tests. Details of the normative database are published at: Thatcher, R.W., Walker, R.A. and Guidice, S. Human cerebral hemispheres develop at different rates and ages. Science, 236: 1110-1113, 1987 and Thatcher R.W., Biver, C.L., North, D., Curtin, R. and Walker, R.W. Quantitative EEG Normative Databases: Validation and Clinical Correlation. Journal of Neurotherapy, 2003, 7(3-4): 87-121. You can download a description of the normative database by going to www.appliedneuroscience.com and clicking on the webpage Articles & Links > Articles > Article #5. Is there a normative database for different montages including bipolar montages? Yes. The raw digital data from the same group of normal subjects is analyzed using different montages such as Average Reference, Laplacian current source density, a common reference based on all 19 channels of the 10/20 system and standard clinical bipolar montages (e.g., longitudinal, circular, transverse). Users can create any montage that they wish and there will be a normative reference database comparison available for both eyes closed and eyes open conditions. Age range of the LORETA Current Density and Source Correlation Normative Databases The LORETA current density and source correlation norms use the same subjects as are used for the surface EEG norms and the age range is 2 months to 82 years. The computational details of the LORETA current density norms are published at: Thatcher, R.W., North, D., Biver, C. EEG inverse solutions and parametric vs. non-parametric statistics of Low Resolution Electromagnetic Tomography (LORETA). Clin. EEG and Neuroscience, 36(1): 1-9, 2005 and Thatcher, R.W., North, D., Biver, C. Evaluation and Validity of a LORETA normative EEG database. Clin. EEG and Neuroscience, 2005, 36(2): 116-122. Copies of these publications are available to download from www.appliedneuroscience.com by clicking Articles & Links > Articles > Numbers 11 and 12. The computational details of the LORETA source correlation norms are in the NeuroGuide Manual, click Help > NeuroGuide Help > Appendix-G.
Doe, John_EC
23
Implementation of LORETA measurement in NeuroGuide The Key Institute’s LORETA equations and the LORETA viewer (Pacual-Marqui et al, 1994; Pascual- Marqui, 1999) can be launched by a single mouse click in the NeuroGuide window. NeuroGuide exports frequency domain and time domain edits of 19 channel x 256 point digital EEG in microvolts (or uv^2) in the Lexicor electrode order as the standard input to the Key Institute T-Matrix. Rows are 256 microvolt time points and the columns are 19 channels at a sample rate of 128 thus producing 0.5 Hz resolution from 1 to 30 Hz. 1 Hz increments in the LORETA viewer are computed as the sum of adjacent 0.5 Hz bins and thus the ‘Time Frame’ control in the LORETA Viewer is frequency from 1 to 30 Hz. (see Pascual-Marqui RD, Michel CM, Lehmann D., 1994. Low resolution electromagnetic tomography: a new method for localizing electrical activity in the brain. International J. of Psychophysiology, 18:49-65. For computational details see: Pascual-Marqui. R.D., 1999. Review of Methods for Solving the EEG Inverse Problem. International J. of Bioelectromagnetism, 1(1): 75-86. Pascual-Margui, R.D., 2004. The Key Institute’s free software and documentation was downloaded from www.unizh.ch/keyinst/NewLORETA/Software/Software.htm.) Amplifier Matching is Necessary This stems from the fact that amplifiers have different frequency gain characteristics. The matching of amplifiers to the NeuroGuide database amplifier was done by injecting microvolt calibration signals of different amplitudes and frequencies into the input of the respective EEG machines and then computing correction curves to exactly match the amplifier characteristics of the norms and discriminant functions. The units of comparison are in microvolts and a match within 3% is generally achieved. The NeuroGuide research team double checked the amplifier match by computing FFT and digital spectral analyses on calibration signals used to acquire the norms with the calibration signals used to evaluate a given manufacturers amplifiers. History of the Scientific Standards of QEEG Normative Databases A review of the history of QEEG normative databases was published in Thatcher, R.W. and Lubar, J.F. History of the scientific standards of QEEG normative databases. In: Introduction to QEEG and Neurofeedback: Advanced Theory and Applications, T. Budzinsky, H. Budzinsky, J. Evans and A. Abarbanel (eds)., Academic Press, San Diego, CA, 2008. A copy of the publication can be downloaded at: https://www.appliedneuroscience.com/PDFs/History_of_QEEG_Databases.pdf. QEEG Normative Database Publications and Validations: Bosch-Bayard J, Valdes-Sosa P, Virues-Alba T, Aubert-Vazquez E, John ER, Harmony T, Riera-Diaz J, Trujillo-Barreto N.(2001). 3D statistical parametric mapping of EEG source spectra by means of variable resolution electromagnetic tomography (VARETA). Clin Electroencephalogr., 32(2):47-61. Coburn, K.L., Lauterback, E.C., Boutros, N.N., Black, K.J., Arciniegas, D.B. and Coffey, C.E. (2006). The value of quantitative electroencephalography in clinical psychiatry: A report by the committee on research of the American Neuropsychiatric Association. J. Neuropsychiat. and Clin. Neurosci. 18: 460-500. Congedo M, John RE, De Ridder D, Prichep L. (2010). Group independent component analysis of resting state EEG in large normative samples. Int J Psychophysiol. 78(2):89-99. Congedo M, John RE, De Ridder D, Prichep L, Isenhart R. (2010). On the "dependence" of "independent" group EEG sources; an EEG study on two large databases. Brain Topogr., 23(2):134-138. Hernandez-Gonzalez G, Bringas-Vega ML, Galán-Garcia L, Bosch-Bayard J, Lorenzo-Ceballos Y, Melie-Garcia L, Valdes-Urrutia L, Cobas-Ruiz M, Valdes-Sosa PA; Cuban Human Brain Mapping Project (CHBMP). (2011).

Doe, John_EC
24
Multimodal quantitative neuroimaging databases and methods: the Cuban Human Brain Mapping Project. Clin EEG Neurosci., 42(3):149-59. Duffy, F., Hughes, J. R., Miranda, F., Bernad, P. & Cook, P. (1994). Status of quantitative EEG (QEEG) in clinical practice. Clinical. Electroencephalography, 25(4), VI - XXII. Gasser, T., Verleger, R., Bacher, P., & Sroka, L. (1988a). Development of the EEG of school-age children and adolescents. I. Analysis of band power. Electroencephalography and Clinical Neurophysiology, 69(2), 91-99. Gasser, T., Jennen-Steinmetz, C., Sroka, L., Verleger, R., & Mocks, J. (1988b). Development of the EEG of school- age children and adolescents. II: Topography. Electroencephalography and Clinical Neurophysiology, 69(2),100-109. Gordon, E., Cooper, N., Rennie, C., Hermens, D. and Williams, L.M. (2005). Integrative neuroscience: The role of a standardized database. Clin. EEG and Neurosci., 36(2): 64-75. Hughes, J. R. & John, E. R. (1999). Conventional and quantitative electroencephalography in psychiatry. Neuropsychiatry, 11, 190-208. John, E.R. (1977) Functional Neuroscience, Vol. II: Neurometrics: Quantitative Electrophysiological Analyses. E.R. John and R.W. Thatcher, Editors. L. Erlbaum Assoc., N.J. John, E.R. Karmel, B., Corning, W. Easton, P., Brown, D., Ahn, H., John, M., Harmony, T., Prichep, L., Toro, A., Gerson, I., Bartlett, F., Thatcher, R., Kaye, H., Valdes, P., Schwartz, E. (1977). Neurometrics: Numerical taxonomy identifies different profiles of brain functions within groups of behaviorally similar people. Science, 196:1393 1410. John, E. R., Prichep, L. S. & Easton, P. (1987). Normative data banks and neurometrics: Basic concepts, methods and results of norm construction. In A. Remond (Ed.), Handbook of electroencephalography and clinical neurophysiology: Vol. III. Computer analysis of the EEG and other neurophysiological signals (pp. 449-495). Amsterdam: Elsevier. John, E.R., Ahn, H., Prichep, L.S., Trepetin, M., Brown, D. and Kaye, H. (1980) Developmental equations for the electroencephalogram. Science, 210: 1255-1258. John, E. R., Prichep, L. S., Fridman, J. & Easton, P. (1988). Neurometrics: Computer assisted differential diagnosis of brain dysfunctions. Science, 293: 162-169. John, E.R. (1990). Machinery of the Mind: Data, theory, and speculations about higher brain function. Birkhauser, Boston. Galán, L., Biscay, R., and Valdés P., (1994). Multivariate statistical brain electromagnetic mapping. Brain Topgr., 7(1):17-28. Koenig T, Prichep L, Lehmann D, Sosa PV, Braeker E, Kleinlogel H, Isenhart R, John ER. (2002). Millisecond by millisecond, year by year: normative EEG microstates and developmental stages. Neuroimage, 16(1):41-48. Matousek, M. & Petersen, I. (1973a). Automatic evaluation of background activity by means of age-dependent EEG quotients. EEG & Clin. Neurophysiol., 35: 603-612. Matousek, M. & Petersen, I. (1973b). Frequency analysis of the EEG background activity by means of age dependent EEG quotients. In Automation of clinical electroencephalography, Kellaway & I. Petersen (Eds.), (pp. 75-102). New York: Raven Press.

Doe, John_EC
25
Prichep, L.S. (2005). Use of normative databases and statistical methods in demonstrating clinical utility of QEEG: Importance and cautions. Clin. EEG and Neurosci., 36(2): 82-87. Thatcher, R.W., Walker, R.A., Biver, C., North, D., Curtin, R., (2003). Quantitative EEG Normative databases: Validation and Clinical Correlation, J. Neurotherapy, 7(3-4): 87-121. Thatcher, R. W. (1998). EEG normative databases and EEG biofeedback. Journal of Neurotherapy, 2(4): 8-39. Thatcher, R.W., North, D., and Biver, C. (2005a) EEG inverse solutions and parametric vs. non-parametric statistics of Low Resolution Electromagnetic Tomography (LORETA). Clin. EEG and Neuroscience, 36(1):1-8. Thatcher, R.W., North, D., and Biver, C. (2005b) Evaluation and Validity of a LORETA normative EEG database. Clin. EEG and Neuroscience, 36(2): 116-122. Thatcher, R.W., McAlaster, R., Lester, M.L., Horst, R.L. and Cantor, D.S. (1983). Hemispheric EEG Asymmetries Related to Cognitive Functioning in Children. In: Cognitive Processing in the Right Hemisphere, A. Perecuman (Ed.), New York: Academic Press. Thatcher, R.W. (1992). Cyclic cortical reorganization during early childhood. Brain and Cognition, 20: 24-50. Thatcher, R.W. and Lubar, J.F. History of the scientific standards of QEEG normative databases. (2008) In: Introduction to QEEG and Neurofeedback: Advanced Theory and Applications, T. Budzinsky, H. Budzinsky, J. Evans and A. Abarbanel (eds)., Academic Press, San Diego, CA. Thatcher, R.W. (2010) Reliability and validity of quantitative electroencephalography (qEEG). J. of Neurotherapy, 14:122-152.