Applied Learning Student Questionnaire
14
1 GOSA-ALSQ December 2016 Omnibus Report Applied Learning Student Questionnaire: Overall Analysis Executive Summary The Applied Learning Student Questionnaire (ALSQ) is designed to measure pre and post gains related to student problem solving and communication skills. The ALSQ is a self-report questionnaire that includes 36 items to assess students’ attitudes on five survey constructs: Intrinsic Motivation, Self- Management/Self-Regulation, Intent to Persist, Problem-Solving, and Implementation Activities. 1 In December 2016, 1,307 students across seven Innovation Fund programs completed the Applied Learning Student Questionnaire (ALSQ). Key findings include: Overall, students showed statistically significant increases in Intrinsic Motivation, Self- Management/Self-Regulation, and Intent to Persist. Across all constructs, the largest effect size observed was for Intrinsic Motivation (d=0.59), which suggests that the programs were particularly effective at enhancing students’ interest in learning and getting value from the material being taught. All of the programs showed statistically significant increases in Intrinsic Motivation and Intent to Persist. The “now” scores for two constructs—Intent to Persist and Implementation Activities—did not reach or exceed the optimal average of 4.0, which means programs may need additional work in improving student exposure to and interest in STEM. The average program rating across all programs exceeded the optimal 4.0 average with an average of 4.19, suggesting that most programs were viewed positively by students. Student ratings indicate that the inquiry-based learning environment may be improved by allowing students to have more control over their own work and increasing their exposure to STEM professionals and real-world problems. 1 Intent to Persist refers to aspirations, plans, and goals to pursue additional education and a career in STEM (Science, Technology, Engineering, and Math). Implementation Activities refer to hands-on activities designed to increase exposure to STEM topics and real-world application.
Transcript of Applied Learning Student Questionnaire

1
GOSA-ALSQ December 2016 Omnibus Report
Applied Learning Student
Questionnaire: Overall Analysis
Executive Summary
The Applied Learning Student Questionnaire (ALSQ) is designed to measure pre and post gains related to
student problem solving and communication skills. The ALSQ is a self-report questionnaire that includes
36 items to assess students’ attitudes on five survey constructs: Intrinsic Motivation, Self-
Management/Self-Regulation, Intent to Persist, Problem-Solving, and Implementation Activities.1 In
December 2016, 1,307 students across seven Innovation Fund programs completed the Applied Learning
Student Questionnaire (ALSQ).
Key findings include:
Overall, students showed statistically significant increases in Intrinsic Motivation, Self-
Management/Self-Regulation, and Intent to Persist.
Across all constructs, the largest effect size observed was for Intrinsic Motivation (d=0.59),
which suggests that the programs were particularly effective at enhancing students’ interest in
learning and getting value from the material being taught.
All of the programs showed statistically significant increases in Intrinsic Motivation and Intent to
Persist.
The “now” scores for two constructs—Intent to Persist and Implementation Activities—did not
reach or exceed the optimal average of 4.0, which means programs may need additional work in
improving student exposure to and interest in STEM.
The average program rating across all programs exceeded the optimal 4.0 average with an
average of 4.19, suggesting that most programs were viewed positively by students.
Student ratings indicate that the inquiry-based learning environment may be improved by
allowing students to have more control over their own work and increasing their exposure to
STEM professionals and real-world problems.
1 Intent to Persist refers to aspirations, plans, and goals to pursue additional education and a career in STEM
(Science, Technology, Engineering, and Math). Implementation Activities refer to hands-on activities designed to
increase exposure to STEM topics and real-world application.

2
GOSA-ALSQ December 2016 Omnibus Report
Overall Results
December 2016
Participants and Methods
In December 2016, 1,307 students across seven Innovation Fund programs completed the Applied
Learning Student Questionnaire (ALSQ). The response rate displayed in Table 1 suggest that 85% of the
total number of participating students responded to the survey. The response rates per program ranged
from 56% (Hall County/TCSG Career Pathways) to 100% (Gwinnett Gear Up and Lowndes County
BLAST). Although there is no agreed-upon standard for a minimum response rate, Martella, Nelson,
Morgan, and Marchand-Martella (2013)2 suggest that a response rate of 50% is adequate for analysis and
reporting, 60% is good, and 75% or higher is considered very good. Overall, the response rate achieved
across the Innovation Fund programs is considered very good for reporting and analysis.
Table 1. Survey Response Rates
The ALSQ3 is designed to measure pre and post gains related to student problem solving and
communication skills, self-management, and engagement. The ALSQ is a self-report questionnaire that
includes 36 items to assess students’ attitudes on the following survey constructs:
1. Intrinsic Motivation: motivation stemming from goals of mastery, learning and challenge.
Example, “It is important for me to learn what is being taught in this program.”
2. Self-Management/Self-Regulation: effortful and persistent behaviors that are used to guide,
monitor, and direct the success of one’s learning and performance. Example, “I turn all my
assignments in on time.”
3. Intent to Persist: aspirations, plans, and goals to pursue additional education and a career in
STEM. Example, “I intend to get a college degree in STEM (Science, Technology, Engineering,
and Math).”
4. Problem-Solving: inquiry-based learning environment that provides higher-order cognitive tasks
and real-world application. Example, “I work out explanations on my own.”
5. Implementation Activities: hands-on activities designed to increase exposure to STEM topics
and real-world application. Example, “We learn what
scientists/technicians/engineers/mathematicians or other STEM professionals do.”
2 Martella, R., Nelson, J., Morgan, R., & Marchand-Martella, N. (2013). Understanding and Interpreting Education Research.
New York, NY: The Guilford Press. 3 See Appendix A for information related to the construct reliabilities of the ALSQ.
Program# of Survey
Respondents
Total # of Participating
Students1
Survey Response
Rate
Real STEM Georgia Southern 940 1,102 85%
Carroll County Step into STEM 37 40 93%
Gwinnett Gear Up 70 70 100%
Grady County Mechatronics 14 16 88%
Lowndes County BLAST 52 71 73%
Tift Coding Across Georgia 167 183 91%
Hall County/TCSG Career Pathways 27 48 56%
Total 1,307 1,530 85%
Note: 1The number of participating students represent approximations and may not reflect recent changes to the participant
population (e.g., dropouts).

3
GOSA-ALSQ December 2016 Omnibus Report
Results and Discussion
ALSQ Survey Constructs
Table 2 summarizes students’ responses to the ALSQ survey constructs across all programs. In
aggregate, students showed statistically significant increases in Intrinsic Motivation, Self-
Management/Self-Regulation, and Intent to Persist. In addition to assessing statistical significance
from “before” to “now,” effect sizes—a measure of the magnitude of an intervention on students’
attitudes—were computed. Specifically, effect sizes were computed using Cohen’s d and are intended
to measure the practical importance of a significant finding.4 Cohen (1988) classified effect sizes as
small, d=0.2; medium, d=0.5; and large, d=0.8.5 Table 2 suggests that medium effect sizes were found
for Intrinsic Motivation, Self-Management/Self-Regulation, and Intent to Persist. Across all
constructs, the largest effect size observed was for Intrinsic Motivation (d=0.59). This suggests that
the programs were particularly effective at enhancing students’ interests to learn and derive value
from the material being taught. For example, after participating in the programs, 72% of students said
they prefer classwork that is challenging, compared to 51% before the programs. See Tables 5-9 for
more information.
To maximize impact, we would expect students’ average scores to exceed 4.0 on a 5-point Likert
scale (1, Strongly Disagree to 5, Strongly Agree). In light of this benchmark, it is important to note
that the “now” scores for two constructs—Intent to Persist and Implementation Activities—did not
reach or exceed the optimal average of 4.0. Figure 1 suggests that additional work may be needed in
the aforementioned areas.
Table 2. Summary of Results by Construct6
4 To compute effect sizes, the formulas derived from Daniel & Kostic (2015) were utilized. Source: Daniel, T. & Kostic, B.
(2015). RStats effect size calculator. Available online: http://www.missouristate.edu/rstats/Tables-and-Calculators.htm. 5 Cohen, J. (1988). Statistical Power Analysis for the Behavioral Sciences (2nd ed). Hillsdale, NJ: Lawrence Earlbaum Associates. 6 As indicated by the n size, all students did not answer all questions in the constructs and demographics sections.

4
GOSA-ALSQ December 2016 Omnibus Report
Figure 1. Constructs
Note. A paired samples t-test was used to compute the p-value. **p<0.001, *p<0.01, †p<0.05.
ALSQ Survey Constructs by Program
After disaggregating the data by program, all of the programs showed statistically significant
increases in Intrinsic Motivation and Intent to Persist. All but one program showed statistically
significant increases in Self-Management/Self-Regulation. Examining effect sizes, all of the programs
exhibit either medium or large effect sizes across all constructs. These data suggest that the individual
programs were effective at enhancing students’ motivations to succeed, their ability to direct their own
learning, and their intent to persist in STEM education and careers. While the effect sizes were large
(d>.8) across most constructs for the Grady County Mechatronics and Lowndes County BLAST
program, caution should be employed when interpreting the results given the small sample sizes
(n=14 and n=52, respectively).7
7 According to deWinter (2013), the t-test can be applied to a small sample size, as long as the effect size is expected to be large.
Source: deWinter, J.C.F. (2013). Using the Student’s t-test with extremely small sample sizes. Practice Assessment, Research
and Evaluation, 18(10). Available online: http://pareonline.net/getvn.asp?v=18&n=10.

5
GOSA-ALSQ December 2016 Omnibus Report
Table 3. Summary of Results by Constructs per Program
In order for programs to maximize their effectiveness, we would expect “now” scores to reach or
exceed the optimal average of 4.0 on a 5-point Likert scale (1, Strongly Disagree to 5, Strongly
Agree). Figures 2-6 display “now” scores for each program and construct. For example, Figure 2
indicates that all but one program met or exceeded the optimal average for Intrinsic Motivation. In
general, programs not reaching or exceeding the red horizontal line may need additional attention. For
instance, two out of seven programs did not reach the optimal average for Self-Management/Self-
Regulation (Figure 3) and three programs did not reach the optimal average for Intent to Persist
(Figure 4). Additionally, more than half of programs did not reach the optimal average for Problem
Solving and Implementation Activities (Figures 5 and 6).

6
GOSA-ALSQ December 2016 Omnibus Report
Figure 2. Intrinsic Motivation (“Now” Scores) Figure 3. Self-Management/Self-Regulation (“Now” Scores)
Figure 4. Intent to Persist (“Now” Scores) Figure 5. Problem Solving (“Now” Scores)
Figure 6. Implementation Activities (“Now” Scores) Figure 7. Overall Program Ratings
Program Rating
Collapsing across all programs, students’ ratings of their programs exceeded the optimal average of
4.0. On a 5-point Likert scale where 1 signifies Very Poor and 5 signifies Excellent, the average score
was 4.19. See Table 4. Looking at Figure 7, all programs with the exception of Tift County Coding
Across Georgia were rated above the optimal average. These high ratings suggest that most programs
were viewed positively by students.

7
GOSA-ALSQ December 2016 Omnibus Report
Areas for Further Improvement
The “now” means for Intrinsic Motivation and Self-Management/Self-Regulation all exceeded the
optimal average of 4.0 on a 5-point Likert scale. The majority of items in each construct also showed
statistically significant increases and had “now” scores above the optimal average. Of the sub-items
under Intrinsic Motivation and Self-Management/Self-Regulation, only two items had “now” scores
below the optimal average:
o Preferring challenging class work to learn new things, and
o Setting aside time to do homework and study.
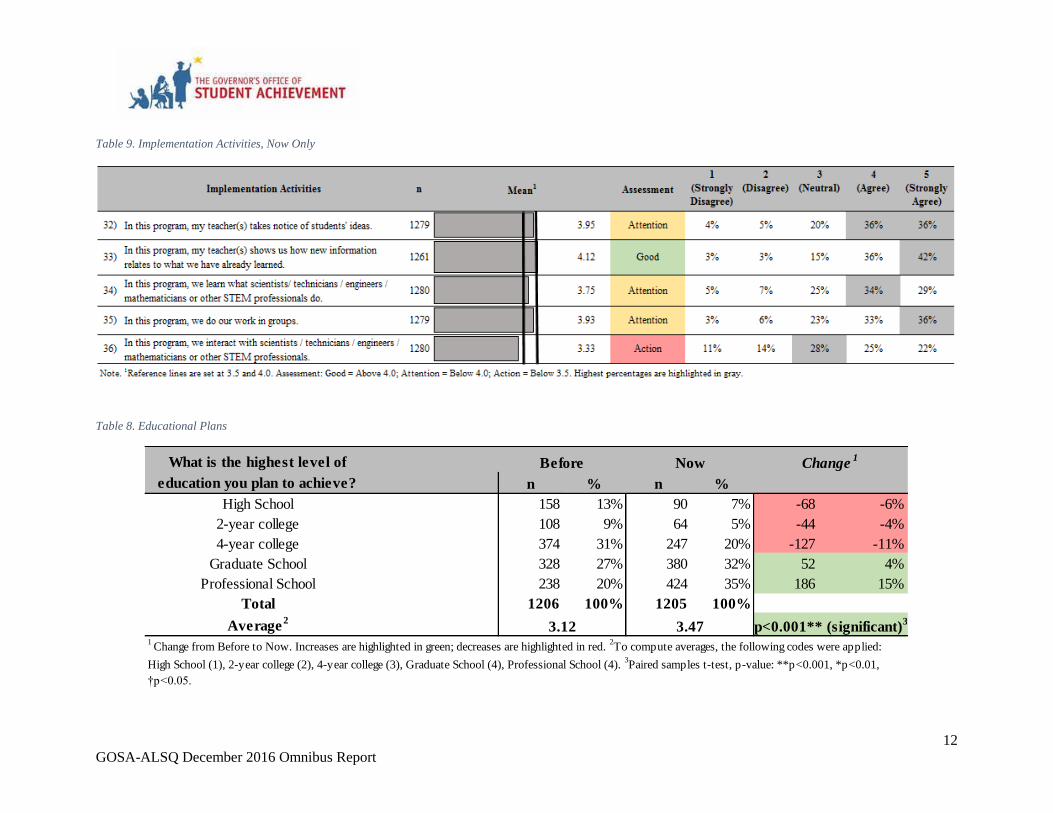
The “now” means for Intent to Persist and Implementation Activities fell below the optimal average.
Almost all of the sub-items under Intent to Persist and Implementation Activities had “now” scores
below the optimal average. The sub-item with the lowest average rating referred to interactions with
STEM professionals through the program.
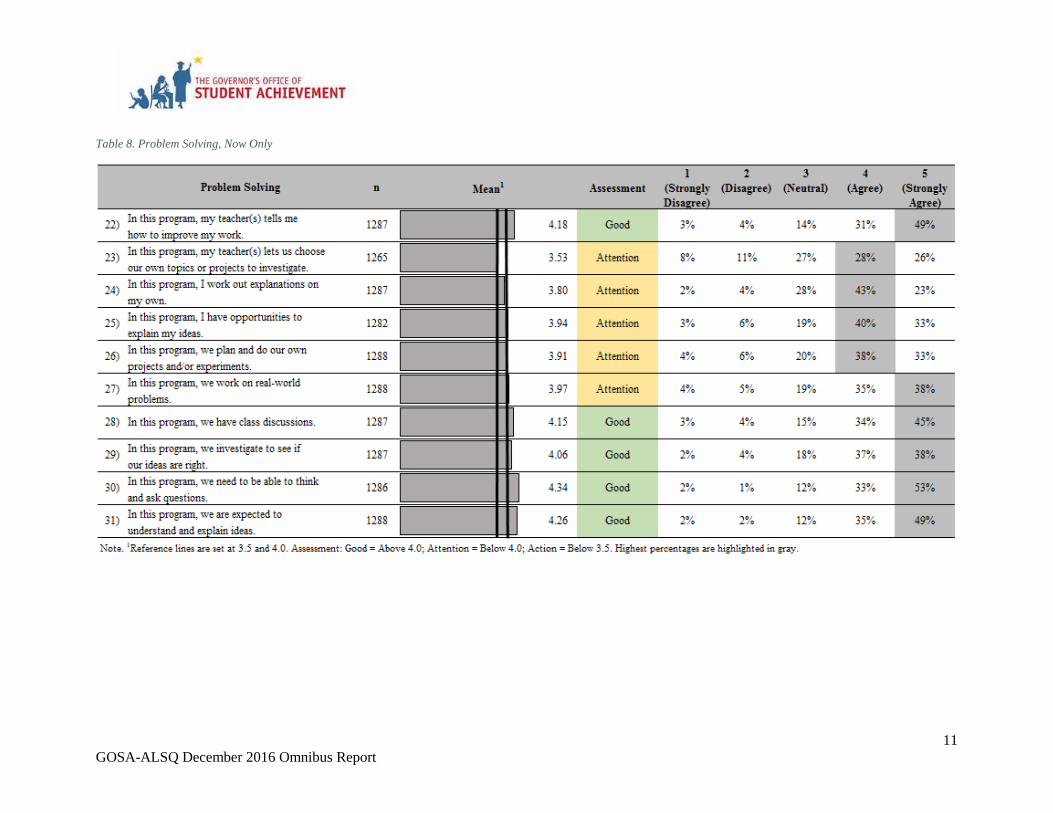
Additionally, five of the item responses within the Problem Solving construct received average ratings
below the optimal average. Specifically, the following areas received average ratings below the
optimal average:
o Letting students choose their own topics or projects to investigate,
o Letting students work out explanations on their own,
o Providing students opportunities to explain their ideas,
o Letting students plan and do their own projects and/or experiments, and
o Working on real-world problems.
The students’ ratings suggest that the inquiry-based learning environment may be improved by
allowing students to have more agency over their own work and increasing student exposure to STEM
professionals and real-world problems. Incorporating the above strategies may enhance students’
intentions to persist in STEM education and careers.
Table 4. Program Rating

8
GOSA-ALSQ December 2016 Omnibus Report
Table 5. Intrinsic Motivation

9
GOSA-ALSQ December 2016 Omnibus Report
Table 6. Self-Management / Self-Regulation

10
GOSA-ALSQ December 2016 Omnibus Report
Table 7. Intent to Persist
11
GOSA-ALSQ December 2016 Omnibus Report
Table 8. Problem Solving, Now Only
12
GOSA-ALSQ December 2016 Omnibus Report
Table 9. Implementation Activities, Now Only
Table 8. Educational Plans
What is the highest level of
education you plan to achieve? n % n %
High School 158 13% 90 7% -68 -6%
2-year college 108 9% 64 5% -44 -4%
4-year college 374 31% 247 20% -127 -11%
Graduate School 328 27% 380 32% 52 4%
Professional School 238 20% 424 35% 186 15%
Total 1206 100% 1205 100%
Average2
1 Change from Before to Now. Increases are highlighted in green; decreases are highlighted in red.
2To compute averages, the following codes were applied:
High School (1), 2-year college (2), 4-year college (3), Graduate School (4), Professional School (4). 3Paired samples t-test, p-value: **p<0.001, *p<0.01,
†p<0.05.
Before Now Change1
3.12 3.47 p<0.001** (significant)3

13
GOSA-ALSQ December 2016 Omnibus Report
Table 9. Demographics
Table 10. Participation

14
GOSA-ALSQ December 2016 Omnibus Report
Appendix A. Construct Reliabilities
Table A1. Construct Reliabilities (Omnibus, December 2016)
Cronbach’s Alpha Reliability Key: Cronbach’s alpha is a measure of the internal consistency of items
in a construct. This statistic ranges from 0 to 1; the higher the value the better. An alpha of 0.80 or higher
is considered to have achieved very good measurement reliability; an alpha of 0.65 is considered
acceptable (Field, 2009).
Reliability Interpretation
0.90 and
above
Excellent reliability; at the level of the best measures
0.80 –
0.90
Very good
0.70 –
0.80
Good; in the range of most. There are probably a few items which could be
improved.
0.60 –
0.70
Somewhat low. This measure needs to be supplemented by other measure
(e.g., more surveys) to determine outcomes. There are probably some items
which could be improved.
0.50 –
0.60
Suggests need for revision of measure, unless it is quite short (ten or fewer
items). The test definitely needs to be supplemented by other measure (e.g.,
more tests).
0.50 or
below
Questionable reliability. This measure should not contribute heavily to the
outcomes and needs revision.
From: J. C. Nunnally, Psychometric Theory. New York: McGraw-Hill, 1967, pp. 172-235.
Reference: Field, A. (2009). Discovering Statistics Using SPSS, 3rd Edition. Thousand Oaks, CA: Sage
Publications.
Constructs Cronbach's alphaReliability
Interpretation
Before 0.890 Very good
Now 0.915 Excellent
Before 0.754 Good
Now 0.759 Good
Before 0.876 Very good
Now 0.892 Very good
Problem Solving (10 items) Now 0.896 Very good
Implementation Activities (5 items) Now 0.812 Very good
Intrinsic Motivation (9 items)
Self-Management/Self-Regulation (7 items)
Intent to Persist (5 items)