Applied Investment Management (AIM) Program · BLUE NILE, INC..... 37 . Marquette University AIM...
39
Applied Investment Management (AIM) Program AIM Fund Investment Advisory Board Meeting October 4, 2005 AIM Fund Portfolio Recommendations Student Presenter Company Name Ticker Recommended Portfolio Weighting Recommended Investment Share Price 10_04_05 # of Shares to be Purchased Initial Market Value Zandt Beasley Broadcast Group BBGI 1.0% $5,000 $13.90 360 $5,004 Wojs Marlin Business Services MRLN 2.0% $10,000 $22.69 450 $10,211 Cunningham Serena Software SRNA 2.0% $10,000 $20.07 500 $10,035 Toellner Lifecell Corporation LIFC 2.0% $10,000 $21.95 470 $10,317 Jensen Amedisys, Inc. AMED 2.0% $10,000 $37.81 260 $9,831 Hepp Badger Meter BMI 2.0% $10,000 $41.05 250 $10,263 Kennedy Randgold Resources GOLD 2.0% $10,000 $15.22 660 $10,045 Holtkamp Placer Sierra Bancshares PLSB 2.0% $10,000 $27.30 370 $10,101 Rawls Novatel NVTL 2.0% $10,000 $14.10 700 $9,870 Berg Syntroleum Corp. SYNM 0.0% $0 $8.55 $0 Auth Jos. A. Bank Clothiers JOSB 2.0% $10,000 $42.11 240 $10,106 Trotter Blue Nile NILE 2.0% $10,000 $33.24 300 $9,972 Sub-Total 21.0% $105,000 $105,754 Other Equity 20.0% $100,000 Cash 59.0% $295,000 Total 100.0% $500,000
Transcript of Applied Investment Management (AIM) Program · BLUE NILE, INC..... 37 . Marquette University AIM...

Applied Investment Management (AIM) Program
AIM Fund Investment Advisory Board Meeting
October 4, 2005
AIM Fund Portfolio Recommendations
Student Presenter Company Name Ticker
Recommended Portfolio
Weighting
Recommended Investment
Share Price
10_04_05
# of Shares to be
Purchased
Initial Market Value
Zandt Beasley Broadcast
Group BBGI 1.0% $5,000 $13.90 360 $5,004
Wojs Marlin Business
Services MRLN 2.0% $10,000 $22.69 450 $10,211 Cunningham Serena Software SRNA 2.0% $10,000 $20.07 500 $10,035
Toellner Lifecell Corporation LIFC 2.0% $10,000 $21.95 470 $10,317 Jensen Amedisys, Inc. AMED 2.0% $10,000 $37.81 260 $9,831 Hepp Badger Meter BMI 2.0% $10,000 $41.05 250 $10,263
Kennedy Randgold Resources GOLD 2.0% $10,000 $15.22 660 $10,045
Holtkamp Placer Sierra Bancshares PLSB 2.0% $10,000 $27.30 370 $10,101
Rawls Novatel NVTL 2.0% $10,000 $14.10 700 $9,870 Berg Syntroleum Corp. SYNM 0.0% $0 $8.55 $0
Auth Jos. A. Bank
Clothiers JOSB 2.0% $10,000 $42.11 240 $10,106 Trotter Blue Nile NILE 2.0% $10,000 $33.24 300 $9,972
Sub-Total 21.0% $105,000 $105,754 Other Equity 20.0% $100,000 Cash 59.0% $295,000 Total 100.0% $500,000

AIM FUND 9/28/05 STOCK PURCHASES
Symbol Name Date Acquired Shrs Paid Initial Value Comm Net Initial Value AUDC AUDIOCODES LTD 9/28/2005 970 $10.71 $10,388.70 $25.00 $10,363.70 DLP DELTA & PINE 9/28/2005 380 $25.39 $9,648.20 $25.00 $9,623.20
EPEX EDGE PETROLEUM CP 9/28/2005 420 $27.25 $11,445.00 $25.00 $11,420.00 KFY KORN FERRY INTL 9/28/2005 620 $16.17 $10,025.40 $25.00 $10,000.40
LCAV LCA-VISION INC 9/28/2005 260 $36.85 $9,581.00 $25.00 $9,556.00 MFB MAIDENFORM BRANDS 9/28/2005 710 $13.98 $9,925.80 $25.00 $9,900.80 NPSI NORTH PITTSBURGH 9/28/2005 250 $19.52 $4,881.00 $25.00 $4,856.00 PEC PIKE ELECTRIC COR 9/28/2005 280 $20.00 $5,600.00 $25.00 $5,575.00 PGIC MIKOHN GAMING COR 9/28/2005 730 $13.17 $9,614.10 $25.00 $9,589.10 QSII QUALITY SYSTEMS I 9/28/2005 75 $68.00 $5,100.00 $25.00 $5,075.00
SALM SALEM COMMUN CORP 9/28/2005 270 $18.11 $4,889.70 $25.00 $4,864.70 VNBC VINEYARD NATL BCP 9/28/2005 330 $29.46 $9,721.80 $25.00 $9,696.80
TOTAL $100,820.70 $300.00 $100,520.70
• The investment objective of the equity portion of the AIM Fund is to achieve long-term capital growth in excess of 2 percent of the benchmark (Russell 2000 Index) by investing in small market capitalization companies (between $250 million and $1 billion market capitalization).
• The maximum allocation to any economic sector (as defined by Russell 2000 Index) shall be no more (or less than) than the
lesser of: 2% above (or below) the Index’s market value weighting of the AIM Fund’s equity investment or 1.5 times above (or below) the Index’s market value weighting of the Fund’s equity investment.
• The maximum allocation to any single issue at the time of purchase shall be 2% (at market value) of portfolio assets. The total
maximum allocation to any single issue shall be 5% (at market value) of portfolio assets.

Table of Contents
Page
BEASLEY BROADCAST GROUP, INC...................................................................................... 4
MARLIN BUSINESS SERVICES................................................................................................. 7
SERENA SOFTWARE ................................................................................................................ 10
LIFECELL CORPORATION....................................................................................................... 13
AMEDISYS, INC. ........................................................................................................................ 16
BADGER METER, INC............................................................................................................... 19
RANDGOLD RESOURCES LIMITED (ADR) .......................................................................... 22
PLACER SIERRA BANCSHARES ............................................................................................ 25
NOVATEL.................................................................................................................................... 28
SYNTROLEUM CORPORATION.............................................................................................. 31
JOS. A. BANK CLOTHIERS....................................................................................................... 34
BLUE NILE, INC. ........................................................................................................................ 37

Marquette University AIM Fund October 4, 2005 Page 4
Beasley Broadcast Group, Inc. BBGI
Price: $13.82 ($12.32-18.29) Fiscal Year Ends: December
September 28, 2005 Paul Zandt Russell 2000: 656.04 (588.36 – 688.51) Beasley Broadcast Group owns 41 radio stations in a total of ten large and mid-sized markets, including Atlanta, Boston, Miami and Philadelphia. These stations (26 FM and 15 AM) offer a variety of formats, including news, sports talk, religious, Spanish-language, country, adult contemporary, urban and oldies. A principal component of Beasley’s operating strategy involves developing clusters of radio stations that improve operating efficiencies in the markets they serve. The company also strives to establish and maintain a strong local brand identity in each of those markets. Both strategies will be important as the company faces challenges from satellite and digital radio in the coming years.
Recommendation Beasley Broadcast Group appears to be in a favorable position to compete in the broadcast radio industry in the coming years, and is poised for a 17% earnings growth rate over the next several years. Beasley has a strong presence in large radio markets, which tend to be the most profitable and where margins tend to be the highest. In addition, its station formats are well diversified and well-suited to weather the continuing competition from music downloading and MP3 players, as well as from the growing threat from satellite radio. The slumping media sector has helped drag down BBGI’s stock price to a point where it is undervalued, and therefore offers one of the best purchase opportunity among small-cap media stocks at the present time.
Investment Thesis • Favorable radio formats. Spanish-language and religious programming cater to two of the fast-growing
radio audiences during the past five years. In addition, the local sports and news talk formats of other Beasley stations seem less threatened by MP3 and music downloading, which has led to audience fragmentation in the past several years.
• Strong local brand identity. Radio stations will need to have a strong local presence in order to compete with satellite and digital radio in the coming years. This is a major part of Beasley’s operating strategy. Many of Beasley stations tend to cater to niche audiences, with their Hispanic, religious, local news and sports talk, and other formats. Developing a strong brand identity among these niche audiences is a sound strategy for competing in the ever-changing media landscape over the next several years.
• Strong free cash flow growth. Beasley Broadcast Group has been able to consistently generate positive free cash flow and growing cash flow margins, including during the economic downturn in 2001-2002. In 2004, its cash flow margin was 17%, which was one of the highest among the small cap media companies under consideration.
Key Statistics Sept. 2005 Portfolio weighting 1% Credit Rating B+ Market Cap. $351.1 million Cash flow margin 17.0% Dividend yield 0% ROE 15.80% EBITDA/Sales 26.76% LT Debt to Total Capital 55.60% Price to book ratio 3.94 Trailing P/E 23.83 Forward P/E 12/06 21.94 Estimated 2006 EPS 0.63 Morningstar Sector Media

Marquette University AIM Fund October 4, 2005 Page 5
Valuation Beasley Broadcast Group has produced an impressive amount of positive free cash flow in the past five years, growing from $6.67 million in 2001 to $21.87 million in 2004. My target price is $18.31, based on a modest annual revenue growth rate of 4% and an annual cash flow margin of 11%. The current market price is $13.82. Risks • Threat from satellite and digital radio and the Internet. Satellite and digital radio will continue to grow
over the next decade, and this will likely continue to fragment the broadcast radio audience. In addition, Internet radio, music downloading and MP3 players, such as iPods, will also continue to be a competitive threat.
• Continued slump in the media sector. Investors remain hesitant to invest in radio and other traditional media companies, which have generally experienced audience erosion in the past decade from newer forms of media. At the present time, there is no indication that investor sentiment will change in the near future, and this may continue to create a drag on Beasley’s stock price.
• Restrictions by the FCC on ownership of multiple stations in each market. In 2003, there was reason to believe the FCC restrictions would be relaxed, but changes to those restrictions have been put on hold. Current FFC rules limit the company’s ability to acquire additional radio stations and continue to pursue its “cluster strategy,” which results in operating efficiencies in markets where it owns more than one station.
Management Beasley Broadcast Group is headed by Chairman and Chief Executive Officer George Beasley, and is supported by a management team with an average of 28 years of experience in the radio broadcast industry. This wealth of experience will prove valuable as the company faces the challenge of remaining profitable in the future.
Growth Assumptions • An earnings growth rate of 12-17% is projected over the next five years. • Consensus EPS estimates
o 2005: 0.56 o 2006: 0.63 o 2007: 0.70
• With high free cash flow margins and above average growth opportunities in the radio industry, BBGI appears to be undervalued and is a buy recommendation for the AIM fund.

Marquette University AIM Fund October 4, 2005 Page 6
Major Holders
% of Shares Held by All Insider and 5% Owners 65%
% of Shares Held by Institutional & Mutual Fund Owners 27%
Number of Institutions Holding Shares 32

Marquette University AIM Fund October 4, 2005 Page 7
Marlin Business Services MRLN
Price: 22.64 (16.27 – 24.00) Fiscal Year Ends: December
September 28, 2005 Tim Wojs Russell 2000: 660.20 (558.36 – 688.51) Marlin Business Services is a nationwide provider of leasing and financing solutions for small to mid-size businesses. Copiers, telecommunications equipment, water filtration systems, computers, and closed-circuit security systems are just a few of the 60 commercial equipment categories. MRLN provides independent equipment dealers the opportunity to offer point of sale financing solutions, which allows them to increase their sales. The average MRLN lease is about $8,400 with a term of approximately 46 months. MRLN reaches its end-use by using their existing network of over 9,200 independent equipment dealers. MRLN has regional offices located in Atlanta, Denver, and Chicago, an executive office in New Jersey and a lease recording office in Philadelphia. Recommendation I believe that Marlin Business Services has substantial growth opportunities. With only about 13% of the total number of potential equipment dealers captured, MRLN has the ability to increase its top line by acquiring exclusive financing with more dealers. MRLN’s net interest and fee margin increased from 10.53% in 2003 to 12.19% in 2004 (a 15.7% increase y.o.y). A relatively low interest rate environment and increased efficiency will improve this number even more. MRLN serves what they deem as an “underserved” market, which helps reduce their competition to only smaller firms like themselves. With an executive team that is highly experienced in providing financing solutions to smaller businesses, I believe that they have an advantage over their smaller competitors. I am confident of MRLN’s growth profile and recommend that we open a 2% position in this security. Investment Thesis
• Significant growth opportunities. Currently, Marlin uses roughly 9,200 independent equipment dealers in order to reach its end-users. Management estimates that there are 75,000 independent equipment dealers who sell the types of products that MRLN provides financing. The fact that the company only has relations with about 13% of the potential market represents attractive growth potential. By enhancing existing relations with dealers and obtaining new equipment dealer accounts, long term growth of 16% is expected.
• Favorable interest rate environment. According to Robert Hansen from Standard & Poor’s,
“we expect the interest rate environment to remain relatively benign in 2006.” MRLN’s revenues come from the interest and fees that they collect from loans. A stable interest rate environment would mean Marlin could collect more revenue from a bigger interest rate margin with a higher demand for loans, resulting in an ideal situation for the company.
• Operates under the radar of larger financing firms. MRLN’s primary focus for financing
services is small to medium size businesses. The larger players in the industry, like GE Financial
Key Statistics Sept. 2005 Proposed Port. Weight 2.0% Market Cap $268Mil ROE TTM 16.4% LT Growth Rate 16.0% Forward PEG 1.01 P/E TTM 17.4 Forward P/E 15.4 Net Margin TTM 16.3% EPS FY ’05 $1.42 EPS FY ’06 $1.63 Beta 1.20 Inst. Ownership 74.1% Morningstar Sector Bus. Serv. *Thomson Financial

Marquette University AIM Fund October 4, 2005 Page 8
and Wells Fargo, concentrate on offering financing services to the large equipment manufacturers. Because of this fact, Marlin’s competition decreases significantly. Their main competition is narrowed down to much smaller firms similar to themselves.
Valuation Using the discounted cash flow model, I computed an intrinsic value of $41.38. This was obtained by using EPS forecasts of $1.42 (’05), $1.61 (’06), and 1.89 (’07), a long term growth rate of 16%, and a terminal growth rate of approximately 4%. The stock is currently trading at $23.00. This price is a significant discount to the computed intrinsic value. The 12-month price ‘street price’ target is $26.50, which represents targeted growth of 15.2%. On a relative measurement basis, the stock is trading at 17.4x the past 12 months’ earnings, which is slightly lower than the industry average of 18.1x. The forward P/E is 15.4x, which is also below the industry average of about 16x. Risks
• Increased competition from bigger industry players. If the bigger industry players shift their attention from the larger companies and equipment manufacturers to the smaller businesses that MRLN targets, revenues could be adversely impacted. Larger firms typically have the ability to obtain cheaper capital for financing and thus, can offer lower rates that MRLN may not be able to access. Also the bigger players take more credit risk, which could translate into the ability for them to obtain exclusive financing with more independent equipment dealers.
• Economic downturn. Smaller companies are affected much more by downturns in the economy
than larger companies. If the economy starts performing badly, it could equate to a higher delinquency rate on MRLN’s leases (which is currently at .78%).
• Unexpected interest rate fluctuations. Since MRLN’s revenues depend strongly on interest
rates, higher than expected rates could significantly hurt the company’s revenues because of a smaller interest income margin.
Management Daniel P. Dyer is MRLN’s CEO, Chairman, and Treasurer. He has been in these positions since the company was founded in 1997. Before founding MRLN, he served as CFO of Advanta Business Services. He is also a CPA. One thing that I’d like to note is that MRLN’s Senior Vice President, George Pelose, has expensed 1,250 stock options every two weeks for the past three months. Outlook and Growth Assumptions
• For the 2Q FY’05, Marlin reported earnings of $0.38 per share, which beat consensus estimates of $0.35. They have surpassed quarterly estimates since they IPO’ed in November of 2003
• Consensus estimates for 3Q FY’05 are again $0.35. MRLN’s EPS for FY’05 is estimated at
$1.42. EPS for FY’06 is $1.61.
• MRLN currently has relations with 9,200 independent equipment dealers. Management estimates the potential number of independent equipment dealers that offer products that MRLN provides leases to be 75,000. This translates into the fact that MRLN only has relations with about 13% of the total available dealers. An expansion of relations to new dealers is vital to MRLN’s success.
• By creating relations with new dealers and enhancing relations with current dealers, Marlin’s long
term growth rate is 16%, a number that is between analyst estimations of 15% and 17%.

Marquette University AIM Fund October 4, 2005 Page 9
Major Holdings % of Shares Held by All Insider and 5% Owners: 23% % of Shares Held by Institutional & Mutual Fund Owners: 50% Number of Institutions Holding Shares: 40
Top Institutional Holders Holder Shares % Value Reported FIDELITY MNFT 991,437 8.53 $20,205,486 31-Mar-05 CENTURY CAPITAL Mngt 934,410 8.04 $19,043,275 31-Mar-05 JP MORGAN CHASE 612,291 5.27 $12,478,490 31-Mar-05 MASON STREET 604,700 5.20 $12,323,786 31-Mar-05

Marquette University AIM Fund October 4, 2005 Page 10
Serena Software SRNA
Price $19.75 ($16.70 – $24.42) End of Fiscal Year: January
September 26, 2005 Christopher Cunningham Russell 2000: $660.20 Serena Software is the largest singularly-focused software developer for information technology systems and infrastructure for businesses, with distinctive offerings in corporate governance. Located in San Mateo, California, the company employs more than 750 people worldwide. While the bulk of sales are done in North America, last year 69% of revenues were made in this area, the company does have a significant sales force abroad promoting its products and executing sales. Recommendation The Software Change Management Industry is expected to grow approximately 8.5% over the next several years. Serena is expecting to acquire market share from some competitors this year, and I believe the company can support a growth rate above the industry average for the next 3-5 years. The company has sound fundamentals and high margins, even for the industry. I am confident the company is currently undervalued due to a number of factors which are discussed below. SRNA’s fair value falls around $24 - $26.
Key Statistics September 26
Beta Market Cap. $812 million LT Debt/Total Cap. 27.09% Dividend Yield 0% ROE 10.2% P/E Fiscal ‘06E 15.10 P/E Fiscal ‘07E 13.84 S&P Sector Category Software
Investment Thesis o Strong market position and increasing market share. Second in market share only to IBM,
who commands 33% of revenues in the sector, Serena is a market leader at 22%. The next strongest competitor in the industry after Serena, Computer Associates has less than half the market share of Serena. This positioning, coupled with expectations that Serena will increase control of the market this year, provides a positive outlook for the company.
o Rising demand for compliance software. In the last few years we have seen a dramatic
increase in new laws and regulations regarding the IT department of the typical firm. Companies like Serena can benefit by offering new software to help other corporations minimize their reporting and compliance costs, either through automation or better internal control.
o Merger provides scale. SRNA’s relatively new merger with Merant gave the company the scale
to compete effectively with IBM through a more expansive customer group and new product

Marquette University AIM Fund October 4, 2005 Page 11
lines. The market is also large enough to sustain multiple groups in this sector. The software reporting and compliance sub-sector has strong growth potential, especially as companies look for increasing ways to increase their efficiency.
Valuation Using the discounted cash flow model, I arrived at a target price of $25 for this stock. The company should be able to achieve a long term growth about 5% above the sector, which is growing around 8.5%. Serena’s performance has exceeded 10% during the past 3 years, following some difficult times in 2001 and 2002. The stock has performed quite steadily the past several years. Due to the nature of the business model and the business risks this company is exposed, I computed the cost of equity at 10.5%. At $25 the stock is undervalued about 20% and should be added to the portfolio.
Risks o SRNA competes with more than just other software companies. Companies like Serena have
to develop better, more efficient software than not only their competitors, but also their own customers’ IT departments. There is still a possibility that these potential customers will develop or have in place a comfortable system that they would not want to discontinue for a variety of reasons, the first of which could be the initial added set up and support costs incurred from new software.
o Possible risk in lower than expected revenues. The slight disappointment in Q1 revenues could return if Serena’s marketing groups are not successful in their endeavors. Even if revenues increased, it would be disappointing not to see the expected growth of revenues and investors may become disenchanted with the stock, despite valuation.
o Quite a bit of outstanding debt. Long term debt is now $200 million, leveraging the company
at roughly a 1:1 debt to equity ratio. Though this is a concern, the debt was taken on through the merger with Merant and the company still has over $133 million in cash on hand. Cash has typically been upwards on 30% of sales dollars which, with increasing revenues, should continue to generate solid cash flows for SRNA.
Management
Management is very experienced in this field; many of the executives have been with the company for more than ten years, including the CTO and Chairman of the Board, Douglas Troxel, who has served on the Board since 1980. Management effectively brought the company through some very tough times; climbing revenues and earnings are a testament to management’s strength.
Outlook and Growth Assumptions o Total revenue increased by 97% in FY ’05. International sales growth in 2005 was 107%. o Margins have averaged over 36% for the last five years, and are expected to remain as high in the
near term. o Gross margins are around 87% and show no signs of deteriorating.
Marquette University AIM Fund October 4, 2005 Page 12
Major Shareholdings:
% of Shares Held by All Insider and 5% Owners: 30% % of Shares Held by Institutional & Mutual Fund Owners: 81% Number of Institutions Holding Shares: 149
Top Institutional Holders Holder Shares % Value Reported WELLINGTON MANAGEMENT COMPANY, LLP 3,356,000 8.12 $79,738,560 31-Mar-05
VEREDUS ASSET MANAGEMENT LLC 1,639,800 3.97 $38,961,648 31-Mar-05
TIMES SQUARE CAPITAL MANAGEMENT 1,453,100 3.52 $34,525,656 31-Mar-05
WELLS FARGO & COMPANY 1,359,136 3.29 $32,293,071 31-Mar-05

Marquette University AIM Fund October 4, 2005 Page 13
Lifecell Corporation LIFC
Price: $21.42 ($7.86-$25.57) Fiscal Year Ends: December
September 29, 2005 Jason Toellner Russell 2000: 655.46 (558.36-688.51) LifeCell Corporation engages in the development and marketing of human-derived tissue-based products for use in reconstructive, urogynecologic, and orthopedic surgical procedures to repair soft tissue defects. It develops regenerative human tissue matrix, a three-dimensional structure that contains vascular channels, proteins, and growth factor binding sites, which provide a template for the regeneration of normal human tissue. The company offers AlloDerm for plastic reconstructive, general surgical, burn, and periodontal procedures; Repliform for urogynecologic surgical procedures; GraftJacket and GraftJacket Xpress for orthopedic applications and lower extremity wounds; AlloCraft DBM for bone grafting procedures; and Cymetra, a particulate form of AlloDerm suitable for injection. It also distributes cryopreserved allograft skin for use as a temporary wound dressing in the treatment of burns. LifeCell was formed in 1986 and is based in Branchburg, New Jersey. Recommendation Lifecell Corporation should be able to achieve annual double digit growth in EPS and revenues for the next several years. The company has been growing rapidly over the past few years due to innovative human-derived tissue-based products to repair various defects or injuries. LIFC’s main products have been receiving strong surgeon demand over the past few years as a result of their high quality and effectiveness compared to other products. Their business model generates solid ROE, ROI, and ROA measures, as well as strong sales and EPS growth. LIFC has an intrinsic value of $27.48 and it is a buy recommendation. The company does not pay a dividend. Investment Thesis
Strong market outlook within the biotechnology sector. With the aging of the baby boomers in the U.S., the need for tissue reconstruction will be growing steadily for the next 5-10 years. The demand is also related to the rapid growth of women needing tissue reconstruction due to their increased involvement in sports and more active lifestyles. As a result, the outlook for growth is promising for the Lifecell Corporation. Additionally, LIFC’s product line has been in high demand from surgeons recently. LIFC’s products have generated rave reviews from patients as well, in addition to displaying efficiency and quality during and after the surgical procedures.
Strong player in versatile market. Lifecell Corporation has numerous opportunities to increase
their revenues in the tissue reconstruction market because there are numerous places on the human body where human tissue reconstruction has not yet been adapted. LIFC’s product offering has the potential to reconstruct tissue resulting from burns, breast cancer, and hernias, to
Key Statistics Sept. 2005 Weighting 2% Market Cap $778M LT Debt/Capital 0 ROE 16.59% ROI 17.10% Operating Margin 16.60% Current P/E 73.1 EPS 05E $0.39 Rev 05E $92.8M Free Cash Flow ($1.68M) Dividend Yield 0% Morningstar Category Biotechnology

Marquette University AIM Fund October 4, 2005 Page 14
name a few examples where new growth can occur. There will likely be other new opportunities to replace or reconstruct tissue within the human body. Lifecell has many strong relationships with other biotechnology companies in terms of marketing and sales, which creates a positive position within this sector of the surgery market.
Highly profitable, growing business model. LIFC has experienced exceptional returns and
growth over the past two years. Much of the company’s strong performance can be attributed to its solid returns on assets, equity, and investments that are well above the industry averages. LIFC has no long-term debt and continues to have some of the best liquidity ratios in the industry.
Valuation
Using the discounted cash flow method, an intrinsic value of $32.31 was computed. This intrinsic value includes a cautious growth rate of 25% for the next several years. Using a relative valuation approach, the product of P/E (ttm) of 70.47 and a 2005 estimated EPS of $0.39 produces an estimated year market value of $27.48. Risks
Regulatory issues. The healthcare industry is under the attentive eye of the FDA; accordingly,
any negative ruling from them could have a negative impact on LIFC. Also, the pending decisions regarding Medicaid and Medicare reimbursements could have adverse affects on the pricing of LIFC’s products.
Patent expiration and competition. LIFC’s products and technologies are subject to patent
expiration at some point, but currently none of their top line products or technologies have any patent expirations occurring in the near term. Also, any possible new innovative technologies within the tissue reconstruction industry could supplant LIFC as having some of the leading products within the industry.
Management The management team at LIFC is a rather young and innovative group with most of the senior positions being held by individuals in their 40s and 50s. The current CEO is Paul Thomas who has been in that position since 1998. He is currently 49 years old. Outlook and Growth Assumptions For the past two quarters LIFC has raised its FY05 guidance regarding revenues and EPS. Revenue and EPS growth assumptions are well into the double digits for next few years. Current estimates for ’05 are $0.40 EPS and on revenues of $92.8M.

Marquette University AIM Fund October 4, 2005 Page 15
Breakdown of Holdings ________________________________________________________________________________________
Shares Held by All Insider and 5% Owners: 23% Shares Held by Institutional & Mutual Fund Owners: 62%
Top Institutional Holders
Holder Shares % Value Reported
ARBOR CAPITAL MANAGEMENT, LLC 2,020,000 6.9 $17,978,000 31-Mar-05
IRONBRIDGE CAPITAL MANAGEMENT, LLC 1,380,027 4.7 $12,282,240 31-Mar-05
VERTICAL GROUP L.P. (THE) 1,355,200 4.6 $12,061,280 31-Mar-05
S.A.C. CAPITAL ADVISORS, LLC 1,064,020 3.6 $9,469,778 31-Mar-05
BARCLAYS BANK PLC 1,004,651 3.4 $8,941,393 31-Mar-05
MISSOURI VALLEY PARTNERS, INC. 889,259 3.0 $14,059,184 30-Jun-05

Marquette University AIM Fund October 4, 2005 Page 16
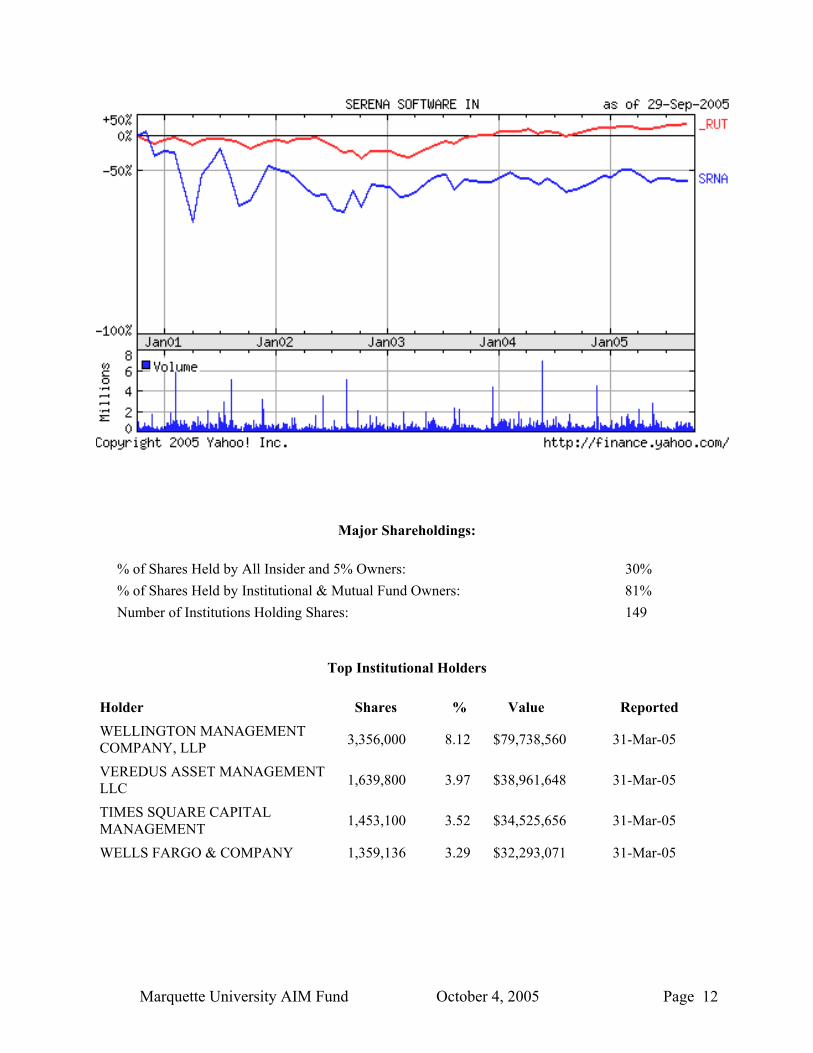
Amedisys, Inc. AMED
Price: $38.61 ($26.87 - $44.43) Fiscal Year Ends: December
September 29, 2005 Jaclyn Jensen Russell 2000 Index: 665.03 (558.36 – 688.51) Health Care Sector Amedisys, Inc. is a leading home healthcare provider located in 15 states in the south and southeast United States. AMED currently operates 199 home care nursing offices and 13 hospice locations. The company offers in-home services that include: nursing services, orthopedic services, cardiac care, diabetic care, wound treatment, infusion therapy, respiratory therapy, psychiatric care, and disease management programs. Recommendation Amedisys has a strong business model, and as one of the largest players in the home healthcare industry, it is well positioned to continue to gain market share. AMED is financially stable with a strong balance sheet and profit margins exceeding that of its peers. While the home healthcare industry typically does not have much of an economic moat, Amedisys wields its reputation and size to gain market share and efficiencies in this fragmented industry. AMED has effectively compounded the growth in the demand for home healthcare services with its successful external and internal growth strategies. I am confident that the company will be able to find new acquisition targets in the future which will continue to increase the growth and profitability of the firm. I believe that Amedisys is currently undervalued in the market and has the potential to earn up to a 37% return if it reaches my price target of $52.94. Investment Thesis • Growing Demand. Home healthcare is expected to experience growth of 8.1% a year for at least the next
five years. Amedisys’ target demographic is the aging baby boomers, which is the fastest growing segment of the US population. The aging population has increasing medical needs, but not everyone needs to, or wants to, live in a nursing home. Home healthcare services provide a more attractive and cost-effective alternative and AMED is benefiting from the increasing popularity of home healthcare services.
• Internal Growth Combined with Growth from Acquisitions. Since 2003, Amedisys has ramped up its
external growth strategy with 16 acquisitions that added 117 offices. The company focused simultaneously on internal growth through an effective referral system, as well as through startups, opening 41 new locations since 2003. AMED expects most of its acquisitions to reach 20% EBITDA within 9 months and its startups to reach the same target by 18 months. Their growth strategy is expected to generate 30% annual EPS growth over the next 2 years. AMED believes it will be able to continue acquisitions at a comparable rate because the industry is very fragmented and many hospitals are looking to spin off their home health divisions.
• Gains from Economies of Scale. Amedisys is the second largest industry provider in terms of revenue.
The four largest providers made up only 3.2% of the industry’s total revenue in 2004. AMED has adopted a strategy of acquiring smaller providers and increasing their profitability by eliminating administrative redundancies. As a larger player in the industry, AMED possesses superior bargaining power with suppliers and the resources to provide a wider range of services. AMED also utilizes sophisticated proprietary point of care technology to reduce costs and increase quality of care.
Key Statistics 29 Sept 2005 Market Cap $602.650M Enterprise Value $506.640M Shares Outstanding 15.610M Average Volume 479,920 Beta 0.69 2004 Actual EPS $1.51 2005 Estimated EPS $1.99 P/E (TTM) 22.19 Cash Flow/Share $2.28 FCF/share $1.87 Debt/Assets 2.47% ROE 20.52% Pretax Margin 14.69% LT Growth Estimate 18.33% *Source: Bloomberg

Marquette University AIM Fund October 4, 2005 Page 17
Valuation Using a discounted cash flow model, AMED should be valued at $52.94, which indicates that the stock is currently undervalued by 27%. Amedisys is currently trading at a P/E multiple of 22.19, which indicate that the company is undervalued relative to its peers which are trading at an average of 25.34 times earnings. Based on a relative P/E valuation, AMED should be trading at $50.42. The average valuation of the five analysts following AMED is $50.80, with actual price targets ranging from $46 to $54. I believe that the estimates that I used in valuing the company are conservative and that the price target is attainable in the near term. Risks • Exposure to changes in Medicare/Medicaid plans. The company earned approximately 93% of its 2004
revenue from Medicare. The 2005 revenue mix is expected to shift to 88% Medicare, 10% commercial, and 2% Medicaid following the year’s acquisitions. The company currently prefers Medicare patients because reimbursement rates have been stable and offered a reasonable margin, however, unfavorable changes in Medicare reimbursement policy would have a significant adverse effect on revenues. The current market basket reimbursement standard rate increase expires at the end of 2006, so Medicare policy should be closely monitored.
• Governmental Regulation. Amedisys is subject to a substantial amount of governmental regulation.
Violations of governmental regulations could have material adverse effects on profitability, for example, failure of a home within the system to comply with Medicare/Medicaid conditions could result in a loss of governmental reimbursement for that entity. AMED is also expected to be HIPAA compliant and must obtain CON or POA licenses in some of the states in which the company operates. Changes in governmental regulations regarding the industry could negatively affect the company as well.
• Nursing Shortage. While the present nursing shortage has not yet adversely affected the company, their
business model is dependent on quality caregivers and difficulty in finding and retaining such employees could affect their growth ability as well as their current operations.
• Acquisition Risks. A significant factor in the company’s growth strategy is their acquisitions. An
inability to find, purchase, and/or integrate attractive target companies would have a negative impact on the company’s growth rate and profitability.
Management The Chairman and CEO of Amedisys is William Borne, a 47 year old registered nurse who founded the company in 1982. The top executives of AMED are reasonably compensated and combined hold approximately 2.08% of the outstanding shares. Other Notable Information • As of September 14th, only two of the six offices affected by Hurricane Katrina are still closed. The
effects of the hurricane are expected to be minimal and limited to the third quarter. • AMED finances its acquisitions primarily with cash, which is supplemented by stock or debt if necessary.
The Housecall acquisition was financed half in cash and half in debt, which will add approximately $50 million in long term debt to the balance sheet in the third quarter, bringing the debt/asset ratio up to around 20%.
• Eight analysts currently follow AMED, seven of which rate the stock as a buy and one as a hold.
Marquette University AIM Fund October 4, 2005 Page 18
Top 5 Institutional Holders
Institution
Percent of Outstanding
Shares Held
Latest Change
Deutsche Bank 9.631% 1,503,000 1,297,000 Friess Association 6.116% 954,700 45,900 AXA 5.764% 899,719 209,529 Boston Partners 4.947% 772,194 772,194 Mellon Bank Corp 4.790% 747,627 -92,791
*Source: Bloomberg

Marquette University AIM Fund October 4, 2005 Page 19
Badger Meter, Inc.
BMI Price: $39.30 ($22.03 – $51.25)
Fiscal Year Ends: December
September 29, 2005 Michael Hepp Russell 2000 Index: 657.98 (588.36 – 688.51) Badger Meter is a leading marketer and manufacturer of products using flow measurements and control technologies developed both internally and with other technology companies. Its products are used to measure and control the flow of liquids in a variety of applications. The company’s product lines fall into two general categories: utility and industrial. Residential and commercial water meters are mainly sold to utilities, and constitute a majority of the company’s sales. Industrial product line sales comprise the remainder of the company’s sales and include automotive fluid meters and systems, small precision valves, electromagnetic meters, impeller flow meters and industrial process meters. Recommendation The earnings growth potential is one of the most favorable characteristics of this company. The company also has a solid balance sheet. Badger Meter should see 11% earning growth over the next couple years along with a dividend yield of 1.47%. With an intrinsic value of $45.50, Badger Meter is a buy recommendation. Investment Thesis
• Residential meter replacement cycle – About 15% of the water meters in the U.S. have automatic meter reading (AMR) capabilities. Solid growth should be sustained for the next couple years as water utilities replace manual read meters in efforts to cut billing and servicing costs.
• Economic conditions – Sales of industrial products at Badger Meter should remain strong for the remainder of 2005 and in 2006. Economic reports indicate that the U.S. economy is reaching the peak of the business cycle, which suggests the continuation of high capital expenditures by this segment. Although sales in the industrial market may weaken after 2006, the company sells several products to industries that are not as dramatically affected by cyclicality, such as the pharmaceutical and food processing industries.
• Improving margins – Management has cut losses related to the firm’s operations in France. Also, revenue figures reflect a better mix of higher margin products.
Valuation Based upon a free cash flow to equity model, the intrinsic value of Badger Meter is $43 versus a current price of $39.30. This model was built off the assumptions of a 9% cost of capital and a 7.5% long term growth rate at maturity. Relative valuation measures support a slightly higher valuation ($48 - $52). However, given the fundamentals and the earnings outlook, it is safe to give Badger Meter a higher valuation of $45.50.
Key Statistics Sept. ‘05 Portfolio Weighting 2% S&P Rating N/A Market Cap $277.63M LT Debt/Equity 23.1%% Dividend Yield 1.47% ROE LTM 18.6% P/E Fiscal ’05E 20.20 P/E Fiscal ’06E 17.59 Morningstar Sector Ind. Materials

Marquette University AIM Fund October 4, 2005 Page 20
Risks
• Raw materials: Bronze, aluminum, stainless steel, cast iron, brass, and satellite are all used in Badger Meter’s products. Any increase in the cost of these raw materials may force the company’s suppliers to raise prices. Although Badger Meter receives a premium for most of its products and should withstand some raw material price increases, some risk remains. The company has few suppliers and most have substantial pricing power. In turn, margin erosion may occur if substantial price increases get passed along to the company.
• Competition: Badger Meter faces several large competitors, such as Sensus Metering Systems, Neptune Technologies, and AMCO Water Metering Systems.
• Economic cycles: About 27% of the company’s revenues are derived from industrial products. Fluctuations in the economy directly affect the revenue from these products as manufacturers either increase or decrease capital expenditures.
• Currency: The relative strength of the U.S. dollar has a large impact on foreign sales, especially in Europe. Exports to Europe have been strong in the last couple of years, since the dollar is relatively weak in comparison to the Euro.
• Liquidity: There are only 7 million shares outstanding. However, the low number of shares outstanding leverages EPS growth.
Management Chairman, President and Chief Executive Officer Richard A. Meeusen has served in these positions since April 2004. He assumed the additional position of Chairman after serving as President and Chief Executive Officer since April 2002. Before assuming the above roles, he also served as Chief Financial Officer, Treasurer, and Executive Vice President. Meeusen and the company’s other officers own a total of 13% of the company’s stock. Outlook and Growth Assumptions
- The replacement of local or manual read meters should continue well into the future. The conversion to automatic meter reading (AMR) products is the likely step that utilities will take in order to reduce servicing costs. Badger meter indicates in its 2004 annual report that only 15% of all water meters have been replaced with AMR’s. Given this information, revenue growth should be in the high single-digits.
- High margin mix of products should keep operating margins above 13% for the remainder of ’05 and in 2006.

Marquette University AIM Fund October 4, 2005 Page 21
Major Holdings % of Shares Held by All Insider and 5% Owners: 9% % of Shares Held by Institutional & Mutual Fund Owners: 42% Number of Institutions Holding Shares: 41
Top Institutional Holders Holder Shares % Value Reported MARSHALL & ILSLEY CORP 644,610 9.54 $17,082,165 31-Mar-05 HEARTLAND ADVISORS INC. 578,800 8.56 $15,338,200 31-Mar-05 PRICE (T.ROWE) ASSOCIATES 410,000 6.07 $10,865,000 31-Mar-05 DIMENSIONAL FUND 215,200 3.18 $5,702,800 31-Mar-05

Marquette University AIM Fund October 4, 2005 Page 22
Key Statistics Sept. 29, 2005 Portfolio Weight 2% Market Cap 936.4M Profit Margin 34.13% Operating Margin 21.90% ROA 9.39 ROE 16.86% % Institutions 51.90% Sector Ind. Materials
Randgold Resources Limited (ADR) GOLD
Price: $16.14 (9.18 – 16.70) Fiscal Year Ends: December
September 29, 2005 Russell 2000: 660.2 Scott Kennedy Randgold Resources Ltd. is engaged in the exploration and development of gold mines in East and West Africa. They have two operating mines: the Morila and Luolo deposits in Mali. It owns an advance-staged development project at Tongon, located in Cote d’Ivoire, and a portfolio of prospective exploration permits within Mali, Cote d’Ivoire, Burkina Faso, Ghana, Senegal, and Tanzania. The company is based in the Channel Islands and trades on both the London Stock Exchange and NASDAQ. Recommendation I believe Randgold will be able to achieve 20%-25% annual earnings growth over the next several years. The company’s ability to discover and excavate new gold deposits in a time of high gold prices gives it a leading position within small-cap gold stocks. Randgold’s industry leadership and Luolo bullion output should provide enough impetus for GOLD to reach $22. Investment Thesis
• Excellent revenue profitability. The company has developed the Morila deposit into one of the world’s largest and highest-margin gold mines. The price for an ounce of gold is currently trading around $465 per ounce, whereas extraction costs GOLD only $146 per ounce. The new Luolo mine has come into production in the third quarter of 2005, and they have just received permission to begin underground recovery, which has doubled the company’s reserves. In the first six months of the year, profits have already surpassed all of last year and are 208% greater than the first half of 2004.
• Multiple new mine discoveries. South African gold deposits are becoming more costly as they mature, whereas East and West Africa maintains a plethora of untapped gold deposits at much lower cost. They recently completed a feasibility study on the Tongon project and look towards starting operations within the next two years.
• Strong player with favorable sovereign relationships. Randgold’s focus is on the mining of both West and East Africa. It recently signed a joint venture with the Tanzanian government to develop new mineral deposits in that country. Known as the Tangold agreement, the government holds a 10% stake in the area of interest, and after the feasibility study will be given the chance to purchase an additional 15% stake. This type of relationships with the host country gives GOLD a competitive advantage when competing for exploration and development contracts.
Valuation Randgold has averaged 16% sales growth and negative 5.8% EPS growth over the last five years. However, that has all changed now that their operations do not depend solely on only one mine. In addition, even though this company would still be profitable with lower gold prices, it stands to benefit

Marquette University AIM Fund October 4, 2005 Page 23
from its extraction expertise. Revenue is estimated at $159.1 million in 2005 and $205.1 million in 2006. My price target of $22 for GOLD shares is based on a 20% annual EPS growth rate for the next 7 years. Risks
• Political risks. The situation in Mali, the home country for both of GOLD’s two mines is stable. Plans to re-enter production within Cote d’Ivoire have been put on hold until two years after the October 2005 election outcome. The potential for political unrest in the other countries such as Ghana and Tanzania are in-line with other emerging markets. However, since the company works closely with host governments, and none of those are at risk of being overthrown, a reasonable assumption may be made that GOLD does not carry significant amounts of geopolitical risks.
• Threat of new entrants. Due to such high prices in gold, there will be a threat of new entrants as well as increased competition among gold exploration companies looking to win contracts. Such companies will try to follow Randgold’s lead by starting small and becoming hugely profitable. Competition has existed recently, and Randgold may need to consider using some profits, or debt, to finance a takeover and increase resources.
• Inability to find new projects or follow through with prospective ones. With underground exploration there is always a risk that money will be wasted looking for new deposits or that reserves do not have as much gold as projected. Another risk is that projects such as Tongon, which have already been studied, may become delayed due to unforeseen political risks arising within the region.
Management The management team has followed through on its promises to find mines with low cost and high productivity. The CEO, Mark Bristow, holds a PhD in Geology with more than 20 years of experience in the mining industry. He was named CEO 10 years ago as the company went public and has since been instrumental in Randgold’s industry leading performance. Outlook and Growth Assumptions
• Bullion shipments from the Luolo mine will come to market in November • Luolo will produce 1.8 million ounces of gold over a 10-year period • Cash resources of $80 million to fund exploration programs • 115 targets in six countries • M&A activity, and review of the dividend policy • Estimated 2005 EPS of $0.76, an 260% increase over 2004 • Fourth quarter is historically the gold commodity’s strongest

Marquette University AIM Fund October 4, 2005 Page 24
Major Shareholdings Shares Outstanding: 59.00 Mil
Institutional Ownership (%) 51.90
Top 10 Institutions (%) 36.41
Mutual Fund Ownership (%) 45.64
Top Institutional Holders
Holder Shares % Value Reported VAN ECK ASSOCIATES CORPORATION 3,411,100 7.74 $42,161,196 31-Mar-05
MACKENZIE FINANCIAL CORPORATION 2,840,000 6.44 $35,102,400 31-Mar-05
WELLS FARGO & COMPANY 2,229,785 5.06 $27,560,142 31-Mar-05

Marquette University AIM Fund October 4, 2005 Page 25
Placer Sierra Bancshares PLSB
Price: $26.35 ($20.03 - $30.90) September 27, 2005 Russell 2000: 647.35 (558.36-688.51) Steven Holtkamp
Placer Sierra Bancshares operates as the holding company for Placer Sierra Bank (PSB) that provides various financial and banking services to small and medium sized businesses and individuals in California. The bank offers various deposit products, including corporate and consumer savings, checking, money market accounts, and certificates of deposit, as well as a range of online banking and cash management services. Its lending activities include provision of secured and unsecured commercial and consumer loans, commercial and residential real estate mortgage loans, Small Business Administered loans, and residential and commercial construction loans. PSB also provides automated teller machine and credit card services. As of June 30, 2005, the bank operated 40 branches. In addition, PSB invests in the U.S. Treasury and government agencies securities, obligations of states and political subdivisions, and other securities. The company is based in Sacramento, California. Recommendation In the next several years I believe that Placer Sierra should be able to grow earnings in the 20% range annually. PLSB is capitalizing on the high growth markets of north, central, and southern California. Placer has an experienced management team who know all markets in which it serves. Low cost funds have provided for a wide margin and a competitive advantage over its peers. Current valuations of PLSB are reasonable, and have found the bank to be undervalued. I am setting a price target of $33 implying a 20% return. PLSB has a dividend yield of 1.82%. Investment Thesis
• California markets have been the fastest growing in the nation. This has allowed Placer to earn a 5 year CAGR on net income of 66%. A major driver of this growth is in loans which have grown at 20% in the first half of the year and have a 5 year CAGR of 15%. At this point the bank has reached a size where small acquisitions are complementary to their loan portfolio. In 2004 the bank acquired the Bank of Orange County for their well established commercial lending business. The bank also plans on placing new branches in Northern and Southern California.
• Experienced management is leading PLSB’s expansion. The bank plans to expand down from Northern California to Modesto, Fresno, and Bakersfield. To oversee this process, Placer Sierra hired a senior vice president of Bank of America. There is now a new office operational in Fresno. In the Southern California markets the bank plans to expand into San Bernardino and Riverside, and to head up this effort the bank has hired the former CEO of Pacific Century Bank. It is the banks continued goal to aggressively recruit commercial bankers who have loyal customers. PLSB is currently in the top 10 in deposit market share in 8 out of the 11 California counties in which it serves.
• Low cost of funds is a competitive advantage for the firm. Deposits cost the firm .85% while total interest bearing liabilities had a cost of 1.29% in the MRQ. The average cost of interest bearing liabilities for the firms peers is 2.08%. PLSB is able to do this by attracting demand deposits from business in their market
Key Statistics MRQ Portfolio Weighting 2% Market Cap (M) 394.1 Debt/ Equity 34% Dividend Yield 1.82% NIM 4.56% ROE 10.45% ROA 1.25% LTG Rate 15% P/E '05E 16.12 P/E '06E 13.24

Marquette University AIM Fund October 4, 2005 Page 26
areas. Of the company’s total funding structure, transaction accounts represent 45% of the portfolio, while expensive funds like CD’s and borrowings represent 25%. It is a tribute to management quality to keep cheap funds in a competitive environment that chases rates. Low cost funding and an asset sensitive portfolio allow Placer to keep pressure off of their net interest margin.
• Loan pipeline is strongest in company history. In the first half of the year PLSB was able to secure $241 million in new loan commitments. The firm is targeting $800 million in total commitments by the end of 2005. This will be partly offset by prepayments and the sale of commercial loans to fund expansion into Fresno and Southern California. Total loan growth is expected to be in the 11-12% range.
• PLSB’s asset quality is pristine. Net charge offs/ loans was .08% MRQ and has averaged -.02% in the last 3 years. Non performing assets / total assets was .17% MRQ and averaged .28% in the last 3 years. Peer NCO’s and NPA’s run an average of .09% and .2%, respectively. Valuation After an EPS of $.90 in 2004, a 20% loss, EPS estimates for 2005 are $1.64, or 80% growth. Based on future growth predictions analysts have valued the company at a 20x forward P/E. Estimates for 2006 are $1.98, a 22% increase in EPS. My 12 month price target using a P/E multiple of 20x is $33. The dividend yield is 1.82%. Risks • Large increases in interest rates. Rapid increases in interest rates would not allow the firm to adjust
its portfolio. Funds would become more expensive, and their margins would decrease. • Downturn in the California Housing Market. PLSB’s loan portfolio consists of 24% residential real
estate loans. A sharp downturn in housing valuations would cause a decrease in loan demand. • Non-accretive acquisitions. Acquisitions are a part of PLSB’s growth strategy. If management fails
to acquire a bank that is accretive to overall growth shareholder value will decrease. Outlook and Growth Assumptions - Slight decrease in NIM down toward the 5% range. - Growth in earning assets should more than offset this decrease in margin. - Placer is estimated to have a $.43 3Q EPS. This is a 60% increase YoY. - Management has long term goals of 15% EPS growth, 13% loan growth, and 14% deposit growth.

Marquette University AIM Fund October 4, 2005 Page 27
TOP INSTITUTIONAL HOLDERS Holder Shares % Value Reported Belvedere Capital Partners 7,222,379 47.86 $165,898,045 31-Mar-05 Wasatch Advisors 693,201 4.59 $15,922,826 31-Mar-05 Goldman Sachs 472,294 3.13 $10,848,593 31-Mar-05 Northpointe Capital 441,931 2.93 $10,151,155 31-Mar-05

Marquette University AIM Fund October 4, 2005 Page 28
Novatel NVTL
Price $14.84 ($8.54 - $27.07) Fiscal Year End: Dec.
September 26, 2005 Greg Rawls Russell 2000: 666.29 Novatel is a leading provider for wireless broadband solutions. Novatel's products are designed for wireless, mobile access to information over the internet or local networks. Novatel’s products include third-generation (3G) wireless personal computer card modems, embedded modems, ruggedized modems and communication software to wireless network operations and distributions. Novatel is the global leader in UMTS PC Data Card sales. Recommendation Novatel is an attractive stock because of the strong growth potential for wireless communications. Over the past year NVTL has benefited from this growth as sales tripled in 2004. The company has continued to seek out new wireless growth areas in 2005. NVTL has recently announced that they anticipate bringing eight new products to market in the fourth quarter of 2005. Novatel is prepared to enter into the development of wireless networking through strategic relationships with leading companies such as Lucent, Sprint PCS, Verizon Wireless, and Vodafone. Due to NVTL’s growth potential, continued development of new products, and their strategic relationships with major wireless companies, they should perform well in near future. Investment Thesis • Growth is expected to be strong for wireless communication products in the upcoming years.
The main driver of future growth is the increasing demand for greater bandwidth to support voice, storage, and video on the worldwide web. The rate of growth of communication equipment is expected to in the range of 10% to 15% annually over the next 3 to 5 years. There is a potential that growth could exceed this given the potential that wireless networks could be more widely adopted. Novatel will attempt to continually lead the way with wireless products as the use of wireless technology grows worldwide.
• Strategic relationships with several major wireless companies. NVTL is working with AT&T Wireless, Cingular, Sprint PCS, T-Mobile, Verizon, and Lucent. By working closely with these large manufacturers it will benefit Novatel as these companies work together to improve wireless technology.
• Growth in this industry has exploded in the last year and Novatel’s financial results show that they have benefited from the growth of wireless networking. Novatel had a phenomenal financial year in 2004 and appear to be prepared to maintain those results this year and grow in the future as new wireless products are developed. Novatel anticipates an 8% decline in EPS for fiscal 2005 due mainly to the weaker Euro for much of the year. Novatel sales tripled in 2004 and EPS increased by from $-2.04 in 2003 to $.48 in 2004, due to increased demand for new products.
• Continued innovation and development of new products. Novatel has been at the forefront of developing new technologies for the upcoming year and is expected to bring many more wireless
Key Statistics September 2005
Portfolio weight 2% Market Cap $442 million LT Debt/Total Cap. 0% Dividend Yield 0% ROE 16.3 Bloomberg Est. LTG Rate (5 yr) 27.5 Thomson Consensus Rating 1.89 P/E Fiscal ‘05E 29.8 P/E Fiscal ‘06E 23.6 EPS 2005 $.42 EPS 2006 $.63 EPS 2007 $.92 Morningstar Sector Hardware

Marquette University AIM Fund October 4, 2005 Page 29
products to market in the coming months. Novatel currently has invested heavily in research and development with the goal of not only maintaining their leadership position in the PC card market, but also growing in the embedded modules and convergent solutions markets.
Valuation Novatel is currently undervalued at $14.84 a share. When using the discounted cash flow model, the stock is fairly valued at $17.75. The EPS for 2005 is $.42, $.63 or 2006, and $.92 for 2007. The growth rate for Novatel is an impressive 27.5% over the next five years, and 7% thereafter. The cost of equity capital for Novatel is 8.7% and the trailing PE ratio is 29 times. Risks • Exchange rate risk. Novatel has 66% of its sales overseas and could be affected by large changes in
currency rates. With the majority of Novatel’s’ sales coming from Europe, the value of the Euro is significant for them.
• Increased competition. Novatel will likely see the emergence of several other companies becoming involved in the wireless market given its tremendous growth outlook.
Management Peter V. Leparulo is the CEO for Novatel. He joined the company in 2000 as Corporate and Strategic Development and General Counsel. He was promoted to CEO in January of 2003. Mr. Laparulo and others on the management team own 9% of the shares outstanding and have several stock options as incentives. Outlook and Growth Assumptions • EPS for the second quarter of 2005 where $.10. That was $.01 above analyst estimates. EPS
estimates for the third quarter of 2005 is $.11. • Average analyst estimates EPS for fiscal 2005 to be $.44 and that would be a slight decrease
compared to EPS of $.48 in 2004. Long-term financial goals: • Novatel has a 5 year growth rate average of 27.5% and a 7.1% growth rate during twelve transitional
years. • Novatel operating margins are currently at 13%.

Marquette University AIM Fund October 4, 2005 Page 30
Major Shareholdings % of Shares Held by All Insider and 5% Owners: 9% % of Shares Held by Institutional & Mutual Fund Owners: 76% Number of Institutions Holding Shares: 118
Top Institutional Holders Holder Shares % Value Reported SYSTEMATIC FINANCIAL MANAGEMENT, L.P. 1,388,217 4.78 $14,923,332 31-Mar-05
BARCLAYS BANK PLC 1,285,380 4.43 $13,817,835 31-Mar-05 VANGUARD GROUP, INC. 1,164,875 4.01 $12,522,406 31-Mar-05 CAPITAL GUARDIAN TRUST COMPANY 753,300 2.59 $8,097,975 31-Mar-05

Marquette University AIM Fund October 4, 2005 Page 31
Syntroleum Corporation SYNM
Price: $14.86 ($6.51-$16.50) Fiscal Year End: December 31
October 4, 2005 Ryan Berg Russell 2000: 659.17 (558.36-688.51) Syntroleum Corporation’s principal activity is to develop and license a proprietary process for converting natural gas to synthetic liquid hydrocarbon known as gas-to-liquids or GTL technology. The Syntroleum process produces synthetic liquid hydrocarbons, also known as synthetic crude oil, that are substantially free of contaminants normally found in conventional products made from crude oil. These synthetic liquid hydrocarbons can be further processed into other liquid fuels through conventional refining processes. The products include diesel, kerosene, gasoline, and naptha, Recommendation Syntroleum Corporation remains a highly speculative investment at this point, but its proprietary GTL process for converting stranded natural gas into middle distillate oil products is beginning to gain traction due to some emerging trends in the energy industry. These trends include a growing demand for more environmentally friendly fuels, the shortage of refining capacity, and the enormous amount of stranded gas that will need to be brought to market to meet demand. Furthermore, as the big firms like Exxon Mobil and BP begin to adopt and use this technology it will see increased visibility in the market, and Syntroleum’s stock price should benefit. Finally, Syntroleum’s GTL process has significant cost and scale advantages that provide a competitive advantage over the other firms using GTL technology. Syntroleum represents the only pure play on GTL technology. Given the fact that it is trading at only slightly above the NPV of its first commercialized project, I believe there is sufficient value and plenty upside to make this a great investment opportunity. Thus, I am initiating coverage of SYNM with a buy recommendation of 2%. Investment Thesis GTL Process Capitalizes on Energy Industry Mega-Trends: Continued growth in demand
combined with ever-increasing emissions restrictions on motor fuels is providing tremendous need for low emissions motor fuels, particularly in light of the negligible growth in new crude oil refining capacity. Moreover, despite increasing worldwide consumption of natural gas, there remain hundreds of large accumulations of natural gas in foreign countries that would be “stranded” from markets for the foreseeable future. The combination of these two mega-trends provides an increasingly attractive environment for the construction of GTL plants.
Increased Investor Awareness of GTL Technology: As large integrated oil companies begin to
construct large-scale GTL plants around the world, it will bring increased visibility to firms specializing in the process, like Syntroleum. This could provide a positive catalyst.
Syntroleum’s Patented GTL Process has Advantages: Syntroleum’s technology and process has
demonstrated several advantages over similar technology employed by other companies. These advantages include lower capital and operating costs, safer processes, and plant size flexibility. One of Syntroleum’s process advantages relates to its use of air rather than pure oxygen in combination
Key Statistics Sept. 30, 2005 Market Cap(millions) 823.73 Avg. Daily Volume 453,906 Beta .91 LT Debt/Equity 42.1% Revenue (ttm): 7.03M Total Cash (mrq): 93.90M

Marquette University AIM Fund October 4, 2005 Page 32
with natural gas and steam to generate synthetic gas feedstock. This reduces the size of the plant, cutting costs out of the process. Furthermore, this makes the process economical across a broad spectrum of processing plant scales from largest to smallest, translating to more scaling flexibility than conventional GTL processes used by the large oil companies.
Cheaper than LNG: Development of stranded gas up to this point has been limited to one solution,
LNG, a process of super cooling the gas to convert it to liquid for shipment, then regasifying it for consumption. GTL eliminates much of the infrastructure associated with LNG, thus substantially lowering capital cost.
Valuation For Syntroleum, relative valuation has little meaning, as there are no other purely GTL focused companies to compare. Furthermore, it is difficult to accurately predict cash flows for a DCF without knowing the details of future projects. However, a Net Present Value analysis of Syntroleum’s first commercialized project, the Aje well in Nigeria, shows its NPV to be equivalent to $12 per share assuming a crude oil price of $50 per barrel. Syntroleum is in the midst of evaluating and negotiating bids on at least 6 other projects of similar magnitude, and there is a high likelihood of another project beginning in the near-term, according to management. If the next project has even half the NPV of the Aje project, Syntroleum’s stock would be undervalued. Combining the likelihood of new project announcements and new sources of licensing revenue, SYNM appears to be a good value right now given its prospects for significant growth in the future. Risks There is the risk that Syntroleum’s process will never gain traction, and the company will never break
into positive earnings. There is the risk that another company will come up with a more efficient GTL process, thus
rendering Syntroleum’s patented process obsolete. Oil and gas prices also pose a risk because prices lower than $25 for crude oil or higher than $.50/mcf
for source gas, most GTL projects would be uneconomical

Marquette University AIM Fund October 4, 2005 Page 33
Major Shareholdings % of Shares Held by All Insider and 5% Owners: 25% % of Shares Held by Institutional & Mutual Fund Owners: 56% Number of Institutions Holding Shares: 67
Top Institutional Holders Holder Shares % Value Reported PEAK INVESTMENTS, LLC 7,301,240 13.20 $89,367,177 31-Mar-05 LEGG MASON INC. 7,021,519 12.69 $85,943,392 31-Mar-05 WELLINGTON MANAGEMENT COMPANY, LLP 5,023,653 9.08 $61,489,512 31-Mar-05

Marquette University AIM Fund October 4, 2005 Page 34
Key Statistics: Sept. 2005 Weighting: 2% Revenue: 372,500M Profit Margin: 6.87% Op. Margin: 11.67% Forward P/E: 18.4 Price/Book: 4.27 Price/Sales: 1.37 EPS Growth: 19% OCF: 7.248M Cash: $784,000 Total Debt: 6.859M
Jos. A. Bank Clothiers JOSB
Price: $41.27($23.73-46.60) Fiscal Year End: January
October 4, 2005 Ray Auth Russell 2000: 658.07 (558.36-688.51) Jos. A. Bank Clothiers, Inc. engages in the retail distribution of men’s tailored and casual clothing and accessories. They distribute their products under the Jos. A. Bank label through retail stores, catalog and Internet direct marketing and franchisees. JOSB has two reportable segments: stores and direct marketing. The stores segment includes all of the company owned stores excluding factory stores. The direct marketing segment includes all sales through catalog and Internet. Both segments offer a similar mix of men’s clothing to the retail customer. The store segment offers complete alterations. The CEO is Mr. Robert N. Wildrick, who is 61 years old and has been with the company for six years. Recommendation The future for Jos. A. Bank Clothiers looks promising. JOSB should continue revenue growth for the next five years of about 20% annually. During the period of store expansion, JOSB’s earnings will grow by 20% annually as well. Estimated earnings for 2005 are $2.18 whereas 2006 earnings are expected to amount to $2.65. The existing trend towards dressier clothing puts JOSB in a positive position in the retail clothing industry. They have a solid business model and should continue to gain market share within the industry. JOSB’s “pillars of success” are: high quality career clothing at a reasonable price; broad selection; product innovation; and superior customer service, should move the company and its brands to the top ranks of the industry. Investment Thesis
• Solid Market Positioning: Due to the trends in the apparel industry moving towards dressier clothing, JOSB should be primed to gain market share. Currently, JOSB maintains a 6% market share in this industry and is poised for 20% annual growth. Their primary competition is with Men’s Warehouse, Brooks Brothers, and JC Penney. These are all companies that have a firm footing within; however, JOSB targets more affluent consumers, which is a lucrative niche in the apparel industry.
• Rapid Growth Movement: JOSB is steadily increasing their store count. Currently they have
291 stores with plans to expand to 500 stores by 2008. This rapid expansion will have a major impact on future revenues and earnings. In addition, they should gain considerable amount of market share from their primary competitors.
• Demographics: JOSB targets 30-55 year old male professionals. They attract their customers
with above average annual income who enjoy a professional lifestyle of business, travel, and sport. The current demographic trend in America plays favorably into JOSB’s business model. The baby-boom generation is the largest, most affluent segment of the U.S.; as a result, JOSB has a large pool of current and potential customers to attract with their niche clothing. This is why I believe their growth efforts should succeed.
Marquette University AIM Fund October 4, 2005 Page 35
Valuation Annual revenue growth of 20%, along with earnings growth of 19%, should continue for the next 5 – 7 years. Based on these projections, the discounted cash flow model reveals a fair value of $49.30 – indicating that that JOSB is undervalued by approximately 20%. JOSB’s P/E stands at 18.4x, whereas the industry average is 24.4x. Legg Mason gives JOSB a target price of $48.00, Roth Capital Partners projects an intrinsic value of $56.00, Wells Fargo Securities gives a fair value of $51.00, and Thomson Financial Company estimates a price of $50.67. There are nine analysts who cover JOSB and seven of them have buy recommendations while the other two have hold recommendations. Risks
• The competition in this industry is fierce. Competitors have the ability to eat into each other’s market share and steal revenues via aggressive advertising and discounting campaigns.
• JOSB is entering into a massive growth phase of their business life cycle. Management will be tested during the roll-out phase which could put a drag on earnings and revenues.
• Growth beyond 2007 and 2008 will depend on how well management discovers and exploits strategic opportunities. The locations of the new stores must support the company’s growth model.
• Due to the levered balance sheet of JOSB, interest rates could affect earnings and financial flexibility.
• The trend is dressier clothing could be short-lived. Management CEO and President, Mr. Robert N. Wildrick heads the management team at JOSB. He is 61 years old and has been with the company for six years. The CFO is Mr. David E. Ullman, who is 47 years old. Outlook
• JOSB is poised to make a strong, positive move in the apparel industry with the number of stores climbing to 500 by 2008. This provides a solid growth opportunity which will boost earnings and revenues by 20% for the next 5-7 years.
• The demographics play to the favor of JOSB during the next few years with the ‘baby boomers’ leading the way. This affluent group is the target market to purchase clothing from JOSB.
• Earnings growth of 19% over the next few years should bring JOSB to the forefront of apparel companies as they continue to gain market share from Men’s Warehouse and JC Penney.

Marquette University AIM Fund October 4, 2005 Page 36
TOP SHAREHOLDERS Holder Shares % Value Reported PARADIGM CAPITAL 937,200 6.91 $27,459,960 31-Mar-05 RS INVESTMENT MNGT 710,749 5.24 $20,824,945 31-Mar-05 AMVESCAP PLC 706,098 5.21 $20,688,671 31-Mar-05 ARBOR CAPITAL MNGT 682,325 5.03 $19,992,122 31-Mar-05 WINSLOW CAPITAL 597,583 4.41 $17,509,181 31-Mar-05 AIM SMALL CAP GRW 480,174 3.54 $14,069,098 31-Mar-05 FMI FOCUS FD 442,475 3.26 $12,964,517 31-Mar-05

Marquette University AIM Fund October 4, 2005 Page 37
Blue Nile, Inc.
NILE Price: $32.00 (23.36-35.90)
September 30, 2005 David Trotter Russell 2000: 665.00 (558.36 – 688.51) Founded in 1999, Blue Nile, Inc. is a leading online retailer of high quality diamonds and fine jewelry. Blue Nile’s primary website at www.bluenile.com showcases over 55,000 independently certified diamonds and more than 1,000 styles of jewelry, including ring, wedding bands, earrings, necklaces, pendants, bracelets and watches. Blue Nile specializes in the customization of diamond jewelry with the “Build Your Own” feature that offers customers the ability to customize diamond rings, pendants and earrings. Recommendation I believe Blue Nile will be able to achieve 22 to 28% sales growth for the next several years, fueled by the introduction of other types of jewelry and the continued growth in market share. The company has a strong balance sheet with $4.31 of cash per share and no long-term debt. Blue Nile will also continue to improve its operating margin as non-engagement rings become a bigger portion of their sales. Non-engagement ring products have a higher gross margin than engagement rings. The company also is looking to expand more internationally in the UK and Canada. The price is a reasonable buy at a below average multiple compared to its peer group. I have given it a target price of $43.00 and a lower limit of $28.00. The company pays no dividend. Investment Thesis
• Market Dominance. NILE is the leader in online jewelry and is poised to capture more market share. NILE is known for its great customer service and ability to offer great diamonds at inexpensive prices. The threat of new entrants into the market is minimal considering NILE’s prestigious image and how it stacks up against Amazon and Overstock. Who’s going to tell there fiancé they bought the wedding ring from overstock.com?
• Growth. In the last month, at a consumer conference held by Thomas Weisel, CEO Mr. Vadon stated that sales growth has not been caused by existing customers purchasing more items or at higher prices, but mainly through increased market share and new customers. Growth will continue to increase at an impressive rate with international expansion and plans to increase advertising. If the company can effectively take advantage of new markets and their ad campaigns, the growth will lead to increased market share and higher purchase amounts.
• Introduction of new products. NILE is looking at expanding its non-engagement ring products. These typically have a higher margin and will allow NILE to take advantage of its prestigious image to take existing sales away from other online retailers.
• Economic moat. NILE has exclusive relationships with diamond wholesalers that allow it to minimize inventory cost, while keeping a steady and predictable supply of diamonds. NILE has
Key Statistics September 2005 Portfolio Weighting 2% S&P Rating N/A Market Cap. $594 M LT Debt/Total Cap. 0% Revenue (ttm): $186.38M Total Cash (mrq): $81.31M Qtrly Earnings Growth (yoy): 49.80% Dividend Yield 0% P/E Fiscal ‘05E 41

Marquette University AIM Fund October 4, 2005 Page 38
an advantage against any new competitor because of the difficulty in creating a supply chain and matching their low costs.
Valuation
• Discounted Cash flow. Using the discounted cash flow method, I arrived at an intrinsic value of about $43.00 – assuming a discount rate of 9.5%, a long term growth rate of 20%, and a terminal growth rate of 3.5%.
• Earnings Multiple Expansion. Currently the company is trading at 41 times 2005 EPS. NILE’s competitors are currently trading at a mean of about 41.0 times earnings. Given the higher growth and market position, NILE should have a higher multiple than its peers. Using a 51 PE multiple, the price would be fairly valued around $40.00 a share, slightly lower than the discounted cash flow price.
Risks
• Market Entrants. Other large online retailers my attempt to move into NILE’s market space, eroding Nile’s revenues and margins. Although unlikely, if another company can mimic NILE’s customer service, supply chain and prestigious image, it could negatively impact the company.
Management
• Earlier this year, the board of directors approved a $30 million stock buyback program. The following is the list of the current management team:
• Mark Vadon, Chairman, CEO. Salary: $375.000 • Diane M. Irvine CFO. Salary: $341.000 • Robert Paquin, COO. Salary: $359.000 • Darrell Cavens, CTO. Salary: $148.000 • Susan Bell, VP of Marketing. Salary: 205.000, exercised $130,000 in options.
Outlook and Growth Assumptions:
• Sales growth. Assuming sales to grow 25% in 2005 to 211.9 compared to 169.2 in 2004. In 2006, I estimate that sales will grow by 24%. I think that sales will continue to grow between 22% and 28% for several years.
• EPS growth. I’m assuming that EPS will continue to grow around 20% for the next several years. EPS will be driven by the increased market share and the operating margin improvement from the introduction of higher margin products.
• Balance sheet. NILE has a great balance sheet with more than $80 million in cash and no debt. As stated before, I think that this cash will be used for stock buybacks and increased capital expenditures on technology in expanding markets.
• NILE appears undervalued and a 2% portfolio weighting is recommended.

Marquette University AIM Fund October 4, 2005 Page 39
Top Shareholders (% of shares outstanding)
o 83% held by institutions. o Bamco, Inc: 9.4% o Transamerica Investments: 8.5% o Mark Vadon, CEO: 8% o Trinity Ventures: 4.5%