APPLIED ECONOMICS - South Feather Water
41
APPLIED ECONOMICS OROVILLE RETAIL LEAKAGES ANALYSIS FINAL REPORT PREPARED FOR: STRATEGY ONE 661) 366 - 0756 MAY 7, 2002 Economic & Fiscal Impact Market Analysis Economic Development 1.
Transcript of APPLIED ECONOMICS - South Feather Water

APPLIEDECONOMICS
OROVILLE RETAIL LEAKAGES ANALYSIS
FINAL REPORT
PREPARED FOR:
STRATEGY ONE
661) 366 -0756
MAY 7, 2002
Economic & Fiscal Impact Market Analysis Economic Development
1.

4„5....,..,,
Strategy One 4
Strategic Directions in Economic Development
Status Report for: Dated: June 7, 2002Ruben Duran, City of Oroville
Submitted By:Jennifer Faughn, Strategy One661 -366 -0756
STATUS on Plan for Retail Recruitment
Goal:
Develop a retail recruitment campaign with collateral materials that over a two to three year period will result in the attractionof a major user and a number of smaller users.
Retail Marketing Plan Development and Implementation
Phase 1: Strafe! is Plannin
Plan of Action Status
Conduct Retail Potential Analysis study on Oroville Applied Economics completed a Retail Leakage Analysis onMay 7th that explored:
Oroville Trade Area Profile
Retail Expenditures of residents, businessesand visitors.
Retail Sales and Leakage, andProjected Retail Expenditures and Sales.
A copy of the report was distributed to the City Council.
Conduct a brief analysis of Oroville's "SWOT's, Community staff, organizations, and stakeholders wereCustomers, Competition, Positioning and Product” leveraged to evaluate the strengths and weaknesses and
preparedness for recruitment of retail. During this process,Strategy One performed the following actions:
Examined existing Oroville studies and marketingmaterials
Distributed a brief written questionnaire tocommunity stakeholders in advance of a strategysession to create baseline information on budgets,targets, marketing efforts, etc.Conducted a strategy session for the
stakeholders: (i.e. City Council, Staff, OEDCO,other organizations and citizens)Examined like- sized" communities to evaluate
similar efforts, andResearched potential retail client -types based onthe retail leakage study.
A follow -up session will be conducted to present
Strategy OnePMB #110, 267IA Oswell Street * Bakersfield, CA 93306
results and marketing recommendations to the CityCouncil on July 2m
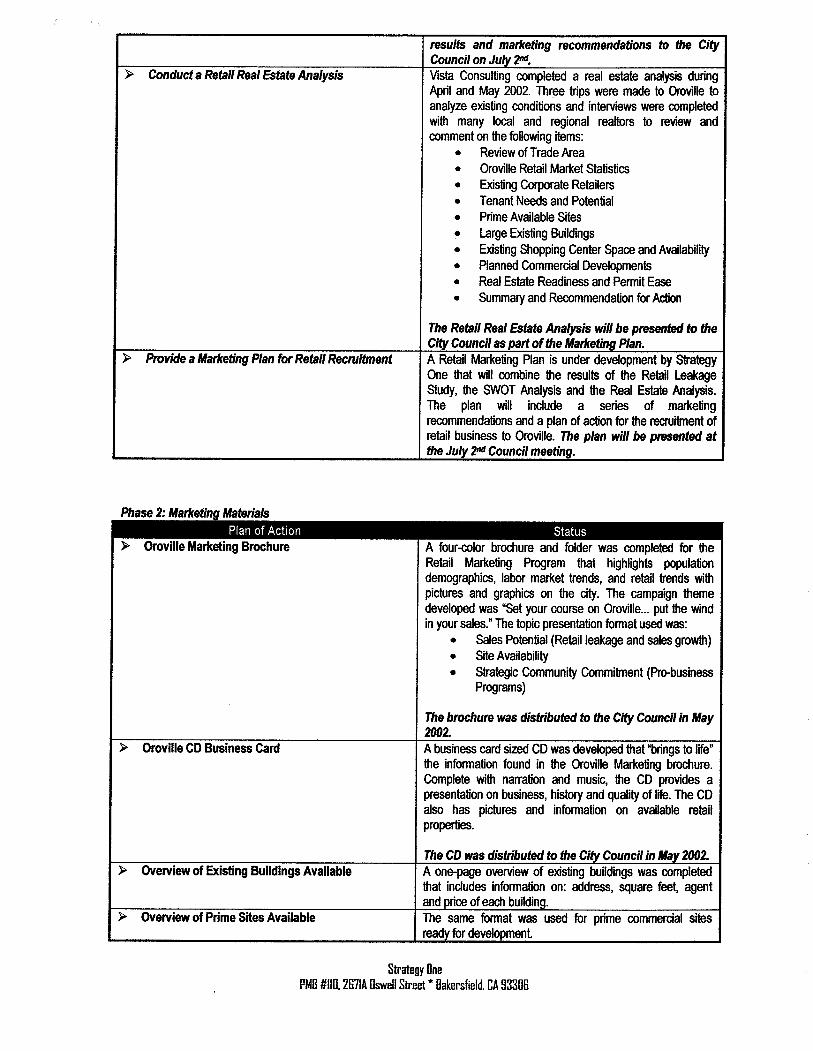
Conduct a Retail Real Estate Analysis Vista Consulting completed a real estate analysis duringApril and May 2002. Three trips were made to Oroville toanalyze existing conditions and interviews were completedwith many local and regional realtors to review andcomment on the following items:
Review of Trade Area
Oroville Retail Market Statistics
Existing Corporate RetailersTenant Needs and Potential
Prime Available Sites
Large Existing BuildingsExisting Shopping Center Space and AvailabilityPlanned Commercial DevelopmentsReal Estate Readiness and Permit Ease
Summary and Recommendation for Action
The Retail Real Estate Analysis will be presented to theCity Council as part of the Marketing Plan.
Provide a Marketing Plan for Retail Recruitment A Retail Marketing Plan is under development by StrategyOne that will combine the results of the Retail LeakageStudy, the SWOT Analysis and the Real Estate Analysis.The plan will include a series of marketingrecommendations and a plan of action for the recruitment ofretail business to Oroville. The plan will be presented atthe July2Council meeting.
Phase 2: Marketin f Materials
Plan of Action Status
Oroville Marketing Brochure A four -color brochure and folder was completed for theRetail Marketing Program that highlights populationdemographics, labor market trends, and retail trends withpictures and graphics on the city. The campaign themedeveloped was "Set your course on Oroville... put the windin your sales." The topic presentation format used was:
Sales Potential (Retail leakage and sales growth)Site AvailabilityStrategic Community Commitment (Pro - businessPrograms)
The brochure was distributed to the City Council in May2002.
Oroville CD Business Card A business card sized CD was developed that "brings to life"the information found in the Oroville Marketing brochure.Complete with narration and music, the CD provides apresentation on business, history and quality of life. The CDalso has pictures and information on available retailproperties.
The CD was distributed to the City Council in May 2002.Overview of Existing Buildings Available A one -page overview of existing buildings was completed
that indudes information on: address, square feet, agentand price of each building.
Overview of Prime Sites Available The same format was used for prime commercial sitesready for development.
Strategy OnePIE #110.2671A °swell Street * Bakersfield. CA B3306

4 -
Phase 3: Recruitment ofRetail IndustryPlan of Action Status
ICSC Conference- Monterey Staff attended the regional ICSC conference in Montereyand met with potential retailers. Strategy One prepared a 4-color PowerPoint handout to show Oroville's retail leakageand potential, and demographics on Oroville. Nineteen (19)contacts were made at the conference and follow -uppackages sent.
Develop list and database of retail prospects and An on -going list and database of contacts that representdevelopers potential retail business for Oroville has been compiled from
several sources induding: conferences, retail organizationsand real estate contacts. Each contact is evaluated to
match growth patterns for Oroville with company /prospect'sdemographic requirements.
ICSC Conference - Las Vegas Staff and Strategy One attended the ICSC conference inLas Vegas. Thirty-three (33) contacts have been followed -up on and many more are being compiled from the Orovilleparticipants. Once Strategy One receives the leads, abrochure will be sent and follow -up call made.
Follow -up and contact with retail prospects, Follow -up packages with the new brochure were mailed tobrokers and tenant representatives all potential leads from trade shows and other sources. A
phone call follow -up is underway in June.Direct mail and contact program to IDRC and Put on hold due to contract expenses of ICSC ConferenceNACORE retail companies used towards staff time.
Monitor Retail trends Strategy One monitors retail market and prospect trends bysubscribing to ICSC and Dealmakers information service.
Strategy OnePMB #1111.2671A Osweli Street * Bakersfield, CA 93308
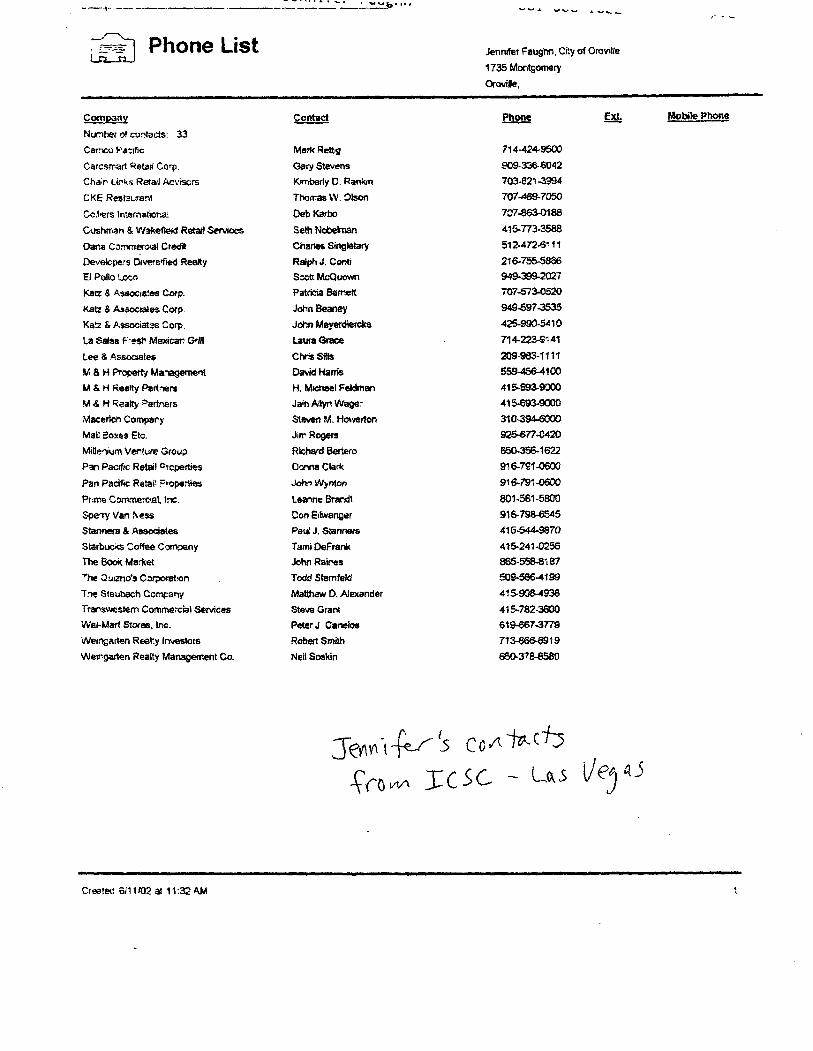
Phone ListL - C1
Jennifer Faugtm City of Orovitle
1735 Montgomery
Oroville,
Company contact Ph_ette Ext. Mobile Phone
Number of cortacls: 33
Car= Pacific Mark Rettig 7144249500
Caresmart Retail Corp_ Gary Stevens 909. 336.6042
Chant.irks Retail Ar_v isors Kimberly C. Rankin 703 - 6213994
CKE Restaurant Thomas W. Olson 707 -469 -7050
Cockers lntematiora: Deb Karbo 707- 863-0188
Cushman & Wakefield Retail Services Seth Nobeknan 415 - 773 -3588
Dana Commercial Credit Charles Singletary 512.472.6111
Developers Diversfiied Realty Ralph J. Conti 216 - 755 -5866
El Polio !Low Scctt McQuown 949-399 -2027
Katz 6 Associates Corp. Patricia Barnett 707 - 573-0520
Katz & Associates Corp. John Beaney 949-5973535
Katz & Associates Corp. John Meyerdiercks 425- 990 -5410
La Salsa F; esh Mexican. Grill Laura Grace 714-223 -9141
Lee & . Associates Chris Sifts 209-9W-1111
M & H Property Management David Harris 559-456 -4100
M & H Realty Partners H, Michael Fekknan 415. 693.9000
M & H Realty Partners Jain Allyn Wager 415693 -9000
Materiel" Compary Steven M. Howerton 310394 -6000
Mau Boxes Etc. Jim Rogers 925-677 -0420
Mitlenium Venture Group Richard Bolero 650. 356 -1622
Pan Pacific Retail ercperties Donna Clark 916 - 7
Pan Pacific Retai! Fropenies John Wyrdon 916 -791 -0630
Prime CommerciaL Inc. Leanne Brandt 801 -561 -5800
Sperry Van Ness Con E!twanger 916-798-6545
Stanners & Associates Paul J. Scanners 415-544-9870
Starbuc s Coffee Company Mini DeFrank 415.241 -0256
The Book Market John Raines 865. 558.8187
The 0uizno's Caraoret!on Todd Stemter° 509-586-4199
Tine Steubach Company Matthew D. Alexander 415908-4938
Trarswestem Commercial Services Steve Grant 415-782-3600
War -Mart Stores, Inc. Peter J Cameros 619.6673779
Weingarten Realty Investors Robert Smith 713-866-6919
Wei•garten Realty Management Co. Neil Soskin 660. 3
eo t t --(ems' S Co A C
fro 1C SC UXs eel4 C
Created 6/11102 at 11:32 AM 1

Vc1I.Iy I C1 I
Qu61111uv, JVV 1 Vt.L
r ,4 y
Phone List Jennifer Faughn, City of Orovdle
1735 Montgomery
Oroville,
Company Contact Phone Ext. Mobile Phone
Number of contacts. 19
99c Only Stores Jeff Gold 323- 980.8145
Baja Fresh Mexican Grill Randy Carucci 605- 495 -4704
Caffe E Via, I L.C. Ron Loze 925- 930 -7722
C8 Richard Ellie Jeff Vitek 909-418-2234
Ch.potie Mexican Grill Carol Mazetti 415-380-5098
Colliers International Tana Michell 925-279-4603
Cornish d Carey Commercial Suzi Sutherland 408- 982-841C
Excess Space Disposition Howard Matder 714-594-9803
Harsch investment Properties, LLC JenilynnJohnson 510-521-8100
In -N -Out Burger Ron Voile 626- 213 -7363
Michael's Stores, .nc Gary H Market 925 -461 -0328
Orchard Supoy Hardware Julie Leverton 408- 365 -2331
Raiph's Grocery Company Tim Seiler 916-861 -1413
Retail Enterprse Gro plfailen Group, Inc. Terrence P. Tatten 415- 905-8840
Safeway, inc. Steve Berndt 925-467-3063
Subway Real Estate Corp. Diana Kazarian 800-888-4848
The Floyd Company Raymond Floyd 714- 731 -6600
The Staubech Company Matthew Alexander 415-908-4930
T.:X Companies Lynn Gibson 650-903-2253
CD 5
yoy
cr0 vIA
Created 6!11/02 at 11:33 AM 1

is
i1
8ZVXIQNIddd
ZZSASS32IfILIQNIIdXII ¶VJ22IQII.LOIIfO2Id0'S
TSIIJV)IVII'ISTWS '111VIMI017
01Sfl2If1.LIQNIIdXII'IO1ISIA
6Sd2If1ZIQNddXIISSRIISflLZ'£
9Sd2iflJJGNddXHIviimacusau1
9SII2Ifl.LIQNIIdXII11V12210
TIHO2I(1dd2PdRQV2T.L0'Z
NOIIDf1QONINI01
S,LN3.LNO,) JOJ7811

1.0 INTRODUCTION
This report presents key findings of the Oroville Retail Leakages Analysis performed for the City ofOroville by Applied Economics. It examines the local and regional trade area for Oroville, shown onMap 1 on the next page. Oroville's local trade area is defined as the greater Oroville area including theTowns of Biggs and Gridley, and represents the typical market area for neighborhood stores used by thelocal population. The regional trade area includes Butte, Sutter, and Yuba Counties, and representsOroville's market area for community and regional stores that draw people to travel longer distances forthese goods.
Consumer demand was compared to the amount of taxable sales in the local and regional trade areas inthis study to determine the potential amount of taxable sales not being captured, or "leaking" out ofOroville trade areas. A marketing brochure was also made for the local trade area of Oroville. Thebrochure analyzed the market area by total sales, instead of taxable sales, though. Significant differencesexist between total and taxable retail sales reported in some store type categories, like Food Stores andGeneral Merchandise because they include some retail sales that are not taxable. General Merchandisestores include sales of drugs, which are not taxable, therefore, not reported in this report. Approximatelyone -third of retail sales at Food Stores are taxable, making the results of analysis for Food Storessomewhat misleading. For example, Total sales at Food Stores are generally equal to total sales ofAutomotive Group stores. But, since all sales at Automotive Group stores are taxable and only aboutone -third of food store items are taxable, the retail sales at Automotive Group stores appear much larger.
The next section of this report, Trade Area Profile, examines growth in population, household, income,and retail buying power between 1980 and 2000 for the State of California, the regional trade area, andthe local trade area. This section shows how the State and trade areas changed over the past twenty yearsin relation to each other, and helps explain current growth, as well as earning and spending trends in theseareas.
The third section, Retail Expenditures, shows the spending patterns of residents, businesses, and visitorsin the local and regional trade areas in 2000. Residential expenditures include spending patterns ofresidents in California, and the local and regional trade areas based on type of store, and are used toestimate the ratio of expenditures per household in the local and regional trade areas compared to those atthe State level. In addition, included is a household ratio of expenditures by type of good that is adjustedto reflect the income levels of residents in the trade areas. Retail demand from business activity in thelocal and regional trade areas is shown by retail and service expenditures for industries based on 2 digitSIC. Visitor expenditures examine taxable dollars spent by tourists by type of tourism industry todetermine its impact in the local and regional trade areas. The final portion of this section, then,combines the retail expenditures of residents, businesses, and visitors to determine the total retail demandin the local and regional trade areas.
Section 4.0, Retail Sales and Leakages, compares the total retail demand shown in the last section, toestimated retail sales by store type, to determine retail categories that are experiencing leakages in thelocal and regional trade areas. The last section, Projected Retail Expenditures and Sales, estimates growthin population, household, income, and retail buying power for 2005, and presents expected growth forhousehold expenditures and total retail demand by store type. The change in projected taxable retaildemand is then combined with current leakages, and shows future growth of store types in the local andregional trade area in 2005.
e
APPLIED ECONOMICS

MAP1
LOCAL AND REGIONAL TRADE AREAS
r
1
No
99
1 Butte Co,70
f ) 9$ 0f
SIMFAI rLfri
Yuba Co.
Sutter Co.70
Local Trade Area
Regional Trade Area
2
APPLIED ECONOMICS

II
2.0 TRADE AREA PROFILE
Table 1 shows demographic data and the retail buying power of residents in California, and the local andregional trade areas. Population growth in California and the regional trade area have almost mirroredeach other since 1980. Between 1980 and 1990, California and the regional trade area grew by anaverage annual rate of 2.3 percent. During the same period, the local trade area grew at a lower averagerate of 1.2 percent per year. Between 1990 and 2000, California and the regional trade area grew by 1.4percent and 1.2 percent per year. Since 1990, the local trade area grew by an average annual rate 0.5percent per year. In 2000, an estimated 391,400 people lived in the regional trade area, and 65,560 livedin the local trade area.
Household growth directly impacted population growth. As shown, population and housing growth ratessince 1980 have almost mirrored each other in California and the trade areas. Also, households in the
State of California and the regional trade area, like population, grew at similar rates, with the local tradearea experiencing less growth. The regional trade area actually grew at a somewhat higher annualaverage rate than California between 1980 and 1990, by 2.1 percent compared to 1.9 percent growth peryear, and in the past decade, by 1.3 percent and 1.2 percent per year, respectively. In comparison,households in the local trade area grew an average of 1.4 percent per year between 1980 and 1990, and by0.6 percent annually between 1990 and 2000. As a result, the regional trade area had about 142,000households in 2000, and the local trade area had almost 23,500 households.
The mean household income grew more significantly for California residents than regional or localmarket area residents from 1980 to 1990. California resident's mean household income grew the most, atan average of 7.5 percent per year between 1980 and 1990. Mean household income in the regional tradearea grew at an average annual rate of 6.1 percent between 1980 and 1990, compared 5.1 percent in thelocal trade area. Between 1990 and 2000, though, household incomes for the three areas grew at similaraverage annual rates. The mean household income for California residents in 2000 was $66,816, andgrew an average of 3.7 annually, from 1990. In the past decade, resident's mean household income in thelocal trade area grew on average 3.6 percent per year, reaching $43,422, with regional trade arearesident's mean income growing an average of 3.5 percent per year to $39,023.
The aggregate income for the three areas was estimated by multiplying the number of households to themean household income, showing the potential amount of money that residents could spend. Again,California's income grew at a higher annual rate than the regional or local trade areas between 1980 and
1 990. Between 1990 and 2000, the disparity between aggregate incomes for these areas decreased. In thelast decade, California's aggregate income grew annually by 5.0 percent, from $480.6 billion to $785.1billion. The aggregate income for the regional trade area grew by somewhat less, on average 4.8 percentfrom $3.5 billion to $5.7 billion between 1990 and 2000, and the local trade area's aggregate income grewon average 4.2 percent per year increasing from $548 million to $830 million.
Retail buying power was estimated by multiplying aggregate income by the fraction of total residentialretail expenditures compared to mean household income. Retail buying power is the portion of totalincome that people spent on retail items, discussed in the next section. Currently, the regional trade areahas over $3.6 billion in buying power, while the local trade area has a retail buying power of $560million. The annual growth of retail buying power for these areas was equal to the growth in aggregateincome.
On average, California residents spent 47.5 percent of their mean household income on retailexpenditures, regional trade area residents spent 50.1 percent of their mean household income on retailexpenditures, and local trade area residents spent 52.4 percent. Because Oroville residents on average
3
APPl.If D ECONOMICS

have less income than residents in the regional trade area or State, they must use a larger portion of theirincome on retail expenditures.
Based on the demographic and buying power data on Table 1, the population and households of theregional trade area represent 1.0 percent of the population and households in the State of California, andthe population and households in the local trade area is equal to slightly more than 16.0 percent of thepopulation and households in the regional trade area. In comparison, the aggregate income of the regionaltrade area is equal to 0.7 percent of California's, with the local trade area's aggregate income equal to14.7 percent of the regional trade area. Moreover, the retail buying power of the regional trade area isequal to 0.8 percent of all California households, and the local trade area has 16.2 percent the retailbuying power of the regional trade area.
TABLE 1
HISTORIC POPULATION, HOUSEHOLDS AND BUYING POWER* DATAOROVILLE REGIONAL AND LOCAL TRADE AREAS COMPARED TO
THE STATE OF CALIFORNIA: 1980 - 2000
California Regional Trade Area Local Trade Area
Annual Annual Annual
Number Change Number Change Number Change
Population1980 23,667,908 245,830 46,5501990 29,760,022 2.3% 307,763 2.3% 54,373 1.6%
2000 34,207,000 1.4% 345,200 1.2% 57,476 0.6%
Households
1980 8,629,861 93,217 17,5191990 10,381,206 1.9% 114,552 2.1% 20,0961 1.4%
2000 11,750,137 1.2% 130,869 1.3% 21,366 0.6%
Mean Household Income (Current Year $)1980 22,424 17,079 16,5661990 46,295 7.5% 30,917 6.1% 27,288 5.1%
2000 66,816 3.7% 43,422 3.5% 39,023 3.6%
Aggregate Income (Millions of Current Year $)1980 193,516 1,592 2901990 480,598 9.5% 3,542 8.3% 548 6.6%
2000 785,097 5.0% 5,683 4.8% 834 4.3%
Retail Buying Power (Thousands of CY $)1980 91,906,352 797,584 152,0261990 228,249,871 9.5% 1,774,275 8.3% 287,257 6.6%
2000 372,865,252 5.0% 2,846,922 4.8% 436,760 4.3%
Sources:
1980, 1990, 2000 Income Data - Claritas Inc., ClaritasConnect, 2002.2000 - California & Regional Trade Area - California Department of Finance, 2002.2000 - Local Trade Area - Applied Economics, 2002.
By Applied Economics based retail sales as a percent of income forthe State and each trade area.
Figure 1 graphically portrays population and household growth for the regional and local trade areasbetween 1980 and 2000, showing the magnitude of growth for these areas in the past 20 years.
4
APPLIED ECONOMICS

FIGURE 1
OROVILLE REGIONAL AND LOCAL RESIDENT PROFILE
POPULATION AND HOUSEHOLD: 1980 — 2000
0350,00Regional Population
325,000 Regional HouseholdsIll Local Population
300,000 0 Local Households
275,000250,000225,000
200,000 --V1175,000
150,000125,000 ---Z-100,000 -
4
75,000
50,000 -k f
s1 a
25,000 1
1980 1990 2000

FIGURE 2
ADJUSTED YEAR 2000 CONSUMER EXPENDITURE RATIO BY RETAIL CATEGORY IN THE LOCAL & REGIONAL TRADE
AREAS COMPARED TO THE AVERAGE STATE OF CALIFORNIA HOUSEHOLD
1.600600
t . Regional - Raw
1.400 Regional - Income Adjusted
j O Local - Raw
L - Income Adjusted Iz 1
1.200 - 7 t C1
I'I. I
1.0001
1l
m 1 I
1
1;
II
t I i -i
k, I.
f : rhIL,
I . i 1 llL I ri
l0.600 a f
r
r1 a I' Ij s C L i
1 1 4 - i i; { f I I 1' . , s i lr''s f F,
s
I t1 , 1 I i
0.400 --. I i ( i t
1 i I i i 1 i I 1I
1Ei t- d i I . „, d i f
1 s j Is p
L
I I4 F IL a I I i ri 3
x t , ? it I 1r I k
1I
S x. ti 6k4y
el
0.200 - - I , if. :
E i 1 3 i I1, E y
I. IF E i 1 l I 1 E
DJ, i1
t l
t 2
tom y'9e ipp .. .
p
t, .. _ . ..
0.000 - .. k _
Apparel Drugs Food At Food & Drink Home Home Building Automotive Misc. Retail
Home Out Furnishings Electronics Materials Group
00
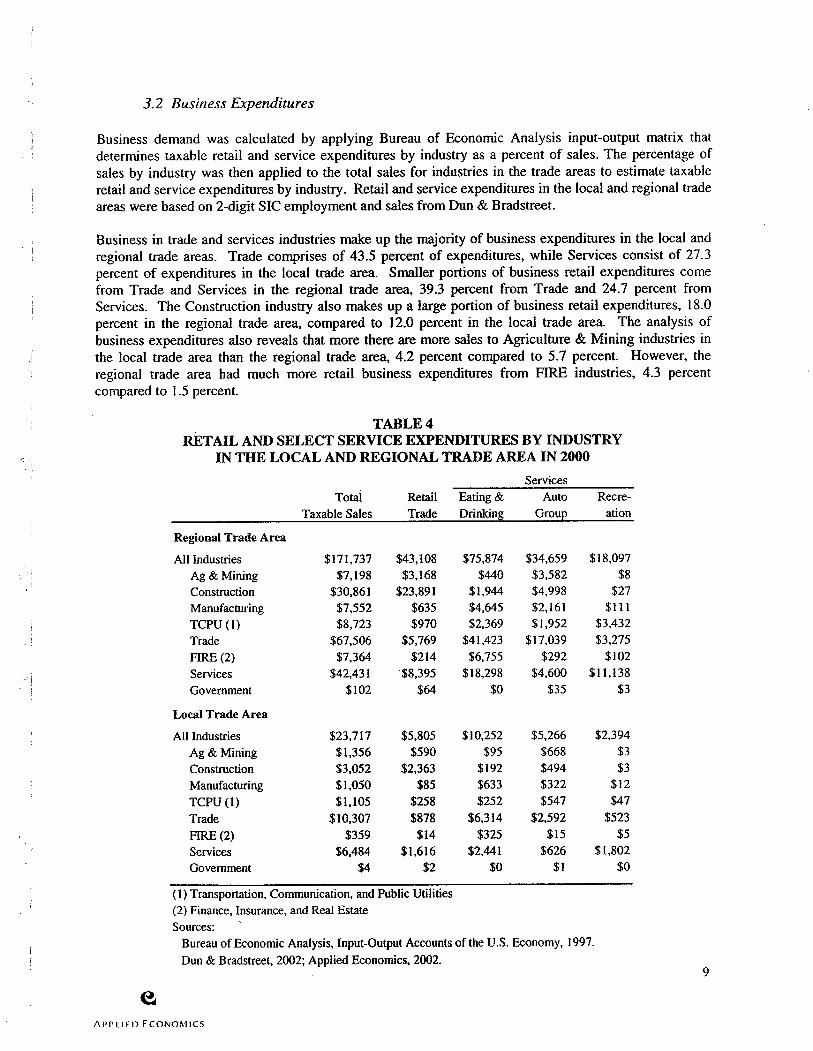
3.2 Business Expenditures
Business demand was calculated by applying Bureau of Economic Analysis input- output matrix thatdetermines taxable retail and service expenditures by industry as a percent of sales. The percentage ofsales by industry was then applied to the total sales for industries in the trade areas to estimate taxableretail and service expenditures by industry. Retail and service expenditures in the local and regional tradeareas were based on 2 -digit SIC employment and sales from Dun & Bradstreet.
Business in trade and services industries make up the majority of business expenditures in the local andregional trade areas. Trade comprises of 43.5 percent of expenditures, while Services consist of 27.3percent of expenditures in the local trade area. Smaller portions of business retail expenditures comefrom Trade and Services in the regional trade area, 39.3 percent from Trade and 24.7 percent fromServices. The Construction industry also makes up a large portion of business retail expenditures, 18.0percent in the regional trade area, compared to 12.0 percent in the local trade area. The analysis ofbusiness expenditures also reveals that more there are more sales to Agriculture & Mining industries inthe local trade area than the regional trade area, 4.2 percent compared to 5.7 percent. However, theregional trade area had much more retail business expenditures from FIRE industries, 4.3 percentcompared to 1.5 percent.
TABLE 4
RETAIL AND SELECT SERVICE EXPENDITURES BY INDUSTRY
IN THE LOCAL AND REGIONAL TRADE AREA IN 2000
Services
Total Retail Eating & Auto Recre-
Taxable Sales Trade Drinking Group ation
Regional Trade Area
All Industries 171,737 43,108 75,874 34,659 18,097
Ag & Mining 7,198 3,168 440 3,582 8
Construction 30,861 23,891 1,944 4,998 27
Manufacturing 7,552 635 4,645 2,161 111
TCPU (1) 8,723 970 2,369 1,952 3,432
Trade 67,506 5,769 41,423 17,039 3,275
FIRE (2) 7,364 214 6,755 292 102
Services 42,431 8,395 18,298 4,600 11,138
Government 102 64 0 35 3
Local Trade Area
All Industries 23,717 5,805 10,252 5,266 2,394
Ag & Mining 1,356 590 95 668 3
Construction 3,052 2,363 192 494 3
Manufacturing 1,050 85 633 322 12
TCPU (1) 1,105 258 252 547 47
Trade 10,307 878 6,314 2,592 523
FIRE (2) 359 14 325 15 5
Services 6,484 1,616 2,441 626 1,802
Government 4 2 0 1 0
1) Transportation, Communication, and Public Utilities2) Finance, Insurance, and Real EstateSources:
Bureau of Economic Analysis, Input- Output Accounts of the U.S. Economy, 1997.Dun & Bradstreet, 2002; Applied Economics, 2002.
9
A! >PLIE0 ECONOMICS

3.3 Visitor Expenditures
California Travel Impacts by County data from Dean Runyan & Associates for Butte, Sutter, and Yuba
Counties was used for visitor demand in the regional trade area. Allocation of visitor expenditures to thelocal trade area was determined by applying the ratio of employment in key tourism industries in the localarea to Butte County, and multiplying that ratio by the amount of visitor expenditures in Butte County.
Based on the California Travel Impacts data, employment in the recreation sector of the local trade area issomewhat larger than half the size of those employed in recreation in Butte County. Employment in theAccommodations, Food Stores, and Retail Sales sectors in the local trade area each employ about 46percent the number of people in the County. Eating & Drinking places employ almost 33 percent, andGround Transport sectors employ approximately 25 percent, of the number of people in the local tradearea compared to all of Butte County. The employment percentages from Butte County were then used tocalculate visitor spending by industry in the local trade area, shown on Table 5 with visitor expendituresin the regional trade area. Table 5 does not reflect tourism expenditures in Butte County. Again, Countyexpenditures were used only to determine local trade area expenditures.
Since 1995, total taxable retail expenditures by tourists in the local trade area have grown at a slightlyhigher rate than regional trade area tourist expenditures, 21.3 percent compared to 20.3 percent,respectively. In addition, visitor expenditures by all types of good grew at a higher rate in the local tradearea than in the regional trade area, except for Food Stores. Total retail sales does not include
Accommodations or Ground Transportation goods bought by tourists because these services are nottaxable or are made outside of the trade areas.
TABLE 5
TOURISM EXPENDITURES IN THE LOCAL AND REGIONAL TRADE AREAS: 1995 - 2000
In Thousands of Year 2000 Dollars
1995 1996 1997 1998 1999 2000
Regional Trade Area 241,600 256,800 264,200 270,000 288,700 296,480Accomodations 34,100 36,600 37,500 39,100 42,200 43,510
Eating & Drinking 61,300 64,300 66,000 68,300 71,600 73,680Food Stores 15,900 17,400 17,800 18,400 19,300 20,100Ground Transport 34,000 37,000 39,500 37,800 43,400 44,220Recreation 37,500 39,400 40,200 41,500 43,800 44,890Retail Sales 58,800 62,100 63,200 64,900 68,400 70,080
Retail Total 173,500 183,200 187,200 193,100 203,100 208,750
Local Trade Area 57,868 61,118 62,858 65,698 69,631 71,867Accomodations 10,024 10,717 11,086 11,825 12,703 13,211
Eating &Drinking 11,443 11,901 12,228 12,914 13,470 13,912Food Stores 3,464 3,742 3,788 4,065 4,157 4,356Ground Transport 5,886 6,444 6,900 6,621 7,560 7,740Recreation 11,622 12,148 12,411 13,042 13,726 14,120Retai 1 Sales 15,428 16,167 16,444 17,230 18,015 18,528
Retail Total 41,958 43,958 44,871 47,252 49,369 50,916
Sources:
1995 - 1999 California Travel Impacts by County, Dean Runyan & Associates, 2001.
2000 Trend estimate by Applied Economics, 2002.Local Trade Area Estimate, Dun & Bradstreet, 2002; Applied Economics, 2002.
10
APPLIED ECONOMICS

In all, taxable retail demand for residents, businesses, and visitors, in the local trade area in 2000 equaledover $439 million dollars, and almost $2.8 billion dollars in the regional trade area, shown on Figure 3.Resident's account for the largest portion of the taxable retail demand, over 80 percent in each trade area,followed by visitors and then businesses.
FIGURE 3
TAXABLE RETAIL DEMAND FOR THE LOCAL AND REGIONAL TRADE AREAS IN 2000
In Thousands of Year 2000 Dollars
Regional Local
Trade Area Trade Area
Residents 2,404,629 364,665
Businesses 171,737 23,717
Visitors 208,750 50,916
TOTAL 2,785,116 439,298
3,000,000
2,750,000
lJVisitors
2,500,000El Businesses
2,250,000 Residents
2,000,000
1,750,000
1,500,000
1,250,000
1,000,000
750,000
500,000
250,000
0 . .
Regional Trade Area Local Trade Area11
APPIIEO ECONOMICS

Estimated retail demand by store type, shown on Table 6, represents the total spent on taxable goods ateach type of store in the local and regional trade areas. The estimates for the regional trade area werecalculated by first adjusting the State of California retail demand for goods by household expenditures ateach type of store in the trade area, using the raw household expenditure ratios by each type of good,explained in section two. The adjusted expenditures for household spending by type of store was thendivided by the total adjusted State expenditures for household spending at all stores and multiplied by theactual taxable retail expenditures found for residents, businesses and, and visitors, discussed in thissection.
Total local trade area expenditures were estimated using regional retail demand multiplied by the incomeadjusted household expenditure ratio, rather than State data multiplied by the raw expenditure ratio, tobetter reflect local trade area spending and better represent the smaller economic base of the region.Table A -1, in Appendix A, shows further detail of estimated retail demand that shares expenditures out bystore type sub - categories in the local and regional trade areas.
The share of retail demand is highest for the Automotive Group, representing 23.9 percent and 29.2percent of retail demand in the local and regional trade areas, respectively. The second highest demandfor the local trade area is in the General Merchandise category, representing 20.6 percent share of thetaxable retail store total, with Specialty Stores representing the second highest share of retail storedemand, 18.8 percent, in the regional trade area. Building Materials stores is third in the retail demand inthe local trade area with a 12.3 percent share, and General Merchandise is third in the regional trade areawith a share of 15.5 percent of its total retail store demand.
TABLE 6
ESTIMATED YEAR 2000 RETAIL DEMAND IN THE LOCAL AND REGIONALTRADE AREAS BASED ON TRADE AREA SPENDING PATTERNS
In Thousands of Year 2000 Dollars
Regional Local
Trade Area Trade Area
Apparel Stores 102,790 9,847
General Merchandise 432,663 90,563
Specialty Stores 523,110 45,859
Food Stores 205,416 40,554
Eating & Drinking Places 311,663 41,747
Home Furnishings 112,448 15,103
Building Materials 184,205 53,987
Automotive Group 813,955 105,080
All Other Retail 98,866 36,559
Retail Stores Total 2,785,116 439,298
Source: Applied Economics, 2002.12
APPt,ILO ECONOMICS

4.0 RETAIL SALES & LEAKAGES
Retail sales represent the amount of taxable sales actually transacted at stores by category within the localand regional trade areas. Retail sales for the regional trade area were calculated using data from theCalifornia State Board of Equalization for Butte, Sutter, and Yuba counties. Table A -2, in Appendix A,shows further detail of estimated retail sales, by store type sub - categories in the local and regional tradeareas.
Local trade area retail sales were estimated by multiplying sales by store type, which was reported by theCalifornia State Board of Equalization, in Butte County to the percentage of sales by store type in thelocal trade area compared to those employed in the same store types by County, based on Dun &Bradstreet data.
Automotive Group represented 23.6 percent, General Merchandise represented 21.0 percent, and BuildingMaterials represented 12.1 percent of total taxable sales in the regional trade area in 2000. The largestportion of retail expenditures in the local trade area was also spent at Automotive Group stores,representing 26.4 percent of all demand. General Merchandise represented 24.5 percent, and Food Storesrepresented 10.5 percent of all retail demand in 2000 in the local trade area.
TABLE 7
ESTIMATED YEAR 2000 RETAIL SALES IN THE LOCAL AND REGIONAL
TRADE AREAS BASED ON TAXABLE SALES IN BUTTE, SUTTER, AND YUBA COUNTIESIn Thousands of Year 2000 Dollars
Regional Local
Trade Area Trade Area
Apparel Stores 58,733 5,757
General Merchandise 529,368 78,888
Specialty Stores 264,764 27,785
Food Stores 237,052 33,836
Eating & Drinking Places 240,418 29,158
Home Furnishings 88,638 9,990
Building Materials 304,016 20,300
Automotive Group 593,900 85,031
All Other Retail 202,120 31,354
Retail Stores Total 2,519,008 322,099
Source: Applied Economics, 2002.
13
APPLIED ECONOMICS

Comparison of taxable retail sales and demand, shown on Figure 4 for the regional trade area and Figure5 for the local trade area, indicate retail demand and sales by category and were used to determine thetypes of stores that experienced leakages of dollars in the trade areas in 2000. As shown on Figure 4,taxable retail sales in the regional trade area were higher than demand by store type for GeneralMerchandise, Food Stores, Building Materials, and All Other Retail categories. Those store types withleakages, then, are the ones with sales lower than demand, like Apparel Stores, Specialty Stores, Eating &Drinking Places, Home Furnishings, and Automotive Group categories. As shown on Figure 5, sincesales were higher than demand, leakages are evident in all store type categories in the local trade area.
1
14
APPLIED ECONOMICS

FIGURE 4
REGIONAL TRADE AREA
TAXABLE RETAIL SALES AND DEMAND
In Thousands of Year 2000 Dollars
900,000 -V
FR Sales
800,000—V II Demand
700,000 -
600,000 4
500,000-500,000 - -_
I ,r
400,000- 0
I: of300,000
Uzi
200,000 - i 4.4
Pal100,000 k
i
Apparel General Specialty Food Stores Eating & Home Building Automotive All Other
Stores Merchandise Stores Drinking Furnishings Materials Group Retail
Placesv,
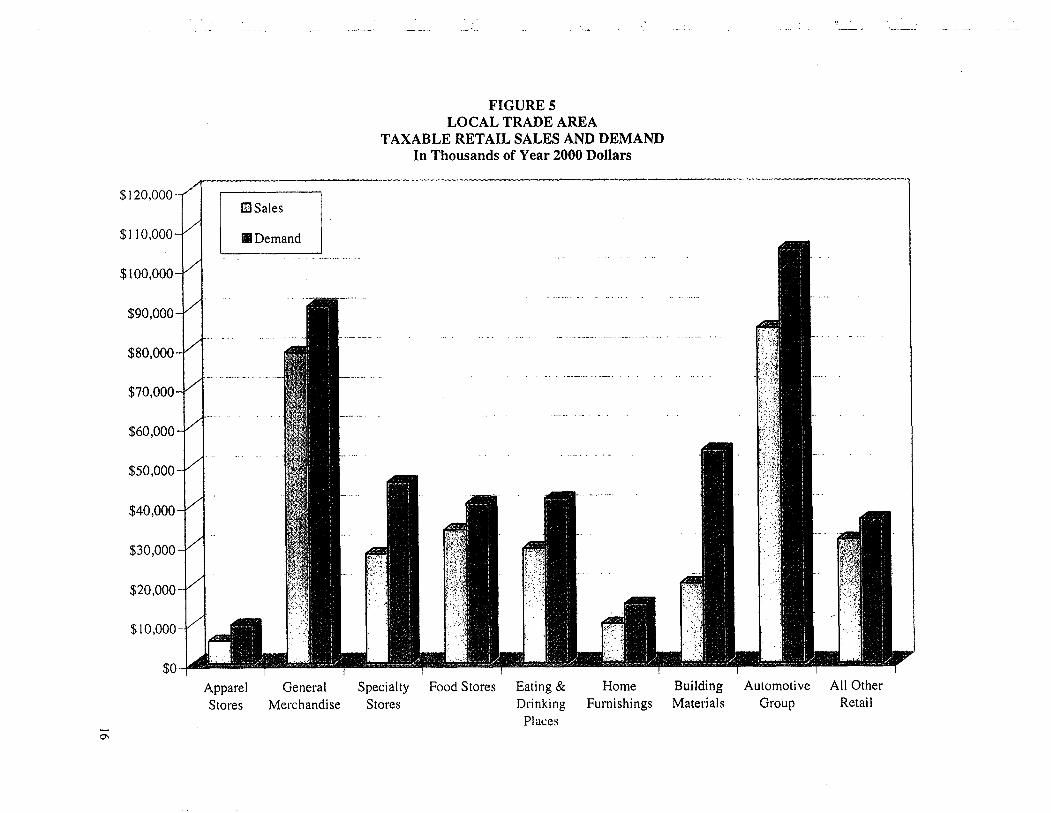
FIGURE 5
LOCAL TRADE AREA
TAXABLE RETAIL SALES AND DEMANDIn Thousands of Year 2000 Dollars
120,000 - -"II Sales
110,000 -- Demand
100,000 --
90,000 -
80,000
170,000 t l
60,000 01.1. 1
50,000
f
40,0001 a.
30,000 K
i
1.y
20,000 a`= s
1
10,0001 I i
A l'
i. E ii
tf
Apparel General Specialty Food Stores Eating & Home Building Automotive All Other
Stores Merchandise Stores Drinking Furnishings Materials Group Retail
PlacesTN

Table 8 shows the surpluses and leakages in the amount of taxable dollars between taxable retail sales anddemand in the local and regional trade areas for 2000, and the difference between surpluses or leakagesand demand, shown as a percent. Leakages represent the void in the trade area's retail mix, causingconsumers to travel elsewhere to purchase certain goods. Table A -3, in Appendix A, shows further detailof current sales leakages by store type and their sub - categories in the local and regional trade areas.
Overall, retail stores in the regional trade area had leakages of over $266 million in 2000, representing 9.6percent leakage of retail sales to places outside the area. This is somewhat deceptive though, because thistakes into account the surpluses experienced by Other Retail, Building Material, General Merchandise,and Food Stores. In reality, much larger leakages in the regional trade area occurred in Specialty Stores,Automotive Group, and Eating & Drinking Places.
Leakages occurred in all store types in the local trade area. The most significant leakages occurred in theBuilding Materials, Automotive Group, and Specialty Stores categories. Overall, Retail Stores in thelocal trade area experienced leakages of $117 million, or 26.7 percent of total retail demand. Figure 6, onthe following page, visually represent the retail leakages by store type in thousands of dollars for the localand regional trade areas in 2000. Figures 7 and 8 visually represent the amount of taxable sales leakagesand the percent of retail leakages by store type for the local trade area.
TABLE 8
CURRENT RETAIL SALES LEAKAGES* IN THE
LOCAL AND REGIONAL TRADE AREAS
In Thousands of Year 2000 Dollars
Regional Trade Area Local Trade Area
Amount Percent Amount Percent
Apparel Stores 44,057) 42.86% 4,090) 41.53%
General Merchandise 96,705 22.35% 11,674) 12.89%
Specialty Stores 258,346) 49.39% 18,074) 39.41%
Food Stores 31,636 15.40% 6,718) 16.57%
Eating & Drinking Places 71,245) 22.86% 12,589) 30.16%
Home Furnishings 23,810) 21.17% 5,113) 33.85%
Building Materials 119,811 65.04% 33,687) 62.40%
Automotive Group 220,055) 27.04% 20,049) 19.08%
All Other Retail 103,254 104.44% 5,205) 14.24%
Retail Stores Total 266,108) 9.55% 117,199) 26.68%
Source: Applied Economics, 2002.Positive values indicate surpluses, while negative values indicate leakages.
17
APP1.1E0 ECONOMICS

FIGURE 6
CURRENT RETAIL SALES SURPLUS AND LEAKAGESBY STORE TYPE IN THE
LOCAL AND REGIONAL TRADE AREAS
In Thousands of Year 2000 Dollars
I-
r a x 41 d r xck 1: i
a Regional Trade Area
125,000 Local Trade AreaY r k
r
i
000
r
100,000 • x
r Xp ih r
a s yg pp a tV 3 1
75, t
tf3
v ©T ® $50000_
x
3 BS
4 x n * i4 a E' t' ., E"r S t
u
v
Ca
sf " 1
rY 1: ,. r i"
r
z 11ii 14
ry
1 t #
tk'kn,. 1 5
ts
s k-,a h Te i'+r kf }t St625 000 L IY ,, 1d t$. di s! < t8 rR J g y ' " k
sx( wmaasau suw war rw
0 s4 y
f
yaf '..1tio s: o
IL1w` J,
d d I,t ?
aNa?r;I25,000) 1 t' d '*C ^..+ 6'i r X L ppa:' tilti wl " 17!'Pc.S x i` ..*7 t:• r''" ,.3 e xt ` z d t
ca vs t + c .,. is
1p t r `fit a n
50,000)
l
75,000)
IrpF ' f dtz ." . r •, t FEZ a
100000)t,
125,000)J
150,000)
Apparel General Specialty Food Stores Eating & Home Building Automotive All Other
Stores Merchandise Stores Drinking Furnishings Materials Group Retail
00 Places

FIGURE 7
CURRENT RETAIL SALES LEAKAGES BY STORE TYPE IN THELOCAL TRADE AREA
In Thousands of Year 2000 Dollars
1
rs
E ti •
5 000)C x •
r > ix '" "
i,4_,, 'sq(7,( $ ; ; 4 , ta is $ ' kY T k = fi '' "''
Y.:tf F., 4,4.1 -
j
74; •
1.0 000)SLk f 50 ,,- 7 5 l f, pC. $ 3T S S
1
r',.:-'--,:-.,-- iti
cF 4 n r. , a; k spa i a a ' y
S " ., <j}3 7 CS" t
bP Ti * , t tY A33M il s do ai.Pi a Cffl
r'C' 5ti
N 5, t. 1 , l i 51 ° ' III .r. ($
150 4fi kik ' T Fx / 1 X, s i t:;',... ,
aL A
ix Jt $ 3 3 `
S r : t lk,t, 6` `
S
20,000) 044 k k, ti g :,3 ,P 3. as x
t' LF F { 7'Nt } tY ti S 1 S b4 ' 4'4
za p § .
4,I i? F
g riy 1. i .,, 7 c ti btu xt eY -
t d 4: i
1'r ` i a
7I Yv e- nc r..c v R•; xw
25,000) x,k, ,' ' 0 AI' ir
iiF , - y , ,' t' y O w i6 't fbs l'i mdeS J Z Y d`
30,0 ri 1
35,000) .-
Apparel General Specialty Food Stores Eating & Home Building Automotive All Other
Stores Merchandise Stores Drinking Furnishings Materials Group Retail
Places

FIGURE 8
CURRENT PERCENT OF RETAIL SALES LEAKAGES BY STORE TYPE IN THELOCAL TRADE AREA
In Thousands of Year 2000 Dollars
e s
a
ki 1 • 0.0% —
llu t I
i
bu 9
R FG14d S 1 7 t, f' hU r.it lX` 1 X
kf;jQfi r" y - r Yk . 1, , r
20.0 %f d 4h • t 4 1
3yr N''-'''':-:1'.'.--',-'-:;-':-.-- y q ° t
Id tkk1.
U ` 7S
p Art! fa '+ rr
i ( mr(''.:'*-1,5-'.ti ' + t kiiri f Ix' . r
w
yb
n a S . is z r & A I c ;, '
r
tX
k
i r,. a r `kr s' ; °.fi r1
4:.i!, s . r xs* kit{ fx F r i
v sF n s r t , .. a,Yttr vj , tS i f tb
a t a 4 sa ta tt :: , t` Es30. r
a 3 i . "` ?i ..
i ` r " r . " J its tLi i r s
s ria YC i 0, ',q
b.+edst v ' 3 A
0:1s 1r tr” x 3t • tsn p Y u, ^ 4i t `,ita '
t ,4 1 r tr+ :y *r i 3. S 1a ; l' '' td a .
Et. y x ti xkt B +w 3 t ti
1
s i;40.0% P a . t et ti x
Aa A iir a clt r M
5 „ 'st t
x2 d'
r4
a,
gD d.F 4.Mx ha w 4' S 5 '' s i:.,l * i. ( ' .1 ., x3 # s f' 5g F rb,
iftax s "r
4
50.0% e r - r #> xs
M,.eS l a{ F E
iy.
e
60.0% 4, t
F Y
70.0%
Apparel General Specialty Food Stores Eating & Home Building Automotive All Other
Stores Merchandise Stores Drinking Furnishings Materials Group Retail
N Places0
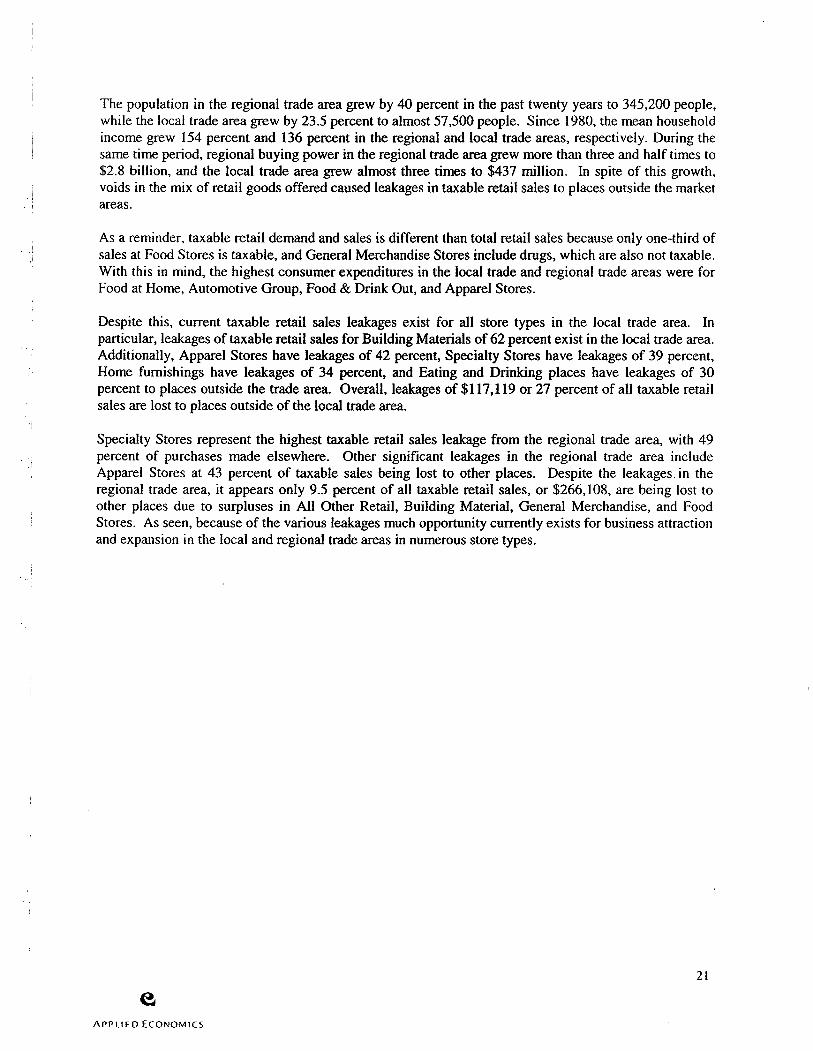
The population in the regional trade area grew by 40 percent in the past twenty years to 345,200 people,while the local trade area grew by 23.5 percent to almost 57,500 people. Since 1980, the mean householdincome grew 154 percent and 136 percent in the regional and local trade areas, respectively. During thesame time period, regional buying power in the regional trade area grew more than three and half times to2.8 billion, and the local trade area grew almost three times to $437 million. In spite of this growth,voids in the mix of retail goods offered caused leakages in taxable retail sales to places outside the marketareas.
As a reminder, taxable retail demand and sales is different than total retail sales because only one -third ofsales at Food Stores is taxable, and General Merchandise Stores include drugs, which are also not taxable.With this in mind, the highest consumer expenditures in the local trade and regional trade areas were forFood at Home, Automotive Group, Food & Drink Out, and Apparel Stores.
Despite this, current taxable retail sales leakages exist for all store types in the local trade area. In
particular, leakages of taxable retail sales for Building Materials of 62 percent exist in the local trade area.Additionally, Apparel Stores have leakages of 42 percent, Specialty Stores have leakages of 39 percent,Home furnishings have leakages of 34 percent, and Eating and Drinking places have leakages of 30percent to places outside the trade area. Overall, leakages of $117,119 or 27 percent of all taxable retailsales are lost to places outside of the local trade area.
Specialty Stores represent the highest taxable retail sales leakage from the regional trade area, with 49percent of purchases made elsewhere. Other significant leakages in the regional trade area includeApparel Stores at 43 percent of taxable sales being lost to other places. Despite the leakages in theregional trade area, it appears only 9.5 percent of all taxable retail sales, or $266,108, are being lost toother places due to surpluses in All Other Retail, Building Material, General Merchandise, and FoodStores. As seen, because of the various leakages much opportunity currently exists for business attractionand expansion in the local and regional trade areas in numerous store types.
21
APPLIED ECONOMICS

5.0 PROJECTED RETAIL EXPENDITURES & SALES
Table 9 shows projected changes to demographic and buying power characteristics of the local andregional trade areas compared to the State of California between 2000 and 2005. Population andhousehold projections show that the local trade area will grow slightly faster than the regional trade areathrough 2005. Through the same time period, the mean household incomes for the local and regionaltrade areas should grow at similar rates. The average household income could reach $51,029 in theregional trade area and $45,560 in the local trade area in 2005. The mean household income for allresidents of California is significantly larger than either trade area, projected to reach $81,024 by 2005.
The local trade area's aggregate income, because of its higher growth rate in households, is projected togrow at a slightly higher annual rate than the regional trade area, 4.6 percent annually compared to 4.2percent, respectively. The growth in aggregate income for all California residents is expected to besimilar to the trade areas, 4.1 percent annual growth. From 2000 to 2005, the local trade area's aggregateincome could increase from $834 million to almost $1.1 billion. The aggregate income of the regionaltrade area should increase to $7.2 billion in 2005, compared to $5.7 billion in 2000.
Additionally, the retail buying power in the local and regional trade areas, as well as in the State, shouldgrow at the same annual rate as their aggregate incomes. The local trade area's retail buying power couldincrease from almost $437 million in 2000, to over $560 million in 2005. At the same time, the retailbuying power of the regional trade area could increase from about $2.8 billion to around $3.6 billion.
TABLE 9
PROJECTED POPULATION, HOUSEHOLD, AND BUYING POWER* DATAOROVILLE REGIONAL AND LOCAL TRADE AREAS COMPARED TO
THE STATE OF CALIFORNIA: 2000 - 2005
California Regional Trade Area Local Trade Area
Annual Annual Annual
Number Change Number Change Number Change
Population2000 34,207,000 345,200 57,476
2005 37,473,500 1.5% 391,4.00 2.4% 65,560 2.7%
Households
2000 11,750,137 130,869 21,366
2005 12,547,508 1.0% 142,065 1.5% 23,498 1.9%
Mean Household Income (Current Year $)2000 66,816 43,422 39,0232005 81,024 3.8% 51,029 3.4% 45,560 3.3%
Aggregate Income (Millions of Current Year $)2000 785,097 5,683 834
2005 1,016,649 4.1% 7,249 4.2% 1,071 4.6%
Retail Buying Power (Thousands of CY $)2000 $372,865,252 2,846,922 436,7602005 $482,836,179 4.1% 3,631,887 4.2% 560,796 4.6%
Sources:
2000 Income Data - Claritas Inc., ClaritasConnect, 2002.2000 - California & Regional Trade Area - California Department of Finance, 2002.2000 - Local Trade Area - Applied Economics, 2002.
By Applied Economics based retail sales as a percent of income forthe State and each trade area. 22
APPLIED ECONOMICS

Figure 9 visually represents population and household growth in the local and regional trade areas ofOroville. Again, population and housing is expected to grow at a slightly higher rate in the local tradearea than in the regional trade area.
FIGURE 9
OROVILLE REGIONAL AND LOCAL RESIDENT PROFILE
POPULATION AND HOUSEHOLD: 2000 - 2005
Regional Population400,000 Regional Households
375,000 Local PopulationLocal Households
350,000
325.000
3(10,000
275.000 i !,250.000
225.000
200.000 -
175.000 -
150,000
125,000
100,000
75,000
50.000
25.000
0
2000 2005
23
APPI.l O ECONOMICS

Table 10 shows the projected household expenditures in the local and regional trade areas. Based on theprojected increase in retail buying power of residents and past per household buying trends in the regionaltrade area. The largest increases in consumer expenditures are expected to be in the Automotive Group,Apparel, Food & Drink Out, and Food at Home stores. In the local trade area, expenditures onAutomotive Group, Food & Drink Out, Apparel, and Home Furnishings goods, are expected to increasethe most.
TABLE 10
PROJECTED CONSUMER EXPENDITURES IN THE LOCAL & REGIONAL
TRADE AREAS COMPARED TO CALIFORNIA IN YEAR 2005
Regional Local
Change Trade Change Trade ChangeCalifornia 2000 -2005 Area 2000 -2005 Area 2000 -2005
Total Households 12,547,508 797,371 142,065 11,196 23,498 2,132
RETAIL EXPENDITURES:
Apparel 70,054,268 14,455,643 465,558 $ 100,622 67,291 15,103
per Household 5,583 851 3,277 489 2,864 421
Drugs 16,759,948 3,458,402 1 55,755 33,664 27,372 6,143
per Household 1,336 204 1,096 163 1,165 171
Food At Home 87,292,792 18,012,798 742,418 $107,007 102,468 0
per Household 6,957 1,061 5,226 371 4,361 435)Food & Drink Out 81,407,805 16,798,436 593,728 $128,323 89,025 19,981
per Household 6,488 989 4,179 623 3,789 557Home Furnishings 46,237,058 9,540,980 317,436 68,608 47,656 10,696
per Household 3,685 562 2,234 333 2,028 298
Home Electronics 36,220,119 7,473,993 236,130 51,035 33,616 7,545
per Household 2,887 440 1,662 248 1,431 210
Building Materials 13,928,199 2,874,073 94,782 20,485 14,528 3,261
per Household 1,110 169 667 99 618 91
Automotive Group 90,667,410 18,709,148 697,827 $150,822 109,005 24,465
per Household 7,226 1,102 4,912 732 4,639 682
Misc. Retail 27,242,619 5,621,493 260,060 56,207 42,541 9,548per Household 2,171 331 1,831 273 1,810 266
RETAIL TOTAL 469,810,218 96,944,966 3,563,695 $716,773 533,500 96,740per Household 37,443 5,710 25,085 3,331 22,704 2,263TAXABLE 409,054,568 84,408,086 3,040,367 $635,737 458,334 93,669
Source: Claritas Inc., ClaritasConnect, Accessed 2/25/02; Applied Economics, 2002.1) Trade area household expenditures compared with California average.
24
e
APPLIED ECONOMIKS

Table 11 shows projected growth of taxable retail demand by store type in the local and regional tradearea from 2000 to 2005. The difference between data presented in Table 10 and 11 is that the latterincludes estimated taxable demand for resident, business, and visitor in the trade areas in 2005, whereasthe former includes only residential expenditures. Taxable retail demand is expected to increase the mostin the Automotive Group, Specialty Stores, and General Merchandise categories in the regional tradearea, and the Automotive Group, General Merchandise, and Building Materials store types in the localtrade area. Table A-4, in Appendix A, shows further detail on projected retail demand, and change from2000 to 2005, by store type and their sub - categories in the local and regional trade areas.
TABLE 11
2005 RETAIL DEMAND PROJECTIONS BY STORE TYPE AND GROWTH BETWEEN 2000AND 2005 IN THE LOCAL AND REGIONAL TRADE AREAS BASED ON
NEW CONSUMER & BUSINESS DEMAND
In Thousands of Year 2000 Dollars
Regional Change Local ChangeTrade Area 2000 -2005 Trade Area 2000 -2005
Apparel Stores 128,043 25,253 12,228 2,381
General Merchandise 538,956 106,293 112,461 21,898
Specialty Stores 651,623 128,513 56,948 11,089
Food Stores 255,881 50,465 50,360 9,806
Eating & Drinking Places 388,230 76,567 51,841 10,095
Household 140,073 27,625 18,755 3,652
Building Materials 229,459 45,254 67,041 13,054
Automotive Group 1,013,921 199,966 130,488 25,409
All Other Retail 123,154 24,289 45,399 8,840
Retail Stores Total 3,469,340 684,224 545,522 106,223
Source: Applied Economics, 2002.
Because these projections do not take into account future attraction or expansion of retail establishmentsor the estimated addition of square footage of commercial buildings in the trade areas, estimated retailsupply for 2005 and leakages for the trade areas, were not projected. Although, Figures 10 and 11, showthe combined current leakages and projected taxable retail demand growth in the local and regional tradearea through 2005 to provide possible scenarios for growth in taxable sales by store type. Projectedgrowth is expected to increase higher than current leakages in the regional trade area for GeneralMerchandise, Food Stores, Eating and Drinking Places, and Home Furnishings store types in the next fiveyears. In the local trade area, projected taxable retail demand for 2005 will increase higher than current .leakages for General Merchandise, Food Stores, Automotive Group, and All Other Retail store types.
25
APPI.It.D ECONOMICS

FIGURE 10
COMBINED CURRENT LEAKAGES AND PROJECTED TAXABLE RETAIL DEMAND GROWTHIN THE REGIONAL TRADE AREA
In Thousands of Year 2000 Dollars
500 -
0 Projected Growth = $765 Million 4-Vge400
IN Current Leakages = $266 Million l ` ., #
n
ff
y yr
300 4 . i t41
g w
k,:c'.
LEAKAGE L
200
F ; r
100 -_. r
1 l lt.. s,,.e
1
SURPLUSf tv ,{ ryF
v
tiC, ,,
100) -
200)
Apparel Stores General Specialty Stores Food Stores Eating & Home Building Automotive All Other Retail
Merchandise Drinking Places Furnishings Materials GroupIsJrn

FIGURE 11
COMBINED CURRENT LEAKAGES AND PROJECTED TAXABLE RETAIL DEMAND GROWTHIN THE REGIONAL TRADE AREA
In Thousands of Year 2000 Dollars
50
El Projected Growth = $106 Million45
Current Leakages = $117 Millionfft
40 416 s{
sti $35
k
4
T
SC Y30 t
i ri.'7,-.F.t
1 -
25 e` r .. r'1e
gyp.
b
a
14 1 1 ; ` 4
IOt r
i t
l 4t S 1
5 . i il 4V ` l • 1
tt1
Apparel Stores General Specialty Stores Food Stores Eating & Home Building Automotive All Other Retail
J Merchandise Drinking Places Furnishings Materials Group

APPENDIX A
DETAILED TABLES
STORE TYPE WITH SUB - CATEGORIES
j
j
j
28
APPLIED ECONOMICS

TABLE A -1
ESTIMATED RETAIL DEMAND IN THE LOCAL AND REGIONAL TRADE AREASBASED ON TRADE AREA SPENDING PATTERNS
In Thousands of Year 2000 Dollars
Regional Trade Area Local Trade Area
Apparel Stores 102,790 9,847
Women's Apparel 29,975 3,435
Men's Apparel 8,985 715
Family Apparel 46,665 4,105
Shoes 17,165 1,592
General Merchandise 432,663 90,563General Merchandise Stores 382,000 82,144
Drug Stores 50,663 8,419
Specialty Stores 523,110 45,859
Gifts, Art Goods and Novelties 20,705 1,094
Sporting Goods 37,817 5,845
Florists 11,221 1,471
Photographic Equipment 5,511 357
Musical Instruments 19,719 1,954
Stationery & Books 47,936 5,791
Jewelry 24,426 1,808
Office Supplies 185,250 11,413Other Specialties 170,525 16,126
Food Stores 205,416 40,554
Food Stores Selling Liquor 136,685 24,489All Other Food Stores 68,731 16,065
Eating & Drinking Places 311,663 41,747
Eating Places: No Alcoholic Beverages 136,491 21,268 •
Eating Places: Beer and Wine 78,884 11,508
Eating and Drinking: All types of Liquor 96,288 8,971
Household 112,448 15,103
Household and Home Furnishings 76,369 7,035
Household Appliance Dealers 36,079 8,068
Building Materials 184,205 53,987
Lumber/building Materials 128,530 40,298
Hardware Stores 23,498 5,545
Plumbing/Electrical 24,300 4,644
Paint, Glass & Wallpaper 7,877 3,500
29
APPLIED ECONOMICS

TABLE A —1 (Continued)ESTIMATED RETAIL DEMAND IN THE LOCAL AND REGIONAL TRADE AREAS
BASED ON TRADE AREA SPENDING PATTERNS
In Thousands of Year 2000 Dollars
Regional Trade Area Local Trade Area
Automotive Group 813,955 105,080
New Motor Vehicle Dealers 431,572 54,271
Used Motor Vehicle Dealers 50,704 5,269
Auto Supplies & Parts 44,032 13,478Service Stations 287,647 32,061
All Other Retail 98,866 36,559
Packaged Liquor Stores 23,232 3,512Second -hand Merchandise 4,306 1,591
Farm Implements Dealers 18,976 13,060Farm and Garden Supply Stores 16,879 6,794
Fuels & Ice 5,765 1,659Mobile Homes, Campers 8,895 5,455Boats, Motorcycles, Airplanes 20,812 4,487
Retail Stores Total 2,785,116 439,298
Source: Applied Economics, 2002.
30
APPLIED ECONOMICS

1TABLEA -2
ESTIMATED YEAR 2000 RETAIL SALES IN THE LOCAL AND REGIONAL TRADE AREAS
BASED ON TAXABLE SALES IN BUTTE, SUTTER AND YUBA COUNTIESThousands of 2000 Dollars)
Regional Local
California Trade Area Trade Area
Apparel Stores 12,847,372 58,733 5,757
Women's Apparel 3,746,503 20,489 1,082
Men's Apparel 1,122,973 4,268 99
Family Apparel 5,832,477 24,484 3,665
Shoes 2,145,419 9,493 911
General Merchandise 45,829,364 529,368 78,888
General Merchandise Stores 40,462,900 480,155 68,905
Drug Stores 5,366,464 49,213 9,983
Specialty Stores 45,845,021 264,764 27,785
Gifts, Art Goods and Novelties 1,814,538 6,392 1,514
Sporting Goods 3,314,272 31,061 4,827Florists 983,396 8,598 1,365
Photographic Equipment 482,991 1,898 233
Musical Instruments 1,728,185 11,424 672
Stationery & Books 4,201,098 33,848 691
Jewelry 2,140,688 10,570 1,141Office Supplies 16,235,166 66,712 7,187Other Specialties 14,944,687 94,261 10,154
Food Stores 18,374,398 237,052 33,836Food Stores Selling Liquor 12,226,405 143,147 23,198All Other Food Stores 6,147,993 93,905 10,638
Eating & Drinking Places 35,461,731 240,418 29,158
Eating Places: No Alcoholic Beverages 15,530,236 122,482 15,359
Eating Places: Beer and Wine 8,975,611 66,275 8,238
Eating and Drinking: All types of Liquor 10,955,884 51,661 5,560
Household 13,592,904 88,638 9,990Household and Home Furnishings 9,231,640 40,515 4,566Household Appliance Dealers 4,361,264 48,123 5,424
Building Materials 22,488,577 304,016 20,300
Lumber/building Materials 15,691,521 226,930 12,553
Hardware Stores 2,868,803 31,226 3,781
Plumbing/Electrical 2,966,604 26,153 1,447
Paint, Glass & Wallpaper 961,649 19,707 2,519
31
e
APPI.It.D ECONOMICS

TABLE A -2 (Continued)ESTIMATED YEAR 2000 RETAIL SALES IN THE LOCAL AND REGIONAL TRADE AREAS
BASED ON TAXABLE SALES IN BUTTE, SUTTER AND YUBA COUNTIESThousands of 2000 Dollars)
Regional Local
California Trade Area Trade Area
Automotive Group 81,937,244 593,900 85,031
New Motor Vehicle Dealers 46,516,968 302,124 42,099
Used Motor Vehicle Dealers 5,465,117 29,335 6,159
Auto Supplies & Parts 4,745,930 75,034 13,790
Service Stations 25,209,229 187,407 22,983
All Other Retail 10,691,086 202,120 31,354
Packaged Liquor Stores 2,078,101 20,531 1,621Second -hand Merchandise 528,311 8,943 1,738Farm Implements Dealers 2,316,736 72,018 13,007
Farm and Garden Supply Stores 2,060,713 36,104 6,521Fuels & Ice 505,230 9,696 1,181
Mobile Homes, Campers 958,749 30,084 2,890
Boats, Motorcycles, Airplanes 2,243,246 24,744 4,396
Retail Stores Total 287,067,697 2,519,008 322,099
Source: California State Board of Equalization; Applied Economics.
32
e
APPLIED ECONOMICS

TABLEA -3
CURRENT RETAIL SALES LEAKAGES* IN THE LOCAL AND REGIONAL TRADE AREAS
Thousands of 2000 Dollars)
Regional Trade Area Local Trade Area
Amount Percent Amount Percent
Apparel Stores 44,057) 42.86% 4,090) 41.53%
Women's Apparel 9,487) 31.65% 2,353) 68.50%
Men's Apparel 4,717) 52.50% 616) 86.169
Family Apparel 22,181) 47.53% 440) 10.71%
Shoes 7,672) 44.69% 681) 42.77%
General Merchandise 96,705 22.35% 11,674) 12.89%
General Merchandise Stores 98,155 25.70% 13,238) 16.12%
Drug Stores 1,451) 2.86% 1,564 18.57%
Specialty Stores 258,346) 49.39% 18,074) 39.41%
Gifts, Art Goods and Novelties 14,313) 69.13% 421 38.47%
Sporting Goods 6,756) 17.86% 1,018) 17.42%
Florists 2,623) 23.38% 106) 7.20%
Photographic Equipment 3,613) 65.56% 124) 34.64%
Musical Instruments 8,295) 42.07% 1,282) 65.62%
Stationery & Books 14,088) 29.39% 5,099) 88.06%
Jewelry 13,857) 56.73% 667) 36.90%
Office Supplies 118,537) 63.99% 4,226) 37.03%
Other Specialties 76,264) 44.72% 5,972) 37.03%
Food Stores 31,636 15.40% 6,718) 16.57%
Food Stores Selling Liquor 6,462 4.73% 1,291) 5.27%
All Other Food Stores 25,173 36.63% 5,427) 33.78%
Eating & Drinking Places 71,245) 22.86% 12,589) 30.16%
Eating Places: No Alcoholic Beverages 14,009) 10.26% 5,909) 27.78%
Eating Places: Beer and Wine - 12,609) 15.98% 3,270) 28.41%
Eating and Drinking: All types of Liquor 44,628) 46.35% 3,410) 38.01%
Household 23,810) 21.17% 5,113) 33.85%
Household and Home Furnishings 35,854) 46.95% 2,469) 35.09%
Household Appliance Dealers 12,044 33.38% 2,644) 32.77%
Building Materials 119,811 65.04% 33,687) 62.40%
Lumber/building Materials 98,400 76.56% 27,745) 68.85%
Hardware Stores 7,727 32.88% 1,764) 31.81%
Plumbing/Electrical 1,854 7.63% 3,198) 68.85%
Paint, Glass & Wallpaper 11,830 150.19% 980) 28.01%
33
e
APE II 1) ECONOMICS
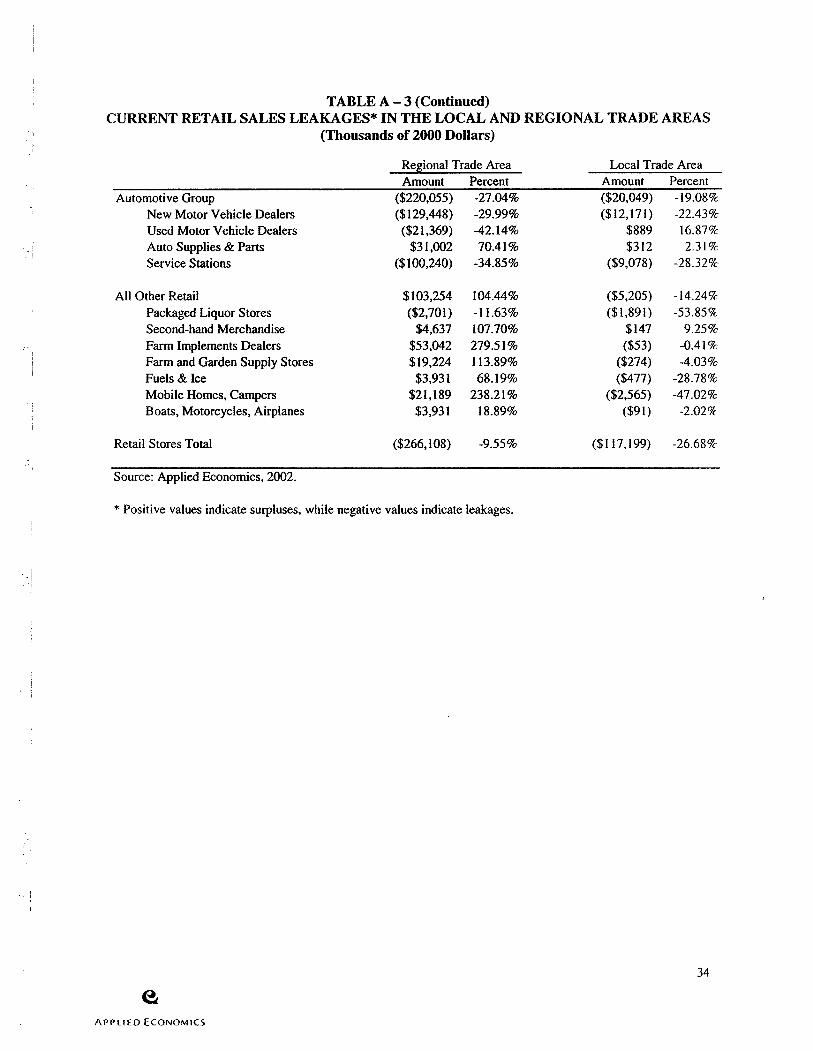
TABLE A — 3 (Continued)CURRENT RETAIL SALES LEAKAGES* IN THE LOCAL AND REGIONAL TRADE AREAS
Thousands of 2000 Dollars)
Regional Trade Area Local Trade Area
Amount Percent Amount Percent
Automotive Group 220,055) 27.04% 20,049) 19.08%
New Motor Vehicle Dealers 129,448) 29.99% 12,171) 22.43%
Used Motor Vehicle Dealers 21,369) 42.14% 889 16.87%
Auto Supplies & Parts 31,002 70.41% 312 2.31%
Service Stations 100,240) 34.85% 9,078) 28.32%
All Other Retail 103,254 104.44% 5,205) 14.24%
Packaged Liquor Stores 2,701) 11.63% 1,891) 53.85%
Second -hand Merchandise 4,637 107.70% 147 9.25%
Farm Implements Dealers 53,042 279.51% 53) 0.41%
Farm and Garden Supply Stores 19,224 113.89% 274) 4.03%
Fuels & Ice 3,931 68.19% 477) 28.78%
Mobile Homes, Campers 21,189 238.21% 2,565) 47.02%
Boats, Motorcycles, Airplanes 3,931 18.89% 91) 2.02 %:
Retail Stores Total 266,108) 9.55% 117,199) 26.68%
Source: Applied Economics, 2002.
Positive values indicate surpluses, while negative values indicate leakages.
34
APPLIED ECONOMICS

TABLE A - 4
PROJECTED GROWTH OF RETAIL SALES IN 2005 AND CHANGE SINCE 2000IN THE LOCAL AND REGION TRADE AREAS BASED ON NEW CONSUMER & BUSINESS
DEMAND
Thousands of 2000 Dollars)
Regional Change Local ChangeTrade Area 2000 -2005 Trade Area 2000 -2005
Apparel Stores 128,043 25,253 12,228 2,381Women's Apparel 37,339 7,364 4,266 831
Men's Apparel 11,192 2,207 888 173
Family Apparel 58,129 11,464 5,097 993
Shoes 21,382 4,217 1,976 385
General Merchandise 538,956 106,293 112,461 21,898General Merchandise Stores 475,846 93,846 102,006 19,863
Drug Stores 63,110 12,447 10,455 2,036
Specialty Stores 651,623 128,513 56,948 11,089Gifts, Art Goods and Novelties 25,791 5,087 1,358 264
Sporting Goods 47,108 9,291 7,259 1,413Florists 13,978 2,757 1,827 356
Photographic Equipment 6,865 1,354 444 86Musical Instruments 24,564 4,844 2,427 473
Stationery & Books 59,713 11,777 7,191 1,400
Jewelry 30,427 6,001 2,245 437Office Supplies 230,760 45,511 14,173 2,760Other Specialties 212,418 41,893 20,025 3,899
Food Stores 255,881 50,465 50,360 9,806Food Stores Selling Liquor 170,264 33,580 30,411 5,922All Other Food Stores 85,617 16,885 19,950 3,885
Eating & Drinking Places 388,230 76,567 51,841 10,095
Eating Places: No Alcoholic Beverages 170,023 33,532 26,411 5,143Eating Places: Beer and Wine 98,264 19,380 14,291 2,783Eating and Drinking: All types of Liquor 119,944 23,655 11,140 2,169
Household 140,073 27,625 18,755 3,652Household and Home Furnishings 95,131 18,762 8,736 1,701Household Appliance Dealers 44,942 8,864 10,019 1,951
Building Materials 229,459 45,254 67,041 13,054Lumber/building Materials 160,106 31,576 50,042 9,744Hardware Stores 29,271 5,773 6,886 1,341Plumbing/Electrical 30,269 5,970 5,767 1,123Paint, Glass & Wallpaper 9,812 1,935 4,346 846
35
APPi.IUD ECONOMICS

TABLE A - 4 (Continued)PROJECTED GROWTH OF RETAIL SALES IN 2005 AND CHANGE SINCE 2000
IN THE LOCAL AND REGION TRADE AREAS BASED ON NEW CONSUMER & BUSINESS
DEMAND
Thousands of 2000 Dollars)Regional Change Local Chance
Trade Area 2000 -2005 Trade Area 2000 -2005
Automotive Group 1,013,921 199,966 130,488 25,409
New Motor Vehicle Dealers 537,597 106,025 67,394 13,123
Used Motor Vehicle Dealers 63,160 12,457 6,544 1,274
Auto Supplies & Parts 54,849 10,817 16,737 3,259
Service Stations 358,314 70,667 39,813 7,752
All Other Retail 123,154 24,289 45,399 8,840
Packaged Liquor Stores 28,940 5,707 4,362 849
Second -hand Merchandise 5,364 1,058 1,976 385
Farm Implements Dealers 23,638 4,662 16,218 3,158Farm and Garden Supply Stores 21,026 4,147 8,437 1,643
Fuels & Ice 7,181 1,416 2,060 401
Mobile Homes, Campers 11,080 2,185 6,775 1,319
Boats, Motorcycles, Airplanes 25,925 5,113 5,572 1,085
Retail Stores Total 3,469,340 684,224 545,522 $106,223
Source: Applied Economics, 2002.
36
APPLIED ECONOMICS