Applied ABET Student Outcome Continuous Improvement Process
14
Paper ID #14394 Applied ABET Student Outcome Continuous Improvement Process Prof. Byron G. Garry, South Dakota State University BYRON GARRY is an Associate Professor and Undergraduate Program Coordinator in the Department of Construction & Operations Management in the College of Engineering at South Dakota State University. He has been a member of ASEE since 1998. c American Society for Engineering Education, 2016
Transcript of Applied ABET Student Outcome Continuous Improvement Process

Paper ID #14394
Applied ABET Student Outcome Continuous Improvement Process
Prof. Byron G. Garry, South Dakota State University
BYRON GARRY is an Associate Professor and Undergraduate Program Coordinator in the Department ofConstruction & Operations Management in the College of Engineering at South Dakota State University.He has been a member of ASEE since 1998.
c©American Society for Engineering Education, 2016
Applied ABET Student Outcome Continuous Improvement
Process
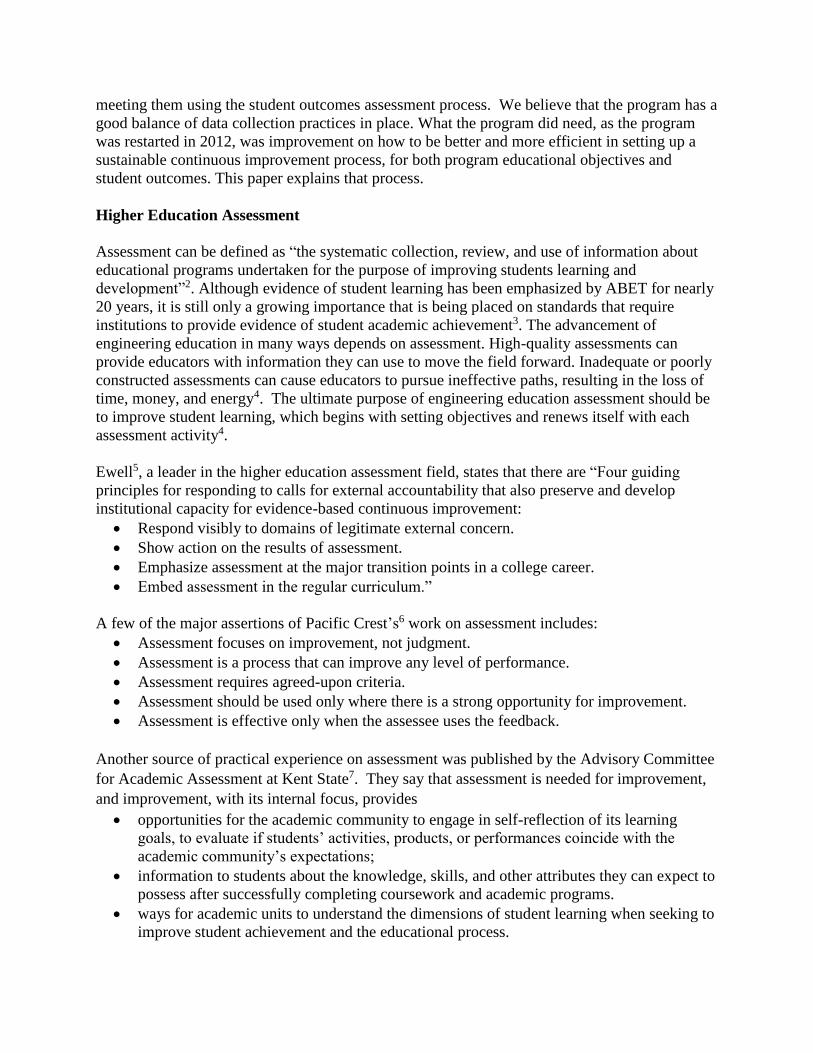
Abstract
A sustainable continuous improvement process was desired for use in the ABET-ETAC
accreditation process for an EET program. From the educational research field, it is known that
programs must consider both an evidence-based continuous improvement process for internal
purposes, as well as meeting the needs of external accountability. Programs need to assess and
implement improvements in how well students are learning, which must be carried out in
conjunction with improvements in their own program assessment process. There are also many
considerations from a study of the field of quality, gathered from the program’s foundation in the
electronics manufacturing industry, which can be applied. Some of Deming’s fourteen points on
Total Quality Management, concepts and quality principles from the American Society for
Quality, and principles from the ISO 9001-2015 quality management system standards can be
applied to a student outcome continuous improvement process. For programs desiring ABET
accreditation, there are specific requirements which must be documented, for how and when
external and internal stakeholders are consulted. Another consideration growing in importance is
the use of rubrics to help standardize evaluation of student work over time and audiences.
With all of these factors under consideration, our EET program has developed, and continues to
use, a process that can be illustrated by a graphic that features three intersecting continuous
improvement loops. This graphic helped the program to clarify the assessment, evaluation, and
student learning improvement procedures. The EET program faculty have fully accepted and are
implementing the process described. A table illustrates the assessment data reporting process
used by the program, showing some of the assessment data gathered and improvement decisions
made as this process was used over a five-year period in a capstone course.
Keywords
Assessment, Continuous Improvement, Accreditation
Introduction
The South Dakota State University Electronics Engineering Technology (EET) program received
its initial ABET-ETAC Accreditation in 2006. In 2011, due to State of South Dakota funding
cuts, the program was phased out, and accreditation was ended. In 2012, with the help of local
industry support, the program was restarted, and is on track to have another “initial”
accreditation visit in 2016. The EET program, as a program in the Department of Construction
and Operations Management (COM), has defined, with the approval of alumni and its industrial
advisory board, Student Outcomes labeled (a) - (l). These begin with the ABET1 Criterion 3.
Student Outcomes (SO) (a) - (k), and then add (l) from the EET program specific requirements.
The EET program assesses student progress on the outcomes all through the curriculum,
generally gathering data on two to four SOs per course. We are also constantly re-evaluating the
Criterion 2 Program Educational Objectives (PEO) and how graduates show that they are
meeting them using the student outcomes assessment process. We believe that the program has a
good balance of data collection practices in place. What the program did need, as the program
was restarted in 2012, was improvement on how to be better and more efficient in setting up a
sustainable continuous improvement process, for both program educational objectives and
student outcomes. This paper explains that process.
Higher Education Assessment
Assessment can be defined as “the systematic collection, review, and use of information about
educational programs undertaken for the purpose of improving students learning and
development”2. Although evidence of student learning has been emphasized by ABET for nearly
20 years, it is still only a growing importance that is being placed on standards that require
institutions to provide evidence of student academic achievement3. The advancement of
engineering education in many ways depends on assessment. High-quality assessments can
provide educators with information they can use to move the field forward. Inadequate or poorly
constructed assessments can cause educators to pursue ineffective paths, resulting in the loss of
time, money, and energy4. The ultimate purpose of engineering education assessment should be
to improve student learning, which begins with setting objectives and renews itself with each
assessment activity4.
Ewell5, a leader in the higher education assessment field, states that there are “Four guiding
principles for responding to calls for external accountability that also preserve and develop
institutional capacity for evidence-based continuous improvement:
Respond visibly to domains of legitimate external concern.
Show action on the results of assessment.
Emphasize assessment at the major transition points in a college career.
Embed assessment in the regular curriculum.”
A few of the major assertions of Pacific Crest’s6 work on assessment includes:
Assessment focuses on improvement, not judgment.
Assessment is a process that can improve any level of performance.
Assessment requires agreed-upon criteria.
Assessment should be used only where there is a strong opportunity for improvement.
Assessment is effective only when the assessee uses the feedback.
Another source of practical experience on assessment was published by the Advisory Committee
for Academic Assessment at Kent State7. They say that assessment is needed for improvement,
and improvement, with its internal focus, provides
opportunities for the academic community to engage in self-reflection of its learning
goals, to evaluate if students’ activities, products, or performances coincide with the
academic community’s expectations;
information to students about the knowledge, skills, and other attributes they can expect to
possess after successfully completing coursework and academic programs.
ways for academic units to understand the dimensions of student learning when seeking to
improve student achievement and the educational process.

evidence of student achievement to accreditation groups, state legislators, and other
stakeholders in education, as a function of accountability.
This last point falls under the umbrella of the phrase culture of evidence, which is currently
popular among policy and assessment experts. It captures the belief that colleges can enhance
student learning and success if they systematically collect and examine data8. Suskie9 states that
for good assessment to happen, the instructor at the start needs to “develop clearly articulated
written statements of expected learning outcomes”, that is, what the students know and will be
able to do by the end of the course. Ewell5 calls this the “Improvement Paradigm”, which can
embrace many kinds of evidence-gathering, including standardized and faculty-designed
examinations, capstone projects, demonstrations, portfolios, and specially designed assignments
embedded in regular courses. All of these sources of evidence rely on evaluation using rubrics –
specially crafted scoring guides developed by faculty3. “Simply put, assessment is a process used
for improving quality.”6 Measurement of student achievement of outcomes is the base for
improvement, but an efficient, sustainable continuous improvement process must be in place
before improvements can be made.
Quality Concepts and Definitions
The American Society for Quality (ASQ) sets standards, and provides education for how quality
can be implemented and maintained in a variety of different situations. ASQ defines quality10 as:
A subjective term for which each person or sector has its own definition. In technical
usage, quality can have two meanings: 1. the characteristics of a product or service
that bear on its ability to satisfy stated or implied needs; 2. a product or service free of
deficiencies. According to Joseph Juran, quality means “fitness for use;” and
according to Philip Crosby, it means “conformance to requirements.”
ASQ defines continuous improvement11 as an ongoing effort to improve products, services or
processes. These efforts can seek “incremental” improvement over time or “breakthrough”
improvement all at once. The ISO 9001-201512 standard is used by manufacturers to assess
whether they are following a good continuous improvement process. When used within a quality
management system, such an approach emphasizes the importance of understanding and meeting
the customer’s, as well as all relevant interested parties, requirements, the need to consider
processes in terms of added value, obtaining results of process performance and effectiveness,
and continual improvement of processes based on objective measurement. Figure 1 shows a
graphic from the ISO 9001-2015 Standards document illustrating one example of a continuous
improvement process.

Figure 1. ISO 9001-2015 Continuous Improvement Process12
This graphic includes the Shewart Cycle, also known as “Plan-Do-Check-Act” (PDCA), which
can be applied to many processes. PDCA 11 can be described as follows.
Plan: establish the objectives and processes necessary to deliver results in accordance with
customer requirements and the organization's policies.
Do: implement the processes.
Check: monitor and measure processes and product against policies, objectives and
requirements for the product and report the results.
Act: take actions to continually improve process performance.
The terms “quality assurance” and “quality control” are often used interchangeably to refer to
ways of ensuring the quality of a service or product. The terms, however, have different
meanings. For use by the EET program13, we have developed and use these definitions:
Quality Assurance (QA) is an end-of-cycle test:
In manufacturing, we evaluate products at the end of a process to make sure they are
good, and ready for the customer.
In engineering education, there is the tendency to use Senior Exit Exams, or FE Test
results, as the only means of program assessment.
Whereas Quality Control (QC) is an in-process or embedded technique:
In manufacturing, processes are monitored, to identify problems that could lead to non-
conforming products
Corrective action can be taken quickly, after each semester.
Can also be used to test new materials, equipment, and methods. If a test did not work
well, then fixing it can happen the next time the test is given.
The EET continuous improvement process uses mostly embedded assessments, that is, the
assignments, quizzes, tests, labs, reports and projects that are a part of the grading of the course
are used as the assessment tool. A specific rubric is developed to apply to each instrument to

assure that we look at the specific SO (a) – (l) we are assessing. This is detailed later in the
paper.
Another major source of ideas in quality comes from Deming. Two of Deming’s 14 Points on
Total Quality Management14, are especially relevant to continuous improvement in an
educational environment: Cease dependence on mass inspection, and Improve constantly and
forever every process for planning, production and service. In a manufacturing process “mass
inspection” is used to find and remove defects in products before they are sent to the customers.
With mass inspection we hope to assure that customers are satisfied with a product and do not
require expensive warrantee repairs or product recalls. In the educational process, we use exams
in a similar fashion to weed out “defective” students. Students are required to learn the course
material, and if they do not, we must penalize their performance.14 Deming and other quality
experts probably would not argue against the need for mass inspection. They would argue,
however, that improvement of a process, in this case, the university course in which the student
is learning the material, is a much better way to create a better product. Fewer defects would be
found in the output of an improved process. Also, mass inspection often does not provide a good
mechanism for finding ways to improve the process.
ASQ defines sampling16 as is the selection of a set of elements from a population or product lot.
Sampling is frequently used because data on every member of a population are often impossible,
impractical, or too costly to collect. Sampling requires conclusions or making inferences about
the population from which the sample is drawn. In our EET program’s continuous improvement
process we sample student work to use as measurements of SOs, that is, we do not assess every
assignment in every course (mass inspection). Not attempting to assess all student work allows
us to limit the number data points to gather and use. Note, the EET program calls for assessing
the work of all students in the chosen assignment that semester. Also we usually do not attempt
to do statistical analysis of the assessment data, beyond what percentage of students met the
assessment goal.
Another quality idea that has not been applied to the world of assessment, and should be
referenced more often, is cost. Quality cost17 are the total of the cost incurred by:
Investing in the prevention of nonconformance to requirements.
Appraising a product or service for conformance to requirements.
Failing to meet requirements.
The costs of students failing to meet the student learning goals of an academic program are not
currently measured, and in fact are probably not measureable. Since the costs are not known, the
consequences are not known, either. Most faculty involved in the process of assessment and
evaluation, seeing the costs of their time and effort only, approach the quality process as a
necessary evil to satisfy the requirements of their institution. Using assessment and evaluation of
data to improve the quality of student learning is not made clear in most institutions, and so a
better continuous improvement process, where the results of increase in quality may be seen, is
needed.

One more quality tool that can be applied to our assessment process is the stop light analogy18.
This is a visual technique that draws attention to processes that are most in need of improvement.
Charts are made, and posted where all can see, with a color code:
Green = The process performance is stable and acceptable.
Yellow = Warning, the process may be having performance stability problems.
Red = The process has become unstable and the performance is unacceptable.
In our EET program’s continuous improvement process documentation, we chose to use the
colors white, yellow, and red, as is detailed below.
Accreditation and Assessment using Continuous Improvement Terminology
Accreditation is the principle mechanism currently in use in the US for assuring academic
quality. It has been in place for 125 years and for some 60 years in its current form.3 ABET
2015-16 Criterion 4 Continuous Improvement1 states:
The program must regularly use appropriate, documented processes for assessing
and evaluating the extent to which the student outcomes are being attained. The
results of these evaluations must be systematically utilized as input for the
continuous improvement of the program. Other available information may also be
used to assist in the continuous improvement of the program.
Continuous improvement can be defined as “a systematic effort to seek out and apply new ways
of doing work, which is actively and repeatedly making process improvements”.19 Processes are
also defined as a “designed sequences of tasks aimed at creating value-adding transformations of
inputs – material and information – to achieve intended outputs”.19 A continuous improvement
initiative provides a planned and organized system for the continual discovery and
implementation of such process changes. Pacific Crest20 makes a point to note that the practice of
continuous improvement applies not only to measuring student outcome performance, but also to
the assessment systems that are used to assess programs. Assessment systems that are efficient
and current are less time consuming to employ and are more likely to yield reliable data.
Therefore, it is crucial to review assessment systems with the goal of continuously improving the
process.
Gloria Rogers21 states that data collection activities must be examined in light of good program
assessment practice, efficiency, and reasonableness. She says several questions need to be asked,
such as, “Is there a clear vision of why specific data are being collected?” She answers,
“Without clearly defined outcomes, there can never be enough data because there is no focus.”
The National Academy of Engineering in 2009 issued a report called “Developing Metrics for
Assessing Engineering Instruction: What Gets Measured is What Gets Improved.” 22 In that
report they reinforced the idea that a sustainable evaluation system must not require
implementation that is burdensome to faculty or administrators.
Rubrics are also an important part of an educational quality control process. Rubrics can be
defined as descriptive scoring schemes that are developed by teachers or other evaluators to
guide the analysis of the products or processes of students' efforts. 23 The use of a rubric is more
likely to provide meaningful and stable appraisals than are traditional scoring methods.
Assessing student’s knowledge and skills on the basis of a scale offers several advantages. First,

it presents a continuum of performance levels, defined in terms of selected criteria, towards to
full attainment or development of the targeted skills. Second, it provides qualitative information
regarding the observed performance in relation to a desired one. Third, its application, at regular
intervals, tracks the student’s progress of his or her skill mastery.24 In our EET program’s
continuous improvement process, rubrics are developed by faculty, reviewed and approved by a
committee of faculty, and used to evaluate student work each time a course is taught.
Spurlin, Rajala and Lavelle25 illustrated the overlapping and inter-twined aspect of both
assessing how well students are learning, and also the important duty of assessing the assessment
system. The graphic they produced, shown in Figure 2, helps to clarify who is responsible for
what actions, and then shows who should use the results of those actions in the next step of a
process. The figure, though illustrative of what has to happen in a good continuous improvement
process, does not provide an operational, process to emulate. In our EET continuous
improvement process, we chose to use the idea of interlinking cycles, but created more detailed
and separated loops.
Figure 2. Interrelationships of Assessment Cycles25
Using the EET program Continuous Improvement Process
Considering the state of assessment requirements in higher education, ABET accreditation
standards, and the tools of quality and continuous improvement in mind, our EET program uses a
process that can be illustrated by a graphic that features three intersecting continuous
improvement loops.26 This graphic helped to clarify in our minds the assessment, evaluation, and
student learning improvement processes we had been doing for several years. Each loop is a
complete PDCA process, carried on at different repetition rates, with different goals and quality
targets in mind, as stated in the graphic, as shown in Figure 3. For the purposes of brevity in this
paper, this figure is reproduced too small to see the details. Following in the text, each loop is
broken out and explained.

Figure 3. Complete Three-Loop Continuous Improvement Process26
There is one PEO loop, and two SO loops, and wording that details what is happening in the
intersections of the loops.
The top loop, shown in Figure 4, applies to the ABET Criterion 2 Program Educational
Objectives (PEOs) only. The figure illustrates that we are using input from our constituents,
developing a plan that states the objectives, setting a curriculum that we think will educate the
students to meet the objectives, surveying graduates and employers to check if the objectives
were met, and then using the survey results to propose changes for the next iteration of the loop.
This loop is repeated, ideally, every 6 years, as the overall, big picture, program educational
objectives should be fairly constant over time. In practice, especially as the EET program was
restarted in 2012, working toward a 2016 accreditation visit, the loop was repeated every two
years.
Figure 4: Program Educational Objectives Loop26

The lower-left loop, as shown in Figure 5, deals with the definition of Student Outcomes (SO),
and when there could be significant changes to the EET curriculum, which should occur every
three years. Again, as we restarted the EET program, we traversed this loop on a yearly basis.
In this loop we maintain our course outcome matrix, that is, deciding in which course we will
assess which SO (a) – (l). The data gathered each semester is summarized over time. The
purpose of this loop is to decide if bigger, curriculum-level changes need to be made, for
example if there is a need to switch program content from one course to another, or to add
courses to the curriculum, if we determine that is needed for students to learn what is needed by
an EET graduate.
Figure 5: Considering the Student Outcome Statements Loop26
The lower-right loop, shown in Figure 6, deals with the assessment and evaluation of student
outcomes data that we gather each semester. Again, using a PDCA process we let each faculty
member decide on the tools they will use to assess the outcomes chosen for that course, decide
on a rubric to use, gather student data throughout the semester and apply the rubric, and evaluate
results to see if students met the goals that have been set.
Figure 6. Review Whether Students Meet Selected SO Goals every Semester26

If it is determined that students, as a group, do not meet a course’s SO goal, then faculty make
small changes in course sequence, the tests and/or projects that are assessed, or when
assessments will be made. This loop overlaps with Figure 5 loop, in that if the faculty as a whole
decide that small changes will not be enough to improve students’ learning then bigger
curriculum changes are proposed and approved. For this paper, the results of some of the
assessment from the EET Capstone course over a five-year period were chosen to illustrate the
overall continuous improvement process and its documentation. In the capstone project, we
choose to assess, among others, SOs (e), (f), (k), and (l). In this loop rubrics are used, and Table
1 shows examples of the rubrics used for these SOs.
Capstone Project Rubrics
ABET-ETAC
Student
Outcome
Superior Excellent Good Fair Poor
100% 90% 80% 70-60% 50% and
below
e) an ability to
function
effectively as a
member or
leader on a
technical team
Completes all assigned
tasks by deadline
without prompting
Work accomplished is
thorough,
comprehensive, and
advances the project
Proactively helps other
team members
complete their assigned
tasks to a similar level
of excellence
Completes all
assigned tasks by
deadline
Work accomplished
is thorough and
advances the project
Works with other
team members as
required.
most
tasks
mostly through
only with
prompting
some tasks
does not
advance
only on
some tasks
few tasks
little work
done
works
poorly with
team
members
f) ability to
identify,
analyze and
solve problems
Design process
completely detailed
All appropriate
supporting documents
in written report
Clear understanding of
design process
demonstrated
Mostly detailed
Mostly
Mostly clear
Basically
detailed
Somewhat
Somewhat
clear
Sketchily
detailed
Few
Fair
Not
detailed
No
Poor
k) commitment
to quality,
timeliness and
continuous
improvement
Reasons with all
good/correct results
and/or interprets data
very well.
Develops exemplary
conclusions based on
results.
Mostly good/correct
results and/or
interprets data well.
Good conclusions
based on results.
Some good
results and
some data
interpreted well
Some good
conclusions
based on some
Minimal
results,
interprets a
small amount
of data well
Minimal
conclusions
Poor results
and/or
interprets
data poorly
Poor
conclusions
l) apply project
management
techniques
Project is planned
thoroughly and
completely, and
executed very closely
to plan
Project is planned
thoroughly, and
executed mostly to
plan
Planned
thoroughly,
and executed
far from plan
Planned
loosely, and
executed far
from plan
Little plan,
and
execution
haphazard
Table 1. Some of the Rubrics used in the EET SO Loop26
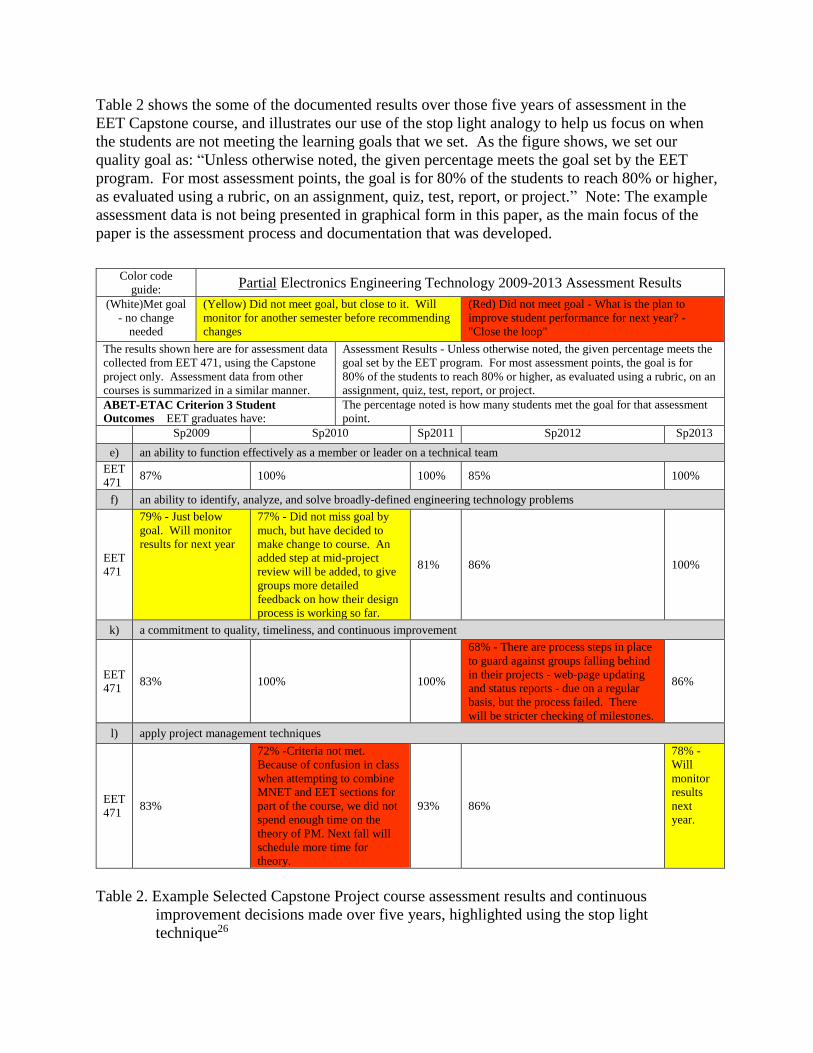
Table 2 shows the some of the documented results over those five years of assessment in the
EET Capstone course, and illustrates our use of the stop light analogy to help us focus on when
the students are not meeting the learning goals that we set. As the figure shows, we set our
quality goal as: “Unless otherwise noted, the given percentage meets the goal set by the EET
program. For most assessment points, the goal is for 80% of the students to reach 80% or higher,
as evaluated using a rubric, on an assignment, quiz, test, report, or project.” Note: The example
assessment data is not being presented in graphical form in this paper, as the main focus of the
paper is the assessment process and documentation that was developed.
Table 2. Example Selected Capstone Project course assessment results and continuous
improvement decisions made over five years, highlighted using the stop light
technique26
Color code
guide: Partial Electronics Engineering Technology 2009-2013 Assessment Results
(White)Met goal
- no change
needed
(Yellow) Did not meet goal, but close to it. Will
monitor for another semester before recommending
changes
(Red) Did not meet goal - What is the plan to
improve student performance for next year? -
"Close the loop"
The results shown here are for assessment data
collected from EET 471, using the Capstone
project only. Assessment data from other
courses is summarized in a similar manner.
Assessment Results - Unless otherwise noted, the given percentage meets the
goal set by the EET program. For most assessment points, the goal is for
80% of the students to reach 80% or higher, as evaluated using a rubric, on an
assignment, quiz, test, report, or project.
ABET-ETAC Criterion 3 Student
Outcomes EET graduates have:
The percentage noted is how many students met the goal for that assessment
point.
Sp2009 Sp2010 Sp2011 Sp2012 Sp2013
e) an ability to function effectively as a member or leader on a technical team
EET
471 87% 100% 100% 85% 100%
f) an ability to identify, analyze, and solve broadly-defined engineering technology problems
EET
471
79% - Just below
goal. Will monitor
results for next year
77% - Did not miss goal by
much, but have decided to
make change to course. An
added step at mid-project
review will be added, to give
groups more detailed
feedback on how their design
process is working so far.
81% 86% 100%
k) a commitment to quality, timeliness, and continuous improvement
EET
471 83% 100% 100%
68% - There are process steps in place
to guard against groups falling behind
in their projects - web-page updating
and status reports - due on a regular
basis, but the process failed. There
will be stricter checking of milestones.
86%
l) apply project management techniques
EET
471 83%
72% -Criteria not met.
Because of confusion in class
when attempting to combine
MNET and EET sections for
part of the course, we did not
spend enough time on the
theory of PM. Next fall will
schedule more time for
theory.
93% 86%
78% -
Will
monitor
results
next
year.

Each time a learning goal is not met, the faculty member chooses what they will do to change the
course the next time it is taught, either in a minor or major way. If the goal was close to being
met, then the result is marked with yellow and a change may not be made at all. This is following
the quality principle that over-reacting to data that is only slightly missing the goal is not a good
practice. If the goal is missed by a large margin, the result is marked red, and a major course
change may be made. As is seen in the data illustrated in Table 2, each time the assessment
shows that a goal is not being met, marked by red, the next year the change in the course resulted
in the goal being met. This does not always happen. Groups of students vary from semester to
semester, and an improvement in how a course is taught may not have the desired results the next
time the class is taught. The most important consideration is that a continuous plan is in place,
and the fact that student learning is being monitored.
Conclusion
A sustainable continuous improvement, one that is accepted and used regularly by all faculty in
the program, is the goal of any ABET accredited program. We have created a graphic that helps
us to keep separate, and be more efficient with, the process of assessment data collection,
evaluation of the data, and changes made to improve student learning using the data. As the
process has been implemented, the EET program faculty have accepted the time and effort that
the good assessment takes, and have bought into the process. The same assessment process is
being used by the Construction Management and Operations Management programs, also in the
SDSU COM Department. Those faculty have also accepted and have implemented the
comprehensive assessment process required, as they also prepare for an ABET Accreditation
visit. It is a process the COM Department feels comfortable with for now, and plan to use in the
years to come. We know, however, that the process itself is subject to review and evaluation for
how well it is working, and so is subject to change over time.
References
1 ABET 2015-16 ETAC Criteria, Retrieved from http://www.abet.org/wp-content/uploads/2015/05/T001-15-16-
ETAC-Criteria-05-04-15.pdf
2 Palomba, C.A. and T.W. Banta, Assessment Essentials: Planning, Implementing and Improving Assessment in
Higher Education, Stylus, Sterling, VA, 1999
3 Ewell, P. T., “The Quality Agenda: An overview of current efforts to examine quality in higher education. A
discussion paper prepared for the American Council on Education”, 2012, Retrieved from http://www.
acenet.edu/news-room/Documents/The-Quality-Agenda-An-Overview-of-Current-Efforts-to-Examine-Quality-
in-Higher-Education--Ewell.pdf.
4 Olds, B.M., B.M. Moskal and R.L. Miller, “Assessment in Engineering Education: Evolution, Approaches and
Future Collaborations,” Journal of Engineering Education, 2005, 94(1):13-25.
5 Ewell, P. “Assessment, Accountability and Improvement: Revisiting the Tension,” National Institute for
Learning Outcomes Assessment, 2009, Retrieved from http://www.learningoutcomeassessment.org/
occasionalpaperone.htm
6 Baehr, M. and S. W. Beyerlein, “Overview of Assessment, “ In S. Beyerlein, C. Holmes & D. Apple (Eds.),
Program Assessment Handbook, Pacific Crest. 2010, (pp. 3-6). Retrieved from
http://www.pcrest2.com/institute_resources/PAI/PAI2010_020910.pdf
7 Advisory Committee for Academic Assessment, Kent State, Six Steps to Continuous Improvement of Student
Learning, no date. Retrieved from http://explore.kent.edu/aa/guide/fulltext.html

8 Morest, V.S., “Accountability, Accreditation, and Continuous Improvement: Building a Culture of Evidence,”
New Directions for Institutional Research, no. 143, Fall 2009
9 Suskie, L., “Understanding the Nature and Purpose of Assessment,” In Designing Better Engineering Education
through Assessment. Spurlin, J.E, Rajala, S.A., and J.P. Lavelle, eds., 2008, Stylus Publishing, Sterling, VA
10 ASQ Quality, Glossary – Q, Retrieved from http://asq.org/glossary/q.html
11 ASQ Continuous Improvement, Retrieved from http://asq.org/learn-about-quality/continuous-
improvement/overview/overview.html
12 Quality management systems-Requirements, ISO 9001-2015 Standard, Retrieved from
https://www.iso.org/obp/ui/#iso:std:iso:9001:ed-5:v1:en
13 Embedded assessment: quality control vs. quality assurance. 2009. Presentation at Teaching Learning Center
Faculty Development Series, South Dakota State University.
14 Deming’s 14 Points on Total Quality Management, Retrieved from http://asq.org/learn-about-quality/total-
quality-management/overview/deming-points.html
15 Jensen, P.A., and J.K. Robinson, “Deming’s Quality Principles Applied to a Large Lecture Course,” Journal of
Engineering Education, 1995, 84(1):1-6
16 ASQ Sampling, Retrieved from http://asq.org/learn-about-quality/sampling/overview/overview.html
17 ASQ Total Quality Costs, Retrieved from http://asq.org/learn-about-quality/cost-of-
quality/overview/overview.html
18 Flaig, J.J., "The Lights are on But Nobody is Home," Retrieved from
http://d577289.u36.websitesource.net/articles/Flaig_StopLight.htm
19 Anand, G., P.T. Ward, M.V. Tatikonda, and D.A. Schilling, “Dynamic capabilities through continuous
improvement infrastructure,” Journal of Operations Management, 2009, 27:444-461
20 Parmley, K. & D.K. Apple, “Assessing Program Assessment Systems,” In S. Beyerlein, C. Holmes & D. Apple
(Eds.), Program Assessment Handbook, Pacific Crest. 2010, pg 71-74, Retrieved from
http://www.pcrest2.com/institute_resources/PAI/PAI2010_020910.pdf
21 Rogers, G. “When is Enough Enough?” ABET Community Matters Newsletter, 2007, Retrieved from
http://drjj.uitm.edu.my/DRJJ/OBE FSG Dec07/OBEJan2010/DrJJ-Assessment Tips-ABET-GloriaRogers.pdf
22 National Academy of Engineering, Developing Metrics for Assessing Engineering Instruction: What Gets
Measured is What Gets Improved, Report from the Steering Committee for Evaluating Instructional Scholarship
in Engineering, 2009, Retrieved from http://www.nap.edu/catalog/12636.html
23 Brookhart, S. M. “The Art and Science of Classroom Assessment: The Missing Part of Pedagogy,” ASHE-
ERIC Higher Education Report (Vol. 27, No.1), 1999, George Washington University, Graduate School of
Education and Human Development, Washington, DC. Retrieved from
http://files.eric.ed.gov/fulltext/ED432937.pdf
24 Simon, M. & Forgette-Giroux, R. (2001). A rubric for scoring postsecondary academic skills, Practical
Assessment, Research & Evaluation, 7(18). Retrieved from http://pareonline.net/getvn.asp?v=7&n=18
25 Spurlin, J.E, S.A. Rajala, and J.P. Lavelle, “Assessing Student Learning: Ensuring Undergraduate Students are
Learning What We Want Them to Learn,” In Designing Better Engineering Education Through Assessment, Ed.
J.E. Spurlin, S.A. Rajala, and J.P. Lavelle, 2008, Stylus Publishing, Sterling, VA, pg. 23-38.
26 SDSU COM Department Continuous Improvement Process, 2012, Internal Document